Binance Square
Traddewave
23 Publications

Traddewave

5 Suivis
20 Abonnés
28 J’aime
Publications
·
--
Voir la traduction
$BTC BTCUSDT | 15M Technical AnalysisMarket Structure : Bullish Timeframe: 15 Minutes Current Price: 64,595 USDT Bitcoin remains in a short-term bullish structure after breaking above the recent consolidation range. The sequence of higher highs and higher lows confirms that buyers are still in control. However, price is now approaching a local resistance zone where profit-taking or a temporary pullback could occur before the next directional move. Key Resistance Levels 64,610 – 64,640 Immediate resistance and recent swing high. 64,820 – 64,850 →Next upside liquidity zone. 65,000 → Major psychological resistance. Key Support Levels 64,400 – 64,420 → Previous breakout area, likely to act as first support. 64,250 – 64,280 → Strong intraday demand zone. 64,000 → Major psychological support. Liquidity Analysis Buy-side liquidity is resting above the recent highs around 64,610, making it a potential target if bullish momentum continues. On the downside, liquidity is concentrated around 64,400 and 64,250, where buyers may attempt to defend the trend. Pivot Levels Pivot Resistance: 64,610 Pivot Zone: 64,420 Pivot Support: 64,250 Market Outlook As long as price remains above 64,400, the bullish structure remains intact. A sustained move above 64,610 could trigger another leg higher toward 64,850 and potentially 65,000 If price fails to hold above 64,400, a healthy intraday correction toward 64,250 or 64,000 becomes increasingly likely before buyers attempt another recovery. Trading Scenario Bullish Scenario *Watch for a pullback into the 64,400–64,450 support zone followed by bullish price action confirmation. Alternatively, monitor for a confirmed breakout and successful retest above 64,610 before considering continuation opportunities. Bearish Scenario A rejection from 64,610 followed by a break below 64,400 may expose 64,250 and 64,000 as the next downside objectives. Conclusion The short-term trend continues to favor buyers, but price is currently testing a key resistance area. Rather than chasing momentum at resistance, it may be more prudent to wait for either a confirmed breakout above 64,610 or a pullback into support with confirmation. Patience around these key levels may offer more favorable risk-to-reward opportunities. This analysis is based solely on price action and chart structure and should not be considered financial advice.#BTC $BTC {spot}(BTCUSDT)

$BTC BTCUSDT | 15M Technical Analysis

Market Structure : Bullish
Timeframe: 15 Minutes
Current Price: 64,595 USDT
Bitcoin remains in a short-term bullish structure after breaking above the recent consolidation range. The sequence of higher highs and higher lows confirms that buyers are still in control. However, price is now approaching a local resistance zone where profit-taking or a temporary pullback could occur before the next directional move.
Key Resistance Levels
64,610 – 64,640 Immediate resistance and recent swing high.
64,820 – 64,850 →Next upside liquidity zone.
65,000 → Major psychological resistance.
Key Support Levels
64,400 – 64,420 → Previous breakout area, likely to act as first support.
64,250 – 64,280 → Strong intraday demand zone.
64,000 → Major psychological support.
Liquidity Analysis
Buy-side liquidity is resting above the recent highs around 64,610, making it a potential target if bullish momentum continues. On the downside, liquidity is concentrated around 64,400 and 64,250, where buyers may attempt to defend the trend.
Pivot Levels
Pivot Resistance: 64,610
Pivot Zone: 64,420
Pivot Support: 64,250
Market Outlook
As long as price remains above 64,400, the bullish structure remains intact. A sustained move above 64,610 could trigger another leg higher toward 64,850 and potentially 65,000
If price fails to hold above 64,400, a healthy intraday correction toward 64,250 or 64,000 becomes increasingly likely before buyers attempt another recovery.
Trading Scenario
Bullish Scenario
*Watch for a pullback into the 64,400–64,450 support zone followed by bullish price action confirmation.
Alternatively, monitor for a confirmed breakout and successful retest above 64,610 before considering continuation opportunities.
Bearish Scenario
A rejection from 64,610 followed by a break below 64,400 may expose 64,250 and 64,000 as the next downside objectives.
Conclusion
The short-term trend continues to favor buyers, but price is currently testing a key resistance area. Rather than chasing momentum at resistance, it may be more prudent to wait for either a confirmed breakout above 64,610 or a pullback into support with confirmation. Patience around these key levels may offer more favorable risk-to-reward opportunities.
This analysis is based solely on price action and chart structure and should not be considered financial advice.#BTC $BTC
Voir la traduction
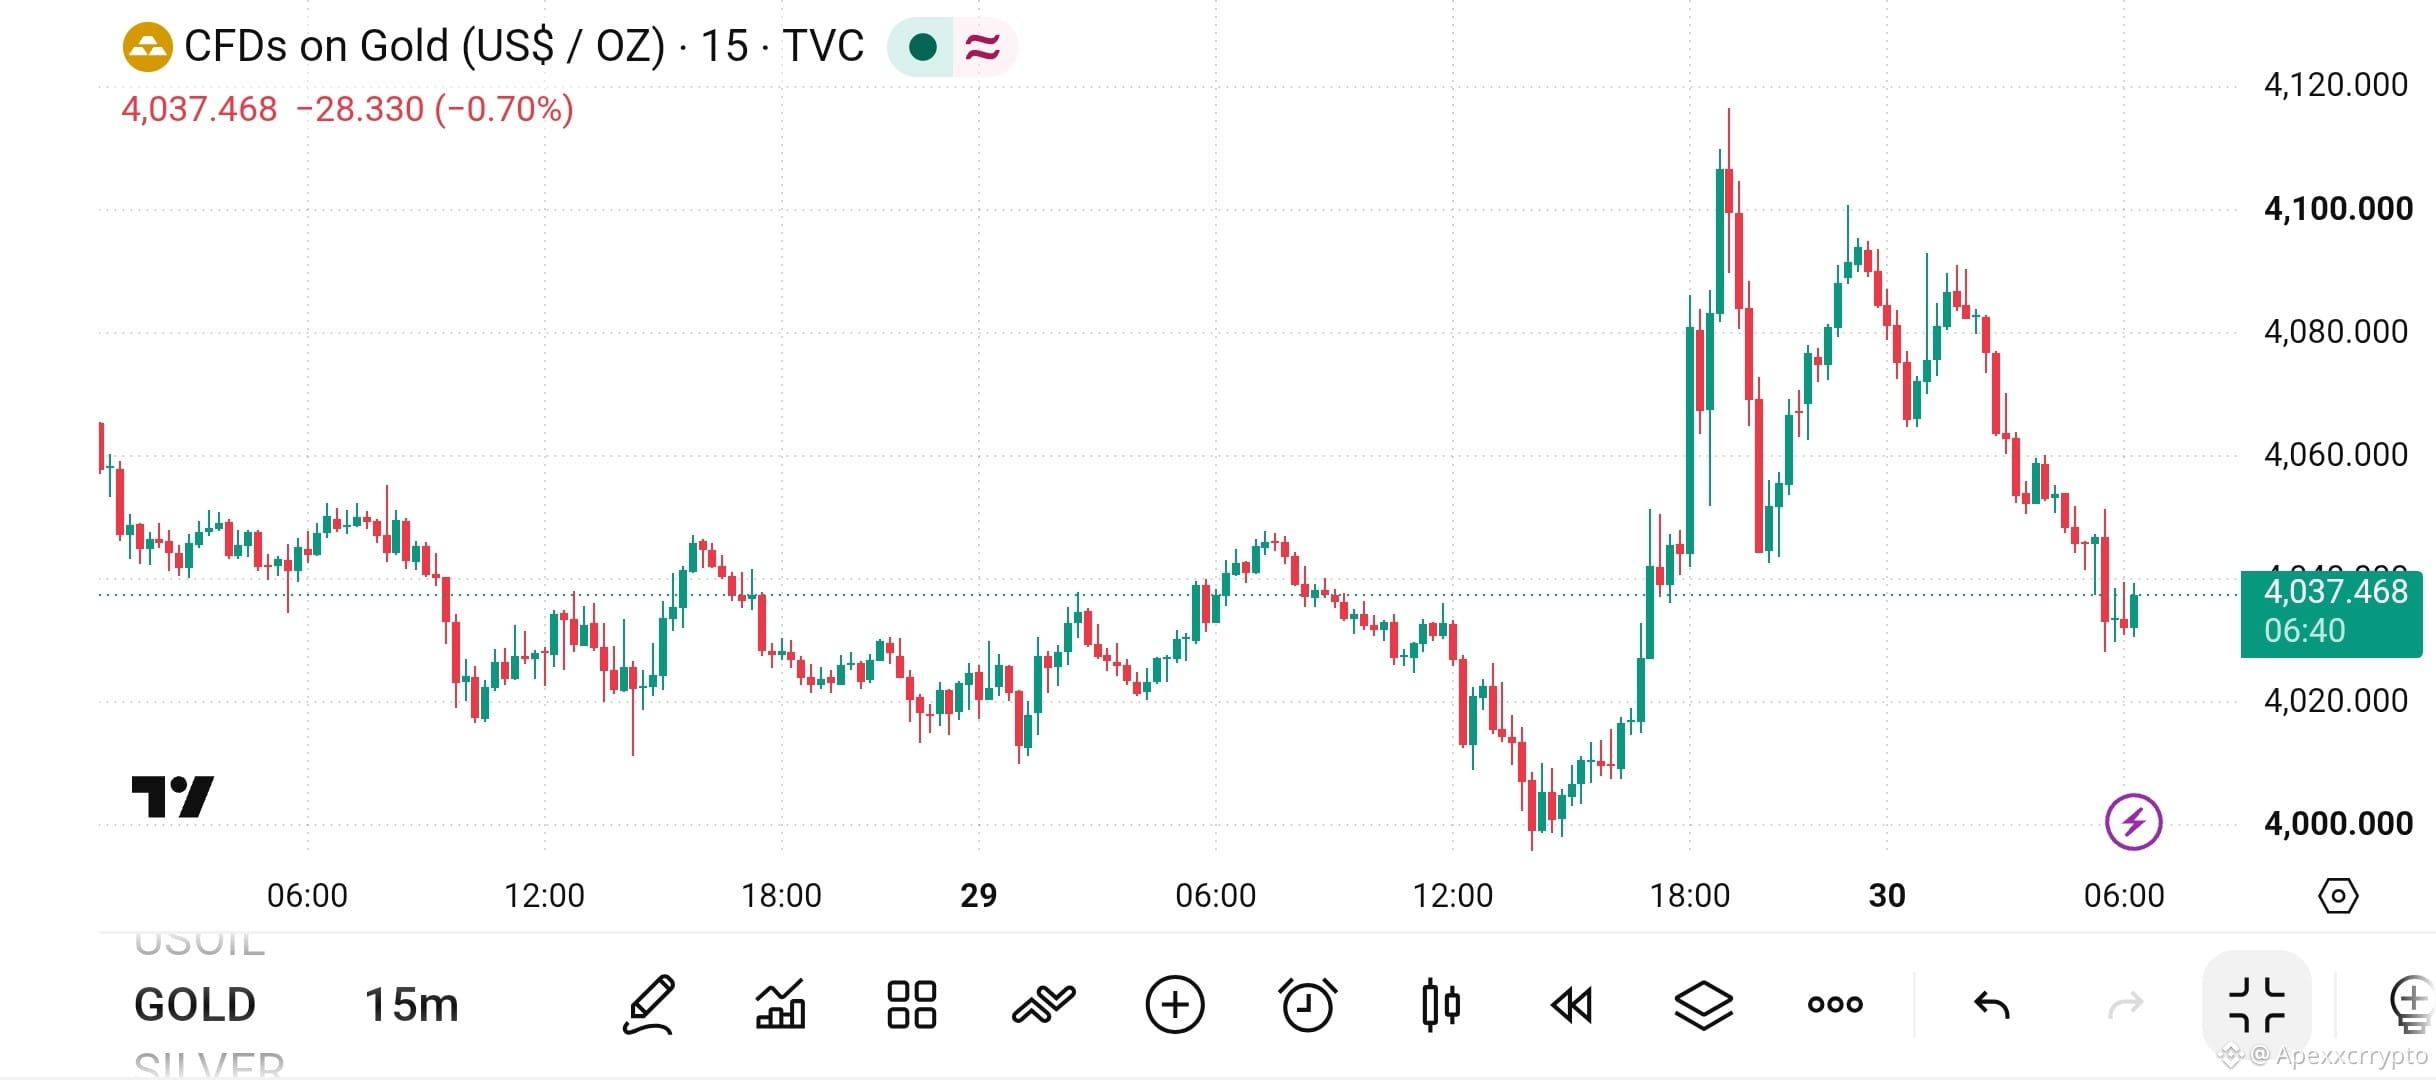
XAUUSD (Gold) | 15M Technical Analysis Gold remains under short-term bearish pressure after rejecting from the recent swing high. The market structure is currently showing a sequence of lower highs and lower lows, indicating that sellers maintain the short-term advantage. At the moment, price is trading near an important intraday support zone. The next move will likely depend on whether buyers can defend this area or sellers manage to break below it. Key Liquidity Zones Buy-Side Liquidity (BSL): 4080–4092 4105–4115 (Recent swing high) Sell-Side Liquidity (SSL): 4030–4025 4000 (Psychological level) Key Resistance 4048–4055 4078–4085 4105–4115 Key Support 4030–4025 4000–3995 3980 Bearish Scenario If price retests the 4048–4055 resistance zone and prints a bearish rejection, sellers may look for a continuation toward: Target 1: 4030 Target 2: 4000 Bullish Scenario If buyers reclaim 4055 with a strong candle close and sustained momentum, the next upside objectives could be: Target 1: 4078 Target 2: 4105 Market Outlook The current support area is a key decision zone. A confirmed breakdown below support would strengthen the bearish outlook, while a successful reclaim above resistance could shift short-term momentum back in favor of buyers. Always wait for confirmation before entering a trade and manage risk according to your trading plan. This analysis is for educational purposes only and should not be considered financial advice. #XAUUSD #Gold #TechnicalAnalysis #PriceAction #Trading #Forex #SupportAndResistance #Liquidity #TradingView #Marketstructure
XAUUSD (Gold) | 15M Technical Analysis

Gold remains under short-term bearish pressure after rejecting from the recent swing high. The market structure is currently showing a sequence of lower highs and lower lows, indicating that sellers maintain the short-term advantage.

At the moment, price is trading near an important intraday support zone. The next move will likely depend on whether buyers can defend this area or sellers manage to break below it.

Key Liquidity Zones

Buy-Side Liquidity (BSL):

4080–4092

4105–4115 (Recent swing high)

Sell-Side Liquidity (SSL):

4030–4025

4000 (Psychological level)

Key Resistance

4048–4055

4078–4085

4105–4115

Key Support

4030–4025

4000–3995

3980

Bearish Scenario

If price retests the 4048–4055 resistance zone and prints a bearish rejection, sellers may look for a continuation toward:

Target 1: 4030

Target 2: 4000

Bullish Scenario

If buyers reclaim 4055 with a strong candle close and sustained momentum, the next upside objectives could be:

Target 1: 4078

Target 2: 4105

Market Outlook

The current support area is a key decision zone. A confirmed breakdown below support would strengthen the bearish outlook, while a successful reclaim above resistance could shift short-term momentum back in favor of buyers.

Always wait for confirmation before entering a trade and manage risk according to your trading plan.

This analysis is for educational purposes only and should not be considered financial advice.

#XAUUSD #Gold #TechnicalAnalysis #PriceAction #Trading #Forex #SupportAndResistance #Liquidity #TradingView #Marketstructure
J'ai effectué un trade P2P, l'argent est arrivé sur mon compte Easypaisa, mon compte a été bloqué par débit. Depuis 2 mois, j'essaie, mais il n'a toujours pas été déverrouillé. Si vous avez des suggestions.
RX OnChain
·
--
🚨 Alerte de Scam P2P 🚨

J'ai été victime d'une arnaque il y a 3 mois, il m'a fallu 3 mois pour récupérer mon compte Easypaisa.

J'ai vendu 200 $ $USDT sur Binance p2p par Easypaisa. L'acheteur m'a envoyé le montant en PKR sur mon Easypaisa que j'ai immédiatement envoyé à ma Meezan Bank, et j'ai libéré le USDT.

Après 2 ou 3 jours, lorsque j'ai essayé d'utiliser mon compte Easypaisa, il était verrouillé en raison d'une transaction frauduleuse qui était exactement le paiement p2p, je pensais que mon argent à Meezan Bank était en sécurité mais devinez quoi, la même transaction a été verrouillée à Meezan Bank et est toujours verrouillée jusqu'à aujourd'hui.

L'acheteur a utilisé un compte volé pour m'envoyer le paiement, comme ce n'était pas son propre compte, il m'a envoyé le cnic du compte de l'expéditeur ce qui m'a réellement aidé à récupérer le compte Easypaisa, mais cela a pris environ 2 mois plus 20-30 appels à la ligne d'assistance d'Easypaisa, 3 appels avec des superviseurs et plus de 10 e-mails. Maintenant, je lutte avec Meezan Bank pour débloquer le paiement.

#ScamAwareness #SCAMalerts J'avais rejoint un canal Telegram nommé Tyler Trades, et voici le lien vers ce canal : https://t.me/+bUBtOTEe_39lNzZl Il a fait un post disant que le prix de l'ETH est plus élevé sur l'échange CyanideCoin par rapport à d'autres échanges. Par cupidité, sans faire de recherches, j'ai transféré mon ETH vers cet échange. Il a dit que je réaliserais un profit de 10 %. J'ai envoyé 0.1832 ETH à cette adresse. Maintenant, je ne peux pas retirer ou transférer mon montant de cet échange. Par conséquent, ma demande à tout le monde est d'être prudent face à de tels escrocs et à de tels liens.
#ScamAwareness #SCAMalerts
J'avais rejoint un canal Telegram nommé Tyler Trades, et voici le lien vers ce canal : https://t.me/+bUBtOTEe_39lNzZl
Il a fait un post disant que le prix de l'ETH est plus élevé sur l'échange CyanideCoin par rapport à d'autres échanges. Par cupidité, sans faire de recherches, j'ai transféré mon ETH vers cet échange.
Il a dit que je réaliserais un profit de 10 %. J'ai envoyé 0.1832 ETH à cette adresse.

Maintenant, je ne peux pas retirer ou transférer mon montant de cet échange.
Par conséquent, ma demande à tout le monde est d'être prudent face à de tels escrocs et à de tels liens.
Donnez vos pensées
Donnez vos pensées
Traddewave
·
--
$MAGIC La magie peut toucher 0.25 Pensées S'il vous plaît
Yes
55%
No
45%
31 Votes • Vote fermé
$MAGIC Peut Toucher Magique 0.25
YES
100%
NO
0%
1 Votes • Vote fermé
le taux de financement est élevé
Markhor363
·
--
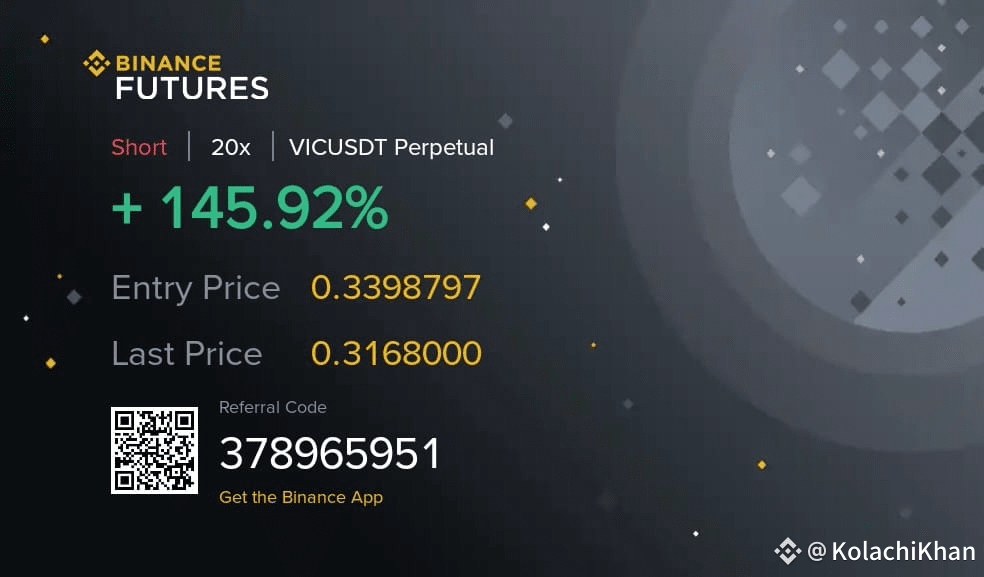
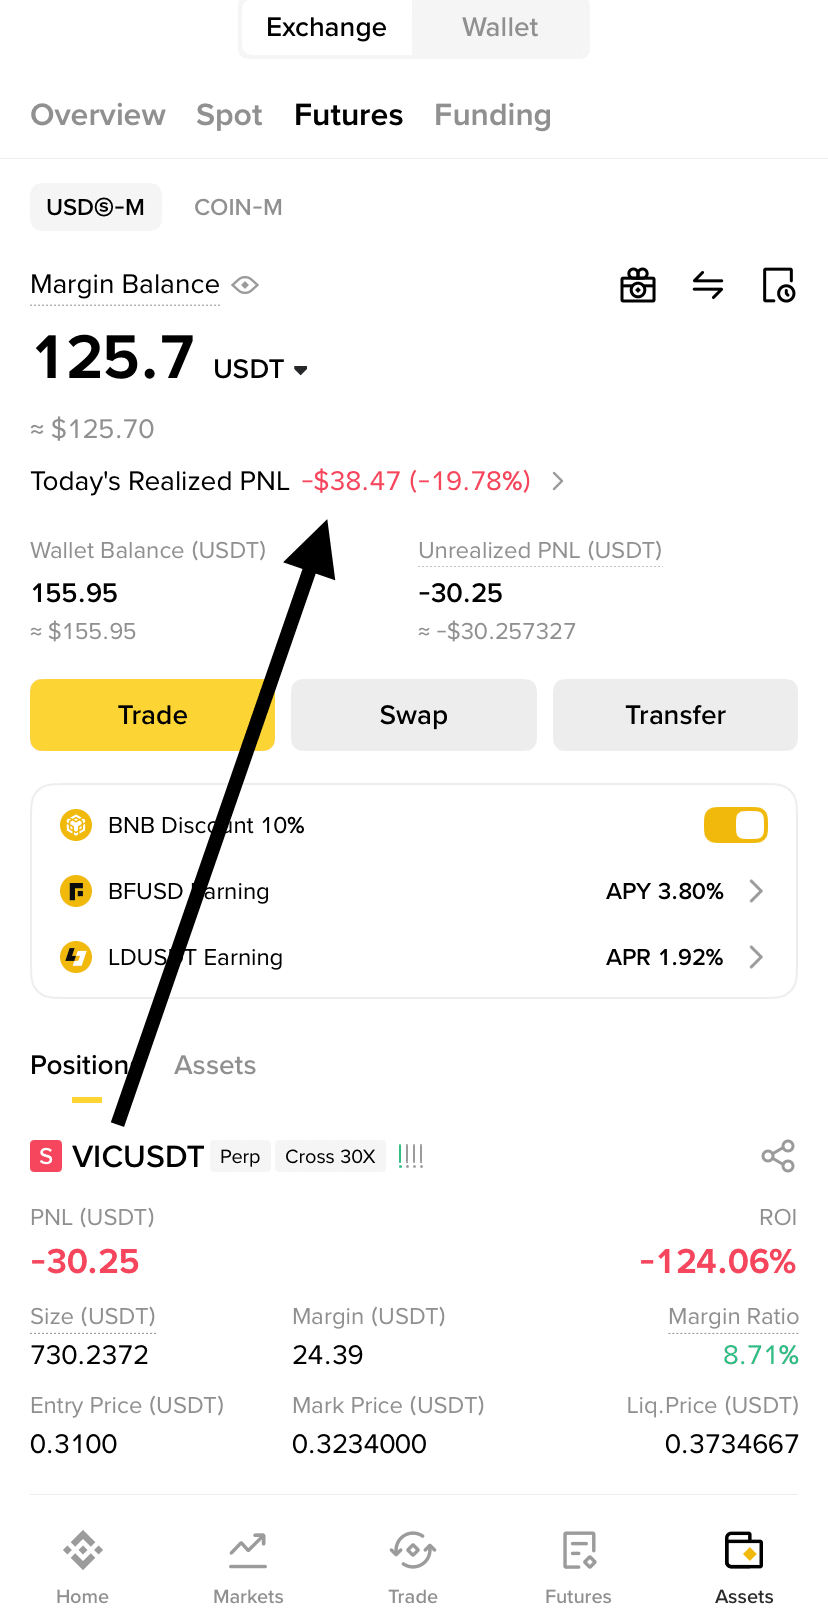
Quelqu'un peut-il me dire pourquoi VIC a réduit les frais de financement ? C'est trop
·
--
Baissier
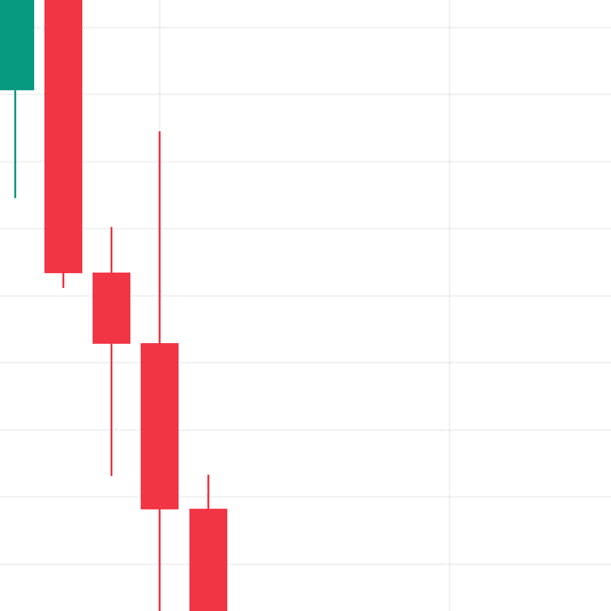
$VIC Je te l'avais dit court
$VIC Allez Dumpppppp
$VIC Raccourcir cela Gagner du profit
·
--
Haussier
Objectif atteint pour la journée #lpt $LPT
Objectif atteint pour la journée
#lpt $LPT
Connectez-vous pour découvrir plus de contenu
Rejoignez la communauté mondiale des adeptes de cryptomonnaies sur Binance Square
⚡️ Suviez les dernières informations importantes sur les cryptomonnaies.
💬 Jugé digne de confiance par la plus grande plateforme d’échange de cryptomonnaies au monde.
👍 Découvrez les connaissances que partagent les créateurs vérifiés.
Adresse e-mail/Nº de téléphone
Plan du site
Préférences de cookies
CGU de la plateforme