

Satoshi_Nakamoto_0078
8 Publications

Satoshi_Nakamoto_0078
Signaler
Bloquer l’utilisateur
Ouvert au trading
Trade occasionnellement
2.7 an(s)
0 Suivis
0 Abonnés
1 J’aime
Publications
Portefeuille
Article
Voir la traduction
IOTA/USDT — The Quiet Accumulation Is No Longer Quiet. 👀⚡IOTA/USDT — The Quiet Accumulation Is No Longer Quiet. 👀⚡
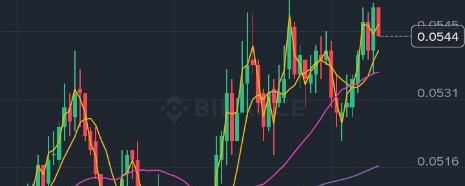
IOTA is showing a very interesting 15-minute structure: after falling to the $0.0491 area, price made a sharp recovery and pushed back toward the $0.0556 session high. At the moment shown in the chart, IOTA is around $0.0544, up 8.58% over 24 hours, with 24-hour volume of roughly 135.42M IOTA. The technical structure is notable because price is holding above MA(7) at $0.0541, MA(25) at $0.0536, and MA(99) at $0.0517 — meaning the short-, medium-, and longer-term averages shown on this timeframe are all sitting below price.
What makes the chart more interesting is the sequence: deep pullback → strong reversal → volume expansion → recovery above the moving averages → repeated tests of the upper range. The $0.0556 area is currently the clearest nearby resistance visible on the chart, while the $0.0541–$0.0536 zone becomes an important reference area if momentum starts cooling. A deeper move toward the $0.0517 region would represent a much larger loss of short-term momentum.
This move also appears consistent with broader technical momentum rather than a single obvious IOTA-specific news catalyst. A current CoinMarketCap analysis similarly attributes recent IOTA strength mainly to technical momentum, increased volume and broader altcoin rotation. �
CoinMarketCap
But here is the part many people miss: a strong green candle does not automatically mean a new trend has been confirmed. The real story is whether price can continue holding the higher structure after the initial surge. If volume fades while price repeatedly fails around the recent high, that can indicate that momentum is losing strength. On the other hand, continued higher highs and higher lows would show that buyers are maintaining control of the short-term structure.
IOTA itself has also undergone substantial technical development in 2026, including the Starfish consensus work and other protocol improvements reported by the IOTA Foundation. �
IOTA Blog
So the chart is not simply “IOTA is up 8.58%.” The more interesting observation is this: IOTA went from a $0.0491 intraday low to a $0.0556 high, while reclaiming multiple moving-average levels and maintaining elevated activity. Now the market is testing whether that recovery can develop into a sustained structure — or whether the recent surge eventually turns into a pullback.
IOTA/USDT — The Quiet Accumulation Is No Longer Quiet. 👀⚡
IOTA/USDT — The Quiet Accumulation Is No Longer Quiet. 👀⚡
IOTA is showing a very interesting 15-minute structure: after falling to the $0.0491 area, price made a sharp recovery and pushed back toward the $0.0556 session high. At the moment shown in the chart, IOTA is around $0.0544, up 8.58% over 24 hours, with 24-hour volume of roughly 135.42M IOTA. The technical structure is notable because price is holding above MA(7) at $0.0541, MA(25) at $0.0536, and MA(99) at $0.0517 — meaning the short-, medium-, and longer-term averages shown on this timeframe are all sitting below price.
What makes the chart more interesting is the sequence: deep pullback → strong reversal → volume expansion → recovery above the moving averages → repeated tests of the upper range. The $0.0556 area is currently the clearest nearby resistance visible on the chart, while the $0.0541–$0.0536 zone becomes an important reference area if momentum starts cooling. A deeper move toward the $0.0517 region would represent a much larger loss of short-term momentum.
This move also appears consistent with broader technical momentum rather than a single obvious IOTA-specific news catalyst. A current CoinMarketCap analysis similarly attributes recent IOTA strength mainly to technical momentum, increased volume and broader altcoin rotation. �
CoinMarketCap
But here is the part many people miss: a strong green candle does not automatically mean a new trend has been confirmed. The real story is whether price can continue holding the higher structure after the initial surge. If volume fades while price repeatedly fails around the recent high, that can indicate that momentum is losing strength. On the other hand, continued higher highs and higher lows would show that buyers are maintaining control of the short-term structure.
IOTA itself has also undergone substantial technical development in 2026, including the Starfish consensus work and other protocol improvements reported by the IOTA Foundation. �
IOTA Blog
So the chart is not simply “IOTA is up 8.58%.” The more interesting observation is this: IOTA went from a $0.0491 intraday low to a $0.0556 high, while reclaiming multiple moving-average levels and maintaining elevated activity. Now the market is testing whether that recovery can develop into a sustained structure — or whether the recent surge eventually turns into a pullback.
IOTA is showing a very interesting 15-minute structure: after falling to the $0.0491 area, price made a sharp recovery and pushed back toward the $0.0556 session high. At the moment shown in the chart, IOTA is around $0.0544, up 8.58% over 24 hours, with 24-hour volume of roughly 135.42M IOTA. The technical structure is notable because price is holding above MA(7) at $0.0541, MA(25) at $0.0536, and MA(99) at $0.0517 — meaning the short-, medium-, and longer-term averages shown on this timeframe are all sitting below price.
What makes the chart more interesting is the sequence: deep pullback → strong reversal → volume expansion → recovery above the moving averages → repeated tests of the upper range. The $0.0556 area is currently the clearest nearby resistance visible on the chart, while the $0.0541–$0.0536 zone becomes an important reference area if momentum starts cooling. A deeper move toward the $0.0517 region would represent a much larger loss of short-term momentum.
This move also appears consistent with broader technical momentum rather than a single obvious IOTA-specific news catalyst. A current CoinMarketCap analysis similarly attributes recent IOTA strength mainly to technical momentum, increased volume and broader altcoin rotation. �
CoinMarketCap
But here is the part many people miss: a strong green candle does not automatically mean a new trend has been confirmed. The real story is whether price can continue holding the higher structure after the initial surge. If volume fades while price repeatedly fails around the recent high, that can indicate that momentum is losing strength. On the other hand, continued higher highs and higher lows would show that buyers are maintaining control of the short-term structure.
IOTA itself has also undergone substantial technical development in 2026, including the Starfish consensus work and other protocol improvements reported by the IOTA Foundation. �
IOTA Blog
So the chart is not simply “IOTA is up 8.58%.” The more interesting observation is this: IOTA went from a $0.0491 intraday low to a $0.0556 high, while reclaiming multiple moving-average levels and maintaining elevated activity. Now the market is testing whether that recovery can develop into a sustained structure — or whether the recent surge eventually turns into a pullback.
76
·
--
Haussier
ALGO/USDT — Une percée soudaine, mais est-ce le début ? 👀⚡
Algorand est soudainement devenu l’une des monnaies qui attire l’attention. ALGO s’échange autour de 0,1369 $ sur le graphique en 15 minutes, affichant un fort mouvement de plus de 16 % sur 24 heures. La partie intéressante n’est pas seulement la hausse en pourcentage — c’est la rapidité avec laquelle ALGO est passé d’une zone de consolidation calme près de 0,115–0,120 $ à une nette cassure en direction de 0,1376.
Le graphique montre une expansion claire à la fois des prix et de l’activité de trading. ALGO évolue également au-dessus de la MM(7) à 0,1337, de la MM(25) à 0,1318 et de la MM(99) à 0,1221, ce qui reflète un fort élan à court terme. Des analyses récentes du marché ont aussi décrit ce mouvement comme étant principalement alimenté par l’élan technique et le regain d’intérêt du marché, plutôt que par une annonce ALGO clairement identifiée. �
CoinMarketCap
Mais voici la question intéressante : un mouvement comme celui-ci peut-il continuer, ou le prix pourrait-il soudainement revenir en arrière ?
Après une hausse rapide, une correction est toujours possible. La zone des 0,1376 $ correspond au plus haut actuel du graphique, tandis que les zones des 0,1337 et 0,1318 $ sont des repères techniques importants si l’élan faiblit. Un repli en soi ne signifierait pas automatiquement que le projet est une arnaque — et rien, dans ce graphique seul, ne prouve que l’ALGO est frauduleux. Qualifier un mouvement de « pump and dump » nécessiterait des preuves plus solides qu’une hausse soudaine des prix.
Ce qui rend l’ALGO intéressant en ce moment, c’est la transformation du graphique : longue consolidation → percée → expansion des volumes → test du plus haut récent.
La prochaine phase est celle où l’histoire devient plus intéressante. Le marché maintiendra-t-il l’élan, ou les traders vont-ils commencer à prendre des profits et pousser le prix à revenir dans la précédente fourchette ?
Une chose est sûre : ALGO est passé d’une situation relativement calme à celle d’une monnaie à surveiller de très près. 👀 #ALGO #ALGO_USDT #ALGO/USDT #Binance
ALGO/USDT — Une percée soudaine, mais est-ce le début ? 👀⚡
Algorand est soudainement devenu l’une des monnaies qui attire l’attention. ALGO s’échange autour de 0,1369 $ sur le graphique en 15 minutes, affichant un fort mouvement de plus de 16 % sur 24 heures. La partie intéressante n’est pas seulement la hausse en pourcentage — c’est la rapidité avec laquelle ALGO est passé d’une zone de consolidation calme près de 0,115–0,120 $ à une nette cassure en direction de 0,1376.
Le graphique montre une expansion claire à la fois des prix et de l’activité de trading. ALGO évolue également au-dessus de la MM(7) à 0,1337, de la MM(25) à 0,1318 et de la MM(99) à 0,1221, ce qui reflète un fort élan à court terme. Des analyses récentes du marché ont aussi décrit ce mouvement comme étant principalement alimenté par l’élan technique et le regain d’intérêt du marché, plutôt que par une annonce ALGO clairement identifiée. �
CoinMarketCap
Mais voici la question intéressante : un mouvement comme celui-ci peut-il continuer, ou le prix pourrait-il soudainement revenir en arrière ?
Après une hausse rapide, une correction est toujours possible. La zone des 0,1376 $ correspond au plus haut actuel du graphique, tandis que les zones des 0,1337 et 0,1318 $ sont des repères techniques importants si l’élan faiblit. Un repli en soi ne signifierait pas automatiquement que le projet est une arnaque — et rien, dans ce graphique seul, ne prouve que l’ALGO est frauduleux. Qualifier un mouvement de « pump and dump » nécessiterait des preuves plus solides qu’une hausse soudaine des prix.
Ce qui rend l’ALGO intéressant en ce moment, c’est la transformation du graphique : longue consolidation → percée → expansion des volumes → test du plus haut récent.
La prochaine phase est celle où l’histoire devient plus intéressante. Le marché maintiendra-t-il l’élan, ou les traders vont-ils commencer à prendre des profits et pousser le prix à revenir dans la précédente fourchette ?
Une chose est sûre : ALGO est passé d’une situation relativement calme à celle d’une monnaie à surveiller de très près. 👀 #ALGO #ALGO_USDT #ALGO/USDT #Binance
Algorand est soudainement devenu l’une des monnaies qui attire l’attention. ALGO s’échange autour de 0,1369 $ sur le graphique en 15 minutes, affichant un fort mouvement de plus de 16 % sur 24 heures. La partie intéressante n’est pas seulement la hausse en pourcentage — c’est la rapidité avec laquelle ALGO est passé d’une zone de consolidation calme près de 0,115–0,120 $ à une nette cassure en direction de 0,1376.
Le graphique montre une expansion claire à la fois des prix et de l’activité de trading. ALGO évolue également au-dessus de la MM(7) à 0,1337, de la MM(25) à 0,1318 et de la MM(99) à 0,1221, ce qui reflète un fort élan à court terme. Des analyses récentes du marché ont aussi décrit ce mouvement comme étant principalement alimenté par l’élan technique et le regain d’intérêt du marché, plutôt que par une annonce ALGO clairement identifiée. �
CoinMarketCap
Mais voici la question intéressante : un mouvement comme celui-ci peut-il continuer, ou le prix pourrait-il soudainement revenir en arrière ?
Après une hausse rapide, une correction est toujours possible. La zone des 0,1376 $ correspond au plus haut actuel du graphique, tandis que les zones des 0,1337 et 0,1318 $ sont des repères techniques importants si l’élan faiblit. Un repli en soi ne signifierait pas automatiquement que le projet est une arnaque — et rien, dans ce graphique seul, ne prouve que l’ALGO est frauduleux. Qualifier un mouvement de « pump and dump » nécessiterait des preuves plus solides qu’une hausse soudaine des prix.
Ce qui rend l’ALGO intéressant en ce moment, c’est la transformation du graphique : longue consolidation → percée → expansion des volumes → test du plus haut récent.
La prochaine phase est celle où l’histoire devient plus intéressante. Le marché maintiendra-t-il l’élan, ou les traders vont-ils commencer à prendre des profits et pousser le prix à revenir dans la précédente fourchette ?
Une chose est sûre : ALGO est passé d’une situation relativement calme à celle d’une monnaie à surveiller de très près. 👀 #ALGO #ALGO_USDT #ALGO/USDT #Binance
67
·
--
Haussier
Voir la traduction
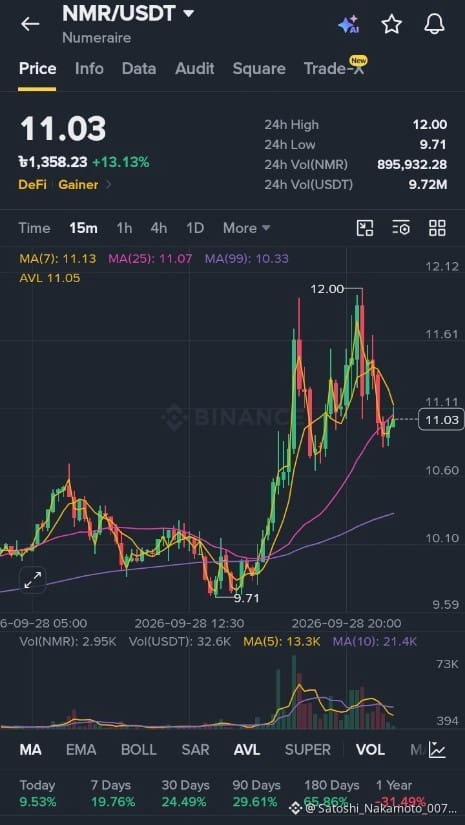
NMR is showing a surprisingly strong comeback on the 15-minute chart. The price is currently around $11.03, up approximately 13.13% over the last 24 hours, after moving from a 24-hour low of $9.71 to a high of $12.00.
What makes this move interesting is the speed of the recovery. From the $9.71 area, NMR pushed sharply higher, broke above the $10–$11 region, and reached the psychological $12 level before pulling back. Trading activity also expanded significantly during the move, showing that the rally came with a noticeable increase in market participation.
The technical structure is also worth watching. MA(99) is around $10.33, while MA(25) is around $11.07 and MA(7) is around $11.13. This means the current price is sitting close to the short-term moving averages after a major upward move. The $12.00 area now stands out as the recent high, while the $11.00–$10.60 zone becomes an important area to monitor if the momentum cools down.
The most surprising part? NMR spent much of the earlier session trading around the $10 area, then suddenly accelerated toward $12. That kind of transition—from quiet consolidation to explosive volatility—is exactly what makes this chart interesting to watch.
NMR is definitely back on the radar. Now the key question is not simply how high it can go, but whether the market can maintain the momentum and volume behind this move.#NMRBullish #NMR #NMR/USDT #Binance
NMR is showing a surprisingly strong comeback on the 15-minute chart. The price is currently around $11.03, up approximately 13.13% over the last 24 hours, after moving from a 24-hour low of $9.71 to a high of $12.00.
What makes this move interesting is the speed of the recovery. From the $9.71 area, NMR pushed sharply higher, broke above the $10–$11 region, and reached the psychological $12 level before pulling back. Trading activity also expanded significantly during the move, showing that the rally came with a noticeable increase in market participation.
The technical structure is also worth watching. MA(99) is around $10.33, while MA(25) is around $11.07 and MA(7) is around $11.13. This means the current price is sitting close to the short-term moving averages after a major upward move. The $12.00 area now stands out as the recent high, while the $11.00–$10.60 zone becomes an important area to monitor if the momentum cools down.
The most surprising part? NMR spent much of the earlier session trading around the $10 area, then suddenly accelerated toward $12. That kind of transition—from quiet consolidation to explosive volatility—is exactly what makes this chart interesting to watch.
NMR is definitely back on the radar. Now the key question is not simply how high it can go, but whether the market can maintain the momentum and volume behind this move.#NMRBullish #NMR #NMR/USDT #Binance
What makes this move interesting is the speed of the recovery. From the $9.71 area, NMR pushed sharply higher, broke above the $10–$11 region, and reached the psychological $12 level before pulling back. Trading activity also expanded significantly during the move, showing that the rally came with a noticeable increase in market participation.
The technical structure is also worth watching. MA(99) is around $10.33, while MA(25) is around $11.07 and MA(7) is around $11.13. This means the current price is sitting close to the short-term moving averages after a major upward move. The $12.00 area now stands out as the recent high, while the $11.00–$10.60 zone becomes an important area to monitor if the momentum cools down.
The most surprising part? NMR spent much of the earlier session trading around the $10 area, then suddenly accelerated toward $12. That kind of transition—from quiet consolidation to explosive volatility—is exactly what makes this chart interesting to watch.
NMR is definitely back on the radar. Now the key question is not simply how high it can go, but whether the market can maintain the momentum and volume behind this move.#NMRBullish #NMR #NMR/USDT #Binance
134
Voir la traduction
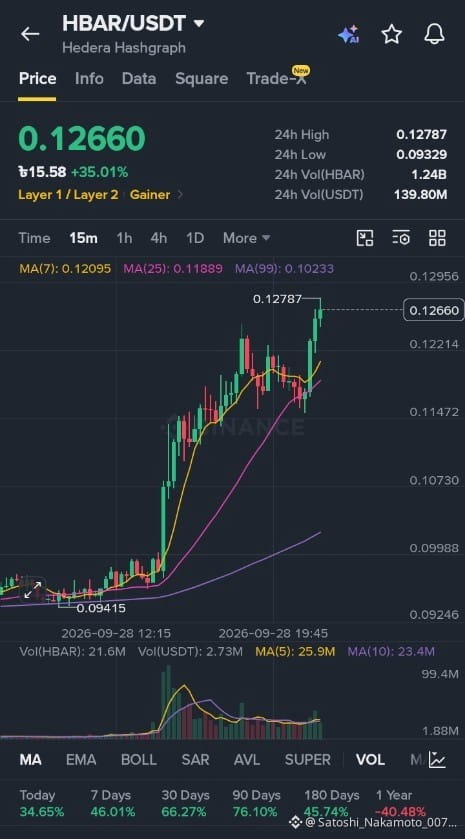
HBAR/USDT has entered a powerful momentum phase. On the 15-minute chart, HBAR is trading around 0.12660 USDT, up approximately 35.01% in 24 hours, while the market has pushed toward a fresh intraday high of 0.12787. The structure is clearly showing strong upward momentum, with price holding well above the MA(7) at 0.12095, MA(25) at 0.11889, and MA(99) at 0.10233. This strong alignment highlights the intensity of the current move. What makes this setup stand out is the combination of a major breakout, sustained price strength, and elevated trading volume. The 0.12787–0.12956 zone is now an important area to watch, while the 0.12214 and 0.11889 regions provide key chart references if momentum cools down. After such a rapid move, volatility can increase sharply, so the next candles and volume confirmation will be critical. This is no longer a quiet chart — HBAR has clearly awakened, and the market is now watching to see whether this momentum can sustain itself.#hbar #HBARUSD #HBARUSDT #HBAR/BTC #Binance
HBAR/USDT has entered a powerful momentum phase. On the 15-minute chart, HBAR is trading around 0.12660 USDT, up approximately 35.01% in 24 hours, while the market has pushed toward a fresh intraday high of 0.12787. The structure is clearly showing strong upward momentum, with price holding well above the MA(7) at 0.12095, MA(25) at 0.11889, and MA(99) at 0.10233. This strong alignment highlights the intensity of the current move. What makes this setup stand out is the combination of a major breakout, sustained price strength, and elevated trading volume. The 0.12787–0.12956 zone is now an important area to watch, while the 0.12214 and 0.11889 regions provide key chart references if momentum cools down. After such a rapid move, volatility can increase sharply, so the next candles and volume confirmation will be critical. This is no longer a quiet chart — HBAR has clearly awakened, and the market is now watching to see whether this momentum can sustain itself.#hbar #HBARUSD #HBARUSDT #HBAR/BTC #Binance
51
Voir la traduction
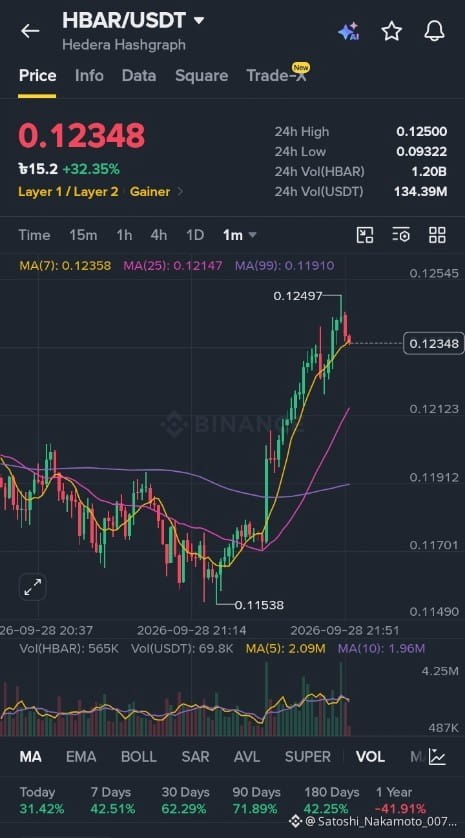
HBAR/USDT is showing a strong short-term bullish movement on the 1-minute chart. The current price is around 0.12348 USDT, with a 24-hour increase of 32.35%, showing strong buying momentum. The price recently reached a high of approximately 0.12497, but then pulled back slightly, which suggests some selling pressure near the 0.12500 resistance area. The moving averages are also positioned positively: MA(7) is 0.12358, MA(25) is 0.12147, and MA(99) is 0.11910. Since the current price is above all three moving averages, the short-term trend remains bullish. However, because this is only a 1-minute chart and the price has already moved up sharply, volatility and quick pullbacks are possible. The 0.121–0.122 area can be watched as a nearby support zone, while 0.12500 is an important resistance area. Overall, the chart shows strong upward momentum, but confirmation from higher timeframes and volume would be useful before making any trading decision.#HBARUSD #HBARPrice #HBARUSDT #hbar #Binance
HBAR/USDT is showing a strong short-term bullish movement on the 1-minute chart. The current price is around 0.12348 USDT, with a 24-hour increase of 32.35%, showing strong buying momentum. The price recently reached a high of approximately 0.12497, but then pulled back slightly, which suggests some selling pressure near the 0.12500 resistance area. The moving averages are also positioned positively: MA(7) is 0.12358, MA(25) is 0.12147, and MA(99) is 0.11910. Since the current price is above all three moving averages, the short-term trend remains bullish. However, because this is only a 1-minute chart and the price has already moved up sharply, volatility and quick pullbacks are possible. The 0.121–0.122 area can be watched as a nearby support zone, while 0.12500 is an important resistance area. Overall, the chart shows strong upward momentum, but confirmation from higher timeframes and volume would be useful before making any trading decision.#HBARUSD #HBARPrice #HBARUSDT #hbar #Binance
65
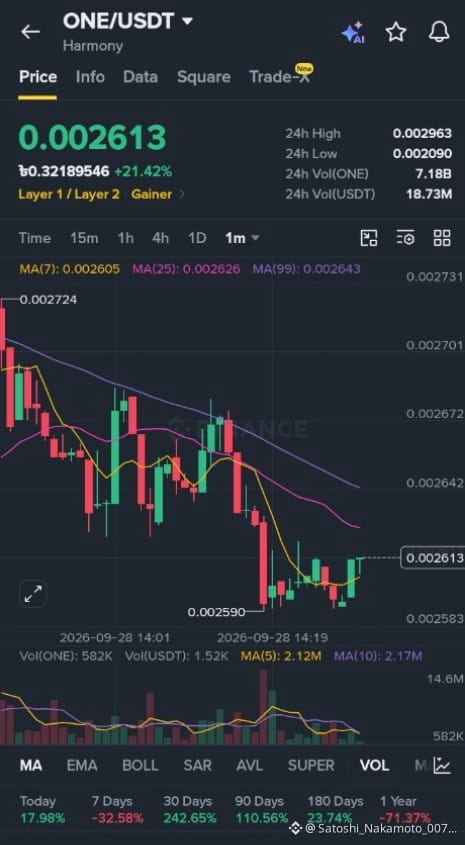
ONE a montré un fort rebond à court terme, le prix se situant actuellement autour de 0.002613 USDT.
La pièce a progressé d’environ 21,42 % au cours des dernières 24 heures, ce qui indique de solides achats récents.
Le prix est reparti depuis environ 0.002590, ce qui suggère un certain soutien à l’achat au plus bas récent.
Les dernières bougies montrent un léger mouvement à la hausse, indiquant que les acheteurs tentent de regagner un élan à court terme.
La tendance globale à court terme reste toutefois faible car le prix est en dessous de la MA(25) à 0.002626 et de la MA(99) à 0.002643.
Les moyennes mobiles pointent généralement vers le bas, ce qui indique que la tendance à court terme plus large demeure baissière.
ONE est en baisse d’environ 32,58 % sur 7 jours et d’environ 71,37 % sur 1 an, ce qui reflète une faiblesse antérieure significative.
Ce rebond actuel reste relativement faible par rapport à la baisse précédente, donc un retournement n’est pas encore confirmé.
Le prix pourrait rencontrer une résistance autour de 0.002626–0.002643, puis la zone de 0.002672.#Binance #ONE/USDT #BTC走势分析
ONE a montré un fort rebond à court terme, le prix se situant actuellement autour de 0.002613 USDT.
La pièce a progressé d’environ 21,42 % au cours des dernières 24 heures, ce qui indique de solides achats récents.
Le prix est reparti depuis environ 0.002590, ce qui suggère un certain soutien à l’achat au plus bas récent.
Les dernières bougies montrent un léger mouvement à la hausse, indiquant que les acheteurs tentent de regagner un élan à court terme.
La tendance globale à court terme reste toutefois faible car le prix est en dessous de la MA(25) à 0.002626 et de la MA(99) à 0.002643.
Les moyennes mobiles pointent généralement vers le bas, ce qui indique que la tendance à court terme plus large demeure baissière.
ONE est en baisse d’environ 32,58 % sur 7 jours et d’environ 71,37 % sur 1 an, ce qui reflète une faiblesse antérieure significative.
Ce rebond actuel reste relativement faible par rapport à la baisse précédente, donc un retournement n’est pas encore confirmé.
Le prix pourrait rencontrer une résistance autour de 0.002626–0.002643, puis la zone de 0.002672.#Binance #ONE/USDT #BTC走势分析
La pièce a progressé d’environ 21,42 % au cours des dernières 24 heures, ce qui indique de solides achats récents.
Le prix est reparti depuis environ 0.002590, ce qui suggère un certain soutien à l’achat au plus bas récent.
Les dernières bougies montrent un léger mouvement à la hausse, indiquant que les acheteurs tentent de regagner un élan à court terme.
La tendance globale à court terme reste toutefois faible car le prix est en dessous de la MA(25) à 0.002626 et de la MA(99) à 0.002643.
Les moyennes mobiles pointent généralement vers le bas, ce qui indique que la tendance à court terme plus large demeure baissière.
ONE est en baisse d’environ 32,58 % sur 7 jours et d’environ 71,37 % sur 1 an, ce qui reflète une faiblesse antérieure significative.
Ce rebond actuel reste relativement faible par rapport à la baisse précédente, donc un retournement n’est pas encore confirmé.
Le prix pourrait rencontrer une résistance autour de 0.002626–0.002643, puis la zone de 0.002672.#Binance #ONE/USDT #BTC走势分析
257
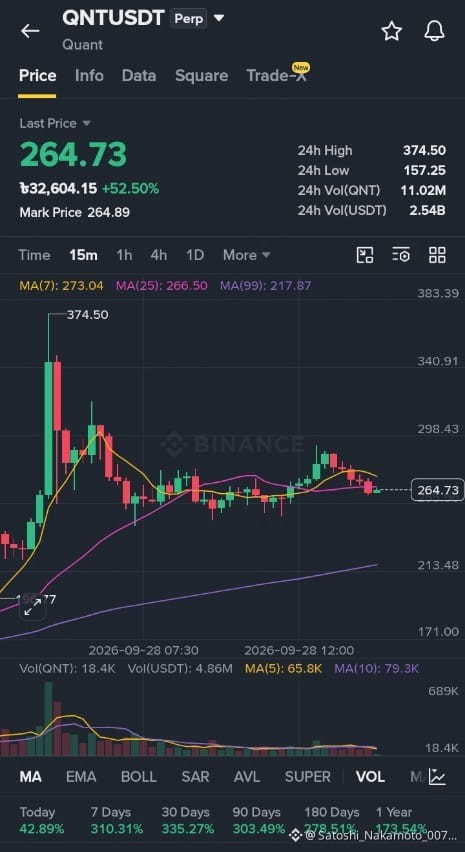
“Le graphique QNT/USDT montre une forte tendance haussière du prix au cours des dernières 24 heures. Le prix actuel est d’environ 264,73 USDT, tandis que le plus haut sur 24 heures est de 374,50 USDT et le plus bas de 157,25 USDT. Le graphique indique que QNT a connu une volatilité importante, avec une forte hausse suivie d’une période de consolidation. La moyenne mobile sur 7 périodes est d’environ 273,04, tandis que la moyenne mobile sur 25 périodes est d’environ 266,50. Le volume de trading a fortement augmenté pendant le principal mouvement de prix, puis a progressivement diminué. Dans l’ensemble, le graphique montre un élan récent solide, mais aussi une forte volatilité.”#TrendingTopic #UNI📈
“Le graphique QNT/USDT montre une forte tendance haussière du prix au cours des dernières 24 heures. Le prix actuel est d’environ 264,73 USDT, tandis que le plus haut sur 24 heures est de 374,50 USDT et le plus bas de 157,25 USDT. Le graphique indique que QNT a connu une volatilité importante, avec une forte hausse suivie d’une période de consolidation. La moyenne mobile sur 7 périodes est d’environ 273,04, tandis que la moyenne mobile sur 25 périodes est d’environ 266,50. Le volume de trading a fortement augmenté pendant le principal mouvement de prix, puis a progressivement diminué. Dans l’ensemble, le graphique montre un élan récent solide, mais aussi une forte volatilité.”#TrendingTopic #UNI📈
74
Voir la traduction
“Every trade is a lesson. Stay patient, manage risk, and never let emotions control your decisions. Small losses are part of the journey; what matters is learning, improving, and staying disciplined.”
“Every trade is a lesson. Stay patient, manage risk, and never let emotions control your decisions. Small losses are part of the journey; what matters is learning, improving, and staying disciplined.”
1
163
Connectez-vous pour découvrir plus de contenu
Rejoignez la communauté mondiale des adeptes de cryptomonnaies sur Binance Square
⚡️ Suviez les dernières informations importantes sur les cryptomonnaies.
💬 Jugé digne de confiance par la plus grande plateforme d’échange de cryptomonnaies au monde.
👍 Découvrez les connaissances que partagent les créateurs vérifiés.
Adresse e-mail/Nº de téléphone
Sujets d’actualité
UKFCAWinsCourtOrderToRecover851400Pounds
13,179 vues
567 mentions
🚨 LA RÉGLEMENTATION CRYPTO ENTRE DANS UNE NOUVELLE PHASE : ILS n’écrivent pas seulement des règles — ils récupèrent l’argent.
La FCA britannique a obtenu une nouvelle saisie d’actifs appuyée par la justice, renforçant une volonté plus large d’application des règles contre les activités financières et liées aux crypto-actifs non autorisées.
Et regardez ce qui se passe en même temps :
🇬🇧 FCA → application des règles + recouvrement d’actifs
🇺🇸 SEC → règles plus claires pour les crypto-actifs fonctionnels
🇺🇸 Fed → supervision formelle des stablecoins dans le cadre du GENIUS Act
Cet ensemble compte.
Les régulateurs ne débattent plus de savoir si les crypto font partie du système financier.
Ils décident de plus en plus qui a accès, quelles règles il doit suivre et ce qui se passe lorsque ces règles sont enfreintes.
Le prochain cycle crypto ne sera peut-être pas « réglementation contre innovation ».
Il pourrait s’agir de crypto réglementées vs tout le monde incapable de respecter le standard. 👀
$COIN $CRCL $BTC
#ukfcawinscourtordertorecover851400pounds #ChainlinkLaunchesCCIP2WithEnterpriseVerification #GoldFallsTo$4144 #QNTFallsOver40%FromMorningHigh #USDTAdds845900HoldersInPast7Days
KimHotbae
·2 mentions J’aime
·4.1k vues
ChainlinkLaunchesCCIP2WithEnterpriseVerification
27,054 vues
774 mentions
GoldFallsTo$4144
10,491 vues
130 mentions