
RCipheR
25 Publications

RCipheR
Signaler
Bloquer l’utilisateur
加密貨幣及幣安市場分析 | 技術洞察與價格趨勢 | 僅供教 請注意:本帳號分享的所有內容僅供教育、資訊和分析之用。我並非財務顧問,此處發布的任何內容均不應被視為財務建議。在做出任何交易決策之前,請務必自行研究(DYOR)並妥善管理風險。歡迎加入我的行列,一同追蹤圖表形態、分析市場變化,探索不斷發展的 Web3 世界!
15 Suivis
5 Abonnés
30 J’aime
Publications
·
--
Article
Voir la traduction
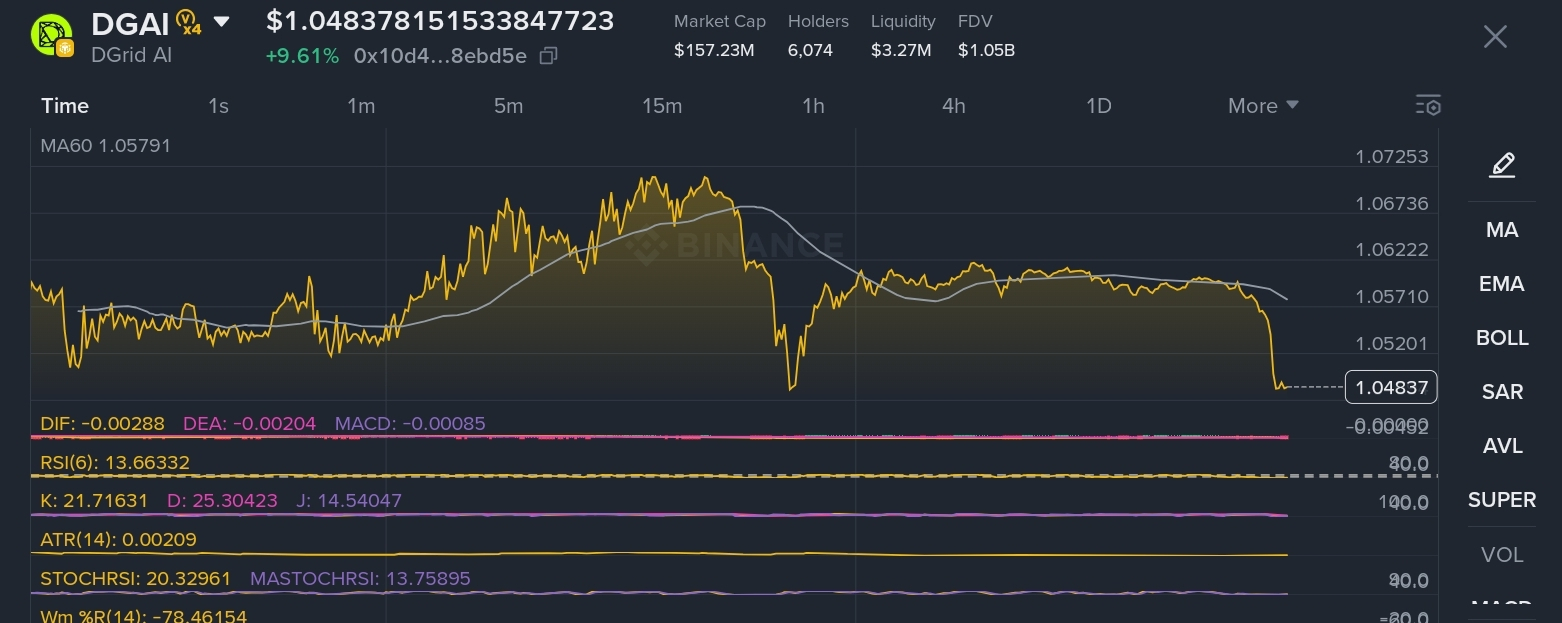
Unpacking DGrid AI (DGAI): Over $1B Volume Meets Severe Supply Concentration RiskDGrid AI is commanding serious attention across the cryptocurrency market, securing over $1 billion in trading volume within a 24-hour window. Operating as a decentralized smart network that provides a unified gateway to over 200 artificial intelligence models, the fundamental utility of the DGAI token spans payments, staking, incentives, and governance. Despite this robust utility and a sharp 10.54% price increase pushing the asset into the $1.04 to $1.05 range, a deeper structural analysis reveals severe volatility risks driven by liquidity fragmentation and supply concentration.
Liquidity Turnover and Mathematical Dilution Analysis
The financial architecture of DGAI presents extreme mathematical divergences between on-chain liquidity and trading velocity. The token has a circulating supply of 150 million against a maximum total supply of 1 billion. At a current price of roughly $1.048, the circulating market capitalization stands at $157.15 million, while the Fully Diluted Valuation (FDV) reaches $1.05 billion.
We can mathematically quantify the structural market pressure through a Volume-to-Liquidity Turnover calculation. The 24-hour trading volume is $1.07 billion. Total on-chain DEX liquidity is recorded at a mere $3.27 million. By dividing the $1.07 billion volume by the $3.27 million on-chain liquidity, we find a Liquidity Turnover Ratio of approximately 327.2x per day. This means the total available decentralized liquidity pool is turned over more than 300 times every 24 hours. A ratio of this magnitude strongly implies heavy high-frequency algorithmic arbitrage between centralized exchanges and decentralized platforms, rather than organic retail accumulation.
Furthermore, the Supply Dilution Overhang calculation highlights a significant long-term headwind. Subtracting the 150 million circulating tokens from the 1 billion total supply leaves 850 million locked or uncirculated tokens. Multiplying these 850 million uncirculated tokens by the current $1.048 price yields an inflationary overhang of $890.8 million. As these tokens vest and enter circulation, the current liquidity depth of just 2.08% (calculated as $3.27 million liquidity divided by the $157.15 million market cap) will not be sufficient to absorb new selling pressure without massive slippage.
The 98.21% Concentration Risk
The most critical threat to current DGAI holders is token distribution. Analytical insights reveal that the top 10 holding addresses control 98.21% of the total token supply.
This concentration fundamentally alters the market mechanics for the 6,072 individual chain holders. Subtracting the 98.21% whale dominance from the total supply leaves only 1.79% as the true retail float. In absolute terms, this represents just 17.9 million tokens distributed among the public. If any of the top 10 entities decide to liquidate even a fraction of their holdings, the resulting sell orders would instantaneously overwhelm the $3.27 million in available on-chain liquidity, triggering a severe downside cascade.
Adding to this pressure, Smart Money addresses are actively realizing profits. On-chain intelligence indicates these entities have secured $468.06 in localized profit, executing sells at an average price of $0.9266 after accumulating at an average buy price of $0.9126. This strategic exit behavior by sophisticated capital often serves as a leading indicator of exhaustion in short-term bullish momentum.
Technical Oscillators and Price Action
From a technical perspective on the 15-minute timeframe, DGAI is exhibiting signs of extreme localized stress. Following a rejection near the 24-hour high of $1.13519, the price compressed down toward $1.047.
The Bollinger Bands (20, 2) confirm this bearish displacement. The asset traded below the middle band baseline of $1.06102 and actively tested the lower band boundary near $1.04986. During this sharp intraday sell-off, the 15-minute 6-period Relative Strength Index (RSI) plunged to an exceptionally oversold reading of 1.80872. While an RSI this low typically signals an imminent mean-reversion bounce, the underlying momentum remains weak. The 5-minute MACD histogram shows a continuous decreasing trend, falling from positive territory to near zero, validating the fading buying pressure.
DGrid AI boasts excellent foundational technology and has successfully captured immense speculative volume. However, traders must navigate this asset with strict risk management. The mathematical reality of a 327x liquidity turnover ratio, combined with a 98.21% supply concentration among the top 10 wallets, creates an environment where abrupt, could lead to sharp volatility.
#Binance #ALPHA #TrendingTopic
Unpacking DGrid AI (DGAI): Over $1B Volume Meets Severe Supply Concentration Risk
DGrid AI is commanding serious attention across the cryptocurrency market, securing over $1 billion in trading volume within a 24-hour window. Operating as a decentralized smart network that provides a unified gateway to over 200 artificial intelligence models, the fundamental utility of the DGAI token spans payments, staking, incentives, and governance. Despite this robust utility and a sharp 10.54% price increase pushing the asset into the $1 .04 to $1 .05 range, a deeper structural analysis reveals severe volatility risks driven by liquidity fragmentation and supply concentration.
Liquidity Turnover and Mathematical Dilution Analysis
The financial architecture of DGAI presents extreme mathematical divergences between on-chain liquidity and trading velocity. The token has a circulating supply of 150 million against a maximum total supply of 1 billion. At a current price of roughly $1 .048, the circulating market capitalization stands at $157.15 million, while the Fully Diluted Valuation (FDV) reaches $1 .05 billion.
We can mathematically quantify the structural market pressure through a Volume-to-Liquidity Turnover calculation. The 24-hour trading volume is $1 .07 billion. Total on-chain DEX liquidity is recorded at a mere $3.27 million. By dividing the $1 .07 billion volume by the $3.27 million on-chain liquidity, we find a Liquidity Turnover Ratio of approximately 327.2x per day. This means the total available decentralized liquidity pool is turned over more than 300 times every 24 hours. A ratio of this magnitude strongly implies heavy high-frequency algorithmic arbitrage between centralized exchanges and decentralized platforms, rather than organic retail accumulation.
Furthermore, the Supply Dilution Overhang calculation highlights a significant long-term headwind. Subtracting the 150 million circulating tokens from the 1 billion total supply leaves 850 million locked or uncirculated tokens. Multiplying these 850 million uncirculated tokens by the current $1 .048 price yields an inflationary overhang of $890.8 million. As these tokens vest and enter circulation, the current liquidity depth of just 2.08% (calculated as $3.27 million liquidity divided by the $157.15 million market cap) will not be sufficient to absorb new selling pressure without massive slippage.
The 98.21% Concentration Risk
The most critical threat to current DGAI holders is token distribution. Analytical insights reveal that the top 10 holding addresses control 98.21% of the total token supply.
This concentration fundamentally alters the market mechanics for the 6,072 individual chain holders. Subtracting the 98.21% whale dominance from the total supply leaves only 1.79% as the true retail float. In absolute terms, this represents just 17.9 million tokens distributed among the public. If any of the top 10 entities decide to liquidate even a fraction of their holdings, the resulting sell orders would instantaneously overwhelm the $3.27 million in available on-chain liquidity, triggering a severe downside cascade.
Adding to this pressure, Smart Money addresses are actively realizing profits. On-chain intelligence indicates these entities have secured $468.06 in localized profit, executing sells at an average price of $0.9266 after accumulating at an average buy price of $0.9126. This strategic exit behavior by sophisticated capital often serves as a leading indicator of exhaustion in short-term bullish momentum.
Technical Oscillators and Price Action
From a technical perspective on the 15-minute timeframe, DGAI is exhibiting signs of extreme localized stress. Following a rejection near the 24-hour high of $1 .13519, the price compressed down toward $1 .047.
The Bollinger Bands (20, 2) confirm this bearish displacement. The asset traded below the middle band baseline of $1 .06102 and actively tested the lower band boundary near $1 .04986. During this sharp intraday sell-off, the 15-minute 6-period Relative Strength Index (RSI) plunged to an exceptionally oversold reading of 1.80872. While an RSI this low typically signals an imminent mean-reversion bounce, the underlying momentum remains weak. The 5-minute MACD histogram shows a continuous decreasing trend, falling from positive territory to near zero, validating the fading buying pressure.
DGrid AI boasts excellent foundational technology and has successfully captured immense speculative volume. However, traders must navigate this asset with strict risk management. The mathematical reality of a 327x liquidity turnover ratio, combined with a 98.21% supply concentration among the top 10 wallets, creates an environment where abrupt, could lead to sharp volatility.
#Binance #ALPHA #TrendingTopic
Liquidity Turnover and Mathematical Dilution Analysis
The financial architecture of DGAI presents extreme mathematical divergences between on-chain liquidity and trading velocity. The token has a circulating supply of 150 million against a maximum total supply of 1 billion. At a current price of roughly $1 .048, the circulating market capitalization stands at $157.15 million, while the Fully Diluted Valuation (FDV) reaches $1 .05 billion.
We can mathematically quantify the structural market pressure through a Volume-to-Liquidity Turnover calculation. The 24-hour trading volume is $1 .07 billion. Total on-chain DEX liquidity is recorded at a mere $3.27 million. By dividing the $1 .07 billion volume by the $3.27 million on-chain liquidity, we find a Liquidity Turnover Ratio of approximately 327.2x per day. This means the total available decentralized liquidity pool is turned over more than 300 times every 24 hours. A ratio of this magnitude strongly implies heavy high-frequency algorithmic arbitrage between centralized exchanges and decentralized platforms, rather than organic retail accumulation.
Furthermore, the Supply Dilution Overhang calculation highlights a significant long-term headwind. Subtracting the 150 million circulating tokens from the 1 billion total supply leaves 850 million locked or uncirculated tokens. Multiplying these 850 million uncirculated tokens by the current $1 .048 price yields an inflationary overhang of $890.8 million. As these tokens vest and enter circulation, the current liquidity depth of just 2.08% (calculated as $3.27 million liquidity divided by the $157.15 million market cap) will not be sufficient to absorb new selling pressure without massive slippage.
The 98.21% Concentration Risk
The most critical threat to current DGAI holders is token distribution. Analytical insights reveal that the top 10 holding addresses control 98.21% of the total token supply.
This concentration fundamentally alters the market mechanics for the 6,072 individual chain holders. Subtracting the 98.21% whale dominance from the total supply leaves only 1.79% as the true retail float. In absolute terms, this represents just 17.9 million tokens distributed among the public. If any of the top 10 entities decide to liquidate even a fraction of their holdings, the resulting sell orders would instantaneously overwhelm the $3.27 million in available on-chain liquidity, triggering a severe downside cascade.
Adding to this pressure, Smart Money addresses are actively realizing profits. On-chain intelligence indicates these entities have secured $468.06 in localized profit, executing sells at an average price of $0.9266 after accumulating at an average buy price of $0.9126. This strategic exit behavior by sophisticated capital often serves as a leading indicator of exhaustion in short-term bullish momentum.
Technical Oscillators and Price Action
From a technical perspective on the 15-minute timeframe, DGAI is exhibiting signs of extreme localized stress. Following a rejection near the 24-hour high of $1 .13519, the price compressed down toward $1 .047.
The Bollinger Bands (20, 2) confirm this bearish displacement. The asset traded below the middle band baseline of $1 .06102 and actively tested the lower band boundary near $1 .04986. During this sharp intraday sell-off, the 15-minute 6-period Relative Strength Index (RSI) plunged to an exceptionally oversold reading of 1.80872. While an RSI this low typically signals an imminent mean-reversion bounce, the underlying momentum remains weak. The 5-minute MACD histogram shows a continuous decreasing trend, falling from positive territory to near zero, validating the fading buying pressure.
DGrid AI boasts excellent foundational technology and has successfully captured immense speculative volume. However, traders must navigate this asset with strict risk management. The mathematical reality of a 327x liquidity turnover ratio, combined with a 98.21% supply concentration among the top 10 wallets, creates an environment where abrupt, could lead to sharp volatility.
#Binance #ALPHA #TrendingTopic
161
·
--
Article
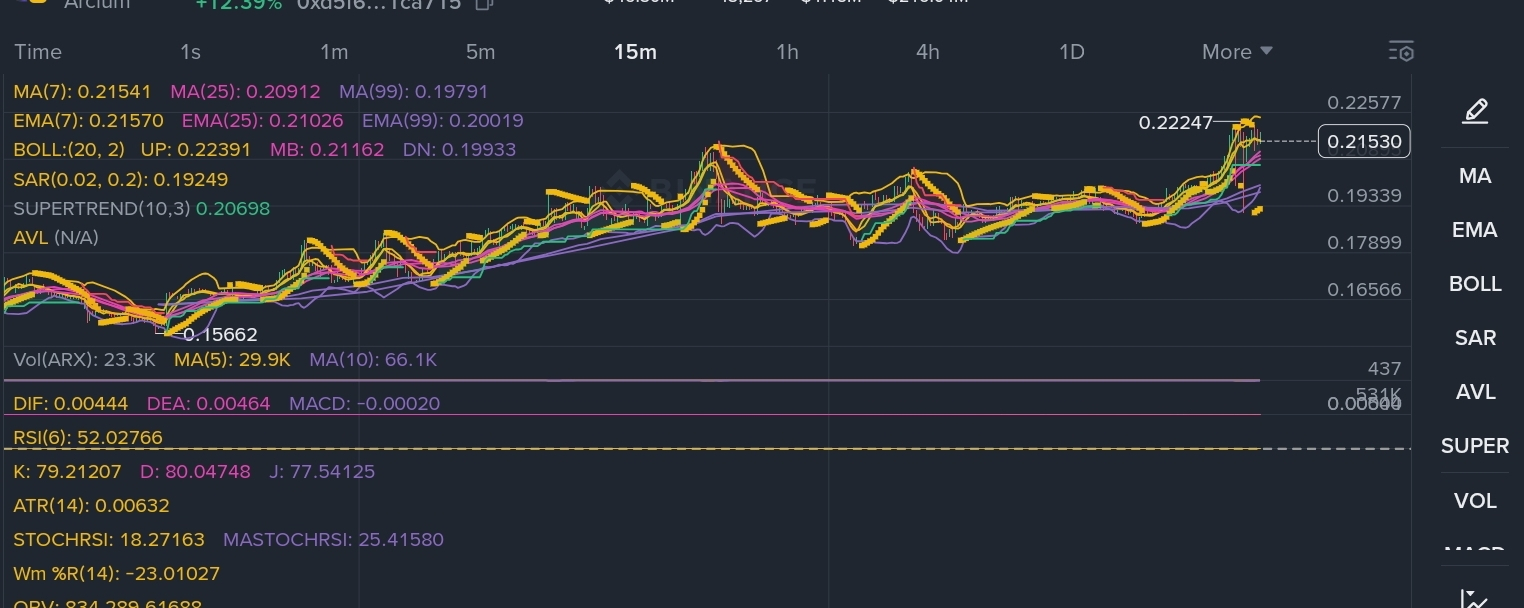
Analyse approfondie du marché : envol parabolique d’Arcium ARX et perspectives techniquesArcium est récemment apparu comme un acteur particulièrement performant sur le marché des actifs numériques, en combinant un récit puissant en informatique confidentielle avec une dynamique de prix exceptionnelle. En tant que réseau d’informatique confidentielle parallélisé construit sur Solana, Arcium utilise la Multi-Party Computation pour traiter des données chiffrées pour des applications Web3 et d’intelligence artificielle. Le token natif ARX réagit manifestement à cet environnement fondamental solide : il enregistre des hausses quotidiennes à deux chiffres et franchit plusieurs barrières psychologiques clés.
Analyse approfondie du marché : envol parabolique d’Arcium ARX et perspectives techniques
Arcium est récemment apparu comme un acteur particulièrement performant sur le marché des actifs numériques, en combinant un récit puissant en informatique confidentielle avec une dynamique de prix exceptionnelle. En tant que réseau d’informatique confidentielle parallélisé construit sur Solana, Arcium utilise la Multi-Party Computation pour traiter des données chiffrées pour des applications Web3 et d’intelligence artificielle. Le token natif ARX réagit manifestement à cet environnement fondamental solide : il enregistre des hausses quotidiennes à deux chiffres et franchit plusieurs barrières psychologiques clés.
1
309
·
--
Article
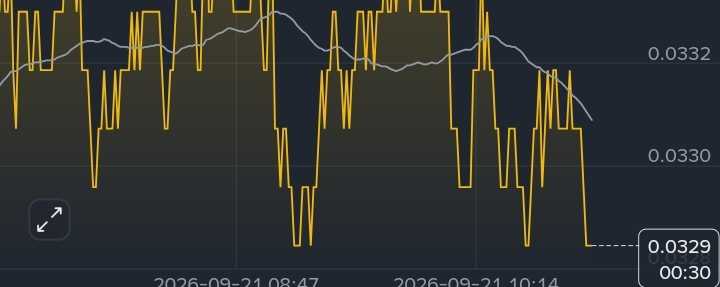
$BANK : Peut-il prendre de l’élan lors du prochain cycle de marché ?$BANK attire l’attention alors que les traders recherchent des tokens à plus petite capitalisation avec une forte implication de la communauté et un potentiel de mouvements tirés par la volatilité. Comme beaucoup d’altcoins émergents, son évolution des prix peut changer rapidement lorsque la liquidité, le sentiment et les conditions plus larges du marché évoluent.
Ce qui compte le plus pour $BANK
Liquidité et volume des échanges
Une tendance à la hausse du volume peut signaler une participation croissante du marché, tandis qu’une liquidité faible peut amplifier à la fois les rallyes et les baisses. De grands mouvements de prix ne sont pas toujours le signe d’une demande durable.
$BANK : Peut-il prendre de l’élan lors du prochain cycle de marché ?
$BANK attire l’attention alors que les traders recherchent des tokens à plus petite capitalisation avec une forte implication de la communauté et un potentiel de mouvements tirés par la volatilité. Comme beaucoup d’altcoins émergents, son évolution des prix peut changer rapidement lorsque la liquidité, le sentiment et les conditions plus larges du marché évoluent.
Ce qui compte le plus pour $BANK
Liquidité et volume des échanges
Une tendance à la hausse du volume peut signaler une participation croissante du marché, tandis qu’une liquidité faible peut amplifier à la fois les rallyes et les baisses. De grands mouvements de prix ne sont pas toujours le signe d’une demande durable.
Ce qui compte le plus pour $BANK
Liquidité et volume des échanges
Une tendance à la hausse du volume peut signaler une participation croissante du marché, tandis qu’une liquidité faible peut amplifier à la fois les rallyes et les baisses. De grands mouvements de prix ne sont pas toujours le signe d’une demande durable.
2
371
·
--
Article
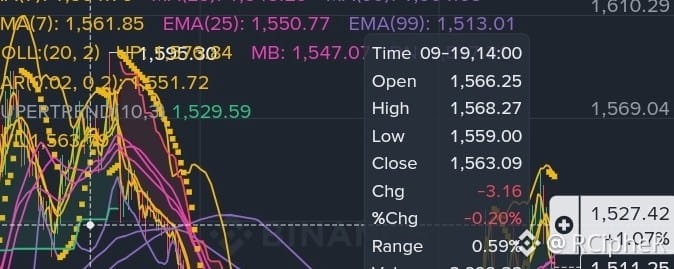
$ZEC Deep Dive : pourquoi Zcash explose +2 900 % YTD et ce que révèlent les dynamiques du carnet d’ordresZcash ($ZEC) est devenu l’un des actifs les plus en tendance sur l’ensemble du marché des cryptomonnaies, affichant un rallye macro de plus de +2 913 % au cours de la dernière année et se négociant près de 1 510 $ USDT.
Voici une analyse complète expliquant pourquoi $ZEC est en tendance, avec un examen de la structure technique multi-timeframes, des données sur les dérivés, et comment interpréter l’évolution rapide des dynamiques du carnet d’ordres.
Pourquoi $ZEC est-il une pièce en tendance ?
L’important franchissement structurel de Zcash et l’élan durable sont portés par quatre catalyseurs clés :
$ZEC Deep Dive : pourquoi Zcash explose +2 900 % YTD et ce que révèlent les dynamiques du carnet d’ordres
Zcash ($ZEC) est devenu l’un des actifs les plus en tendance sur l’ensemble du marché des cryptomonnaies, affichant un rallye macro de plus de +2 913 % au cours de la dernière année et se négociant près de 1 510 $ USDT.
Voici une analyse complète expliquant pourquoi $ZEC est en tendance, avec un examen de la structure technique multi-timeframes, des données sur les dérivés, et comment interpréter l’évolution rapide des dynamiques du carnet d’ordres.
Pourquoi $ZEC est-il une pièce en tendance ?
L’important franchissement structurel de Zcash et l’élan durable sont portés par quatre catalyseurs clés :
Voici une analyse complète expliquant pourquoi $ZEC est en tendance, avec un examen de la structure technique multi-timeframes, des données sur les dérivés, et comment interpréter l’évolution rapide des dynamiques du carnet d’ordres.
Pourquoi $ZEC est-il une pièce en tendance ?
L’important franchissement structurel de Zcash et l’élan durable sont portés par quatre catalyseurs clés :
1
184
·
--
Article
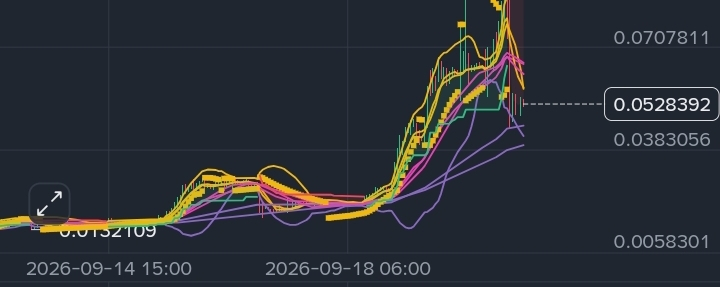
AKE recule de 15 % : s’agit-il d’un repli sain ou du début d’une correction plus profonde ?L’Akita Inu ( $AKE ) a subi une forte baisse intraday de 15 %, ramenant le prix dans la fourchette de 0,052 $. Après un démarrage macro spectaculaire à partir de sa phase d’accumulation estivale, la prise de profits est désormais au premier plan.
Vérification technique de la réalité
Consolidation ou rupture ? Sur le graphique 1 heure, l’AKE lutte pour établir un plancher local. Il se négocie actuellement sous ses moyennes mobiles exponentielles (MME 7 & 25) immédiates, ce qui signale une résistance horizontale stricte à proximité de 0,057 $ à 0,062 $.
Divergence du RSI : alors que le RSI sur 1 heure se situe lourdement à 34,7 (frôlant le niveau de survente), le graphique en 15 minutes s’aplatit autour de 53. Cela indique que la forte pression vendeuse observée plus tôt dans la journée commence à s’essouffler en se transformant en consolidation latérale.
AKE recule de 15 % : s’agit-il d’un repli sain ou du début d’une correction plus profonde ?
L’Akita Inu ( $AKE ) a subi une forte baisse intraday de 15 %, ramenant le prix dans la fourchette de 0,052 $. Après un démarrage macro spectaculaire à partir de sa phase d’accumulation estivale, la prise de profits est désormais au premier plan.
Vérification technique de la réalité
Consolidation ou rupture ? Sur le graphique 1 heure, l’AKE lutte pour établir un plancher local. Il se négocie actuellement sous ses moyennes mobiles exponentielles (MME 7 & 25) immédiates, ce qui signale une résistance horizontale stricte à proximité de 0,057 $ à 0,062 $.
Divergence du RSI : alors que le RSI sur 1 heure se situe lourdement à 34,7 (frôlant le niveau de survente), le graphique en 15 minutes s’aplatit autour de 53. Cela indique que la forte pression vendeuse observée plus tôt dans la journée commence à s’essouffler en se transformant en consolidation latérale.
Vérification technique de la réalité
Consolidation ou rupture ? Sur le graphique 1 heure, l’AKE lutte pour établir un plancher local. Il se négocie actuellement sous ses moyennes mobiles exponentielles (MME 7 & 25) immédiates, ce qui signale une résistance horizontale stricte à proximité de 0,057 $ à 0,062 $.
Divergence du RSI : alors que le RSI sur 1 heure se situe lourdement à 34,7 (frôlant le niveau de survente), le graphique en 15 minutes s’aplatit autour de 53. Cela indique que la forte pression vendeuse observée plus tôt dans la journée commence à s’essouffler en se transformant en consolidation latérale.
2
349
·
--
Article
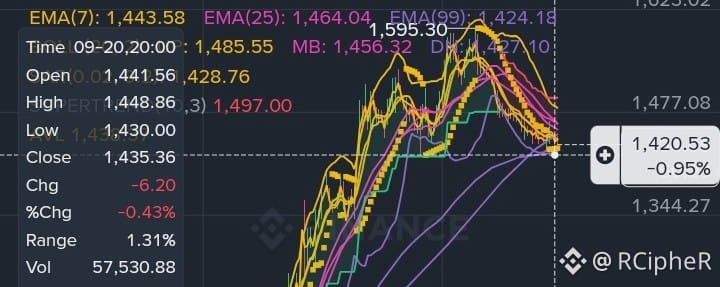
Alerte ZEC : Survente ou chute libre ? Le Zcash teste un support critique à 1 428 $Le Zcash ($ZEC) a subi une forte correction aujourd’hui, perdant près de 6% et glissant vers le seuil des 1 434 $. Alors que les baissiers dominent la séance, les traders observent de près si le plus bas sur 24 heures peut tenir.
Aperçu Technique (Trames de 1H & 15M)
Emprise baissière : le prix reste fermement sous les MA7 et MA25, confirmant une tendance baissière agressive. L’action en « cascade » le long de la bande de Bollinger inférieure indique un fort volume de vente.
Signaux de survente : le RSI sur le graphique 1 heure évolue près de 31, à deux doigts de la zone de survente. Cela suggère généralement qu’un épuisement des ventes pourrait être proche, pouvant déclencher un rebond de soulagement vers 1 445 - 1 450 $.
Alerte ZEC : Survente ou chute libre ? Le Zcash teste un support critique à 1 428 $
Le Zcash ($ZEC) a subi une forte correction aujourd’hui, perdant près de 6% et glissant vers le seuil des 1 434 $. Alors que les baissiers dominent la séance, les traders observent de près si le plus bas sur 24 heures peut tenir.
Aperçu Technique (Trames de 1H & 15M)
Emprise baissière : le prix reste fermement sous les MA7 et MA25, confirmant une tendance baissière agressive. L’action en « cascade » le long de la bande de Bollinger inférieure indique un fort volume de vente.
Signaux de survente : le RSI sur le graphique 1 heure évolue près de 31, à deux doigts de la zone de survente. Cela suggère généralement qu’un épuisement des ventes pourrait être proche, pouvant déclencher un rebond de soulagement vers 1 445 - 1 450 $.
Aperçu Technique (Trames de 1H & 15M)
Emprise baissière : le prix reste fermement sous les MA7 et MA25, confirmant une tendance baissière agressive. L’action en « cascade » le long de la bande de Bollinger inférieure indique un fort volume de vente.
Signaux de survente : le RSI sur le graphique 1 heure évolue près de 31, à deux doigts de la zone de survente. Cela suggère généralement qu’un épuisement des ventes pourrait être proche, pouvant déclencher un rebond de soulagement vers 1 445 - 1 450 $.
1
289
·
--
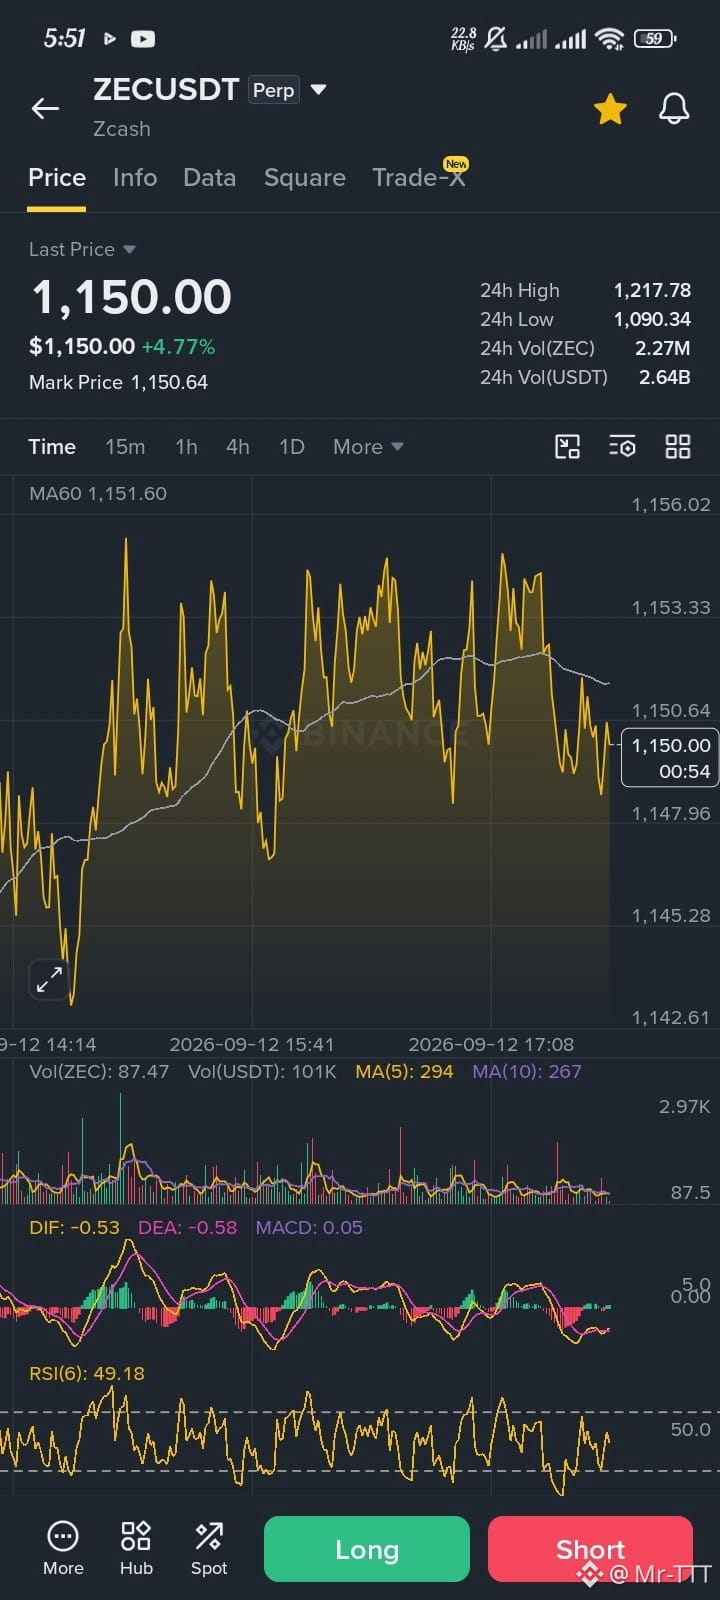
$ZEC Oh mon gros, énorme marché volatil.
{future}(ZECUSDT)
$ZEC Oh mon gros, énorme marché volatil.
167
·
--
$ZEC tu es venu juste pour m’exploser, hein?
{future}(ZECUSDT)
$ZEC tu es venu juste pour m’exploser, hein?
2
109
·
--
1
111
·
--
Article
Voir la traduction
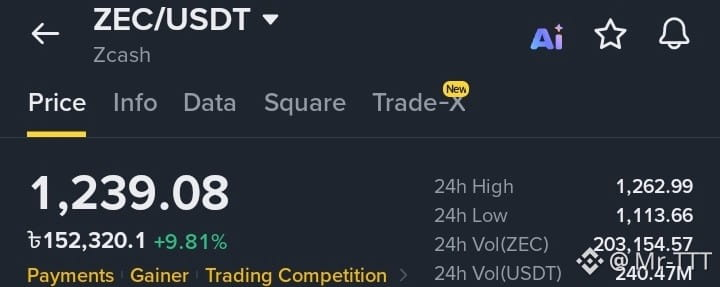
ZEC/USDT Multi-Timeframe Market Analysis$ZEC The ZEC/USDT trading pair is currently exhibiting a strong parabolic breakout and is trading at approximately $1,239.08, marking a rise of over 9.8% in the last 24 hours. Price action indicates a robust bullish trend; however, multi-timeframe analysis reveals that after touching a recent local peak of $1,262.99, the market is approaching a critical pivot point.
Market Depth and Order Book Imbalance
Dominance of the 'Buy Wall': The market depth chart reveals a significant bullish imbalance, with 'bids' (buy orders) accounting for 84.01% of the total order book volume, while 'asks' (sell orders) make up only 15.99%.
Liquidity Support: This high concentration of bids has established a strong structural price floor. A substantial volume of 'buy limit orders' is positioned to absorb potential selling pressure, effectively limiting the risk of an immediate price drop.
Technical Indicator Analysis
1-Day (Macro Trend): The daily chart shows a vertical price expansion. The RSI(6) indicator stands at 79.98, signaling an 'overbought' condition, while the MACD (DIF: 151.88, DEA: 120.61) displays a significant positive separation. While this confirms immense buying momentum, from a mathematical perspective, it also suggests the need for a 'cooling-off period' or a phase of temporary stabilization. 4-Hour (Medium-term): A market consolidation phase has begun. Although the RSI remains high at 73.52, the MACD histogram has turned slightly negative (MACD: -4.13); this indicates a slowdown in medium-term momentum as traders lock in profits just below the $1,260 resistance level.
1-Hour & 15-Minute (Micro-trend): Short-term momentum is attempting to stabilize. The 1-hour MACD is positive (6.75), and 15-minute price action is hugging the 'Upper Bollinger Band,' with the $1,230 zone acting as a new local support level. The 'SuperTrend' indicator is flashing a strong green (positive) signal.
Key Levels and Forecasts
Immediate Resistance: $1,262.99 (24-hour high). Breaking this ceiling requires a price increase of $23.91 (+1.93%).
Primary Support: $1,170.32 (Middle Bollinger Band on the 4-hour chart).
Macro Support Floor: $1,113.66 (24-hour low). A drop to this level would represent a 10.1% decline from the current trading price.
Driven by massive spot market demand and a robust order book, the current market trend is clearly bullish. However, the RSI indicator on both the 1-day and 4-hour charts signals 'overbought' conditions; consequently, opening new 'long positions' at the current $1,239 level carries a high risk of a price retracement. Before any further attempts at price discovery, the asset is most likely to maintain a stable or sideways consolidation pattern in the short term, trading between the $1,170 support and the $1,260 resistance levels.
#zec #Binance #TrendingTopic
ZEC/USDT Multi-Timeframe Market Analysis
$ZEC The ZEC/USDT trading pair is currently exhibiting a strong parabolic breakout and is trading at approximately $1,239.08, marking a rise of over 9.8% in the last 24 hours. Price action indicates a robust bullish trend; however, multi-timeframe analysis reveals that after touching a recent local peak of $1,262.99, the market is approaching a critical pivot point.
Market Depth and Order Book Imbalance
Dominance of the 'Buy Wall': The market depth chart reveals a significant bullish imbalance, with 'bids' (buy orders) accounting for 84.01% of the total order book volume, while 'asks' (sell orders) make up only 15.99%.
Liquidity Support: This high concentration of bids has established a strong structural price floor. A substantial volume of 'buy limit orders' is positioned to absorb potential selling pressure, effectively limiting the risk of an immediate price drop.
Technical Indicator Analysis
1-Day (Macro Trend): The daily chart shows a vertical price expansion. The RSI(6) indicator stands at 79.98, signaling an 'overbought' condition, while the MACD (DIF: 151.88, DEA: 120.61) displays a significant positive separation. While this confirms immense buying momentum, from a mathematical perspective, it also suggests the need for a 'cooling-off period' or a phase of temporary stabilization. 4-Hour (Medium-term): A market consolidation phase has begun. Although the RSI remains high at 73.52, the MACD histogram has turned slightly negative (MACD: -4.13); this indicates a slowdown in medium-term momentum as traders lock in profits just below the $1,260 resistance level.
1-Hour & 15-Minute (Micro-trend): Short-term momentum is attempting to stabilize. The 1-hour MACD is positive (6.75), and 15-minute price action is hugging the 'Upper Bollinger Band,' with the $1,230 zone acting as a new local support level. The 'SuperTrend' indicator is flashing a strong green (positive) signal.
Key Levels and Forecasts
Immediate Resistance: $1,262.99 (24-hour high). Breaking this ceiling requires a price increase of $23.91 (+1.93%).
Primary Support: $1,170.32 (Middle Bollinger Band on the 4-hour chart).
Macro Support Floor: $1,113.66 (24-hour low). A drop to this level would represent a 10.1% decline from the current trading price.
Driven by massive spot market demand and a robust order book, the current market trend is clearly bullish. However, the RSI indicator on both the 1-day and 4-hour charts signals 'overbought' conditions; consequently, opening new 'long positions' at the current $1,239 level carries a high risk of a price retracement. Before any further attempts at price discovery, the asset is most likely to maintain a stable or sideways consolidation pattern in the short term, trading between the $1,170 support and the $1,260 resistance levels.
#zec #Binance #TrendingTopic
Market Depth and Order Book Imbalance
Dominance of the 'Buy Wall': The market depth chart reveals a significant bullish imbalance, with 'bids' (buy orders) accounting for 84.01% of the total order book volume, while 'asks' (sell orders) make up only 15.99%.
Liquidity Support: This high concentration of bids has established a strong structural price floor. A substantial volume of 'buy limit orders' is positioned to absorb potential selling pressure, effectively limiting the risk of an immediate price drop.
Technical Indicator Analysis
1-Day (Macro Trend): The daily chart shows a vertical price expansion. The RSI(6) indicator stands at 79.98, signaling an 'overbought' condition, while the MACD (DIF: 151.88, DEA: 120.61) displays a significant positive separation. While this confirms immense buying momentum, from a mathematical perspective, it also suggests the need for a 'cooling-off period' or a phase of temporary stabilization. 4-Hour (Medium-term): A market consolidation phase has begun. Although the RSI remains high at 73.52, the MACD histogram has turned slightly negative (MACD: -4.13); this indicates a slowdown in medium-term momentum as traders lock in profits just below the $1,260 resistance level.
1-Hour & 15-Minute (Micro-trend): Short-term momentum is attempting to stabilize. The 1-hour MACD is positive (6.75), and 15-minute price action is hugging the 'Upper Bollinger Band,' with the $1,230 zone acting as a new local support level. The 'SuperTrend' indicator is flashing a strong green (positive) signal.
Key Levels and Forecasts
Immediate Resistance: $1,262.99 (24-hour high). Breaking this ceiling requires a price increase of $23.91 (+1.93%).
Primary Support: $1,170.32 (Middle Bollinger Band on the 4-hour chart).
Macro Support Floor: $1,113.66 (24-hour low). A drop to this level would represent a 10.1% decline from the current trading price.
Driven by massive spot market demand and a robust order book, the current market trend is clearly bullish. However, the RSI indicator on both the 1-day and 4-hour charts signals 'overbought' conditions; consequently, opening new 'long positions' at the current $1,239 level carries a high risk of a price retracement. Before any further attempts at price discovery, the asset is most likely to maintain a stable or sideways consolidation pattern in the short term, trading between the $1,170 support and the $1,260 resistance levels.
#zec #Binance #TrendingTopic
1
208
·
--
Haussier
$ZEC la performance n’est pas mauvaise
{future}(ZECUSDT)
$ZEC la performance n’est pas mauvaise
191
·
--
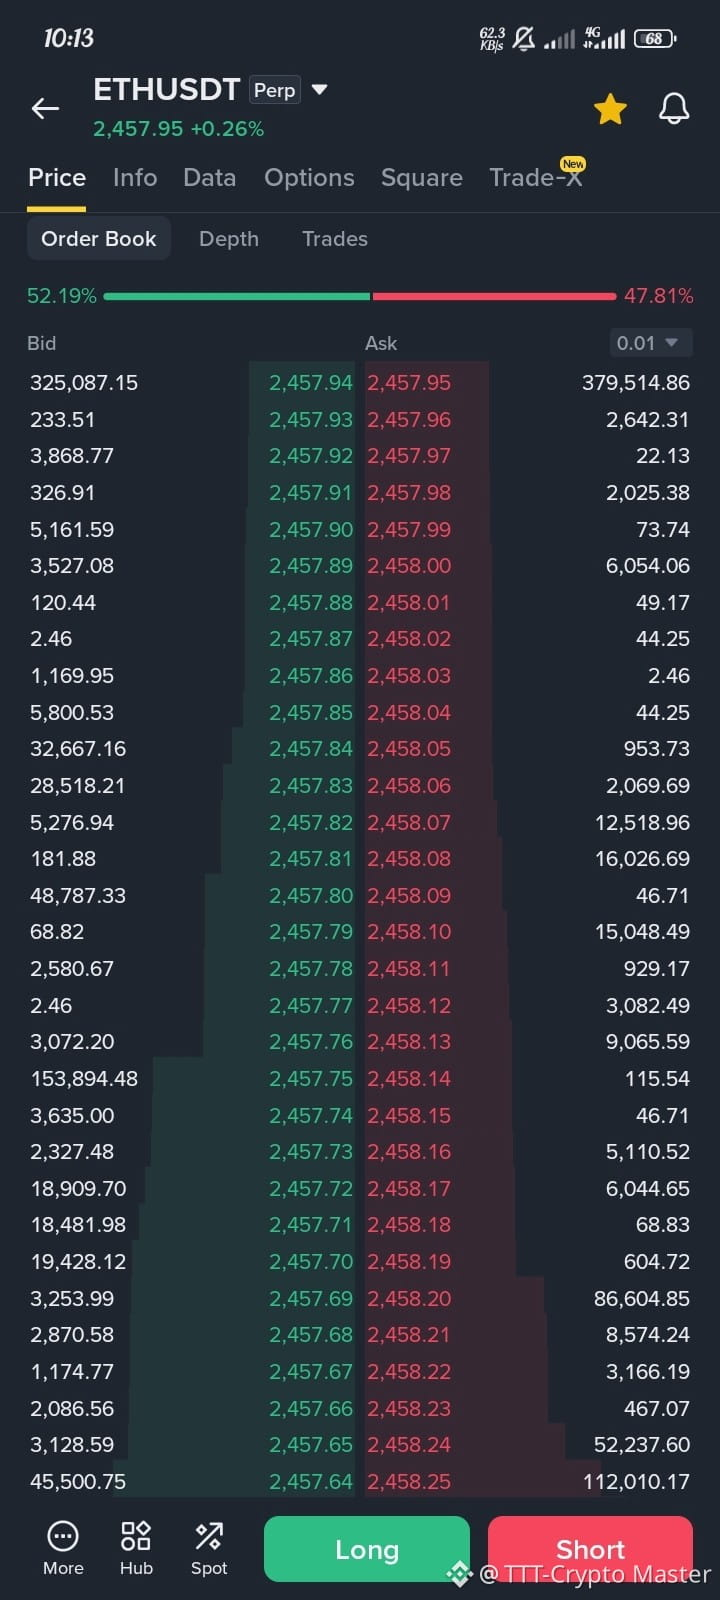
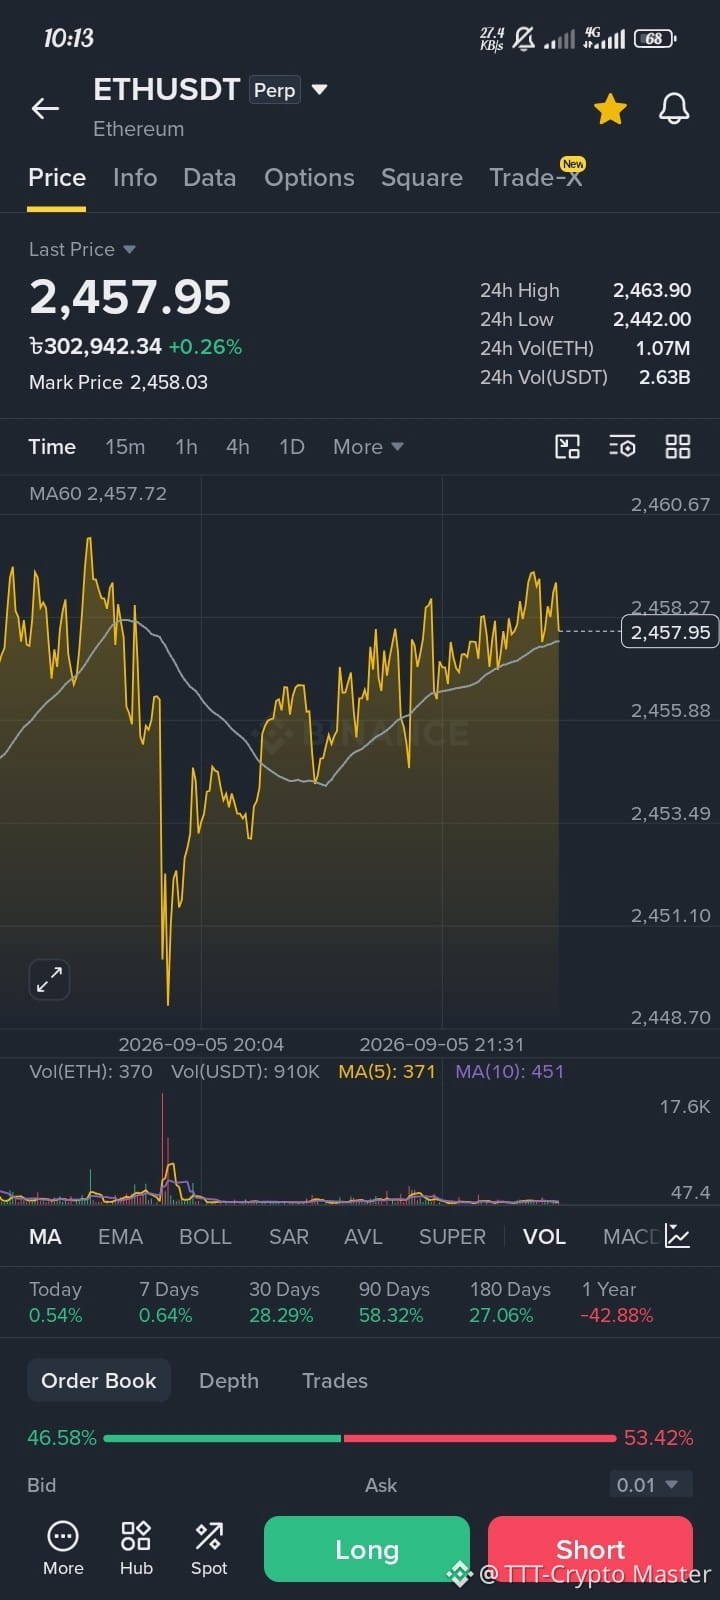
Achat sur repli effectué instantanément ! ETH vise 2 500 $ après avoir balayé la liquidité vendeuse
$ETH
{future}(ETHUSDT)
Achat sur repli effectué instantanément ! ETH vise 2 500 $ après avoir balayé la liquidité vendeuse
$ETH
$ETH
1
87
·
--
Article
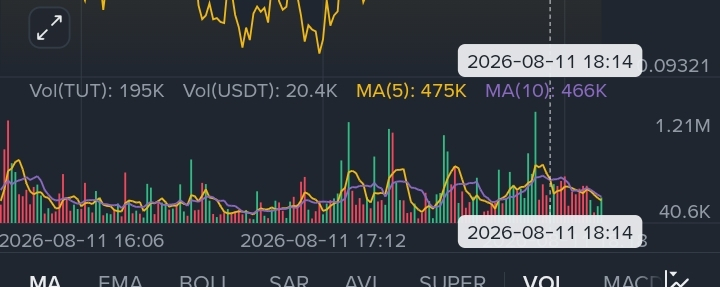
Analyse du marché TUT/USDT : volatilité intense dans le carnet d’ordres en direct et rôle des niveaux de supportUn aperçu de l’activité de trading récente et du carnet d’ordres en direct du token TUT (Tutoriel) sur le marché crypto révèle une image très dramatique et sensible. Après une énorme correction au cours des dernières 24 heures, le prix est actuellement dans une phase de consolidation au sein d’une certaine zone de support.
Faisons une analyse professionnelle du flux de marché en direct actuel, des variations de liquidité et des paramètres techniques.
1. Situation actuelle du marché et évolution des prix
La paire TUT/USDT est actuellement négociée dans la fourchette de 0,1000 à 0,1010 $, indiquant une baisse d’environ 13,3 % à 14,0 % au cours des dernières 24 heures.
Analyse du marché TUT/USDT : volatilité intense dans le carnet d’ordres en direct et rôle des niveaux de support
Un aperçu de l’activité de trading récente et du carnet d’ordres en direct du token TUT (Tutoriel) sur le marché crypto révèle une image très dramatique et sensible. Après une énorme correction au cours des dernières 24 heures, le prix est actuellement dans une phase de consolidation au sein d’une certaine zone de support.
Faisons une analyse professionnelle du flux de marché en direct actuel, des variations de liquidité et des paramètres techniques.
1. Situation actuelle du marché et évolution des prix
La paire TUT/USDT est actuellement négociée dans la fourchette de 0,1000 à 0,1010 $, indiquant une baisse d’environ 13,3 % à 14,0 % au cours des dernières 24 heures.
Faisons une analyse professionnelle du flux de marché en direct actuel, des variations de liquidité et des paramètres techniques.
1. Situation actuelle du marché et évolution des prix
La paire TUT/USDT est actuellement négociée dans la fourchette de 0,1000 à 0,1010 $, indiquant une baisse d’environ 13,3 % à 14,0 % au cours des dernières 24 heures.
1
213
·
--
Article
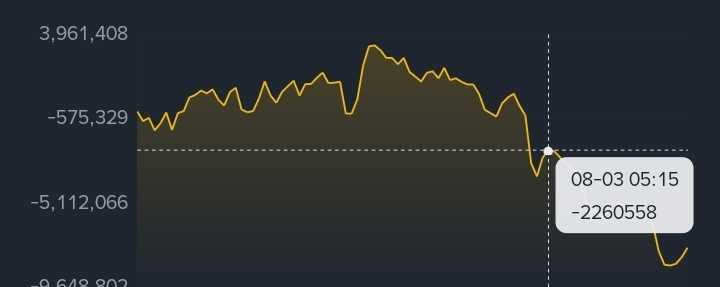
Mise à jour du marché : hémorragie du token BANK et alerte de méga-déroute pour Bitcoin (BTC) !Mes amis ! Aujourd’hui, je vais vous parler de deux sujets importants. Le premier concerne l’état actuel du token BANK/USDT de Lorenzo Protocol, et le second est une feuille de route effrayante, mais réaliste, établie par un analyste pour Bitcoin (BTC). Voyons ce que disent les données.
1. BANK/USDT - Acheter la baisse ou tomber dans le piège ?
Le graphique du token BANK ne manquera pas de faire lever des sourcils à n’importe qui. Faisons son analyse technique et du flux de capitaux :
Une chute sévère : le token se négocie actuellement à 0,0439 $ et a baissé d’environ 10,77 % au cours des dernières 24 heures. Mais le plus effrayant, c’est qu’il a chuté d’environ 89,06 % au cours des 7 derniers jours ! Une si forte baisse en seulement une semaine indique qu’il y a eu une énorme vente massive.
Mise à jour du marché : hémorragie du token BANK et alerte de méga-déroute pour Bitcoin (BTC) !
Mes amis ! Aujourd’hui, je vais vous parler de deux sujets importants. Le premier concerne l’état actuel du token BANK/USDT de Lorenzo Protocol, et le second est une feuille de route effrayante, mais réaliste, établie par un analyste pour Bitcoin (BTC). Voyons ce que disent les données.
1. BANK/USDT - Acheter la baisse ou tomber dans le piège ?
Le graphique du token BANK ne manquera pas de faire lever des sourcils à n’importe qui. Faisons son analyse technique et du flux de capitaux :
Une chute sévère : le token se négocie actuellement à 0,0439 $ et a baissé d’environ 10,77 % au cours des dernières 24 heures. Mais le plus effrayant, c’est qu’il a chuté d’environ 89,06 % au cours des 7 derniers jours ! Une si forte baisse en seulement une semaine indique qu’il y a eu une énorme vente massive.
1. BANK/USDT - Acheter la baisse ou tomber dans le piège ?
Le graphique du token BANK ne manquera pas de faire lever des sourcils à n’importe qui. Faisons son analyse technique et du flux de capitaux :
Une chute sévère : le token se négocie actuellement à 0,0439 $ et a baissé d’environ 10,77 % au cours des dernières 24 heures. Mais le plus effrayant, c’est qu’il a chuté d’environ 89,06 % au cours des 7 derniers jours ! Une si forte baisse en seulement une semaine indique qu’il y a eu une énorme vente massive.
1
224
·
--
Article
Voir la traduction
ARX (Arcium) Technical Analysis: Is a Bullish Relief Rally Incoming?Technical Indicator Breakdown
1. Price Action & Bollinger Bands
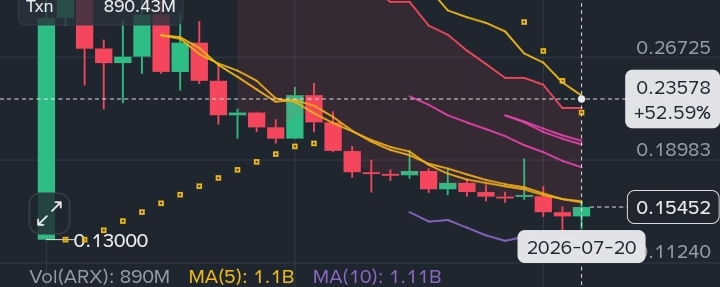
Support Bounce: ARX price found strong support at its recent bottom at $0.13000. As per the chart, the price successfully bounced back by touching the lower band of the Bollinger Band ($0.13057).
Moving Averages: The price is currently trading just below the MA(7) - $0.15793. If this level is broken, the next target will be the MA(25) - $0.20161.
2. Momentum Indicators (Oversold Recovery)
RSI (6): The RSI is currently at 31.93. This indicates that the market was in a severely oversold zone and now buyers are returning to the market from there.
Stochastic RSI: Stochastic RSI is reversing from the oversold zone (17.35), which is a clear signal of bullish momentum.
KDJ Indicator: KDJ is showing a positive crossover (J line has risen to 39.22), which increases the possibility of a price pump in the short-term.
Trading Strategy & Targets
Quick Note: The market is trying to create a bottom, so proper stop-loss must be used before taking any trade.
Immediate Resistance (Target 1): $0.15793 (MA 7 Breakout Confirmation)
Major Resistance (Target 2): $0.18448 (Bollinger Middle Band)
Bullish Target (Target 3): $0.20161 (MA 25)
Stop Loss (Invalidation Zone): If the daily candle closes below $0.13000, this bullish theory will be invalidated.
Conclusion
According to the overall indicator analysis, ARX is currently showing Seller Exhaustion. If the market remains stable with Bitcoin (BTC) movement, we can see a good Bullish Relief Rally or bounce back from ARX very soon.
Disclaimer: This analysis is for educational and informational purposes only and should not be considered as financial, investment, or trading advice. Cryptocurrency markets are highly volatile and carry a significant level of risk. Always DYOR (Do Your Own Research) and consult with a professional financial advisor before making any investment decisions. The author is not responsible for any financial losses incurred from trading based on this information.
#Write2Earn #WIF #Binance #TrendingTopic $BNB $ETH
{spot}(BNBUSDT)
ARX (Arcium) Technical Analysis: Is a Bullish Relief Rally Incoming?
Technical Indicator Breakdown
1. Price Action & Bollinger Bands
Support Bounce: ARX price found strong support at its recent bottom at $0.13000. As per the chart, the price successfully bounced back by touching the lower band of the Bollinger Band ($0.13057).
Moving Averages: The price is currently trading just below the MA(7) - $0.15793. If this level is broken, the next target will be the MA(25) - $0.20161.
2. Momentum Indicators (Oversold Recovery)
RSI (6): The RSI is currently at 31.93. This indicates that the market was in a severely oversold zone and now buyers are returning to the market from there.
Stochastic RSI: Stochastic RSI is reversing from the oversold zone (17.35), which is a clear signal of bullish momentum.
KDJ Indicator: KDJ is showing a positive crossover (J line has risen to 39.22), which increases the possibility of a price pump in the short-term.
Trading Strategy & Targets
Quick Note: The market is trying to create a bottom, so proper stop-loss must be used before taking any trade.
Immediate Resistance (Target 1): $0.15793 (MA 7 Breakout Confirmation)
Major Resistance (Target 2): $0.18448 (Bollinger Middle Band)
Bullish Target (Target 3): $0.20161 (MA 25)
Stop Loss (Invalidation Zone): If the daily candle closes below $0.13000, this bullish theory will be invalidated.
Conclusion
According to the overall indicator analysis, ARX is currently showing Seller Exhaustion. If the market remains stable with Bitcoin (BTC) movement, we can see a good Bullish Relief Rally or bounce back from ARX very soon.
Disclaimer: This analysis is for educational and informational purposes only and should not be considered as financial, investment, or trading advice. Cryptocurrency markets are highly volatile and carry a significant level of risk. Always DYOR (Do Your Own Research) and consult with a professional financial advisor before making any investment decisions. The author is not responsible for any financial losses incurred from trading based on this information.
#Write2Earn #WIF #Binance #TrendingTopic $BNB $ETH
1. Price Action & Bollinger Bands
Support Bounce: ARX price found strong support at its recent bottom at $0.13000. As per the chart, the price successfully bounced back by touching the lower band of the Bollinger Band ($0.13057).
Moving Averages: The price is currently trading just below the MA(7) - $0.15793. If this level is broken, the next target will be the MA(25) - $0.20161.
2. Momentum Indicators (Oversold Recovery)
RSI (6): The RSI is currently at 31.93. This indicates that the market was in a severely oversold zone and now buyers are returning to the market from there.
Stochastic RSI: Stochastic RSI is reversing from the oversold zone (17.35), which is a clear signal of bullish momentum.
KDJ Indicator: KDJ is showing a positive crossover (J line has risen to 39.22), which increases the possibility of a price pump in the short-term.
Trading Strategy & Targets
Quick Note: The market is trying to create a bottom, so proper stop-loss must be used before taking any trade.
Immediate Resistance (Target 1): $0.15793 (MA 7 Breakout Confirmation)
Major Resistance (Target 2): $0.18448 (Bollinger Middle Band)
Bullish Target (Target 3): $0.20161 (MA 25)
Stop Loss (Invalidation Zone): If the daily candle closes below $0.13000, this bullish theory will be invalidated.
Conclusion
According to the overall indicator analysis, ARX is currently showing Seller Exhaustion. If the market remains stable with Bitcoin (BTC) movement, we can see a good Bullish Relief Rally or bounce back from ARX very soon.
Disclaimer: This analysis is for educational and informational purposes only and should not be considered as financial, investment, or trading advice. Cryptocurrency markets are highly volatile and carry a significant level of risk. Always DYOR (Do Your Own Research) and consult with a professional financial advisor before making any investment decisions. The author is not responsible for any financial losses incurred from trading based on this information.
#Write2Earn #WIF #Binance #TrendingTopic $BNB $ETH
1
438
·
--
Article
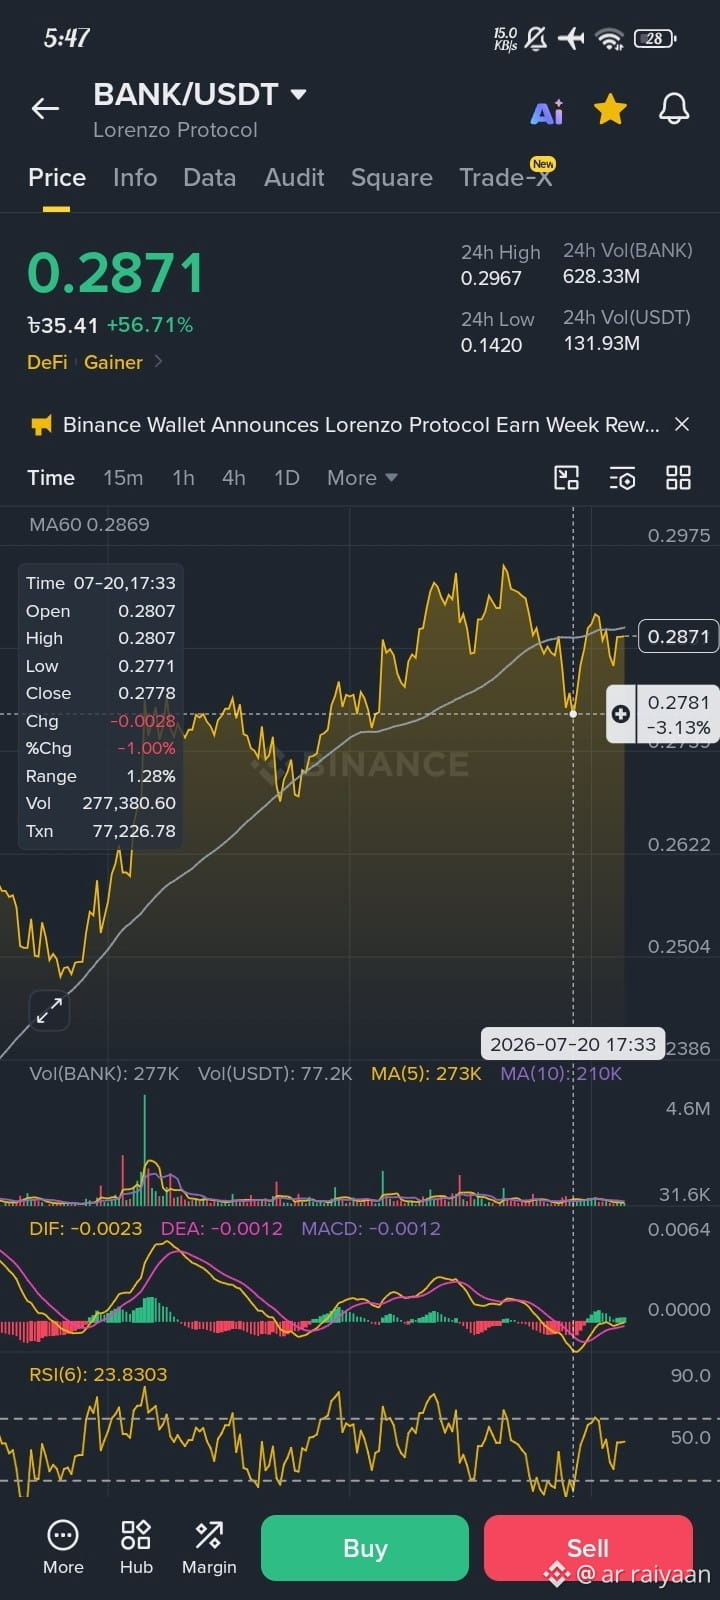
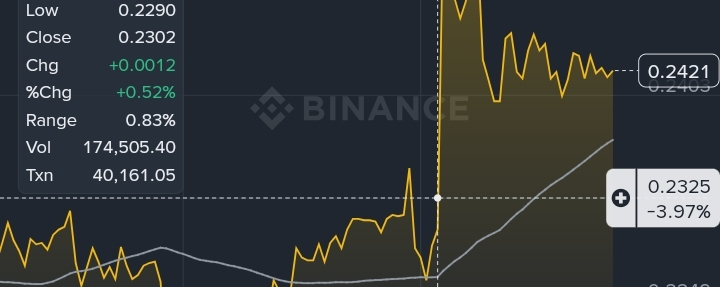
$BANK/USDT Breakout : Quels indicateurs techniques et quelles données on-chain signalent ?La façon dont la paire BANK/USDT se comporte actuellement est tout simplement incroyable ! Elle a gagné environ 129 % au cours des dernières 24 heures et s’est solidement imposée comme l’une des plus fortes hausses du marché. Après un mouvement aussi important, il est naturel que les traders prennent un peu de profits. C’est pourquoi le prix se redresse maintenant légèrement, en s’approchant de 0,24 $.
Cependant, la chose la plus positive pour moi, c’est que le prix n’a pas chuté. Au contraire, il s’est maintenu juste au-dessus de la MA60 (Moving Average 60). Cela montre clairement que les acheteurs gardent encore le contrôle total du marché.
$BANK/USDT Breakout : Quels indicateurs techniques et quelles données on-chain signalent ?
La façon dont la paire BANK/USDT se comporte actuellement est tout simplement incroyable ! Elle a gagné environ 129 % au cours des dernières 24 heures et s’est solidement imposée comme l’une des plus fortes hausses du marché. Après un mouvement aussi important, il est naturel que les traders prennent un peu de profits. C’est pourquoi le prix se redresse maintenant légèrement, en s’approchant de 0,24 $.
Cependant, la chose la plus positive pour moi, c’est que le prix n’a pas chuté. Au contraire, il s’est maintenu juste au-dessus de la MA60 (Moving Average 60). Cela montre clairement que les acheteurs gardent encore le contrôle total du marché.
Cependant, la chose la plus positive pour moi, c’est que le prix n’a pas chuté. Au contraire, il s’est maintenu juste au-dessus de la MA60 (Moving Average 60). Cela montre clairement que les acheteurs gardent encore le contrôle total du marché.
1
290
Connectez-vous pour découvrir plus de contenu
Rejoignez la communauté mondiale des adeptes de cryptomonnaies sur Binance Square
⚡️ Suviez les dernières informations importantes sur les cryptomonnaies.
💬 Jugé digne de confiance par la plus grande plateforme d’échange de cryptomonnaies au monde.
👍 Découvrez les connaissances que partagent les créateurs vérifiés.
Adresse e-mail/Nº de téléphone
Sujets d’actualité
CardanoAddedToX402KitForADAPayments
2 vues
20 mentions
#cardanoaddedtox402kitforadapayments
🚨 CARDANO VIENT D'ENTRER dans la COURSE AUX PAIEMENTS par l'IA ! 🤖🔥
$ADA fait désormais partie de l'officiel x402 SDK, ouvrant une nouvelle voie de paiement pour les applications et les agents IA.
💥 Qu'est-ce qui a changé ?
• Les applis peuvent payer des appels d'API avec ADA ou des tokens natifs Cardano
• Les paiements peuvent avoir lieu directement via des requêtes web standard
• Aucun compte, clé API ou paiement traditionnel n'est requis
• Cardano rejoint l'écosystème de paiements machine-à-machine en pleine croissance
• Le facilitateur x402 a déjà effectué une transaction réelle sur le réseau de pré-production de Cardano
Cela pourrait donner à $ADA a un nouveau récit d'utilité IA + paiements, alors que des agents autonomes doivent de plus en plus payer pour les données et les services en ligne.
⚠️ L'adoption sur le mainnet et le volume réel de paiements doivent encore se développer.
🔥 Est-ce le début d'un nouveau récit autour de l'ADA ?
#Cardano #ADA #AI
Faizan Crypto Learner
·0 mentions J’aime
·18 vues
XRPRises8%
6,032 vues
370 mentions
AMDHits$1TrillionMarketCap
5 vues
11 mentions