
Chart-Sniper
609 Publications

Chart-Sniper
Signaler
Bloquer l’utilisateur
🎯 ChartSniper is your go-to spot for spotting top crypto gainers and breakout setups in real time. I focus on clean chart analysis, key support and resistance.
Ouvert au trading
Trade occasionnellement
4.7 mois
5 Suivis
49 Abonnés
138 J’aime
Publications
Portefeuille
·
--
Article
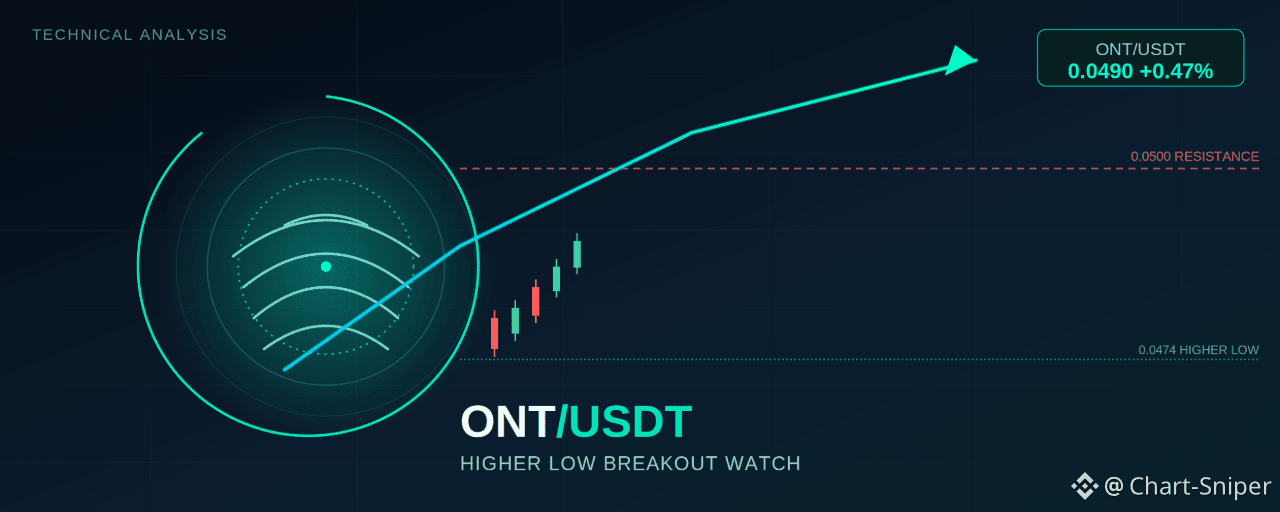
ONT/USDT : Le plus bas plus élevé qui pourrait inverser cette tendance baissière$ONT
Ontology (ONT) a passé la majeure partie de trois séances à baisser face à Tether, mais le graphique en 15 minutes montre désormais les premiers vrais signaux que les vendeurs perdent le contrôle. Après avoir inscrit un nouveau plus bas plus bas, le prix a dessiné un plus bas plus élevé — et ce seul changement de structure est la fissure dans la tendance baissière que les traders devraient surveiller de près en ce moment.
Lire la structure
Le graphique raconte une histoire claire d’une tendance baissière qui s’éteint. ONT/USDT a formé un plus bas plus bas, puis est reparti à la hausse vers un plus haut plus bas, s’est de nouveau retourné pour faire un deuxième plus haut plus bas, avant de finalement trouver des acheteurs sur un plus bas plus élevé proche de 0,0474. Ce plus bas plus élevé est l’élément clé : c’est le premier signe dans cette séquence que les vendeurs ne parviennent plus à pousser le prix vers un nouveau plus bas.
ONT/USDT : Le plus bas plus élevé qui pourrait inverser cette tendance baissière
$ONT
Ontology (ONT) a passé la majeure partie de trois séances à baisser face à Tether, mais le graphique en 15 minutes montre désormais les premiers vrais signaux que les vendeurs perdent le contrôle. Après avoir inscrit un nouveau plus bas plus bas, le prix a dessiné un plus bas plus élevé — et ce seul changement de structure est la fissure dans la tendance baissière que les traders devraient surveiller de près en ce moment.
Lire la structure
Le graphique raconte une histoire claire d’une tendance baissière qui s’éteint. ONT/USDT a formé un plus bas plus bas, puis est reparti à la hausse vers un plus haut plus bas, s’est de nouveau retourné pour faire un deuxième plus haut plus bas, avant de finalement trouver des acheteurs sur un plus bas plus élevé proche de 0,0474. Ce plus bas plus élevé est l’élément clé : c’est le premier signe dans cette séquence que les vendeurs ne parviennent plus à pousser le prix vers un nouveau plus bas.
Ontology (ONT) a passé la majeure partie de trois séances à baisser face à Tether, mais le graphique en 15 minutes montre désormais les premiers vrais signaux que les vendeurs perdent le contrôle. Après avoir inscrit un nouveau plus bas plus bas, le prix a dessiné un plus bas plus élevé — et ce seul changement de structure est la fissure dans la tendance baissière que les traders devraient surveiller de près en ce moment.
Lire la structure
Le graphique raconte une histoire claire d’une tendance baissière qui s’éteint. ONT/USDT a formé un plus bas plus bas, puis est reparti à la hausse vers un plus haut plus bas, s’est de nouveau retourné pour faire un deuxième plus haut plus bas, avant de finalement trouver des acheteurs sur un plus bas plus élevé proche de 0,0474. Ce plus bas plus élevé est l’élément clé : c’est le premier signe dans cette séquence que les vendeurs ne parviennent plus à pousser le prix vers un nouveau plus bas.
66
·
--
Article
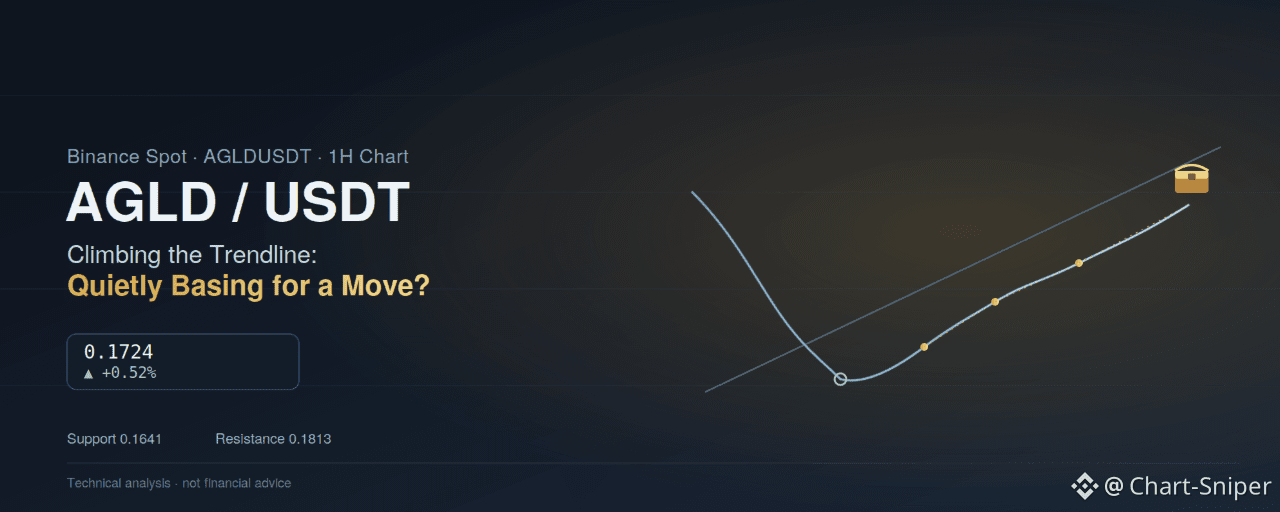
AGLD/USDT Gravit une ligne de tendance en hausse — Adventure Gold se prépare-t-il discrètement à un mouvement ?$AGLD
Graphique 1H | Binance Spot | AGLDUSDT | 16 septembre 2026
Adventure Gold (AGLD) s’échange à 0,1724, en hausse modeste de +0,52% sur la séance après avoir ouvert à 0,1716 et évolué entre 0,1716 et 0,1729. Par rapport aux configurations plus nettes et plus explosives ailleurs sur le tableau en ce moment, le graphique d’AGLD est plus calme — mais sous ce calme se cache une structure à surveiller : un jeton qui est fortement retombé depuis un récent plus haut, a trouvé un plancher, puis a passé le dernier jour et demi à grimper lentement le long d’une ligne de tendance défendue en direction de la résistance qui a plafonné son dernier rebond.
AGLD/USDT Gravit une ligne de tendance en hausse — Adventure Gold se prépare-t-il discrètement à un mouvement ?
$AGLD
Graphique 1H | Binance Spot | AGLDUSDT | 16 septembre 2026
Adventure Gold (AGLD) s’échange à 0,1724, en hausse modeste de +0,52% sur la séance après avoir ouvert à 0,1716 et évolué entre 0,1716 et 0,1729. Par rapport aux configurations plus nettes et plus explosives ailleurs sur le tableau en ce moment, le graphique d’AGLD est plus calme — mais sous ce calme se cache une structure à surveiller : un jeton qui est fortement retombé depuis un récent plus haut, a trouvé un plancher, puis a passé le dernier jour et demi à grimper lentement le long d’une ligne de tendance défendue en direction de la résistance qui a plafonné son dernier rebond.
Graphique 1H | Binance Spot | AGLDUSDT | 16 septembre 2026
Adventure Gold (AGLD) s’échange à 0,1724, en hausse modeste de +0,52% sur la séance après avoir ouvert à 0,1716 et évolué entre 0,1716 et 0,1729. Par rapport aux configurations plus nettes et plus explosives ailleurs sur le tableau en ce moment, le graphique d’AGLD est plus calme — mais sous ce calme se cache une structure à surveiller : un jeton qui est fortement retombé depuis un récent plus haut, a trouvé un plancher, puis a passé le dernier jour et demi à grimper lentement le long d’une ligne de tendance défendue en direction de la résistance qui a plafonné son dernier rebond.
45
·
--
Article
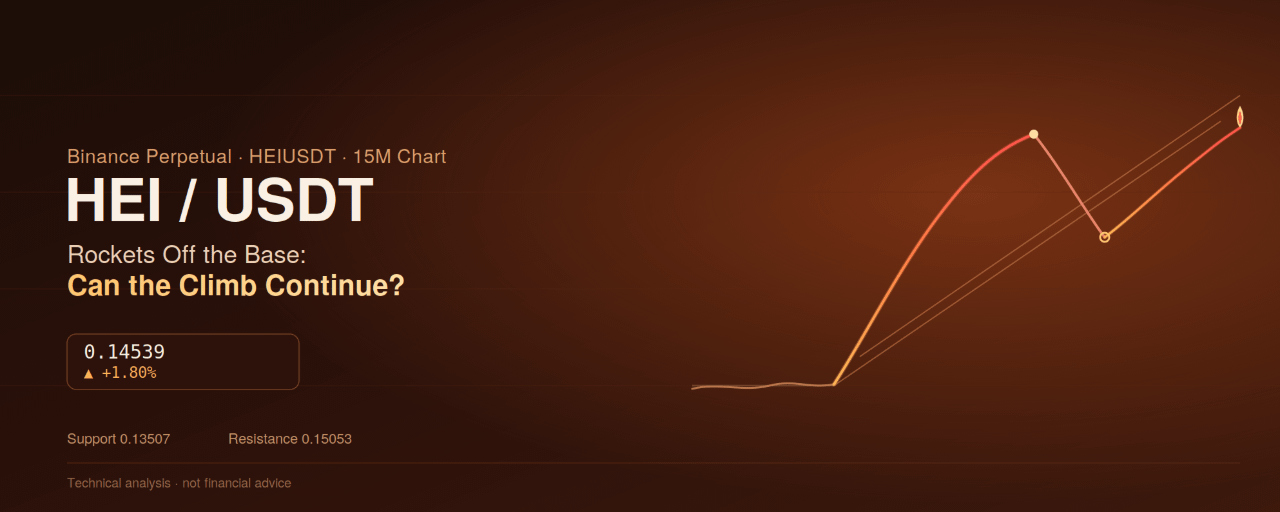
HEI/USDT Fait un bond hors d’une base de plusieurs jours — Le canal peut-il continuer à grimper ?$HEI
Graphique 15M | Binance Perpétuel | HEIUSDT | 16 septembre 2026
Heima (HEI) se négocie à 0,14539, en hausse de +1,80% sur la séance après avoir ouvert à 0,14282 et évolué entre 0,14143 et 0,14608. Ce chiffre quotidien rend à peine compte de l’ampleur de ce qui s’est passé au cours des dernières 24 heures : HEI est sorti d’une longue base plate et est parti quasi en mode parabolique, bondissant de plus de 30% depuis ses plus bas de début de séance vers un nouveau sommet avant de retomber dans un repli typique, désormais en train de se résoudre à la hausse.
HEI/USDT Fait un bond hors d’une base de plusieurs jours — Le canal peut-il continuer à grimper ?
$HEI
Graphique 15M | Binance Perpétuel | HEIUSDT | 16 septembre 2026
Heima (HEI) se négocie à 0,14539, en hausse de +1,80% sur la séance après avoir ouvert à 0,14282 et évolué entre 0,14143 et 0,14608. Ce chiffre quotidien rend à peine compte de l’ampleur de ce qui s’est passé au cours des dernières 24 heures : HEI est sorti d’une longue base plate et est parti quasi en mode parabolique, bondissant de plus de 30% depuis ses plus bas de début de séance vers un nouveau sommet avant de retomber dans un repli typique, désormais en train de se résoudre à la hausse.
Graphique 15M | Binance Perpétuel | HEIUSDT | 16 septembre 2026
Heima (HEI) se négocie à 0,14539, en hausse de +1,80% sur la séance après avoir ouvert à 0,14282 et évolué entre 0,14143 et 0,14608. Ce chiffre quotidien rend à peine compte de l’ampleur de ce qui s’est passé au cours des dernières 24 heures : HEI est sorti d’une longue base plate et est parti quasi en mode parabolique, bondissant de plus de 30% depuis ses plus bas de début de séance vers un nouveau sommet avant de retomber dans un repli typique, désormais en train de se résoudre à la hausse.
117
·
--
Article
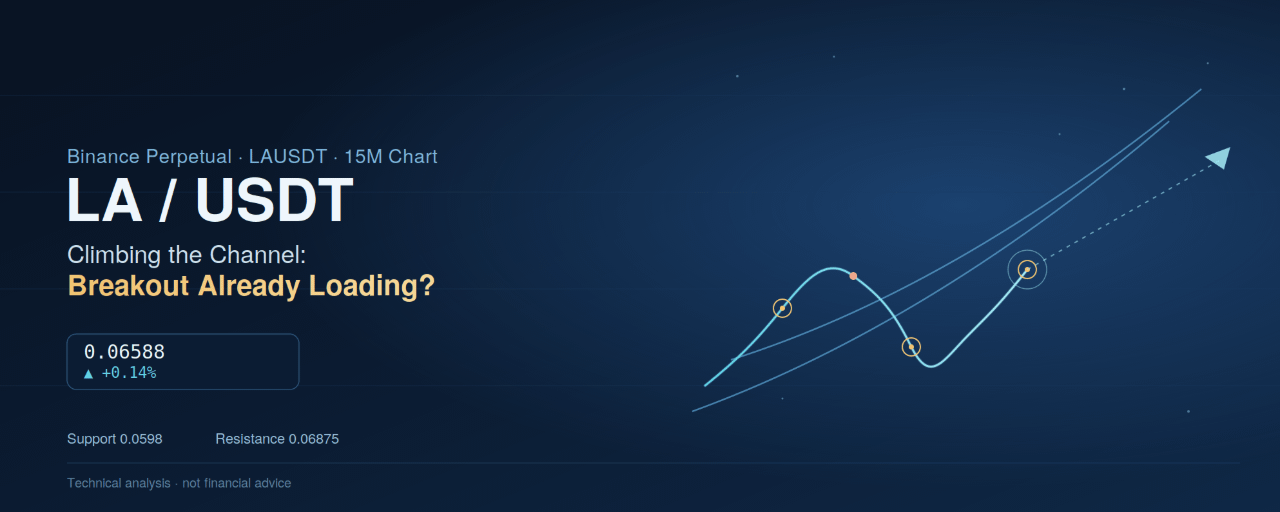
LA/USDT grimpe à l’intérieur d’un canal ascendant — le prochain breakout est-il déjà en préparation ?$LA
Graphique 15M | Binance Perpétuels | LAUSDT | 16 septembre 2026
Lagrange (LA) se négocie à 0,06588, en hausse modeste de +0,14% sur la séance après l’ouverture à 0,06578, avec une fourchette entre un plus haut à 0,06597 et un plus bas à 0,06561. La bougie quotidienne semble plate, mais la structure en dessous n’est pas du tout statique — après une forte baisse sur deux jours plus tôt dans la semaine, LA a passé la dernière journée et demie à construire un véritable canal haussier, rebondissant sur sa borne inférieure pour la troisième fois alors qu’il remonte en direction de la résistance qui a plafonné la dernière tentative de hausse.
LA/USDT grimpe à l’intérieur d’un canal ascendant — le prochain breakout est-il déjà en préparation ?
$LA
Graphique 15M | Binance Perpétuels | LAUSDT | 16 septembre 2026
Lagrange (LA) se négocie à 0,06588, en hausse modeste de +0,14% sur la séance après l’ouverture à 0,06578, avec une fourchette entre un plus haut à 0,06597 et un plus bas à 0,06561. La bougie quotidienne semble plate, mais la structure en dessous n’est pas du tout statique — après une forte baisse sur deux jours plus tôt dans la semaine, LA a passé la dernière journée et demie à construire un véritable canal haussier, rebondissant sur sa borne inférieure pour la troisième fois alors qu’il remonte en direction de la résistance qui a plafonné la dernière tentative de hausse.
Graphique 15M | Binance Perpétuels | LAUSDT | 16 septembre 2026
Lagrange (LA) se négocie à 0,06588, en hausse modeste de +0,14% sur la séance après l’ouverture à 0,06578, avec une fourchette entre un plus haut à 0,06597 et un plus bas à 0,06561. La bougie quotidienne semble plate, mais la structure en dessous n’est pas du tout statique — après une forte baisse sur deux jours plus tôt dans la semaine, LA a passé la dernière journée et demie à construire un véritable canal haussier, rebondissant sur sa borne inférieure pour la troisième fois alors qu’il remonte en direction de la résistance qui a plafonné la dernière tentative de hausse.
170
·
--
📉 $ZEC USDT — CONFIGURATION SHORT
ZEC se situe autour de 1,178 $–1,217 $, après une forte correction récente depuis des niveaux au-dessus de 1,200 $. L’élan reste volatile, avec des vendeurs actifs après le retournement.
🔴 ENTRÉE SHORT : Prix du marché
🛑 SL : 1,300 $
🎯 TP1 : 1,100 $
🎯 TP2 : 1,020 $
🎯 TP3 : 950 $
⚡ Entrée : Prix du marché — exécutable maintenant.
⚠️ Ceci n’est pas un conseil financier. Gérez le risque avec prudence.
@Binance_Square_Official #FedRateWatch #ZcashRises6% #XRPSinks10% #Binance #ChartSniper
{future}(ZECUSDT)
📉 $ZEC USDT — CONFIGURATION SHORT
ZEC se situe autour de 1,178 $–1,217 $, après une forte correction récente depuis des niveaux au-dessus de 1,200 $. L’élan reste volatile, avec des vendeurs actifs après le retournement.
🔴 ENTRÉE SHORT : Prix du marché
🛑 SL : 1,300 $
🎯 TP1 : 1,100 $
🎯 TP2 : 1,020 $
🎯 TP3 : 950 $
⚡ Entrée : Prix du marché — exécutable maintenant.
⚠️ Ceci n’est pas un conseil financier. Gérez le risque avec prudence.
@Binance Square Official #FedRateWatch #ZcashRises6% #XRPSinks10% #Binance #ChartSniper
ZEC se situe autour de 1,178 $–1,217 $, après une forte correction récente depuis des niveaux au-dessus de 1,200 $. L’élan reste volatile, avec des vendeurs actifs après le retournement.
🔴 ENTRÉE SHORT : Prix du marché
🛑 SL : 1,300 $
🎯 TP1 : 1,100 $
🎯 TP2 : 1,020 $
🎯 TP3 : 950 $
⚡ Entrée : Prix du marché — exécutable maintenant.
⚠️ Ceci n’est pas un conseil financier. Gérez le risque avec prudence.
@Binance Square Official #FedRateWatch #ZcashRises6% #XRPSinks10% #Binance #ChartSniper
191
·
--

Article
CATI/USDT construit une échelle à partir des creux — la prochaine phase est-elle en train de monter ?$CATI
Graphique 1H | Binance Perpétuel | CATIUSDT | 11 septembre 2026
Catizen (CATI) s’échange à 0.06116, en hausse de +0.81% sur la journée après une ouverture à 0.06066 et un mouvement entre un plus haut de 0.06148 et un plus bas de 0.06061. C’est une plage quotidienne plutôt calme, mais elle se situe au-dessus de l’une des structures de reprise les plus constructives actuellement visibles — un token qui a fortement chuté, a trouvé un creux durable et a passé la semaine dernière à construire une véritable « échelle » de plus hauts progressifs sous une zone de résistance bien définie.
Lire la structure
CATI/USDT construit une échelle à partir des creux — la prochaine phase est-elle en train de monter ?
$CATI
Graphique 1H | Binance Perpétuel | CATIUSDT | 11 septembre 2026
Catizen (CATI) s’échange à 0.06116, en hausse de +0.81% sur la journée après une ouverture à 0.06066 et un mouvement entre un plus haut de 0.06148 et un plus bas de 0.06061. C’est une plage quotidienne plutôt calme, mais elle se situe au-dessus de l’une des structures de reprise les plus constructives actuellement visibles — un token qui a fortement chuté, a trouvé un creux durable et a passé la semaine dernière à construire une véritable « échelle » de plus hauts progressifs sous une zone de résistance bien définie.
Lire la structure
Graphique 1H | Binance Perpétuel | CATIUSDT | 11 septembre 2026
Catizen (CATI) s’échange à 0.06116, en hausse de +0.81% sur la journée après une ouverture à 0.06066 et un mouvement entre un plus haut de 0.06148 et un plus bas de 0.06061. C’est une plage quotidienne plutôt calme, mais elle se situe au-dessus de l’une des structures de reprise les plus constructives actuellement visibles — un token qui a fortement chuté, a trouvé un creux durable et a passé la semaine dernière à construire une véritable « échelle » de plus hauts progressifs sous une zone de résistance bien définie.
Lire la structure
1
127
·
--

Article
NOT/USDT : des coils à un carrefour — Dans quel sens Notcoin va-t-il rompre ?$NOT
Graphique 1H | Binance Spot | NOTUSDT | 11 septembre 2026
Notcoin (NOT) s’échange à 0,000431, en hausse modeste de +0,70% sur la journée après un ouverture à 0,000428, et en fluctuant entre 0,000428 et 0,000432. Contrairement aux mouvements nets et décisifs visibles ailleurs sur le marché en ce moment, le graphique de NOT raconte une histoire d’hésitation — un jeton pris entre une cassure de tendance haussière et une zone de support qui tient depuis plus d’une semaine, tandis que le prix se comprime dans une fourchette de plus en plus étroite à l’approche d’un point de décision clair.
NOT/USDT : des coils à un carrefour — Dans quel sens Notcoin va-t-il rompre ?
$NOT
Graphique 1H | Binance Spot | NOTUSDT | 11 septembre 2026
Notcoin (NOT) s’échange à 0,000431, en hausse modeste de +0,70% sur la journée après un ouverture à 0,000428, et en fluctuant entre 0,000428 et 0,000432. Contrairement aux mouvements nets et décisifs visibles ailleurs sur le marché en ce moment, le graphique de NOT raconte une histoire d’hésitation — un jeton pris entre une cassure de tendance haussière et une zone de support qui tient depuis plus d’une semaine, tandis que le prix se comprime dans une fourchette de plus en plus étroite à l’approche d’un point de décision clair.
Graphique 1H | Binance Spot | NOTUSDT | 11 septembre 2026
Notcoin (NOT) s’échange à 0,000431, en hausse modeste de +0,70% sur la journée après un ouverture à 0,000428, et en fluctuant entre 0,000428 et 0,000432. Contrairement aux mouvements nets et décisifs visibles ailleurs sur le marché en ce moment, le graphique de NOT raconte une histoire d’hésitation — un jeton pris entre une cassure de tendance haussière et une zone de support qui tient depuis plus d’une semaine, tandis que le prix se comprime dans une fourchette de plus en plus étroite à l’approche d’un point de décision clair.
136
·
--

Article
THETA/USDT explose à partir des plus bas — une nouvelle tendance haussière est-elle en train de commencer ?$THETA
Graphique 1H | Binance Perpétuel | THETAUSDT | 11 septembre 2026
Le jeton Theta s’échange à 0,1906, en hausse de +1,06% sur la journée, après avoir ouvert à 0,1886 et oscillé entre un plus bas de 0,1884 et un plus haut de 0,1914. La bougie quotidienne semble banale en soi, mais elle se trouve au-dessus de l’une des plus nettes impulsions que THETA ait réalisées depuis des semaines — un rallye qui a fait passer le prix d’un nouveau plus bas proche de 0,1685 à un plus haut plus élevé au-dessus de 0,2073 en l’espace de quelques heures, avant de se calmer dans une correction saine qui met désormais en place le prochain point de décision.
THETA/USDT explose à partir des plus bas — une nouvelle tendance haussière est-elle en train de commencer ?
$THETA
Graphique 1H | Binance Perpétuel | THETAUSDT | 11 septembre 2026
Le jeton Theta s’échange à 0,1906, en hausse de +1,06% sur la journée, après avoir ouvert à 0,1886 et oscillé entre un plus bas de 0,1884 et un plus haut de 0,1914. La bougie quotidienne semble banale en soi, mais elle se trouve au-dessus de l’une des plus nettes impulsions que THETA ait réalisées depuis des semaines — un rallye qui a fait passer le prix d’un nouveau plus bas proche de 0,1685 à un plus haut plus élevé au-dessus de 0,2073 en l’espace de quelques heures, avant de se calmer dans une correction saine qui met désormais en place le prochain point de décision.
Graphique 1H | Binance Perpétuel | THETAUSDT | 11 septembre 2026
Le jeton Theta s’échange à 0,1906, en hausse de +1,06% sur la journée, après avoir ouvert à 0,1886 et oscillé entre un plus bas de 0,1884 et un plus haut de 0,1914. La bougie quotidienne semble banale en soi, mais elle se trouve au-dessus de l’une des plus nettes impulsions que THETA ait réalisées depuis des semaines — un rallye qui a fait passer le prix d’un nouveau plus bas proche de 0,1685 à un plus haut plus élevé au-dessus de 0,2073 en l’espace de quelques heures, avant de se calmer dans une correction saine qui met désormais en place le prochain point de décision.
70
·
--

Article
AT/USDT reconquiert tous les niveaux perdus — la tendance vient-elle de s’inverser ?$AT
Graphique 1H | Binance Perpétuel | ATUSDT | 11 septembre 2026
AT évolue à 0,1529, en hausse de +0,53% sur la séance après avoir atteint un plus haut de 0,1536 et un plus bas de 0,1519. Ce chiffre quotidien plutôt modeste ne rend pas justice à ce qui s’est passé sur le graphique : au cours des dernières 24 heures, AT a réalisé l’un des retournements les plus nets de sa récente fourchette, traversant de part en part un groupe de niveaux de résistance antérieurs qui avaient limité chaque reprise depuis le plus haut du 7 septembre. C’est le genre de mouvement qui transforme un graphique « observer et attendre » en une configuration active.
AT/USDT reconquiert tous les niveaux perdus — la tendance vient-elle de s’inverser ?
$AT
Graphique 1H | Binance Perpétuel | ATUSDT | 11 septembre 2026
AT évolue à 0,1529, en hausse de +0,53% sur la séance après avoir atteint un plus haut de 0,1536 et un plus bas de 0,1519. Ce chiffre quotidien plutôt modeste ne rend pas justice à ce qui s’est passé sur le graphique : au cours des dernières 24 heures, AT a réalisé l’un des retournements les plus nets de sa récente fourchette, traversant de part en part un groupe de niveaux de résistance antérieurs qui avaient limité chaque reprise depuis le plus haut du 7 septembre. C’est le genre de mouvement qui transforme un graphique « observer et attendre » en une configuration active.
Graphique 1H | Binance Perpétuel | ATUSDT | 11 septembre 2026
AT évolue à 0,1529, en hausse de +0,53% sur la séance après avoir atteint un plus haut de 0,1536 et un plus bas de 0,1519. Ce chiffre quotidien plutôt modeste ne rend pas justice à ce qui s’est passé sur le graphique : au cours des dernières 24 heures, AT a réalisé l’un des retournements les plus nets de sa récente fourchette, traversant de part en part un groupe de niveaux de résistance antérieurs qui avaient limité chaque reprise depuis le plus haut du 7 septembre. C’est le genre de mouvement qui transforme un graphique « observer et attendre » en une configuration active.
96
·
--

Article
LIT/USDT Rejeté à Nouveau — La tendance baissière est-elle prête pour une dernière baisse ?$LIT
Graphique 15M | Binance Perpétuel | LITUSDT | 11 septembre 2026
L’action Lighter (LIT) s’échange à 4.4168 après avoir ouvert la séance à 4.4160, en oscillant entre un plus haut de 4.4340 et un plus bas de 4.3645 — une bougie calme et presque plate en surface, mais la structure sous-jacente raconte une histoire plus décisive. Depuis avoir inscrit un plus haut plus élevé près de 5.25 le 9 septembre, LIT a dessiné un canal descendant “de manuel” : des plus hauts plus bas, une cassure nette du plus bas de la fourchette précédente, et un rejet au niveau d’une tendance de résistance désormais testée et refusée à trois reprises distinctes.
LIT/USDT Rejeté à Nouveau — La tendance baissière est-elle prête pour une dernière baisse ?
$LIT
Graphique 15M | Binance Perpétuel | LITUSDT | 11 septembre 2026
L’action Lighter (LIT) s’échange à 4.4168 après avoir ouvert la séance à 4.4160, en oscillant entre un plus haut de 4.4340 et un plus bas de 4.3645 — une bougie calme et presque plate en surface, mais la structure sous-jacente raconte une histoire plus décisive. Depuis avoir inscrit un plus haut plus élevé près de 5.25 le 9 septembre, LIT a dessiné un canal descendant “de manuel” : des plus hauts plus bas, une cassure nette du plus bas de la fourchette précédente, et un rejet au niveau d’une tendance de résistance désormais testée et refusée à trois reprises distinctes.
Graphique 15M | Binance Perpétuel | LITUSDT | 11 septembre 2026
L’action Lighter (LIT) s’échange à 4.4168 après avoir ouvert la séance à 4.4160, en oscillant entre un plus haut de 4.4340 et un plus bas de 4.3645 — une bougie calme et presque plate en surface, mais la structure sous-jacente raconte une histoire plus décisive. Depuis avoir inscrit un plus haut plus élevé près de 5.25 le 9 septembre, LIT a dessiné un canal descendant “de manuel” : des plus hauts plus bas, une cassure nette du plus bas de la fourchette précédente, et un rejet au niveau d’une tendance de résistance désormais testée et refusée à trois reprises distinctes.
234
·
--

Article
MMT/USDT : L’élan est perdu — L’effet domino continue de faire tomber le support$MMT
Actif : MMT/USDT Perpétuel | Période : 15M | Bourse : Binance
Le graphique du MMT ressemble à une cascade de dominos qui tombent. Après s’être consolidé pendant deux jours dans la fourchette 0.1670–0.1710 (signalée par un Lower High bien visible), les vendeurs ont pris le contrôle les 9–10 septembre et ont fait passer le prix directement sous le support en une seule impulsion agressive, jusqu’à un Lower Low proche de 0.155. Depuis lors, la paire poursuit sa baisse en évoluant à l’intérieur d’une ligne de tendance baissière bien définie, avant de former finalement un Higher Low à 0.1484, puis d’amorcer une tentative de rebond vers 0.1550 — immédiatement rejetée, renvoyant le prix tout droit dans la ligne de tendance. Le prix se situe maintenant à 0.1508, en baisse de 0.79% sur la séance, et reste encore coincé sous cette ligne de résistance en chute.
MMT/USDT : L’élan est perdu — L’effet domino continue de faire tomber le support
$MMT
Actif : MMT/USDT Perpétuel | Période : 15M | Bourse : Binance
Le graphique du MMT ressemble à une cascade de dominos qui tombent. Après s’être consolidé pendant deux jours dans la fourchette 0.1670–0.1710 (signalée par un Lower High bien visible), les vendeurs ont pris le contrôle les 9–10 septembre et ont fait passer le prix directement sous le support en une seule impulsion agressive, jusqu’à un Lower Low proche de 0.155. Depuis lors, la paire poursuit sa baisse en évoluant à l’intérieur d’une ligne de tendance baissière bien définie, avant de former finalement un Higher Low à 0.1484, puis d’amorcer une tentative de rebond vers 0.1550 — immédiatement rejetée, renvoyant le prix tout droit dans la ligne de tendance. Le prix se situe maintenant à 0.1508, en baisse de 0.79% sur la séance, et reste encore coincé sous cette ligne de résistance en chute.
Actif : MMT/USDT Perpétuel | Période : 15M | Bourse : Binance
Le graphique du MMT ressemble à une cascade de dominos qui tombent. Après s’être consolidé pendant deux jours dans la fourchette 0.1670–0.1710 (signalée par un Lower High bien visible), les vendeurs ont pris le contrôle les 9–10 septembre et ont fait passer le prix directement sous le support en une seule impulsion agressive, jusqu’à un Lower Low proche de 0.155. Depuis lors, la paire poursuit sa baisse en évoluant à l’intérieur d’une ligne de tendance baissière bien définie, avant de former finalement un Higher Low à 0.1484, puis d’amorcer une tentative de rebond vers 0.1550 — immédiatement rejetée, renvoyant le prix tout droit dans la ligne de tendance. Le prix se situe maintenant à 0.1508, en baisse de 0.79% sur la séance, et reste encore coincé sous cette ligne de résistance en chute.
315
·
--

Article
PUMP/USDT : Le rythme cardiaque s’essouffle — La structure se fissure sous un support clé$PUMP
Actif : PUMP/USDT perpétuel | Intervalle : 1H | Bourse : Binance
PUMP vient de donner une leçon magistrale sur la vitesse à laquelle le sentiment peut basculer sur un token proche des mèmes. Après avoir bondi depuis sa base du début de septembre vers 0,0035, dans une impulsion propre en direction de 0,0048, le prix a formé un plus haut plus élevé — puis a immédiatement commencé à imprimer une structure baissière. Le graphique en 1H montre désormais une séquence LH → HH → LL → HL complétée, et la bougie la plus récente a juste cassé sous le niveau HL, avec une mèche à travers le niveau 0 de Fibonacci (0,003506), avant de clôturer à 0,003539, en baisse de plus de 4 % sur la séance.
PUMP/USDT : Le rythme cardiaque s’essouffle — La structure se fissure sous un support clé
$PUMP
Actif : PUMP/USDT perpétuel | Intervalle : 1H | Bourse : Binance
PUMP vient de donner une leçon magistrale sur la vitesse à laquelle le sentiment peut basculer sur un token proche des mèmes. Après avoir bondi depuis sa base du début de septembre vers 0,0035, dans une impulsion propre en direction de 0,0048, le prix a formé un plus haut plus élevé — puis a immédiatement commencé à imprimer une structure baissière. Le graphique en 1H montre désormais une séquence LH → HH → LL → HL complétée, et la bougie la plus récente a juste cassé sous le niveau HL, avec une mèche à travers le niveau 0 de Fibonacci (0,003506), avant de clôturer à 0,003539, en baisse de plus de 4 % sur la séance.
Actif : PUMP/USDT perpétuel | Intervalle : 1H | Bourse : Binance
PUMP vient de donner une leçon magistrale sur la vitesse à laquelle le sentiment peut basculer sur un token proche des mèmes. Après avoir bondi depuis sa base du début de septembre vers 0,0035, dans une impulsion propre en direction de 0,0048, le prix a formé un plus haut plus élevé — puis a immédiatement commencé à imprimer une structure baissière. Le graphique en 1H montre désormais une séquence LH → HH → LL → HL complétée, et la bougie la plus récente a juste cassé sous le niveau HL, avec une mèche à travers le niveau 0 de Fibonacci (0,003506), avant de clôturer à 0,003539, en baisse de plus de 4 % sur la séance.
195
·
--
📈 $DEXE USDT — CONFIGURATION LONGUE
DEXE se négocie autour de 1,96 $, avec une pression de vente récente créant une zone de support potentielle. Un maintien au-dessus de 1,90–1,95 $ pourrait déclencher un rebond vers les prochains niveaux de résistance. La structure technique favorise une configuration de rebond prudente.
🟢 ENTRÉE : 1,96 $
🛑 SL : 1,84 $
🎯 TP1 : 2,10 $
🎯 TP2 : 2,25 $
🎯 TP3 : 2,40 $
⚡ L’entrée est exécutable maintenant.
⚠️ Ceci ne constitue pas un conseil financier. Gérez le risque avec soin.
@Binance_Square_Official #USAugustPPIRisesLessThanExpected #SECApprovesNasdaqTexasCommodityTrustRule #ECBRaisesRatesSecondTimeTo2.5% #Binance #ChartSniper
{future}(DEXEUSDT)
📈 $DEXE USDT — CONFIGURATION LONGUE
DEXE se négocie autour de 1,96 $, avec une pression de vente récente créant une zone de support potentielle. Un maintien au-dessus de 1,90–1,95 $ pourrait déclencher un rebond vers les prochains niveaux de résistance. La structure technique favorise une configuration de rebond prudente.
🟢 ENTRÉE : 1,96 $
🛑 SL : 1,84 $
🎯 TP1 : 2,10 $
🎯 TP2 : 2,25 $
🎯 TP3 : 2,40 $
⚡ L’entrée est exécutable maintenant.
⚠️ Ceci ne constitue pas un conseil financier. Gérez le risque avec soin.
@Binance Square Official #USAugustPPIRisesLessThanExpected #SECApprovesNasdaqTexasCommodityTrustRule #ECBRaisesRatesSecondTimeTo2.5% #Binance #ChartSniper
DEXE se négocie autour de 1,96 $, avec une pression de vente récente créant une zone de support potentielle. Un maintien au-dessus de 1,90–1,95 $ pourrait déclencher un rebond vers les prochains niveaux de résistance. La structure technique favorise une configuration de rebond prudente.
🟢 ENTRÉE : 1,96 $
🛑 SL : 1,84 $
🎯 TP1 : 2,10 $
🎯 TP2 : 2,25 $
🎯 TP3 : 2,40 $
⚡ L’entrée est exécutable maintenant.
⚠️ Ceci ne constitue pas un conseil financier. Gérez le risque avec soin.
@Binance Square Official #USAugustPPIRisesLessThanExpected #SECApprovesNasdaqTexasCommodityTrustRule #ECBRaisesRatesSecondTimeTo2.5% #Binance #ChartSniper
206
·
--
📉 $SAGA USDT — CONFIGURATION SHORT
SAGA évolue près de 0,0142 $, en baisse d’environ 3–4 % sur 24H. Le prix reste sous la résistance récente à 0,0150 $, montrant une pression baissière après un rejet.
🔴 ENTRÉE SHORT : 0,01420$
🛑 SL : 0,01480$
🎯 TP1 : 0,01370$
🎯 TP2 : 0,01320$
🎯 TP3 : 0,01280$
⚡ L’entrée est exécutable au prix actuel du marché.
⚠️ Ceci ne constitue pas un conseil financier. Gérez le risque avec prudence.
@Binance_Square_Official #USAugustPPIRisesLessThanExpected #SECApprovesNasdaqTexasCommodityTrustRule #ECBRaisesRatesSecondTimeTo2.5% #Binance #ChartSniper
{future}(SAGAUSDT)
📉 $SAGA USDT — CONFIGURATION SHORT
SAGA évolue près de 0,0142 $, en baisse d’environ 3–4 % sur 24H. Le prix reste sous la résistance récente à 0,0150 $, montrant une pression baissière après un rejet.
🔴 ENTRÉE SHORT : 0,01420$
🛑 SL : 0,01480$
🎯 TP1 : 0,01370$
🎯 TP2 : 0,01320$
🎯 TP3 : 0,01280$
⚡ L’entrée est exécutable au prix actuel du marché.
⚠️ Ceci ne constitue pas un conseil financier. Gérez le risque avec prudence.
@Binance Square Official #USAugustPPIRisesLessThanExpected #SECApprovesNasdaqTexasCommodityTrustRule #ECBRaisesRatesSecondTimeTo2.5% #Binance #ChartSniper
SAGA évolue près de 0,0142 $, en baisse d’environ 3–4 % sur 24H. Le prix reste sous la résistance récente à 0,0150 $, montrant une pression baissière après un rejet.
🔴 ENTRÉE SHORT : 0,01420$
🛑 SL : 0,01480$
🎯 TP1 : 0,01370$
🎯 TP2 : 0,01320$
🎯 TP3 : 0,01280$
⚡ L’entrée est exécutable au prix actuel du marché.
⚠️ Ceci ne constitue pas un conseil financier. Gérez le risque avec prudence.
@Binance Square Official #USAugustPPIRisesLessThanExpected #SECApprovesNasdaqTexasCommodityTrustRule #ECBRaisesRatesSecondTimeTo2.5% #Binance #ChartSniper
127
·
--
Article
NEAR Protocol Replie Après un Sommet Récent — Le Pont de la Tendance Haussière Tient-Il Encore ?$NEAR
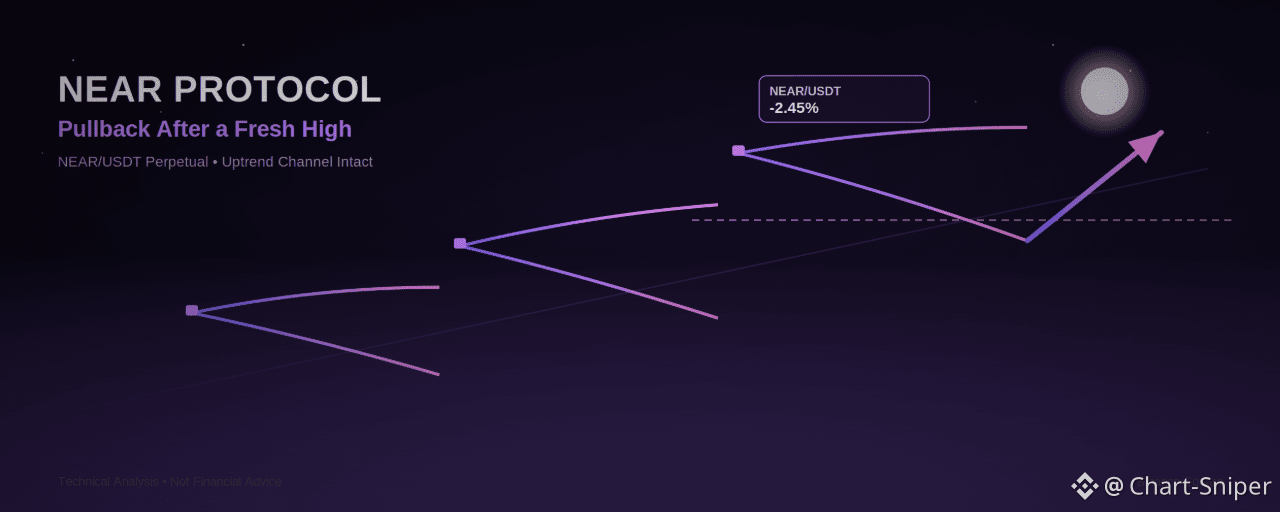
NEAR (NEAR/USDT Perpétuel) se refroidit après avoir touché un nouveau sommet local. Sur le graphique 1H, le prix a ouvert à 2.616, a fait une pointe à 2.639, puis a été vendu jusqu’à un plus bas de 2.526 avant de se stabiliser autour de 2.552, ce qui correspond à une bougie en baisse de -2.45%. Après une forte reprise multi-jours partie du plus bas de début septembre, cela ressemble à un simple repli de routine à l’intérieur d’une tendance haussière qui reste intacte, plutôt qu’à un changement de tendance — mais les prochaines bougies sur l’actuel palier de support révéleront la véritable histoire.
Lire la Structure
Le mouvement plus large sur ce graphique est une impulsion de reprise propre : le prix a formé un plus bas (Lower Low, LL) près de 1.882, a rebondi vers une zone de plus haut (Lower High, LH), a redescendu une nouvelle fois, puis a franchi nettement à la hausse pour entrer dans une séquence de plus hauts (Higher Highs, HH) — d’abord en testant une résistance dans la fourchette des 2.30–2.40 (la boîte « Retracement Area » sur le graphique), en consolidant là, puis en se propulsant vers le dernier HH à 2.639.
NEAR Protocol Replie Après un Sommet Récent — Le Pont de la Tendance Haussière Tient-Il Encore ?
$NEAR
NEAR (NEAR/USDT Perpétuel) se refroidit après avoir touché un nouveau sommet local. Sur le graphique 1H, le prix a ouvert à 2.616, a fait une pointe à 2.639, puis a été vendu jusqu’à un plus bas de 2.526 avant de se stabiliser autour de 2.552, ce qui correspond à une bougie en baisse de -2.45%. Après une forte reprise multi-jours partie du plus bas de début septembre, cela ressemble à un simple repli de routine à l’intérieur d’une tendance haussière qui reste intacte, plutôt qu’à un changement de tendance — mais les prochaines bougies sur l’actuel palier de support révéleront la véritable histoire.
Lire la Structure
Le mouvement plus large sur ce graphique est une impulsion de reprise propre : le prix a formé un plus bas (Lower Low, LL) près de 1.882, a rebondi vers une zone de plus haut (Lower High, LH), a redescendu une nouvelle fois, puis a franchi nettement à la hausse pour entrer dans une séquence de plus hauts (Higher Highs, HH) — d’abord en testant une résistance dans la fourchette des 2.30–2.40 (la boîte « Retracement Area » sur le graphique), en consolidant là, puis en se propulsant vers le dernier HH à 2.639.
NEAR (NEAR/USDT Perpétuel) se refroidit après avoir touché un nouveau sommet local. Sur le graphique 1H, le prix a ouvert à 2.616, a fait une pointe à 2.639, puis a été vendu jusqu’à un plus bas de 2.526 avant de se stabiliser autour de 2.552, ce qui correspond à une bougie en baisse de -2.45%. Après une forte reprise multi-jours partie du plus bas de début septembre, cela ressemble à un simple repli de routine à l’intérieur d’une tendance haussière qui reste intacte, plutôt qu’à un changement de tendance — mais les prochaines bougies sur l’actuel palier de support révéleront la véritable histoire.
Lire la Structure
Le mouvement plus large sur ce graphique est une impulsion de reprise propre : le prix a formé un plus bas (Lower Low, LL) près de 1.882, a rebondi vers une zone de plus haut (Lower High, LH), a redescendu une nouvelle fois, puis a franchi nettement à la hausse pour entrer dans une séquence de plus hauts (Higher Highs, HH) — d’abord en testant une résistance dans la fourchette des 2.30–2.40 (la boîte « Retracement Area » sur le graphique), en consolidant là, puis en se propulsant vers le dernier HH à 2.639.
74
·
--
Article
Siacoin brise la structure : SC/USDT se prépare-t-il à viser un prochain plus haut ?$SC
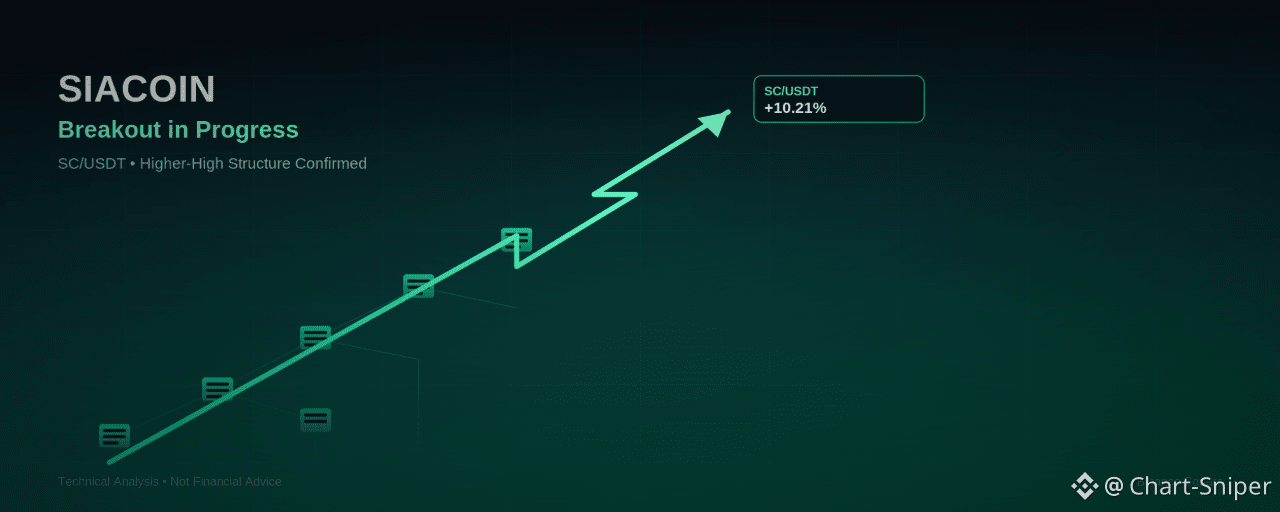
Siacoin (SC/USDT) est de nouveau sous les projecteurs des traders après un mouvement brutal en intraday. Sur le graphique 1H, le prix est en hausse de +10,21 %, passant d’une ouverture à 0,000871 à un plus haut de 0,000993, avant de se calmer pour évoluer autour de 0,000961 au moment de la rédaction. Pour une crypto-monnaie qui a passé la majeure partie d’une semaine à évoluer de façon latérale dans une fourchette serrée, ce type de bougie d’expansion fait partie des mouvements qui apparaissent sur les écrans de « top gainer » — et la structure du marché derrière elle laisse penser que cela pourrait ne pas être un simple coup d’éclat sur une seule bougie.
Siacoin brise la structure : SC/USDT se prépare-t-il à viser un prochain plus haut ?
$SC
Siacoin (SC/USDT) est de nouveau sous les projecteurs des traders après un mouvement brutal en intraday. Sur le graphique 1H, le prix est en hausse de +10,21 %, passant d’une ouverture à 0,000871 à un plus haut de 0,000993, avant de se calmer pour évoluer autour de 0,000961 au moment de la rédaction. Pour une crypto-monnaie qui a passé la majeure partie d’une semaine à évoluer de façon latérale dans une fourchette serrée, ce type de bougie d’expansion fait partie des mouvements qui apparaissent sur les écrans de « top gainer » — et la structure du marché derrière elle laisse penser que cela pourrait ne pas être un simple coup d’éclat sur une seule bougie.
Siacoin (SC/USDT) est de nouveau sous les projecteurs des traders après un mouvement brutal en intraday. Sur le graphique 1H, le prix est en hausse de +10,21 %, passant d’une ouverture à 0,000871 à un plus haut de 0,000993, avant de se calmer pour évoluer autour de 0,000961 au moment de la rédaction. Pour une crypto-monnaie qui a passé la majeure partie d’une semaine à évoluer de façon latérale dans une fourchette serrée, ce type de bougie d’expansion fait partie des mouvements qui apparaissent sur les écrans de « top gainer » — et la structure du marché derrière elle laisse penser que cela pourrait ne pas être un simple coup d’éclat sur une seule bougie.
63
·
--
📊 $BANK USDT — CONFIGURATION TECHNIQUE
Le cours de BANK évolue près de 0,0353 $ et consolide autour d’un support après une récente volatilité. La zone des 0,0340 $ est un support clé, tandis que 0,0360–0,0370 $ constitue la première zone de résistance. Une reprise au-dessus de 0,036 $ peut ouvrir la voie vers 0,040 $.
🟢 ENTRÉE LONGUE : 0,03530 $
🛑 SL : 0,03380 $
🎯 TP1 : 0,03700 $
🎯 TP2 : 0,04000 $
🎯 TP3 : 0,04500 $
⚡ L’entrée est exécutable maintenant.
⚠️ Ceci ne constitue pas un conseil financier. Gérez le risque avec soin
@Binance_Square_Official #AEROSurges17%In24Hours #IranSaysItCapturedUSUnmannedSubmarine #SaudiHaltsSouthernEnergySitesAfterAttacks #Binance #ChartSniper
{future}(BANKUSDT)
📊 $BANK USDT — CONFIGURATION TECHNIQUE
Le cours de BANK évolue près de 0,0353 $ et consolide autour d’un support après une récente volatilité. La zone des 0,0340 $ est un support clé, tandis que 0,0360–0,0370 $ constitue la première zone de résistance. Une reprise au-dessus de 0,036 $ peut ouvrir la voie vers 0,040 $.
🟢 ENTRÉE LONGUE : 0,03530 $
🛑 SL : 0,03380 $
🎯 TP1 : 0,03700 $
🎯 TP2 : 0,04000 $
🎯 TP3 : 0,04500 $
⚡ L’entrée est exécutable maintenant.
⚠️ Ceci ne constitue pas un conseil financier. Gérez le risque avec soin
@Binance Square Official #AEROSurges17%In24Hours #IranSaysItCapturedUSUnmannedSubmarine #SaudiHaltsSouthernEnergySitesAfterAttacks #Binance #ChartSniper
Le cours de BANK évolue près de 0,0353 $ et consolide autour d’un support après une récente volatilité. La zone des 0,0340 $ est un support clé, tandis que 0,0360–0,0370 $ constitue la première zone de résistance. Une reprise au-dessus de 0,036 $ peut ouvrir la voie vers 0,040 $.
🟢 ENTRÉE LONGUE : 0,03530 $
🛑 SL : 0,03380 $
🎯 TP1 : 0,03700 $
🎯 TP2 : 0,04000 $
🎯 TP3 : 0,04500 $
⚡ L’entrée est exécutable maintenant.
⚠️ Ceci ne constitue pas un conseil financier. Gérez le risque avec soin
@Binance Square Official #AEROSurges17%In24Hours #IranSaysItCapturedUSUnmannedSubmarine #SaudiHaltsSouthernEnergySitesAfterAttacks #Binance #ChartSniper
303
·
--
📈 PI USDT — CONFIGURATION LONGUE
PI s’échange près de 0,09635 $, affichant une dynamique haussière modérée. Le prix se maintient autour de la zone de support des 0,096 $, tandis qu’une cassure au-dessus de 0,100 $ pourrait renforcer la configuration de continuation.
🟢 ENTRÉE LONGUE : 0,09635 $
🛑 SL : 0,09200 $
🎯 TP1 : 0,10000 $
🎯 TP2 : 0,10500 $
🎯 TP3 : 0,11200 $
⚡ Entrée : Prix actuel du marché
⚠️ Ceci n’est pas un conseil financier. Gérez le risque avec soin.
@Binance_Square_Official #IranSaysItCapturedUSUnmannedSubmarine #AEROSurges17%In24Hours #SaudiHaltsSouthernEnergySitesAfterAttacks #Binance #ChartSniper
📈 PI USDT — CONFIGURATION LONGUE
PI s’échange près de 0,09635 $, affichant une dynamique haussière modérée. Le prix se maintient autour de la zone de support des 0,096 $, tandis qu’une cassure au-dessus de 0,100 $ pourrait renforcer la configuration de continuation.
🟢 ENTRÉE LONGUE : 0,09635 $
🛑 SL : 0,09200 $
🎯 TP1 : 0,10000 $
🎯 TP2 : 0,10500 $
🎯 TP3 : 0,11200 $
⚡ Entrée : Prix actuel du marché
⚠️ Ceci n’est pas un conseil financier. Gérez le risque avec soin.
@Binance Square Official #IranSaysItCapturedUSUnmannedSubmarine #AEROSurges17%In24Hours #SaudiHaltsSouthernEnergySitesAfterAttacks #Binance #ChartSniper
PI s’échange près de 0,09635 $, affichant une dynamique haussière modérée. Le prix se maintient autour de la zone de support des 0,096 $, tandis qu’une cassure au-dessus de 0,100 $ pourrait renforcer la configuration de continuation.
🟢 ENTRÉE LONGUE : 0,09635 $
🛑 SL : 0,09200 $
🎯 TP1 : 0,10000 $
🎯 TP2 : 0,10500 $
🎯 TP3 : 0,11200 $
⚡ Entrée : Prix actuel du marché
⚠️ Ceci n’est pas un conseil financier. Gérez le risque avec soin.
@Binance Square Official #IranSaysItCapturedUSUnmannedSubmarine #AEROSurges17%In24Hours #SaudiHaltsSouthernEnergySitesAfterAttacks #Binance #ChartSniper
50
·
--
📈 $XRP USDT — CONFIGURATION LONGUE
XRP est autour de 1,42 $, avec un RSI proche de 57 et la plupart des moyennes mobiles donnant un signal d’achat. Le prix se maintient au-dessus de la zone des 1,40 $, ce qui soutient une configuration de continuation haussière.
🟢 ENTRÉE LONGUE : 1,42 $
🛑 SL : 1,38 $
🎯 TP1 : 1,47 $
🎯 TP2 : 1,55 $
🎯 TP3 : 1,68 $
⚡ L’entrée est exécutable au prix actuel du marché.
⚠️ Ceci n’est pas un conseil financier. Gérez le risque avec prudence.
@Binance_Square_Official #AEROSurges17%In24Hours #IranSaysItCapturedUSUnmannedSubmarine #SaudiHaltsSouthernEnergySitesAfterAttacks #Binance #ChartSniper
{future}(XRPUSDT)
📈 $XRP USDT — CONFIGURATION LONGUE
XRP est autour de 1,42 $, avec un RSI proche de 57 et la plupart des moyennes mobiles donnant un signal d’achat. Le prix se maintient au-dessus de la zone des 1,40 $, ce qui soutient une configuration de continuation haussière.
🟢 ENTRÉE LONGUE : 1,42 $
🛑 SL : 1,38 $
🎯 TP1 : 1,47 $
🎯 TP2 : 1,55 $
🎯 TP3 : 1,68 $
⚡ L’entrée est exécutable au prix actuel du marché.
⚠️ Ceci n’est pas un conseil financier. Gérez le risque avec prudence.
@Binance Square Official #AEROSurges17%In24Hours #IranSaysItCapturedUSUnmannedSubmarine #SaudiHaltsSouthernEnergySitesAfterAttacks #Binance #ChartSniper
XRP est autour de 1,42 $, avec un RSI proche de 57 et la plupart des moyennes mobiles donnant un signal d’achat. Le prix se maintient au-dessus de la zone des 1,40 $, ce qui soutient une configuration de continuation haussière.
🟢 ENTRÉE LONGUE : 1,42 $
🛑 SL : 1,38 $
🎯 TP1 : 1,47 $
🎯 TP2 : 1,55 $
🎯 TP3 : 1,68 $
⚡ L’entrée est exécutable au prix actuel du marché.
⚠️ Ceci n’est pas un conseil financier. Gérez le risque avec prudence.
@Binance Square Official #AEROSurges17%In24Hours #IranSaysItCapturedUSUnmannedSubmarine #SaudiHaltsSouthernEnergySitesAfterAttacks #Binance #ChartSniper
79
·
--
🔥 $DOT USDT — CRYPTO HOT TOP
DOT affiche une forte dynamique, se négociant près de 1,08 $ et en hausse de plus de 10 % aujourd’hui. Le prix pousse vers la zone de résistance 1,10–1,12 $ ; rester au-dessus de 1,00 $ maintient la structure haussière à court terme.
🟢 ENTRÉE LONGUE : 1,08 $
🛑 SL : 1,00 $
🎯 TP1 : 1,15 $
🎯 TP2 : 1,22 $
🎯 TP3 : 1,30 $
⚡ Signal : forte dynamique
⚠️ Ceci n’est pas un conseil financier. Gérez le risque avec prudence.
@Binance_Square_Official #USIranTradeTankerStrikesEscalate #CanadaToImpose15%To50%TariffsOnUSGoods #ZcashRises45%WeeklyToHighestSince2016 #Binance #ChartSniper
{future}(DOTUSDT)
🔥 $DOT USDT — CRYPTO HOT TOP
DOT affiche une forte dynamique, se négociant près de 1,08 $ et en hausse de plus de 10 % aujourd’hui. Le prix pousse vers la zone de résistance 1,10–1,12 $ ; rester au-dessus de 1,00 $ maintient la structure haussière à court terme.
🟢 ENTRÉE LONGUE : 1,08 $
🛑 SL : 1,00 $
🎯 TP1 : 1,15 $
🎯 TP2 : 1,22 $
🎯 TP3 : 1,30 $
⚡ Signal : forte dynamique
⚠️ Ceci n’est pas un conseil financier. Gérez le risque avec prudence.
@Binance Square Official #USIranTradeTankerStrikesEscalate #CanadaToImpose15%To50%TariffsOnUSGoods #ZcashRises45%WeeklyToHighestSince2016 #Binance #ChartSniper
DOT affiche une forte dynamique, se négociant près de 1,08 $ et en hausse de plus de 10 % aujourd’hui. Le prix pousse vers la zone de résistance 1,10–1,12 $ ; rester au-dessus de 1,00 $ maintient la structure haussière à court terme.
🟢 ENTRÉE LONGUE : 1,08 $
🛑 SL : 1,00 $
🎯 TP1 : 1,15 $
🎯 TP2 : 1,22 $
🎯 TP3 : 1,30 $
⚡ Signal : forte dynamique
⚠️ Ceci n’est pas un conseil financier. Gérez le risque avec prudence.
@Binance Square Official #USIranTradeTankerStrikesEscalate #CanadaToImpose15%To50%TariffsOnUSGoods #ZcashRises45%WeeklyToHighestSince2016 #Binance #ChartSniper
129
Connectez-vous pour découvrir plus de contenu
Rejoignez la communauté mondiale des adeptes de cryptomonnaies sur Binance Square
⚡️ Suviez les dernières informations importantes sur les cryptomonnaies.
💬 Jugé digne de confiance par la plus grande plateforme d’échange de cryptomonnaies au monde.
👍 Découvrez les connaissances que partagent les créateurs vérifiés.
Adresse e-mail/Nº de téléphone
Sujets d’actualité
DotPlotSignalsOneMoreHikeIn2026
3,663 vues
117 mentions
💥$TRUMP — le récit se complique encore davantage maintenant.💥
Le président Trump continue de vendre un « dividende Trump » de 5 000 $ pour chaque adulte américain si les Républicains conservent le contrôle du Congrès : un plan qui nécessiterait l’approbation du Congrès et pourrait coûter bien plus de 1 000 milliards de dollars.
Mais voici la torsion : le contexte macro vient de se resserrer fortement.
La Fed a déjà relevé ses taux de 25 points de base, portant la fourchette cible à 3,75 %–4,00 %, et le dernier graphique des points indique une hausse supplémentaire en 2026. Les marchés doivent désormais composer avec des rendements plus élevés, un dollar plus fort et une liquidité plus contrainte.
Dans le même temps, le Sénat n’a pas réussi à faire avancer la loi CLARITY, laissant la régulation des cryptomonnaies américaines dans l’incertitude et ramenant sous les projecteurs des jetons liés politiquement.
Ainsi, le scénario autour de $TRUMP prend une forme à trois volets :
💥 Relance budgétaire → potentiellement favorable aux actifs à risque
💥 Taux plus élevés → défavorable à la liquidité
💥 Revers de la loi CLARITY → incertitude réglementaire accrue
Et non, à l’heure actuelle, aucun plan n’a été annoncé pour verser le dividende en TRUMP ou dans toute autre crypto.
Mais si les traders commencent à lier le récit du versement à des jetons associés à Trump, la spéculation pourrait revenir très rapidement.
$TRUMP se retrouve désormais à l’intersection de la politique, de la liquidité et de la réglementation — exactement là où la volatilité a tendance à exploser. 👀
#dotplotsignalsonemorehikein2026 #FedRateWatch #FedHikes25BpsUSStocksClose #ZcashRises6% #CryptoVCFundingRebounds$5.6BInQ2
KimHotbae
·2 mentions J’aime
·1.4k vues
FedHikes25BpsUSStocksClose
7,145 vues
141 mentions
AaveToLaunchRWAMarketOnAvalanche
447 vues
41 mentions