

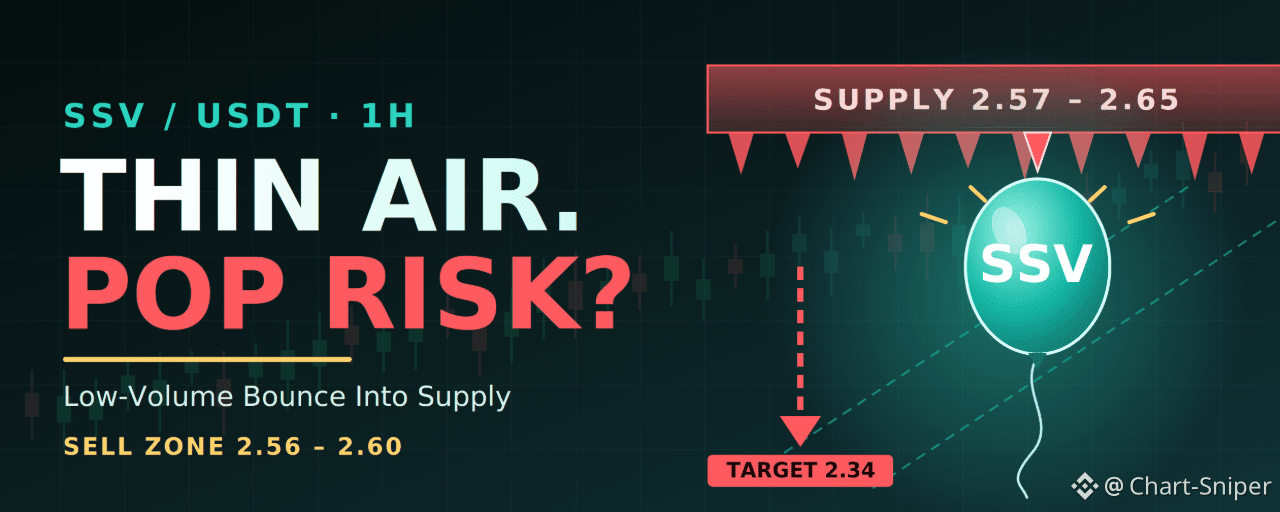


Chart: SSV/USDT, 1H, Binance. Last price 2.525 (+0.16%). Time: Oct 28, 20:06 UTC.
Short answer: bearish bias, but only on the right trigger. This looks like a weak counter-trend bounce inside a bigger downtrend. Selling the middle of the channel is not the trade. The cleaner shorts come at supply or after a breakdown.
Note on volume: you flagged low volume, and the chart image I was given doesn’t show a volume panel, so I’ve taken your read as given. Low volume behind a rally is a classic sign of weak conviction, but it only matters if price actually rejects.
What the chart shows
From October 24 to 27, SSV bled from about 2.62 down to a swing low near 2.35, which the chart marks as a Higher Low relative to the nearby structure. Since then it has climbed in a tidy rising channel, printing a Higher High near 2.54, with small pullbacks along the way.
Rising channel: price is riding inside two parallel rising lines. This kind of recovery after a hard drop often turns out to be a bear-flag-style bounce, not a trend change.
Supply box overhead: the marked zone sits at about 2.57–2.65, which is where the October 24 breakdown started.
Fib confluence: the retracement drawn on the left of the chart puts the 61.8% level near 2.56, the 50% near 2.58 and the 38.2% near 2.59. That stacks right inside the supply zone.
Bullish FVGs under price: the bounce left small gaps around 2.49–2.50, 2.52–2.53 and 2.43–2.45. They are short-term support, but each one is also a level where buyers can run out.
Why the bearish case makes sense
The bounce is up roughly 7% from the low and has run straight into stacked resistance: the supply box, the fib cluster and the old breakdown area. If volume is thin, as you noted, there is little buying pressure to push through that zone. A final push to about 2.57–2.60 followed by a rejection is the path your chart is drawn for.
Why it isn’t a sure thing
Price is still making higher highs and higher lows inside the channel, and it has not yet broken down. Shorting at 2.525 means betting against the current trend with no rejection yet. A strong close above 2.65 would break the supply box and cancel the bearish idea.
Trade plan
Setup A: short on rejection at supply (preferred)
Entry zone: 2.56–2.59, only after bearish rejection candles, such as upper wicks or a 1H close back below the zone
Stop loss: 2.63, above the fib cluster and the wick highs
TP1: 2.50
TP2: 2.45, the channel base area
TP3: 2.40
TP4: 2.34, near the Higher Low
Setup B: short on a channel breakdown
Trigger: a 1H candle close below the channel base and the 2.43–2.45 swing level
Entry: 2.42–2.44 on a failed retest from below
Stop loss: 2.48
Targets: 2.38, then 2.34, then 2.31
Optional aggressive long (counter to the bias)
Entry: 2.49–2.50 inside the FVG
Stop loss: 2.455
Target: 2.555, just under supply. Treat it as a quick scalp, not a swing.
Measured from a 2.575 entry to the 2.63 stop, TP1 pays about 1.4R, TP2 about 2.3R, TP3 about 3.2R and TP4 about 4.3R. Setup B pays about 1.1R at TP1 and about 2.0R at TP2. After TP1, consider moving the stop to breakeven.
What invalidates the bearish idea
A 1H close above 2.65, the top of the supply box, means sellers lost control of that zone. Stand aside or look for longs.
A fast break and hold above 2.60 before any rejection candle appears also weakens the case.
If price keeps printing higher lows along the channel and holds above 2.49, the bounce is stronger than it looks.
Live cross-check
I searched for a live SSV price, but results were scattered and mostly stale, ranging from roughly $2.01 to $11 depending on the source, and most pages showed no timestamp. A few figures around $2.25–$2.39 loosely bracket the chart’s range but are not confirmed. I used the timestamped Binance chart price of 2.525 as the reference. Confirm the current price on Binance before entering.
Bottom line
Bearish? Yes, conditionally. SSV is bouncing on thin volume into a stacked supply zone, so a rejection at 2.56–2.60 is the best short setup, with targets down to 2.34. Don’t short the mid-channel, and respect the stop above 2.63. A close above 2.65 cancels the whole idea.
⚠️ Disclaimer: This is not financial advice. This analysis is for educational and informational purposes only. Crypto markets are highly volatile, and you can lose your capital. Always do your own research, manage your risk, and never trade with money you can’t afford to lose.
@Binance Square Official #CanMicrosoftDeliverOnAI #CanGoogleDefindItsCore #EarningsSeason #Binance #ChartSniper