

BlockViz.xyz
245 Publications

BlockViz.xyz
Signaler
Bloquer l’utilisateur
Crypto price and market data analysis, visualizations, and portfolio simulations. Do your own at → blockviz.xyz
0 Suivis
3 Abonnés
8 J’aime
Publications
·
--
Voir la traduction
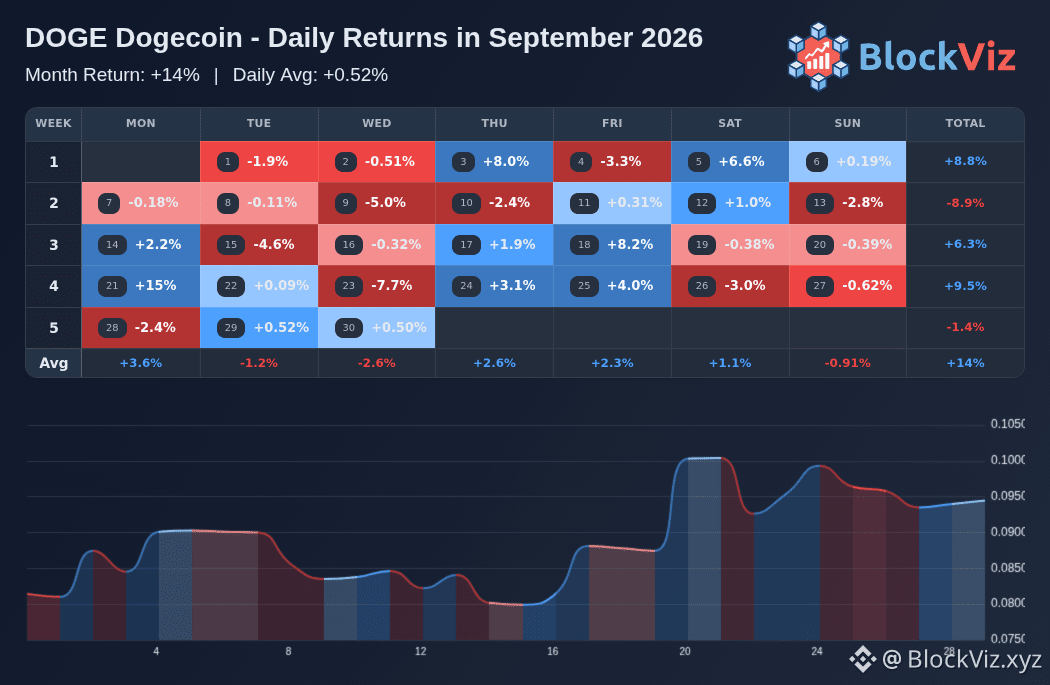
Dogecoin finished September 2026 at +14%. If you held only the best days, the return jumps to +62.0%, while missing them drops it to -29.7%. That tells you the month was driven by a handful of outsized sessions rather than smooth trend strength. The biggest upside day was 9/21/26 (+14.7%), and the roughest day was 9/23/26 (-7.7%) $DOGE
Dogecoin finished September 2026 at +14%. If you held only the best days, the return jumps to +62.0%, while missing them drops it to -29.7%. That tells you the month was driven by a handful of outsized sessions rather than smooth trend strength. The biggest upside day was 9/21/26 (+14.7%), and the roughest day was 9/23/26 (-7.7%) $DOGE
11
·
--
Voir la traduction
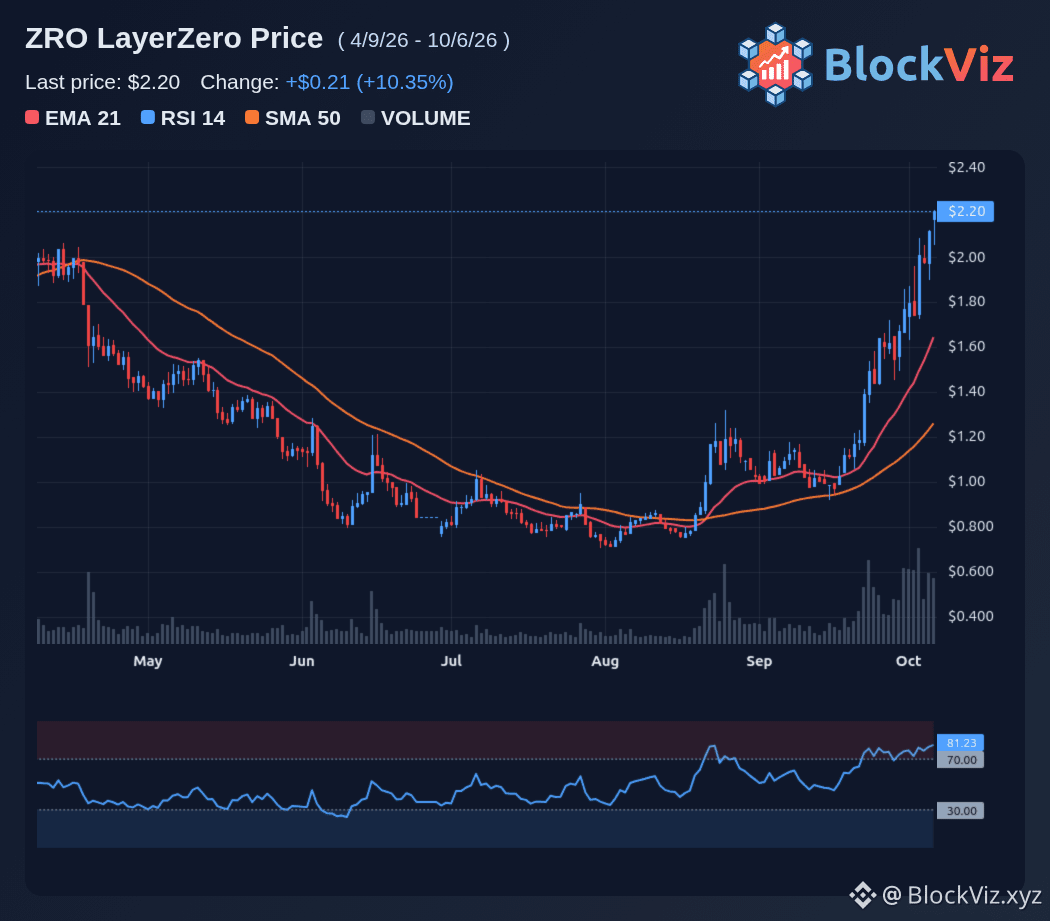
The altseason index just touched its yearly high at 64, and traders are asking which top 100 alt deserves a hold into 2027. ZRO is up 105% to 128% over the last 90 days, beating Bitcoin by a wide margin, but the index is still 11 points short of the 75 threshold that confirms a true altseason. That gap is the tension: we are in a transition zone where selective alts are ripping, but broad rotation has not kicked in yet. The setup favors quality over quantity. The top performers over 90 days include ENA at 207% to 212%, ZEC at 171% to 199%, UNI at 164% to 191%, ARB at 131% to 168%, NEAR at 127% to 167%, and ZRO at 104% to 128%. These are not random memecoins but protocols with clear catalysts: LayerZero's cross-chain messaging, Zcash's privacy resurgence, Uniswap's v4 launch, Arbitrum's L2 dominance, NEAR's AI and data availability push, and ENA's stablecoin yield engine. For traders, the question is which of these can hold into 2027 without giving back gains. ZRO sits in a sweet spot as the cross-chain infrastructure layer that benefits from multi-chain activity without needing to win the L1 wars. The risk is that a failure to break 75 on the index could see capital rotate back to BTC, pressuring alts that have already run hard. The key is whether ZRO can sustain its 100% plus outperformance as the index consolidates. Watch the altseason index at 64 and then 75 for confirmation, and monitor ZRO's hold above its breakout levels. A push above 75 would signal broad altseason and justify holding high-beta names into 2027, while a drop below 50 would suggest a BTC-led phase where selective alts with strong fundamentals like ZRO, ZEC, and UNI are the better hold. The next catalysts are the October monthly candle close and any follow-through in L2 and cross-chain volume to confirm the ZRO thesis. $ZRO
The altseason index just touched its yearly high at 64, and traders are asking which top 100 alt deserves a hold into 2027. ZRO is up 105% to 128% over the last 90 days, beating Bitcoin by a wide margin, but the index is still 11 points short of the 75 threshold that confirms a true altseason. That gap is the tension: we are in a transition zone where selective alts are ripping, but broad rotation has not kicked in yet. The setup favors quality over quantity. The top performers over 90 days include ENA at 207% to 212%, ZEC at 171% to 199%, UNI at 164% to 191%, ARB at 131% to 168%, NEAR at 127% to 167%, and ZRO at 104% to 128%. These are not random memecoins but protocols with clear catalysts: LayerZero's cross-chain messaging, Zcash's privacy resurgence, Uniswap's v4 launch, Arbitrum's L2 dominance, NEAR's AI and data availability push, and ENA's stablecoin yield engine. For traders, the question is which of these can hold into 2027 without giving back gains. ZRO sits in a sweet spot as the cross-chain infrastructure layer that benefits from multi-chain activity without needing to win the L1 wars. The risk is that a failure to break 75 on the index could see capital rotate back to BTC, pressuring alts that have already run hard. The key is whether ZRO can sustain its 100% plus outperformance as the index consolidates. Watch the altseason index at 64 and then 75 for confirmation, and monitor ZRO's hold above its breakout levels. A push above 75 would signal broad altseason and justify holding high-beta names into 2027, while a drop below 50 would suggest a BTC-led phase where selective alts with strong fundamentals like ZRO, ZEC, and UNI are the better hold. The next catalysts are the October monthly candle close and any follow-through in L2 and cross-chain volume to confirm the ZRO thesis. $ZRO
60
·
--
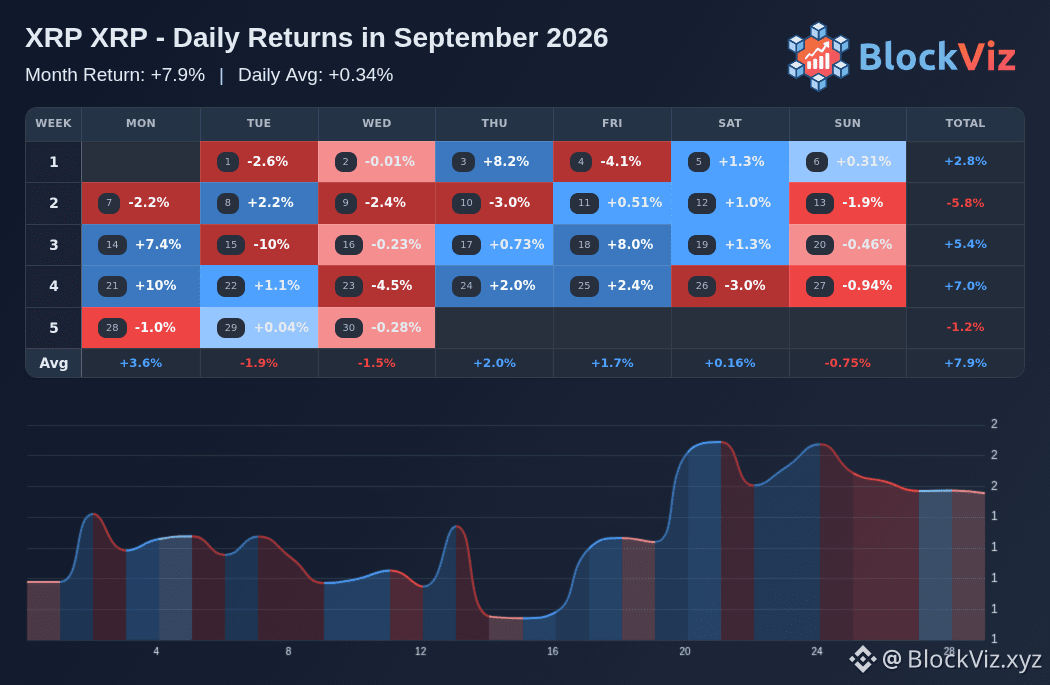
XRP a terminé septembre 2026 à +7,9 %. Si vous n’aviez conservé votre position que pendant les meilleures journées, le rendement grimperait à +53,3 %, tandis que les manquer le ferait chuter à -29,6 %. Cela montre que le mois a été porté par quelques séances exceptionnellement fortes, plutôt que par une tendance régulière. La meilleure journée a été le 21/09/26 (+10,4 %), et la pire, le 15/09/26 (-10,2 %) $XRP
XRP a terminé septembre 2026 à +7,9 %. Si vous n’aviez conservé votre position que pendant les meilleures journées, le rendement grimperait à +53,3 %, tandis que les manquer le ferait chuter à -29,6 %. Cela montre que le mois a été porté par quelques séances exceptionnellement fortes, plutôt que par une tendance régulière. La meilleure journée a été le 21/09/26 (+10,4 %), et la pire, le 15/09/26 (-10,2 %) $XRP
60
·
--
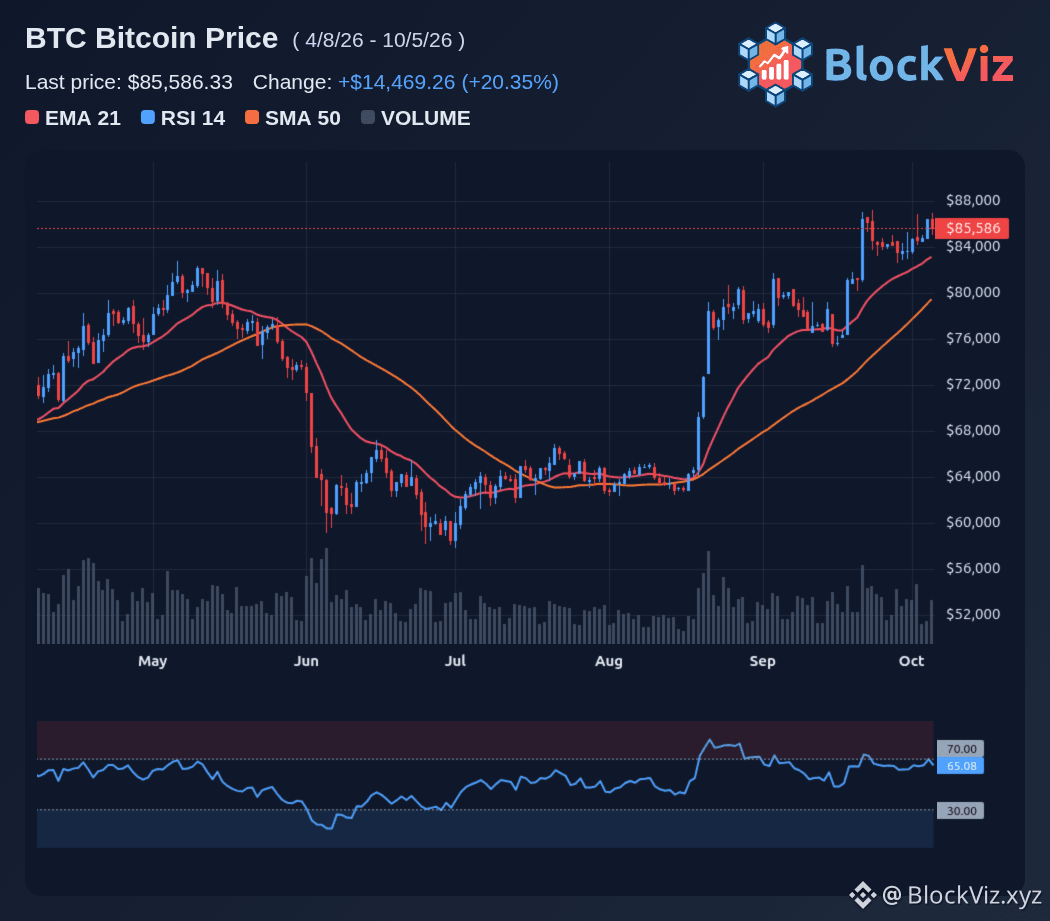
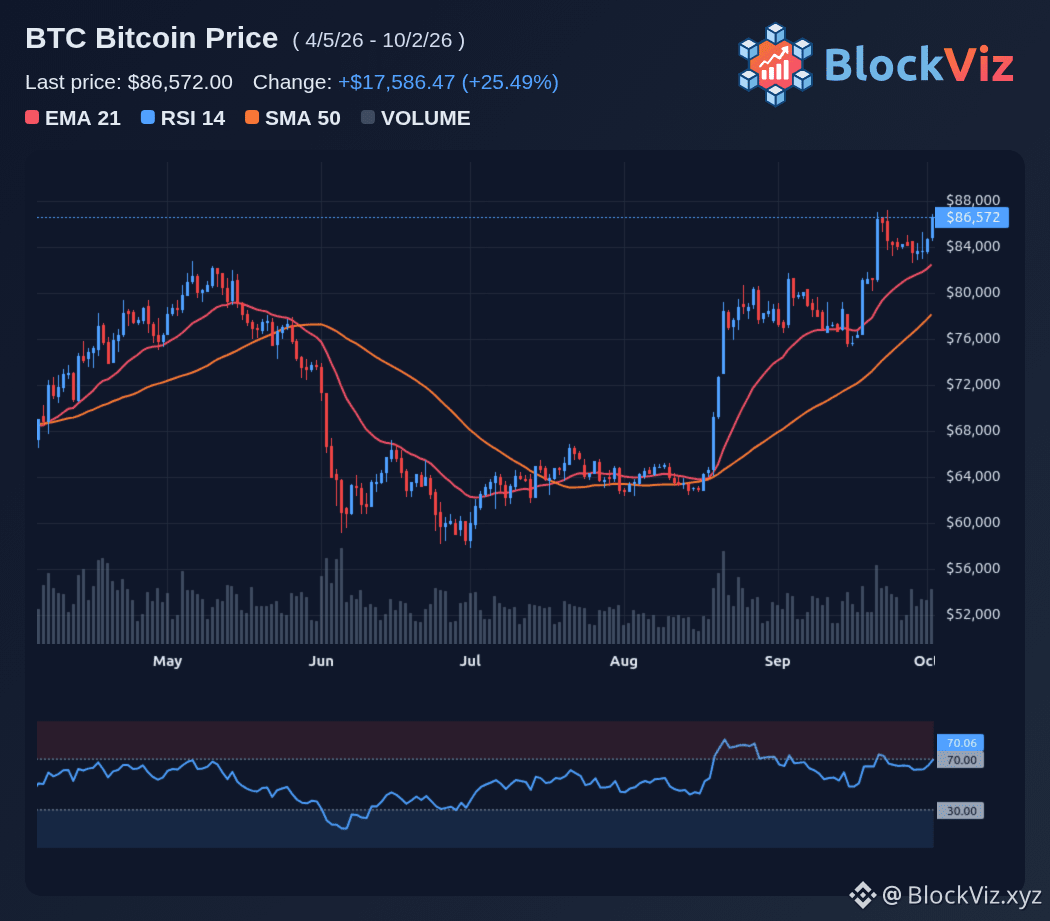
Bitcoin vient d’enregistrer sa meilleure clôture hebdomadaire en huit mois, à 86 532, et le marché se demande s’il s’agit d’une cassure ou d’un piège. La dernière fois que le BTC a clôturé la semaine à un niveau aussi élevé, fin janvier, il a chuté de 30 % au printemps avant de trouver un plancher. C’est pourquoi les traders surveillent de près la zone de résistance comprise entre 86 700 et 87 570, le cours d’ouverture annuel de 2026, à 87 570, faisant office de seuil psychologique clé. La tension oppose une structure hebdomadaire haussière au rejet des sommets de la fourchette. Le BTC a brièvement formé une mèche jusqu’à 87 000 après la clôture hebdomadaire, mais n’a pas réussi à repasser au-dessus du cours d’ouverture annuel, et ce pour la quatrième fois depuis le 21 septembre. Glassnode a relevé un recul de la domination des acheteurs par rapport à la mi-septembre, précisant que l’essoufflement de la dynamique haussière ne signale pas un retournement de tendance imminent, mais suggère une consolidation avant la prochaine impulsion. Pour les traders, l’enjeu est de défendre les niveaux clés et de confirmer la cassure. Surveillez 86 700 comme résistance immédiate et 82 500 comme support clé. Une clôture franche au-dessus de 86 700 ouvrirait la voie vers 93 700, tandis qu’une cassure sous 82 500 pourrait ramener le cours dans la fourchette de 60 000 à 80 000 observée plus tôt en 2026. Le niveau de 85 000 constitue le pivot à court terme qui doit tenir pour que la tentative de cassure reste viable. Les prochains catalyseurs sont le compte rendu de la réunion du FOMC et la poursuite éventuelle des flux vers les ETF. Une cassure nette au-dessus de 87 395 confirmerait un nouveau sommet pour ce mouvement, tandis qu’un repli sous 84 000 remettrait l’ancienne fourchette à l’ordre du jour. La saisonnalité d’octobre ajoute une autre dimension : depuis 2013, le BTC a enregistré en moyenne une hausse de 18,7 % ce mois-là, mais les trois mois d’octobre dans le rouge nous rappellent que les performances passées ne garantissent pas les résultats futurs. $BTC
Bitcoin vient d’enregistrer sa meilleure clôture hebdomadaire en huit mois, à 86 532, et le marché se demande s’il s’agit d’une cassure ou d’un piège. La dernière fois que le BTC a clôturé la semaine à un niveau aussi élevé, fin janvier, il a chuté de 30 % au printemps avant de trouver un plancher. C’est pourquoi les traders surveillent de près la zone de résistance comprise entre 86 700 et 87 570, le cours d’ouverture annuel de 2026, à 87 570, faisant office de seuil psychologique clé. La tension oppose une structure hebdomadaire haussière au rejet des sommets de la fourchette. Le BTC a brièvement formé une mèche jusqu’à 87 000 après la clôture hebdomadaire, mais n’a pas réussi à repasser au-dessus du cours d’ouverture annuel, et ce pour la quatrième fois depuis le 21 septembre. Glassnode a relevé un recul de la domination des acheteurs par rapport à la mi-septembre, précisant que l’essoufflement de la dynamique haussière ne signale pas un retournement de tendance imminent, mais suggère une consolidation avant la prochaine impulsion. Pour les traders, l’enjeu est de défendre les niveaux clés et de confirmer la cassure. Surveillez 86 700 comme résistance immédiate et 82 500 comme support clé. Une clôture franche au-dessus de 86 700 ouvrirait la voie vers 93 700, tandis qu’une cassure sous 82 500 pourrait ramener le cours dans la fourchette de 60 000 à 80 000 observée plus tôt en 2026. Le niveau de 85 000 constitue le pivot à court terme qui doit tenir pour que la tentative de cassure reste viable. Les prochains catalyseurs sont le compte rendu de la réunion du FOMC et la poursuite éventuelle des flux vers les ETF. Une cassure nette au-dessus de 87 395 confirmerait un nouveau sommet pour ce mouvement, tandis qu’un repli sous 84 000 remettrait l’ancienne fourchette à l’ordre du jour. La saisonnalité d’octobre ajoute une autre dimension : depuis 2013, le BTC a enregistré en moyenne une hausse de 18,7 % ce mois-là, mais les trois mois d’octobre dans le rouge nous rappellent que les performances passées ne garantissent pas les résultats futurs. $BTC
46
·
--
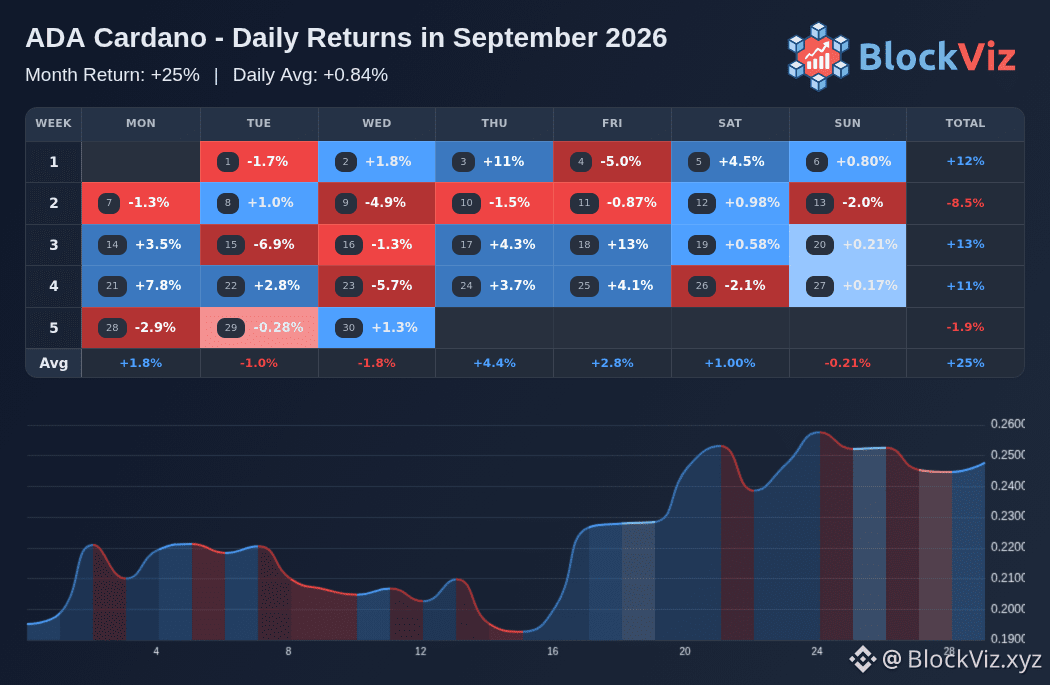
Cardano a terminé septembre 2026 à +25 %. Si vous n’aviez été investi que pendant les meilleures journées, le rendement aurait grimpé à +72,4 %, tandis que les manquer l’aurait fait chuter à -27,6 %. Cela montre que le mois a été porté par une poignée de séances exceptionnellement fortes plutôt que par une tendance régulière. La journée la plus haussière a été le 9/18/26 (+12,8 %), et la plus difficile, le 9/15/26 (-6,9 %) $ADA
Cardano a terminé septembre 2026 à +25 %. Si vous n’aviez été investi que pendant les meilleures journées, le rendement aurait grimpé à +72,4 %, tandis que les manquer l’aurait fait chuter à -27,6 %. Cela montre que le mois a été porté par une poignée de séances exceptionnellement fortes plutôt que par une tendance régulière. La journée la plus haussière a été le 9/18/26 (+12,8 %), et la plus difficile, le 9/15/26 (-6,9 %) $ADA
78
·
--
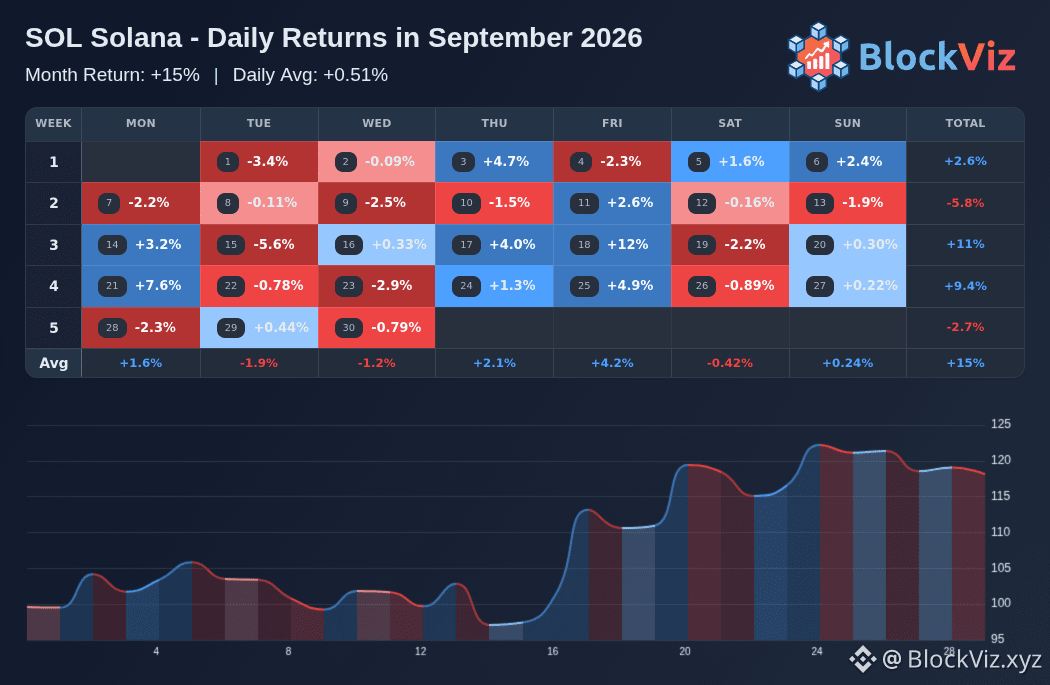
Solana a clôturé septembre 2026 à +15 %. Si vous n’aviez détenu que les meilleurs jours, le rendement grimpe à +52,9 %, tandis que les manquer le fait chuter à -25,1 %. Cela vous indique que le mois a été porté par quelques séances particulièrement marquantes plutôt que par une tendance régulière et solide. Le plus gros jour de hausse a été le 9/18/26 (+11,7 %), et le jour le plus difficile a été le 9/15/26 (-5,6 %) $SOL
Solana a clôturé septembre 2026 à +15 %. Si vous n’aviez détenu que les meilleurs jours, le rendement grimpe à +52,9 %, tandis que les manquer le fait chuter à -25,1 %. Cela vous indique que le mois a été porté par quelques séances particulièrement marquantes plutôt que par une tendance régulière et solide. Le plus gros jour de hausse a été le 9/18/26 (+11,7 %), et le jour le plus difficile a été le 9/15/26 (-5,6 %) $SOL
67
·
--
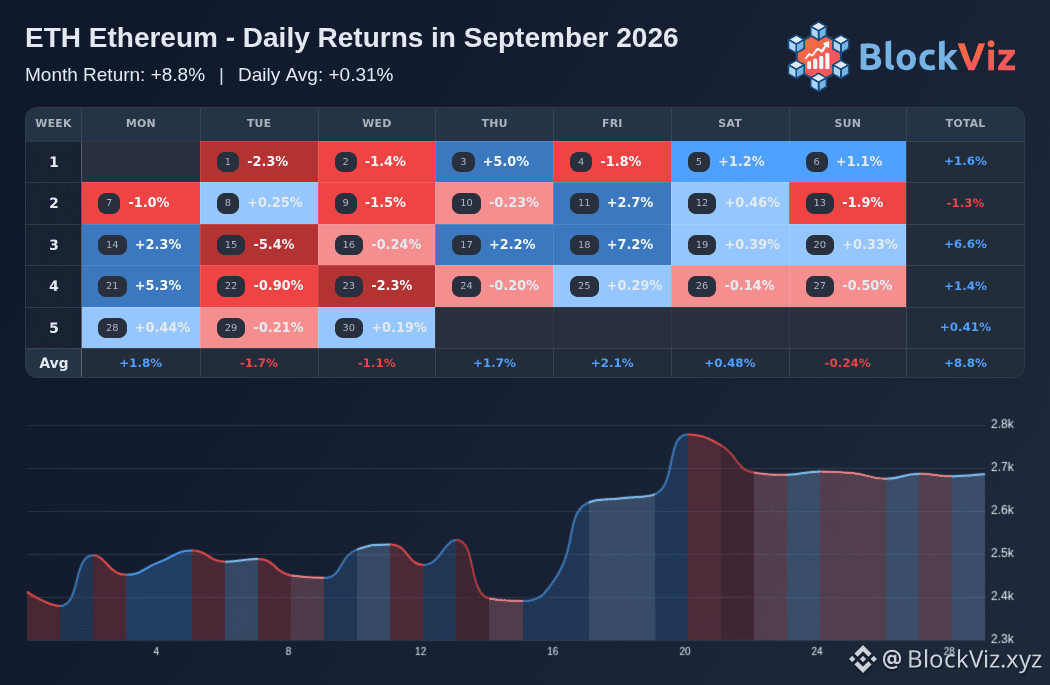
Ethereum a terminé septembre 2026 sur une hausse de +8,8 %. Si vous n’aviez conservé que les meilleurs jours, le rendement grimpe à +31,4 %, tandis que les rater fait chuter le chiffre à -17,2 %. Cela indique que le mois a été porté par quelques séances particulièrement marquantes plutôt que par une tendance régulière. Le plus fort jour à la hausse était le 18/09/26 (+7,2 %), et le pire jour était le 15/09/26 (-5,4 %) $ETH
Ethereum a terminé septembre 2026 sur une hausse de +8,8 %. Si vous n’aviez conservé que les meilleurs jours, le rendement grimpe à +31,4 %, tandis que les rater fait chuter le chiffre à -17,2 %. Cela indique que le mois a été porté par quelques séances particulièrement marquantes plutôt que par une tendance régulière. Le plus fort jour à la hausse était le 18/09/26 (+7,2 %), et le pire jour était le 15/09/26 (-5,4 %) $ETH
58
·
--
Voir la traduction
Weak jobs data just sank Fed hike odds to 17%, and Citi is back in the Bitcoin bull camp with a 113,000 dollar target. The September nonfarm payrolls print came in at 29,000 jobs, well below the 80,000 to 90,000 expected, and the unemployment rate ticked up to 4.2%. That combination has traders pricing out an October rate hike and back in a dovish Fed path, which is exactly the liquidity setup that has BTC ripping from 82,000 toward 86,000 to 87,000. The tension is between the macro bid and the speed of the move. Citi raised its 12-month target from 82,000 to 113,000, a 38% increase, citing stronger crypto activity, a supportive economic backdrop, and the return of ETF inflows. The bank expects about 5 billion in crypto investment product inflows over the next year, slower but steadier than the earlier boom, as financial advisers and brokerages gradually add Bitcoin to client portfolios. That is a far cry from the 10 billion inflow assumption Citi used before cutting its target in July. For traders, the question is how fast BTC can grind toward 113,000 and whether the path is linear. The 86,000 to 87,000 zone is the first resistance, with 88,000 to 90,000 as the next leg. A clean break above 90,000 would open the path to 100,000 and then the 113,000 target, while a failure at 88,000 could see a retest of 83,000 to 85,000. The key is whether ETF inflows sustain the bid and whether the Fed stays on hold as the labor market cools. Watch the 17% Fed hike odds and any shift toward a cut narrative, and monitor ETF flows for the next 5 billion in cumulative inflows. A dovish pivot would accelerate the timeline toward 113,000, while a hawkish surprise could delay the target into late 2027. The next catalysts are the October CPI print and any follow-through in BTC above 88,000 to confirm the bull le... $BTC
Weak jobs data just sank Fed hike odds to 17%, and Citi is back in the Bitcoin bull camp with a 113,000 dollar target. The September nonfarm payrolls print came in at 29,000 jobs, well below the 80,000 to 90,000 expected, and the unemployment rate ticked up to 4.2%. That combination has traders pricing out an October rate hike and back in a dovish Fed path, which is exactly the liquidity setup that has BTC ripping from 82,000 toward 86,000 to 87,000. The tension is between the macro bid and the speed of the move. Citi raised its 12-month target from 82,000 to 113,000, a 38% increase, citing stronger crypto activity, a supportive economic backdrop, and the return of ETF inflows. The bank expects about 5 billion in crypto investment product inflows over the next year, slower but steadier than the earlier boom, as financial advisers and brokerages gradually add Bitcoin to client portfolios. That is a far cry from the 10 billion inflow assumption Citi used before cutting its target in July. For traders, the question is how fast BTC can grind toward 113,000 and whether the path is linear. The 86,000 to 87,000 zone is the first resistance, with 88,000 to 90,000 as the next leg. A clean break above 90,000 would open the path to 100,000 and then the 113,000 target, while a failure at 88,000 could see a retest of 83,000 to 85,000. The key is whether ETF inflows sustain the bid and whether the Fed stays on hold as the labor market cools. Watch the 17% Fed hike odds and any shift toward a cut narrative, and monitor ETF flows for the next 5 billion in cumulative inflows. A dovish pivot would accelerate the timeline toward 113,000, while a hawkish surprise could delay the target into late 2027. The next catalysts are the October CPI print and any follow-through in BTC above 88,000 to confirm the bull le... $BTC
55
·
--
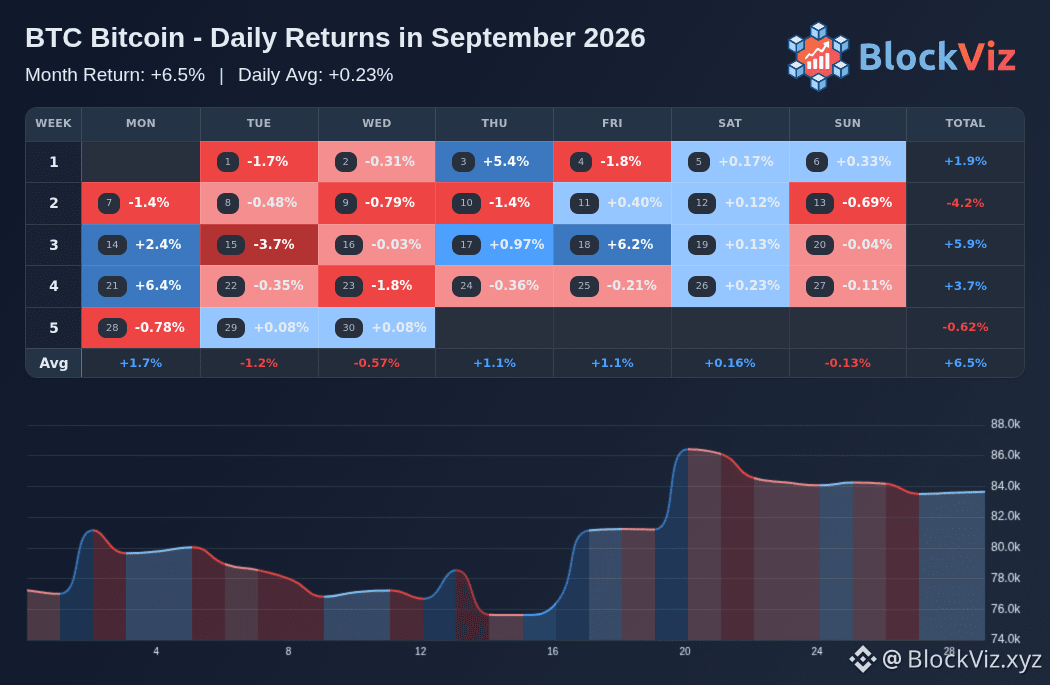
Bitcoin a clôturé septembre 2026 à +6,5 %. Si vous n’aviez détenu que les meilleurs jours, le rendement grimpe à +24,8 %, tandis que les manquer le ferait chuter à -14,7 %. Cela indique que le mois a été porté par quelques séances particulièrement marquantes plutôt que par une dynamique régulière. Le plus gros jour de hausse était le 21/09/26 (+6,4 %), et le jour le plus difficile était le 15/09/26 (-3,7 %) $BTC
Bitcoin a clôturé septembre 2026 à +6,5 %. Si vous n’aviez détenu que les meilleurs jours, le rendement grimpe à +24,8 %, tandis que les manquer le ferait chuter à -14,7 %. Cela indique que le mois a été porté par quelques séances particulièrement marquantes plutôt que par une dynamique régulière. Le plus gros jour de hausse était le 21/09/26 (+6,4 %), et le jour le plus difficile était le 15/09/26 (-3,7 %) $BTC
55
·
--
Voir la traduction
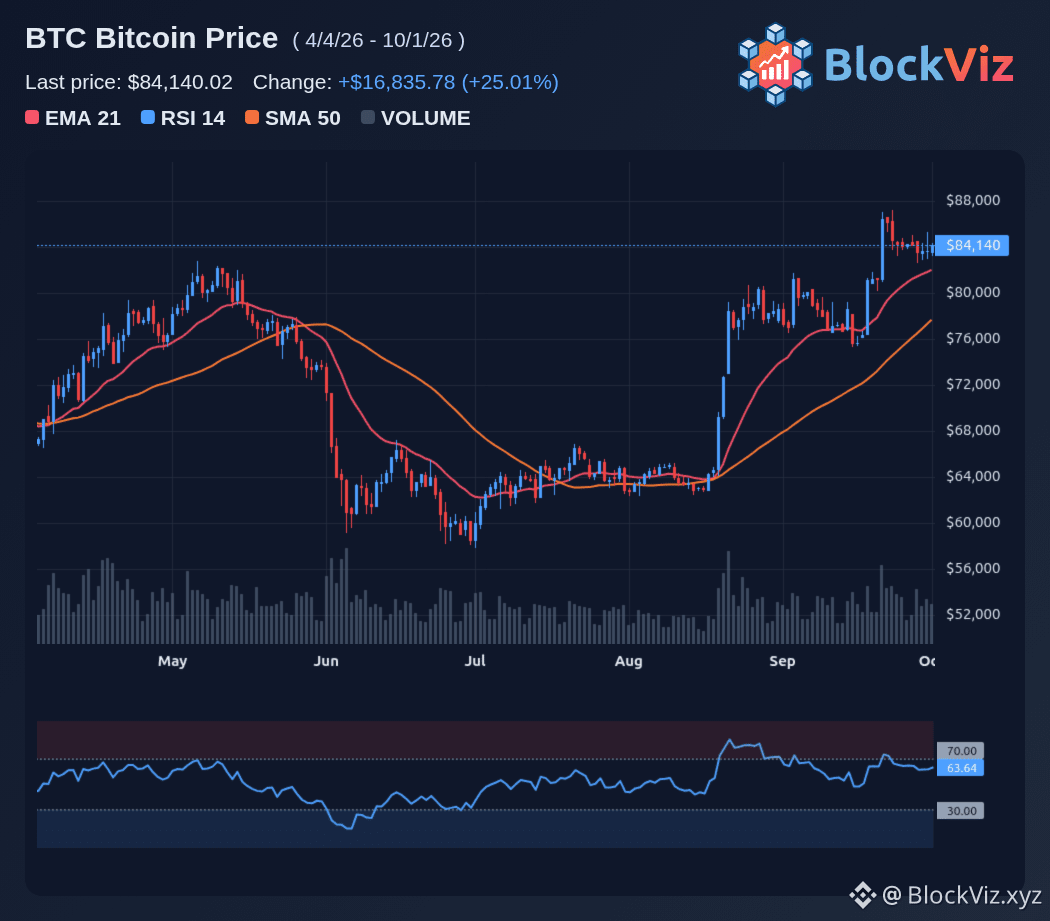
BTC is hovering around 82,000 to 84,000 after last week's 2.4 billion dollar ETF inflow surge, and the market is asking the obvious question. Who gets liquidated first on a 3% dip? The 82,000 level is the strongest nearby support, sitting near the ETF holder cost basis around 81,700 to 82,500 and the breakout zone from August that must hold for the bull case to stay intact. The tension is between leveraged longs and ETF buyers. Futures open interest sits around 52 billion, down 14% from recent peaks, but long liquidation clusters are stacked between 75,000 and 76,000 and then 60,000 to 63,000. A 3% dip from 83,000 would take BTC to roughly 80,500, testing the ETF breakeven and the corporate treasury cost basis near 80,500. That is where the first wave of long liquidations would hit, with the 75,000 to 76,000 zone acting as the next major support. For traders, the setup is about defense and flow. Watch 82,000 as the key pivot and 83,300 to 83,500 as immediate support. A break below 82,000 could open the path to 80,500 and then 78,000, with long liquidations accelerating into the 75,000 to 76,000 cluster. The ETF buyers are the marginal bid, and their 81,700 to 82,500 cost basis is the line that must hold to avoid a deeper flush. The next catalysts are the October monthly candle open and any follow-through in ETF flows. A hold above 82,000 with continued inflows would signal the breakout zone is solid, while a break below could trigger a 3% to 5% dip into 78,000 to 80,000 before the long liquidation cascade eases. Watch the liquidation heatmap for the 75,000 to 76,000 cluster and the 82,000 pivot for the next move. $BTC
BTC is hovering around 82,000 to 84,000 after last week's 2.4 billion dollar ETF inflow surge, and the market is asking the obvious question. Who gets liquidated first on a 3% dip? The 82,000 level is the strongest nearby support, sitting near the ETF holder cost basis around 81,700 to 82,500 and the breakout zone from August that must hold for the bull case to stay intact. The tension is between leveraged longs and ETF buyers. Futures open interest sits around 52 billion, down 14% from recent peaks, but long liquidation clusters are stacked between 75,000 and 76,000 and then 60,000 to 63,000. A 3% dip from 83,000 would take BTC to roughly 80,500, testing the ETF breakeven and the corporate treasury cost basis near 80,500. That is where the first wave of long liquidations would hit, with the 75,000 to 76,000 zone acting as the next major support. For traders, the setup is about defense and flow. Watch 82,000 as the key pivot and 83,300 to 83,500 as immediate support. A break below 82,000 could open the path to 80,500 and then 78,000, with long liquidations accelerating into the 75,000 to 76,000 cluster. The ETF buyers are the marginal bid, and their 81,700 to 82,500 cost basis is the line that must hold to avoid a deeper flush. The next catalysts are the October monthly candle open and any follow-through in ETF flows. A hold above 82,000 with continued inflows would signal the breakout zone is solid, while a break below could trigger a 3% to 5% dip into 78,000 to 80,000 before the long liquidation cascade eases. Watch the liquidation heatmap for the 75,000 to 76,000 cluster and the 82,000 pivot for the next move. $BTC
66
·
--
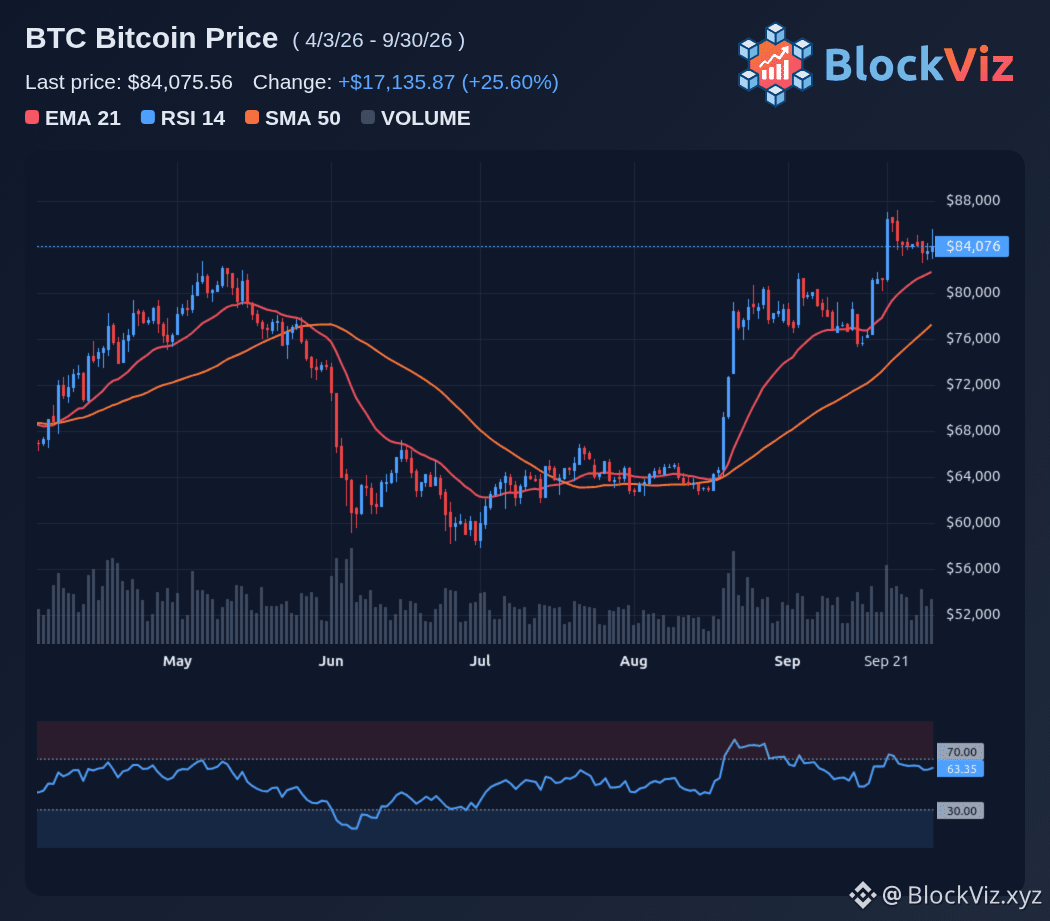
Uptober est de retour dans la conversation, mais l’histoire seule ne suffit pas à se fier à cette fois-ci. Le Bitcoin a clôturé dans le vert 10 fois sur les 13 derniers Octobres, avec un rendement moyen d’environ 19% et une médiane proche de 14%, mais 2025 a brisé une série de sept ans avec une perte de 4% et cette année s’accompagne de sérieux vents contraires macroéconomiques, entre des rendements élevés et un excès d’options. La tension se joue entre la saisonnalité et le contexte. Le BTC entre en octobre autour de 85 000 à 87 000 après avoir gagné environ 9% en septembre et quelque 25% en août, une rare combinaison consécutive dans le vert qui a souvent précédé de solides parcours d’Uptober. L’échéance des options de 18 milliards est désormais derrière nous, et le marché observe si la liquidité peut soutenir une poussée vers 90 000 à 100 000, ou si la prise de profits à des niveaux records plafonne le mouvement. Pour les traders, la question est de savoir si Uptober est un taux de base ou un piège. Le schéma affiche un taux de réussite de 76,9%, mais les trois Octobres rouges, dont 2018 et 2025, nous rappellent que la saisonnalité n’est pas une garantie. Le contexte de cette année est différent de 2025 : le BTC démarre à 85 000 au lieu de 114 000, et les flux de l’ETF ainsi que la liquidité en stablecoins apportent un soutien plus solide que la structure trop chargée de l’an dernier. Surveillez 88 000 à 90 000 pour la prochaine étape, puis 100 000 pour l’objectif d’Uptober. Une cassure nette au-dessus de 90 000 alignerait le mouvement sur le gain historique moyen d’octobre de 19%, tandis qu’un échec à 88 000 pourrait entraîner un test de 83 000 à 85 000. Les prochains catalyseurs sont l’ouverture de la bougie mensuelle d’octobre, toute continuité dans les entrées d’ETF, et la capacité du BTC à rester au-dessus de 85 000 pendant que se déroule le scénario d’Uptober. $BTC
Uptober est de retour dans la conversation, mais l’histoire seule ne suffit pas à se fier à cette fois-ci. Le Bitcoin a clôturé dans le vert 10 fois sur les 13 derniers Octobres, avec un rendement moyen d’environ 19% et une médiane proche de 14%, mais 2025 a brisé une série de sept ans avec une perte de 4% et cette année s’accompagne de sérieux vents contraires macroéconomiques, entre des rendements élevés et un excès d’options. La tension se joue entre la saisonnalité et le contexte. Le BTC entre en octobre autour de 85 000 à 87 000 après avoir gagné environ 9% en septembre et quelque 25% en août, une rare combinaison consécutive dans le vert qui a souvent précédé de solides parcours d’Uptober. L’échéance des options de 18 milliards est désormais derrière nous, et le marché observe si la liquidité peut soutenir une poussée vers 90 000 à 100 000, ou si la prise de profits à des niveaux records plafonne le mouvement. Pour les traders, la question est de savoir si Uptober est un taux de base ou un piège. Le schéma affiche un taux de réussite de 76,9%, mais les trois Octobres rouges, dont 2018 et 2025, nous rappellent que la saisonnalité n’est pas une garantie. Le contexte de cette année est différent de 2025 : le BTC démarre à 85 000 au lieu de 114 000, et les flux de l’ETF ainsi que la liquidité en stablecoins apportent un soutien plus solide que la structure trop chargée de l’an dernier. Surveillez 88 000 à 90 000 pour la prochaine étape, puis 100 000 pour l’objectif d’Uptober. Une cassure nette au-dessus de 90 000 alignerait le mouvement sur le gain historique moyen d’octobre de 19%, tandis qu’un échec à 88 000 pourrait entraîner un test de 83 000 à 85 000. Les prochains catalyseurs sont l’ouverture de la bougie mensuelle d’octobre, toute continuité dans les entrées d’ETF, et la capacité du BTC à rester au-dessus de 85 000 pendant que se déroule le scénario d’Uptober. $BTC
74
·
--
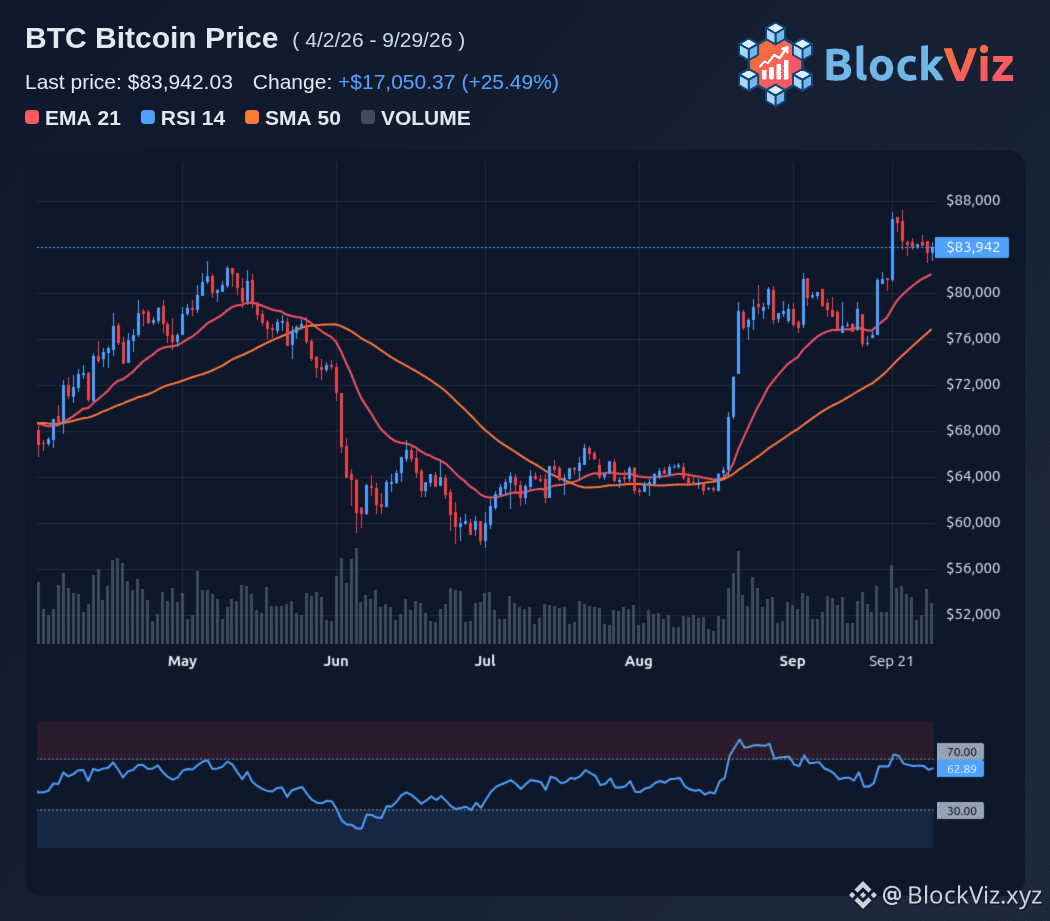
Le volume spot des altcoins vient de frôler près de quatre fois celui du Bitcoin, atteignant le ratio le plus élevé depuis septembre 2025, et cela pose une question difficile. Est-ce le début d’une altseason précoce ou simplement le carburant pour une dernière phase haussière du BTC ? L’Altcoin Season Index est monté à 62 % fin septembre : 72,5 % des altcoins ont surperformé le BTC sur la semaine se terminant le 22 septembre, mais l’indicateur reste sous le seuil de 75 % qui confirme une altseason complète. La tension réside entre le signal lié au volume et la positionnement. Glassnode note qu’une forte participation des altcoins a souvent coïncidé avec des sommets locaux du Bitcoin, et que les dépôts d’altcoins vers les exchanges ont grimpé à des niveaux observés pour la dernière fois avant le pic d’octobre 2025. Dans le même temps, l’intérêt ouvert des futures sur les altcoins n’a montré que peu de progression, contrairement aux sommets précédents du marché, qui avaient vu une montée des positions avec effet de levier. Ce mélange suggère une forte demande au comptant, mais pas encore un blow-off top sur les dérivés. Pour les traders, la configuration concerne la rotation et la gestion du risque. La dominance du Bitcoin est passée sous 59 % tandis que des capitaux se redirigeaient vers les altcoins, mais le BTC consolide encore près de 84 000 à 87 000 après son parcours depuis un niveau inférieur à 63 000 en août. La question est de savoir si les altcoins peuvent maintenir l’intérêt acheteur sans une percée décisive du BTC au-dessus de 88 000 à 90 000, ou si cette flambée de volume est un signal de distribution vers un sommet local. Surveillez l’Altcoin Season Index à 62, puis 75 % pour confirmation, et observez la dominance du BTC à 59 % pour la prochaine étape. Une cassure sous 58 % de dominance et une progression au-dessus de 75 % sur l’indice indiqueraient une véritable altseason, tandis qu’un rebond au-dessus de 60 % de dominance suggérerait que le BTC reste encore l’ancrage de la liquidité. Les prochains catalyseurs sont la clôture de la bougie mensuelle d’octobre et toute poursuite de l’intérêt ouvert des futures sur altcoins afin de confirmer si cette hausse de volume s’accompagne d’un levier. $BTC
Le volume spot des altcoins vient de frôler près de quatre fois celui du Bitcoin, atteignant le ratio le plus élevé depuis septembre 2025, et cela pose une question difficile. Est-ce le début d’une altseason précoce ou simplement le carburant pour une dernière phase haussière du BTC ? L’Altcoin Season Index est monté à 62 % fin septembre : 72,5 % des altcoins ont surperformé le BTC sur la semaine se terminant le 22 septembre, mais l’indicateur reste sous le seuil de 75 % qui confirme une altseason complète. La tension réside entre le signal lié au volume et la positionnement. Glassnode note qu’une forte participation des altcoins a souvent coïncidé avec des sommets locaux du Bitcoin, et que les dépôts d’altcoins vers les exchanges ont grimpé à des niveaux observés pour la dernière fois avant le pic d’octobre 2025. Dans le même temps, l’intérêt ouvert des futures sur les altcoins n’a montré que peu de progression, contrairement aux sommets précédents du marché, qui avaient vu une montée des positions avec effet de levier. Ce mélange suggère une forte demande au comptant, mais pas encore un blow-off top sur les dérivés. Pour les traders, la configuration concerne la rotation et la gestion du risque. La dominance du Bitcoin est passée sous 59 % tandis que des capitaux se redirigeaient vers les altcoins, mais le BTC consolide encore près de 84 000 à 87 000 après son parcours depuis un niveau inférieur à 63 000 en août. La question est de savoir si les altcoins peuvent maintenir l’intérêt acheteur sans une percée décisive du BTC au-dessus de 88 000 à 90 000, ou si cette flambée de volume est un signal de distribution vers un sommet local. Surveillez l’Altcoin Season Index à 62, puis 75 % pour confirmation, et observez la dominance du BTC à 59 % pour la prochaine étape. Une cassure sous 58 % de dominance et une progression au-dessus de 75 % sur l’indice indiqueraient une véritable altseason, tandis qu’un rebond au-dessus de 60 % de dominance suggérerait que le BTC reste encore l’ancrage de la liquidité. Les prochains catalyseurs sont la clôture de la bougie mensuelle d’octobre et toute poursuite de l’intérêt ouvert des futures sur altcoins afin de confirmer si cette hausse de volume s’accompagne d’un levier. $BTC
69
·
--
Voir la traduction
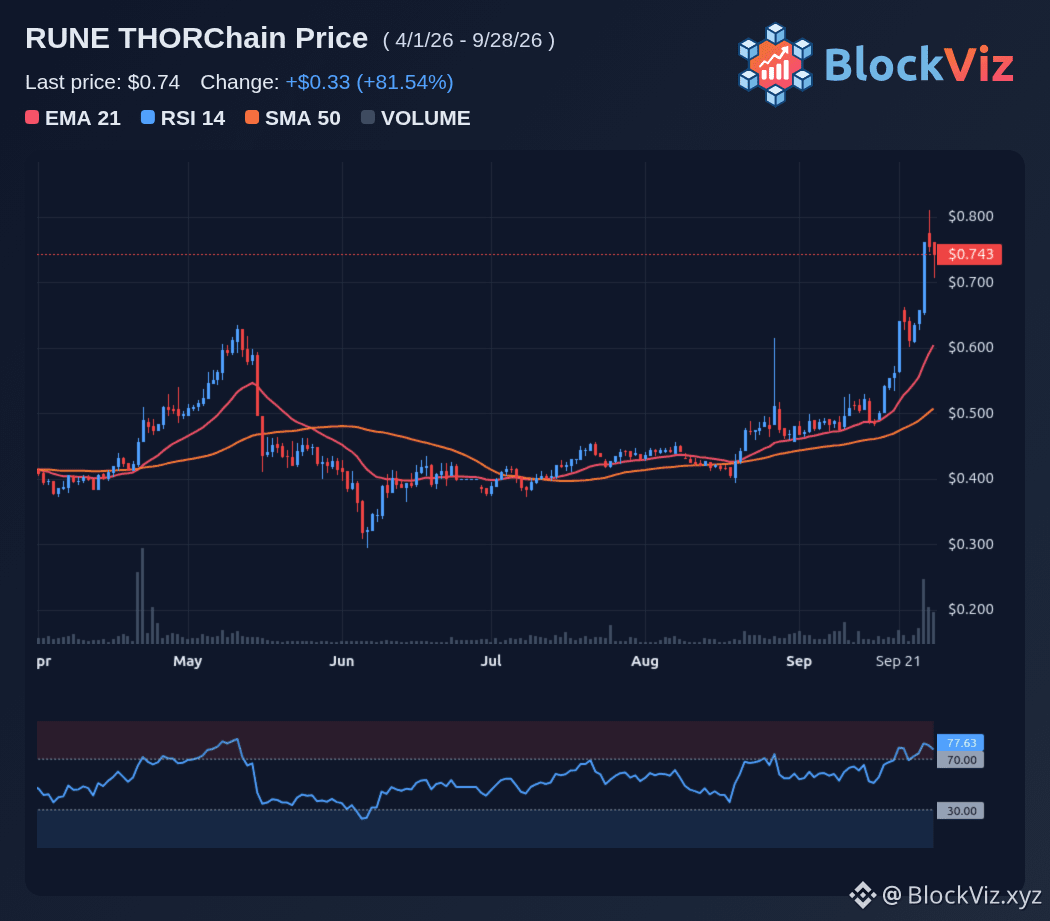
THORChain just drew a line in the sand over the 387.5 million dollar Bitget hack, and it is splitting the crypto community. The exchange asked the protocol to block wallets tied to the attacker, but THORChain said no, arguing that its emergency halt tools protect the network as a whole and are not meant to freeze individual addresses or swaps. That stance has reignited the oldest debate in crypto: is censorship resistance a feature or a bug when stolen funds are moving through your rails? The tension is real. Bitget CEO Gracy Chen called out THORChain publicly, saying decentralization is a design principle, not a shield for facilitating known stolen funds. THORChain pushed back, noting it retired its admin key in February 2025 and that its validators lack a switch to blacklist single addresses without compromising the permissionless model. The protocol pointed to its own May 2026 exploit, where it paused the network to contain a 10.7 million dollar loss but did not blacklist the attacker's wallets afterward. For traders, the setup is about narrative and flow. RUNE is up more than 20% in 24 hours as the market prices in a purity premium for a protocol that refuses to censor, even under pressure. The question is whether that bid holds once the dust settles and whether other DeFi primitives follow the same line. Watch RUNE around its recent breakout levels and monitor whether any node operators vote to pause Bitget-linked flows, which would signal a shift in the governance stance. The next catalysts are the ongoing on-chain movements of the stolen funds and any further statements from THORChain validators or Bitget. If the protocol holds firm, expect more capital to rotate into censorship-resistant narratives. If validators waver or coordinate a selective pause, the purity trade could reverse... $RUNE
THORChain just drew a line in the sand over the 387.5 million dollar Bitget hack, and it is splitting the crypto community. The exchange asked the protocol to block wallets tied to the attacker, but THORChain said no, arguing that its emergency halt tools protect the network as a whole and are not meant to freeze individual addresses or swaps. That stance has reignited the oldest debate in crypto: is censorship resistance a feature or a bug when stolen funds are moving through your rails? The tension is real. Bitget CEO Gracy Chen called out THORChain publicly, saying decentralization is a design principle, not a shield for facilitating known stolen funds. THORChain pushed back, noting it retired its admin key in February 2025 and that its validators lack a switch to blacklist single addresses without compromising the permissionless model. The protocol pointed to its own May 2026 exploit, where it paused the network to contain a 10.7 million dollar loss but did not blacklist the attacker's wallets afterward. For traders, the setup is about narrative and flow. RUNE is up more than 20% in 24 hours as the market prices in a purity premium for a protocol that refuses to censor, even under pressure. The question is whether that bid holds once the dust settles and whether other DeFi primitives follow the same line. Watch RUNE around its recent breakout levels and monitor whether any node operators vote to pause Bitget-linked flows, which would signal a shift in the governance stance. The next catalysts are the ongoing on-chain movements of the stolen funds and any further statements from THORChain validators or Bitget. If the protocol holds firm, expect more capital to rotate into censorship-resistant narratives. If validators waver or coordinate a selective pause, the purity trade could reverse... $RUNE
76
·
--
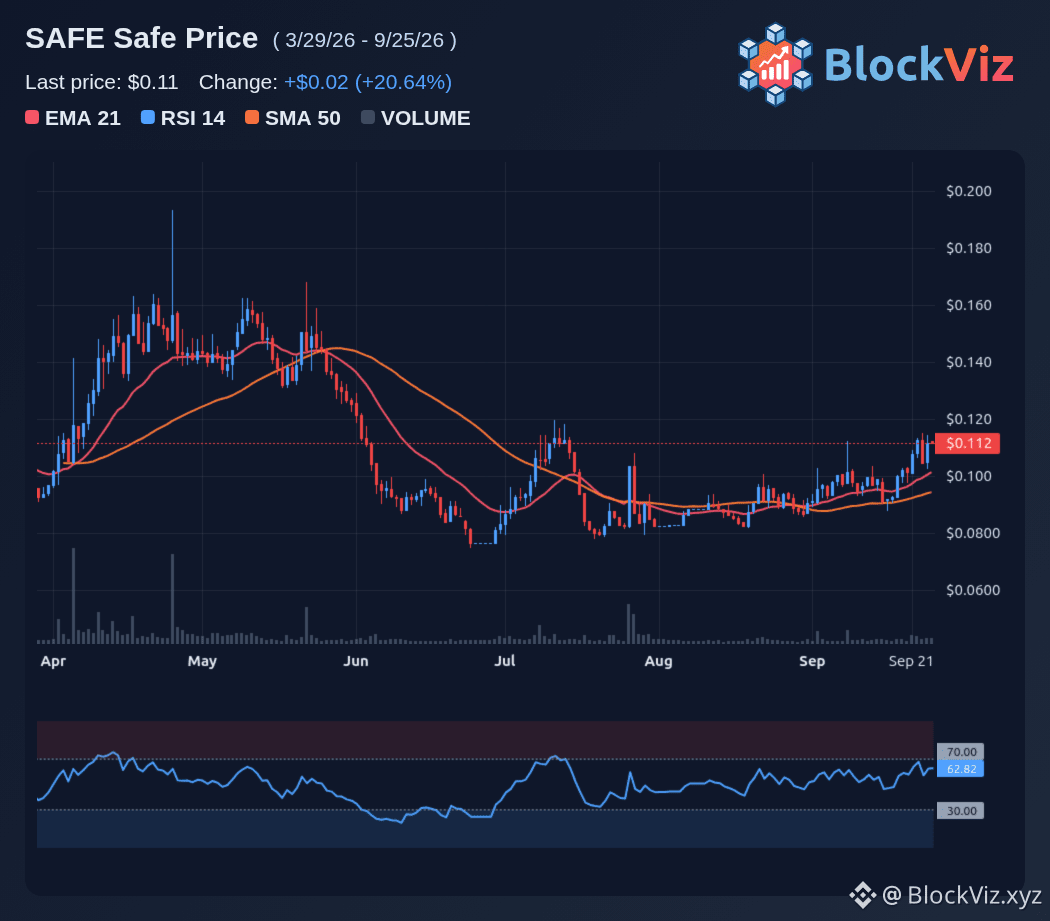
Bitget vient de confirmer une brèche de portefeuille chaud de 351,6 millions de dollars, a interrompu les retraits et le marché pose les questions évidentes. Qui a fait ça, comment est-il entré, et les fonds des utilisateurs sont-ils réellement en sécurité ? La plateforme affirme que oui pour le dernier point, en évoquant un fonds de protection des utilisateurs de 464 millions de dollars qui couvre l’intégralité de la perte, mais le vecteur d’attaque reste inconnu en attendant un rapport d’incident complet. La tension réside entre le mécanisme de secours et l’inconnu. La PDG Gracy Chen a déclaré que la brèche était limitée à une partie des couches de portefeuilles chauds et tièdes dans l’architecture en trois niveaux de Bitget, tandis que les portefeuilles froids sont restés intacts et que les soldes des comptes utilisateurs étaient exacts. Les dépôts et le trading sont toujours en direct, mais les retraits sont gelés jusqu’à la fin de l’examen de sécurité. C’est une distinction critique pour toute personne ayant une taille importante sur la plateforme, car une couverture en théorie ne signifie pas toujours un remboursement instantané dans la pratique. Pour les traders, la configuration relève de la gestion du risque et du flux. Surveillez le BTC autour de 83 000 à 85 000 pour toute contagion se propageant depuis le titre, et observez les flux de stablecoins vers et depuis Bitget une fois les retraits rouverts. Les prochains catalyseurs sont le rapport d’incident sur 24 heures et toute mise à jour sur la méthode d’attaque, avec des forces de l’ordre et des sociétés de sécurité on-chain déjà impliquées. Si le rapport pointe vers une faille connue ou un acteur spécifique, le marché l’intégrera rapidement dans les prix. S’il reste vague, attendez-vous à une anxiété persistante concernant les retraits et à d’éventuels transferts vers des concurrents. Les niveaux clés sont 83 000 de support pour le BTC et le ratio de couverture du fonds de protection de 464 millions pour Bitget. Une résolution sans accroc, avec remboursement complet et vecteur d’attaque clairement identifié, limiterait les dégâts, tandis que des retards ou des lacunes dans le rapport pourraient prolonger le risque lié au titre jusqu’au week-end. D’ici là, les traders devraient supposer une volatilité accrue et garder leur taille diversifiée entre les plateformes... $SAFE
Bitget vient de confirmer une brèche de portefeuille chaud de 351,6 millions de dollars, a interrompu les retraits et le marché pose les questions évidentes. Qui a fait ça, comment est-il entré, et les fonds des utilisateurs sont-ils réellement en sécurité ? La plateforme affirme que oui pour le dernier point, en évoquant un fonds de protection des utilisateurs de 464 millions de dollars qui couvre l’intégralité de la perte, mais le vecteur d’attaque reste inconnu en attendant un rapport d’incident complet. La tension réside entre le mécanisme de secours et l’inconnu. La PDG Gracy Chen a déclaré que la brèche était limitée à une partie des couches de portefeuilles chauds et tièdes dans l’architecture en trois niveaux de Bitget, tandis que les portefeuilles froids sont restés intacts et que les soldes des comptes utilisateurs étaient exacts. Les dépôts et le trading sont toujours en direct, mais les retraits sont gelés jusqu’à la fin de l’examen de sécurité. C’est une distinction critique pour toute personne ayant une taille importante sur la plateforme, car une couverture en théorie ne signifie pas toujours un remboursement instantané dans la pratique. Pour les traders, la configuration relève de la gestion du risque et du flux. Surveillez le BTC autour de 83 000 à 85 000 pour toute contagion se propageant depuis le titre, et observez les flux de stablecoins vers et depuis Bitget une fois les retraits rouverts. Les prochains catalyseurs sont le rapport d’incident sur 24 heures et toute mise à jour sur la méthode d’attaque, avec des forces de l’ordre et des sociétés de sécurité on-chain déjà impliquées. Si le rapport pointe vers une faille connue ou un acteur spécifique, le marché l’intégrera rapidement dans les prix. S’il reste vague, attendez-vous à une anxiété persistante concernant les retraits et à d’éventuels transferts vers des concurrents. Les niveaux clés sont 83 000 de support pour le BTC et le ratio de couverture du fonds de protection de 464 millions pour Bitget. Une résolution sans accroc, avec remboursement complet et vecteur d’attaque clairement identifié, limiterait les dégâts, tandis que des retards ou des lacunes dans le rapport pourraient prolonger le risque lié au titre jusqu’au week-end. D’ici là, les traders devraient supposer une volatilité accrue et garder leur taille diversifiée entre les plateformes... $SAFE
74
·
--
Voir la traduction
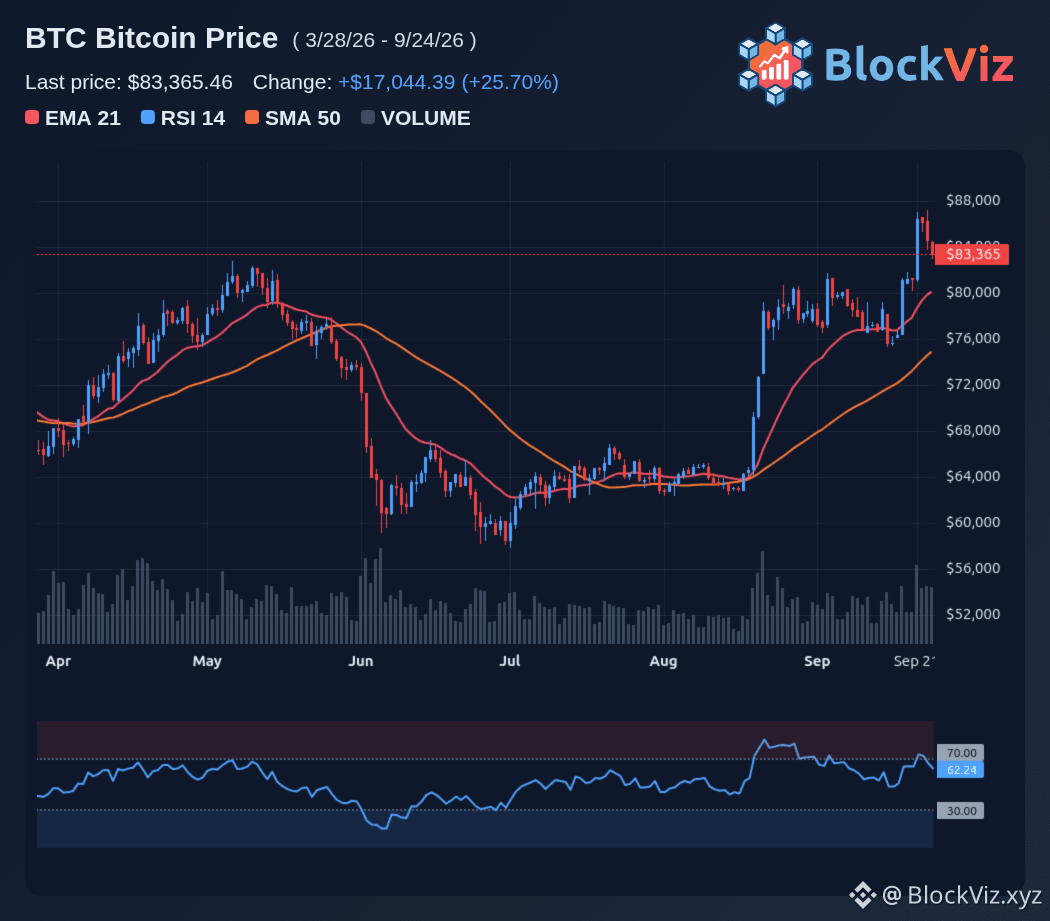
The 10-year Treasury yield just hit 5.12%, its highest level since 2007, and it is forcing a hard question for Bitcoin bulls. Why take risk on a non-yielding asset when you can lock in a risk-free 5% in government bonds? That opportunity cost is the cleanest read on why BTC slipped from the 85,000s toward 83,000 as yields surged. The tension is between macro headwinds and crypto-specific catalysts. On one side, higher yields drain liquidity from risk assets, push up discount rates on long-duration bets, and strengthen the dollar. On the other side, Bitcoin is holding above 83,000 with a 14% gain since its max-pain low near 75,000, and it is still up roughly 33% from the July low near 58,000. The market is weighing a risk-free 5% against the potential for a bull market breakout if BTC can clear 88,000 to 90,000. For traders, the setup is clear. Watch the 10-year yield at 5.12% and then 5.15% for the next leg. A move above 5.15% would signal more pressure on risk assets, while a pullback toward 5.00% would ease the opportunity cost headwind. For BTC, the key levels are 83,000 support and 88,000 to 90,000 resistance. A break below 83,000 could open the path to 80,000 and then 75,000, while a hold above 88,000 would suggest buyers are defending the bull case. The next catalysts are the Friday 18 billion options expiry and any follow-through in yields. If the 10-year backs off from 5.12% and BTC holds 85,000, the path to 90,000 opens. If yields push toward 5.15% and BTC loses 83,000, the risk-free rate narrative will dominate and drag crypto lower. $BTC
The 10-year Treasury yield just hit 5.12%, its highest level since 2007, and it is forcing a hard question for Bitcoin bulls. Why take risk on a non-yielding asset when you can lock in a risk-free 5% in government bonds? That opportunity cost is the cleanest read on why BTC slipped from the 85,000s toward 83,000 as yields surged. The tension is between macro headwinds and crypto-specific catalysts. On one side, higher yields drain liquidity from risk assets, push up discount rates on long-duration bets, and strengthen the dollar. On the other side, Bitcoin is holding above 83,000 with a 14% gain since its max-pain low near 75,000, and it is still up roughly 33% from the July low near 58,000. The market is weighing a risk-free 5% against the potential for a bull market breakout if BTC can clear 88,000 to 90,000. For traders, the setup is clear. Watch the 10-year yield at 5.12% and then 5.15% for the next leg. A move above 5.15% would signal more pressure on risk assets, while a pullback toward 5.00% would ease the opportunity cost headwind. For BTC, the key levels are 83,000 support and 88,000 to 90,000 resistance. A break below 83,000 could open the path to 80,000 and then 75,000, while a hold above 88,000 would suggest buyers are defending the bull case. The next catalysts are the Friday 18 billion options expiry and any follow-through in yields. If the 10-year backs off from 5.12% and BTC holds 85,000, the path to 90,000 opens. If yields push toward 5.15% and BTC loses 83,000, the risk-free rate narrative will dominate and drag crypto lower. $BTC
60
·
--
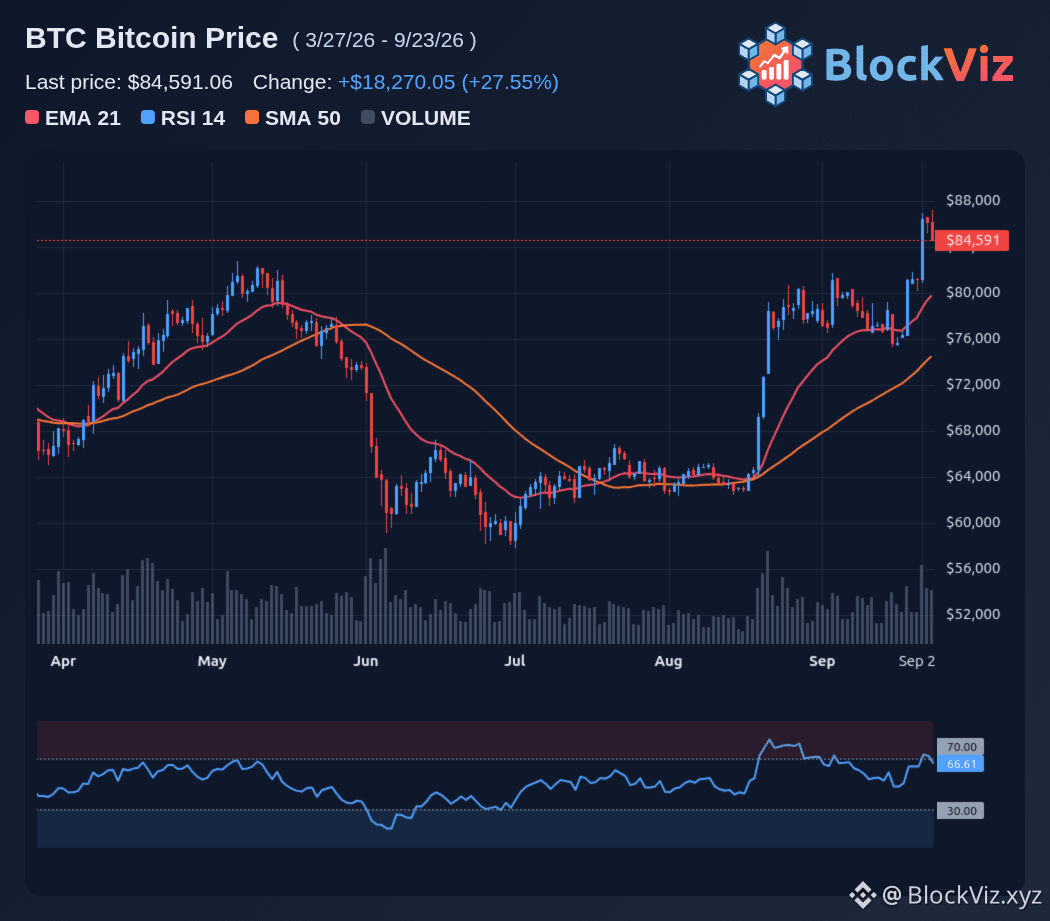
Environ 18 milliards de dollars d’options sur le BTC et l’ETH expirent vendredi, et le « max pain » se situe exactement autour de 75 000 pour le Bitcoin. C’est à peu près 10 000 en dessous du prix spot actuel, proche de 85 000 à 86 000, et cela amène des traders à se demander si le hedging des courtiers (dealers) et les flux de gamma vont tirer le BTC plus bas jusqu’au règlement à 08:00 UTC. La tension oppose l’aimant du max pain et la position davantage orientée à l’achat (call). Les options BTC sont biaisées haussières, avec environ 9,4 milliards en calls contre 6,5 milliards en puts, concentrées sur les strikes 90 000 et 100 000. Pour que le prix de règlement tombe sur le max pain, le Bitcoin devrait baisser de 11% à 12% entre maintenant et vendredi, ce qui est un mouvement important, mais pas impossible pendant une semaine d’expiration trimestrielle. L’historique montre que le max pain ne gagne pas toujours, mais qu’il agit souvent comme un aimant « doux » vers l’expiration. Lors des trimestres passés, le BTC s’est rapproché du max pain lorsque l’open interest est élevé et que le gamma des dealers est en position courte. Cette semaine, le strike 70 000 concentre le plus de contrats ouverts, tandis que des puts sont empilés aux niveaux 60 000, 70 000 et 75 000, créant un plancher de soutien en couches qui pourrait limiter la baisse si les vendeurs poussent vers 75 000. Pour les traders, la configuration est claire. Surveillez 85 000 comme support clé et 88 000 à 90 000 comme résistance d’ici vendredi. Une cassure sous 85 000 pourrait ouvrir la voie vers 80 000 puis vers le max pain à 75 000, tandis qu’un maintien au-dessus de 88 000 indiquerait que les acheteurs défendent la position orientée calls. Les prochains catalyseurs sont les reports d’options quotidiens et toute grosse transaction en bloc qui modifie les couvertures des dealers avant le règlement vendredi à 08:00 UTC. $BTC
Environ 18 milliards de dollars d’options sur le BTC et l’ETH expirent vendredi, et le « max pain » se situe exactement autour de 75 000 pour le Bitcoin. C’est à peu près 10 000 en dessous du prix spot actuel, proche de 85 000 à 86 000, et cela amène des traders à se demander si le hedging des courtiers (dealers) et les flux de gamma vont tirer le BTC plus bas jusqu’au règlement à 08:00 UTC. La tension oppose l’aimant du max pain et la position davantage orientée à l’achat (call). Les options BTC sont biaisées haussières, avec environ 9,4 milliards en calls contre 6,5 milliards en puts, concentrées sur les strikes 90 000 et 100 000. Pour que le prix de règlement tombe sur le max pain, le Bitcoin devrait baisser de 11% à 12% entre maintenant et vendredi, ce qui est un mouvement important, mais pas impossible pendant une semaine d’expiration trimestrielle. L’historique montre que le max pain ne gagne pas toujours, mais qu’il agit souvent comme un aimant « doux » vers l’expiration. Lors des trimestres passés, le BTC s’est rapproché du max pain lorsque l’open interest est élevé et que le gamma des dealers est en position courte. Cette semaine, le strike 70 000 concentre le plus de contrats ouverts, tandis que des puts sont empilés aux niveaux 60 000, 70 000 et 75 000, créant un plancher de soutien en couches qui pourrait limiter la baisse si les vendeurs poussent vers 75 000. Pour les traders, la configuration est claire. Surveillez 85 000 comme support clé et 88 000 à 90 000 comme résistance d’ici vendredi. Une cassure sous 85 000 pourrait ouvrir la voie vers 80 000 puis vers le max pain à 75 000, tandis qu’un maintien au-dessus de 88 000 indiquerait que les acheteurs défendent la position orientée calls. Les prochains catalyseurs sont les reports d’options quotidiens et toute grosse transaction en bloc qui modifie les couvertures des dealers avant le règlement vendredi à 08:00 UTC. $BTC
61
·
--
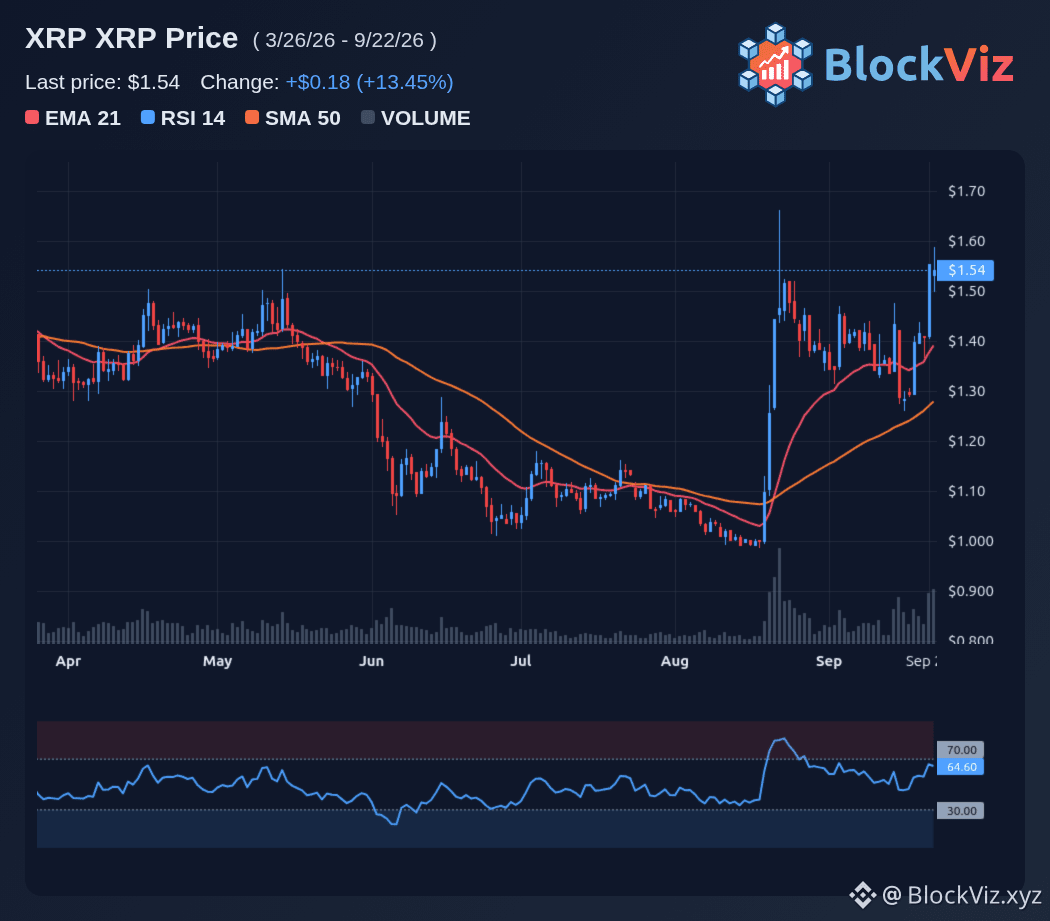
XRP, DOGE, BCH et NEAR viennent de dépasser le BTC, mais toutes ces hausses ne reposent pas sur les mêmes bases. DOGE progresse de 14% à 15% en 24 heures, XRP est passé de 1,40 à 1,54 et NEAR affiche des gains à deux chiffres avec une hausse hebdomadaire de 55%. Le BTC a ajouté environ 5% sur la même période, et sa dominance est tombée à environ 57% contre 59,2% plus tôt en septembre. La question est de savoir s’il s’agit d’un début d’altseason ou simplement d’une étape spéculative en fin de cycle. Les lectures de l’Altcoin Season Index restent autour de 46 à 49, bien en dessous du seuil de 75 utilisé par les traders pour qualifier une altseason complète. NEAR et BCH ont une forte dynamique et des catalyseurs clairs, avec NEAR en hausse de 55% sur la semaine et BCH enregistrant un gain hebdomadaire de 14%. XRP et DOGE sont plus mitigés : XRP reste encore presque 10% en dessous de son plus haut du 22 août, et DOGE repart à la hausse avec un fort levier et des spéculations autour des memecoins. Pour les traders, l’enjeu est de déterminer quelles valeurs vont poursuivre leur mouvement et lesquelles s’essoufflent rapidement. NEAR et BCH semblent être les vraies options de momentum, avec un volume durable et des cassures au-dessus de résistances clés. XRP a besoin d’une cassure nette au-dessus de 1,54 puis de 1,60 pour confirmer la tendance, tandis que DOGE est plus sensible aux flux retail et pourrait s’inverser rapidement si le levier se dénoue. Surveillez la dominance du BTC à 57% et l’Altcoin Season Index à 50 pour repérer les signes d’une rotation plus large. Une rupture sous 56% de dominance et un passage au-dessus de 55 sur l’index signaleraient que le capital se dirige vers les alts, tandis qu’un rebond au-dessus de 58% suggérerait que le BTC continue d’ancrer la liquidité. Les prochains catalyseurs seront la clôture de la bougie mensuelle de septembre et toute poursuite au-dessus de 1,60 pour XRP et de 0,10 pour DOGE. $XRP
XRP, DOGE, BCH et NEAR viennent de dépasser le BTC, mais toutes ces hausses ne reposent pas sur les mêmes bases. DOGE progresse de 14% à 15% en 24 heures, XRP est passé de 1,40 à 1,54 et NEAR affiche des gains à deux chiffres avec une hausse hebdomadaire de 55%. Le BTC a ajouté environ 5% sur la même période, et sa dominance est tombée à environ 57% contre 59,2% plus tôt en septembre. La question est de savoir s’il s’agit d’un début d’altseason ou simplement d’une étape spéculative en fin de cycle. Les lectures de l’Altcoin Season Index restent autour de 46 à 49, bien en dessous du seuil de 75 utilisé par les traders pour qualifier une altseason complète. NEAR et BCH ont une forte dynamique et des catalyseurs clairs, avec NEAR en hausse de 55% sur la semaine et BCH enregistrant un gain hebdomadaire de 14%. XRP et DOGE sont plus mitigés : XRP reste encore presque 10% en dessous de son plus haut du 22 août, et DOGE repart à la hausse avec un fort levier et des spéculations autour des memecoins. Pour les traders, l’enjeu est de déterminer quelles valeurs vont poursuivre leur mouvement et lesquelles s’essoufflent rapidement. NEAR et BCH semblent être les vraies options de momentum, avec un volume durable et des cassures au-dessus de résistances clés. XRP a besoin d’une cassure nette au-dessus de 1,54 puis de 1,60 pour confirmer la tendance, tandis que DOGE est plus sensible aux flux retail et pourrait s’inverser rapidement si le levier se dénoue. Surveillez la dominance du BTC à 57% et l’Altcoin Season Index à 50 pour repérer les signes d’une rotation plus large. Une rupture sous 56% de dominance et un passage au-dessus de 55 sur l’index signaleraient que le capital se dirige vers les alts, tandis qu’un rebond au-dessus de 58% suggérerait que le BTC continue d’ancrer la liquidité. Les prochains catalyseurs seront la clôture de la bougie mensuelle de septembre et toute poursuite au-dessus de 1,60 pour XRP et de 0,10 pour DOGE. $XRP
53
·
--
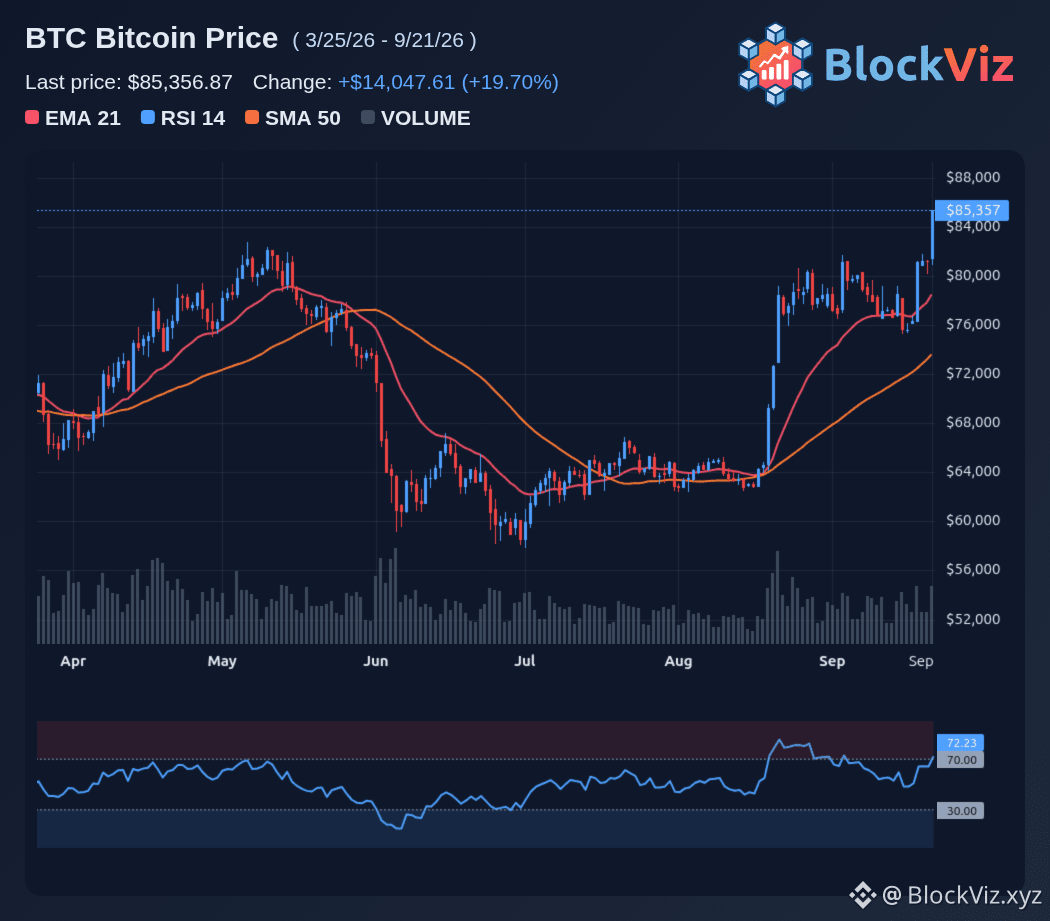
Bitcoin vient de clôturer au-dessus de sa moyenne mobile sur 50 semaines pour la première fois en 45 semaines, et l’histoire montre que cela compte. Galaxy Research note que, dans quatre cas sur cinq de marchés baissiers clôturés, la première reprise hebdomadaire de la MM 50W a confirmé que le creux du cycle était en place. C’est un signal qui a mis fin à 84 % des marchés baissiers, et il passe au vert : BTC clôture la semaine à 81 159, au-dessus de la moyenne de 78 788. L’enjeu est de savoir si cette clôture est suffisante pour qualifier le marché haussier ou si nous avons besoin de davantage de confirmation. Les analystes surveillent 83 000 comme niveau clé : il permettrait de briser la figure de creux plus bas sur le graphique mensuel et d’ouvrir la voie vers 90 000. Un mouvement durable au-dessus de 83 000 s’alignerait avec les cycles passés où BTC a gagné entre 700 % et 900 % après avoir franchi la MM 50W, tandis qu’un échec pourrait conduire à une retest de 78 800 puis de 74 000. Pour les traders, la configuration est claire. Tenez au-dessus de 80 000 puis de 83 000, et la route vers 90 000 s’ouvre avec l’élan. Perdre 78 800 sur une clôture hebdomadaire invaliderait le signal, avec une baisse vers 74 000 à 75 000 probable. Les prochains catalyseurs sont la clôture de la bougie mensuelle de septembre et tout prolongement au-dessus de 83 000 pour confirmer l’inversion de tendance. Surveillez 83 000 pour la cassure et 78 800 pour l’invalidation. Une cassure nette et un maintien au-dessus de 83 000 indiqueraient que le marché haussier a commencé, tandis qu’une clôture hebdomadaire sous 78 800 suggérerait que le marché baissier n’est pas encore terminé. La clôture de la MM 50W est un signal fort, mais c’est le suivi qui déterminera si 90 000 est la prochaine étape ou si BTC reste coincé dans sa phase de consolidation. $BTC
Bitcoin vient de clôturer au-dessus de sa moyenne mobile sur 50 semaines pour la première fois en 45 semaines, et l’histoire montre que cela compte. Galaxy Research note que, dans quatre cas sur cinq de marchés baissiers clôturés, la première reprise hebdomadaire de la MM 50W a confirmé que le creux du cycle était en place. C’est un signal qui a mis fin à 84 % des marchés baissiers, et il passe au vert : BTC clôture la semaine à 81 159, au-dessus de la moyenne de 78 788. L’enjeu est de savoir si cette clôture est suffisante pour qualifier le marché haussier ou si nous avons besoin de davantage de confirmation. Les analystes surveillent 83 000 comme niveau clé : il permettrait de briser la figure de creux plus bas sur le graphique mensuel et d’ouvrir la voie vers 90 000. Un mouvement durable au-dessus de 83 000 s’alignerait avec les cycles passés où BTC a gagné entre 700 % et 900 % après avoir franchi la MM 50W, tandis qu’un échec pourrait conduire à une retest de 78 800 puis de 74 000. Pour les traders, la configuration est claire. Tenez au-dessus de 80 000 puis de 83 000, et la route vers 90 000 s’ouvre avec l’élan. Perdre 78 800 sur une clôture hebdomadaire invaliderait le signal, avec une baisse vers 74 000 à 75 000 probable. Les prochains catalyseurs sont la clôture de la bougie mensuelle de septembre et tout prolongement au-dessus de 83 000 pour confirmer l’inversion de tendance. Surveillez 83 000 pour la cassure et 78 800 pour l’invalidation. Une cassure nette et un maintien au-dessus de 83 000 indiqueraient que le marché haussier a commencé, tandis qu’une clôture hebdomadaire sous 78 800 suggérerait que le marché baissier n’est pas encore terminé. La clôture de la MM 50W est un signal fort, mais c’est le suivi qui déterminera si 90 000 est la prochaine étape ou si BTC reste coincé dans sa phase de consolidation. $BTC
1
162
·
--
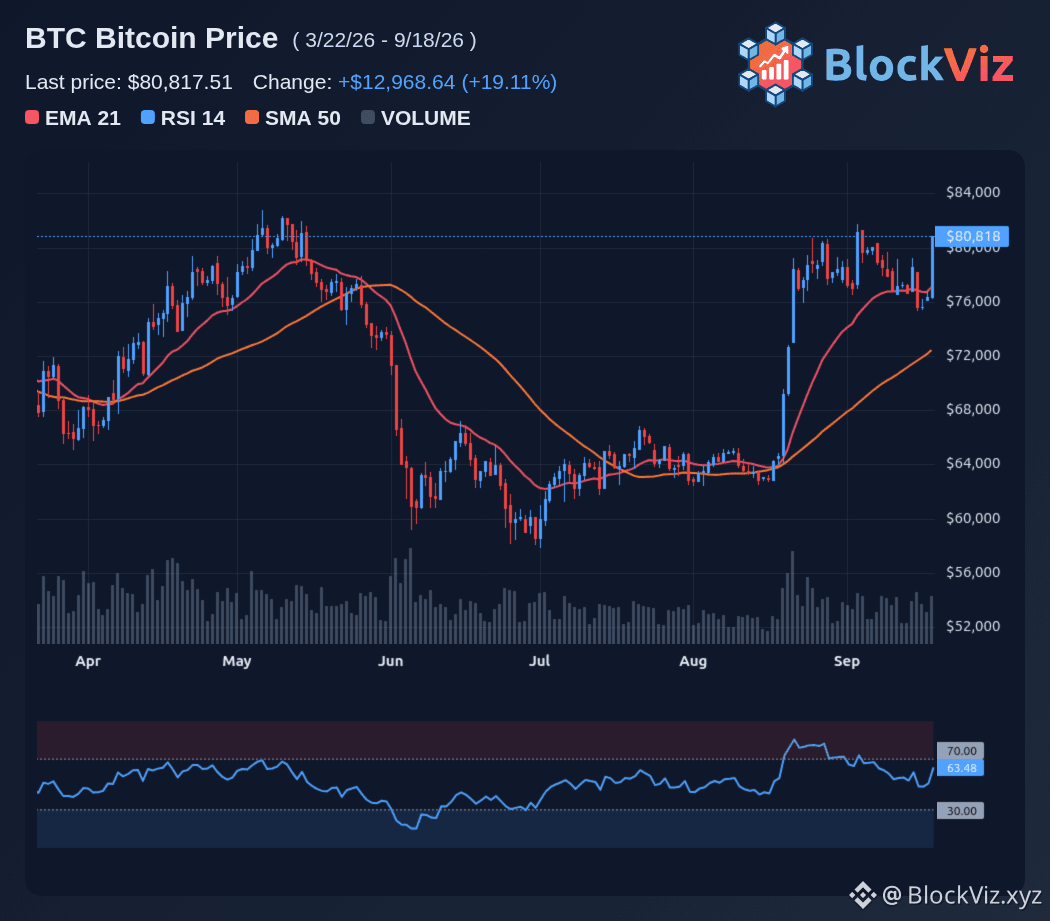
La Fed vient d’augmenter ses taux, mais le marché se concentre sur un autre chiffre : 15,6 milliards. Il s’agit du montant de la dernière opération de rachat d’obligations du Trésor, et des traders se demandent s’il s’agit d’un QE « en douce » qui alimente la percée de Bitcoin vers 80 000. La tension est bien réelle. D’un côté, la Fed a relevé le taux directeur de 25 points de base, le faisant passer de 3,75 % à 4,00 %, première hausse depuis 2023, et a indiqué une trajectoire plus restrictive, avec une hausse supplémentaire possible d’ici la fin de l’année. De l’autre, le Trésor injecte des liquidités via des rachats de dette : jusqu’à 14,5 milliards par semaine d’achats, et une opération de 15,6 milliards touchant le marché cette semaine. Ce mix de resserrement de la politique et de liquidité ciblée correspond exactement à ce qui fait bondir le BTC, repassant des 76 000 vers 77 300 puis 78 000. Pour les traders, la question est de savoir si cette offre de liquidité est suffisante pour compenser les vents contraires liés à des taux plus élevés, aux sorties des ETF et au revers lié à la loi Clarity. Le BTC s’est déjà redressé depuis un plus bas de juillet proche de 58 000, gagnant près de 33 % d’ici la mi-septembre, mais il se heurte encore à une résistance importante à 78 000, puis au 365e jour de la moyenne mobile près de 82 300. Une cassure nette au-dessus de 78 000 signalerait que l’injection de liquidité du Trésor est gagnante, tandis qu’un échec pourrait ramener le BTC vers 74 000 à 75 000. Surveillez les prochaines annonces de rachats du Trésor et les données du bilan de la Fed pour déceler des signes de poursuite du soutien en liquidité. Les niveaux clés sont 78 000 à la hausse et 74 000 à la baisse. Si l’opération de 15,6 milliards n’est que le début d’un programme plus large, le BTC pourrait tester 80 000 puis 82 300. Si le robinet de liquidité ralentit, la trajectoire plus stricte de la Fed devrait probablement reprendre le dessus et pousser le BTC à nouveau vers 70 000. $BTC
La Fed vient d’augmenter ses taux, mais le marché se concentre sur un autre chiffre : 15,6 milliards. Il s’agit du montant de la dernière opération de rachat d’obligations du Trésor, et des traders se demandent s’il s’agit d’un QE « en douce » qui alimente la percée de Bitcoin vers 80 000. La tension est bien réelle. D’un côté, la Fed a relevé le taux directeur de 25 points de base, le faisant passer de 3,75 % à 4,00 %, première hausse depuis 2023, et a indiqué une trajectoire plus restrictive, avec une hausse supplémentaire possible d’ici la fin de l’année. De l’autre, le Trésor injecte des liquidités via des rachats de dette : jusqu’à 14,5 milliards par semaine d’achats, et une opération de 15,6 milliards touchant le marché cette semaine. Ce mix de resserrement de la politique et de liquidité ciblée correspond exactement à ce qui fait bondir le BTC, repassant des 76 000 vers 77 300 puis 78 000. Pour les traders, la question est de savoir si cette offre de liquidité est suffisante pour compenser les vents contraires liés à des taux plus élevés, aux sorties des ETF et au revers lié à la loi Clarity. Le BTC s’est déjà redressé depuis un plus bas de juillet proche de 58 000, gagnant près de 33 % d’ici la mi-septembre, mais il se heurte encore à une résistance importante à 78 000, puis au 365e jour de la moyenne mobile près de 82 300. Une cassure nette au-dessus de 78 000 signalerait que l’injection de liquidité du Trésor est gagnante, tandis qu’un échec pourrait ramener le BTC vers 74 000 à 75 000. Surveillez les prochaines annonces de rachats du Trésor et les données du bilan de la Fed pour déceler des signes de poursuite du soutien en liquidité. Les niveaux clés sont 78 000 à la hausse et 74 000 à la baisse. Si l’opération de 15,6 milliards n’est que le début d’un programme plus large, le BTC pourrait tester 80 000 puis 82 300. Si le robinet de liquidité ralentit, la trajectoire plus stricte de la Fed devrait probablement reprendre le dessus et pousser le BTC à nouveau vers 70 000. $BTC
72
·
--
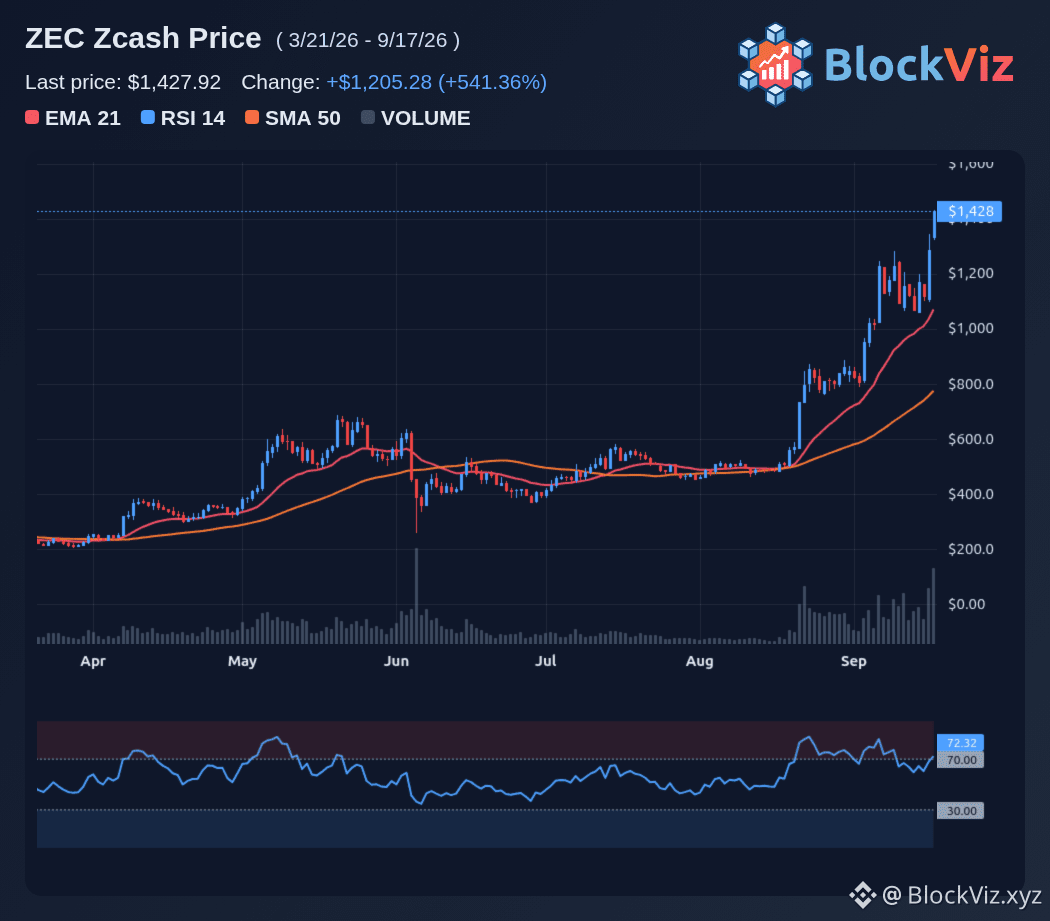
Les hackers veulent du Monero. Les VCs veulent du Zcash. Cet écart est la lecture la plus claire des arbitrages en matière de confidentialité à l’heure actuelle. La brèche chez Revolut a remis Monero dans le débat public, avec une demande de rançon de 3 millions de dollars, tandis que Zcash profite d’une vague de flux institutionnels, d’un accès via ETF et du positionnement des trésoreries de VCs, ce qui a propulsé ZEC vers 1 400 et porté son avance sur XMR à plus de 10 milliards de dollars de capitalisation boursière. Cette tension compte parce que les deux actifs racontent désormais des histoires différentes. Monero est le choix de confidentialité par défaut pour les acteurs illicites : chaque transaction est masquée au niveau du protocole et il n’existe aucune option de clé de consultation. Cela maintient une forte demande dans l’économie souterraine, mais éloigne aussi les plateformes réglementées, Kraken et d’autres acteurs européens ayant déjà restreint XMR avant la banquette de la règle AMLR de juillet 2027. Zcash, en revanche, propose des transactions protégées optionnelles et des clés de consultation qui permettent aux détenteurs de divulguer des détails à des auditeurs ou à des régulateurs—c’est exactement pourquoi Grayscale pourrait lancer un produit coté aux États-Unis et pourquoi des fonds comme Multicoin Capital et Cypherpunk ont constitué de grandes positions en ZEC. Pour les traders, la question est de savoir si l’appétit pour la confidentialité se tourne davantage vers ZEC, ou si le récit d’usage illicite de Monero et la pression de radiation créent une configuration contrariante. ZEC a surperformé en matière d’entrées institutionnelles, avec plus de 34 millions de flux nets rapportés au cours des deux premières semaines du produit ZCSH, et une liquidité nouvelle due à l’intégration de THORChain et à la cotation chez SwissBorg. XMR reste plus sensible aux radiations des plateformes et aux gros titres réglementaires, mais il conserve une liquidité profonde sur le gré à gré (OTC) et sur des sites non-KYC. Surveillez ZEC autour de 1 400 puis de 1 500 pour la prochaine étape, et un échec sous 1 200 signalera un refroidissement de la demande institutionnelle. Pour XMR, observez s’il peut maintenir un support clé une fois que les gros titres de Revolut se seront estompés et si de nouveaux exc... $ZEC
Les hackers veulent du Monero. Les VCs veulent du Zcash. Cet écart est la lecture la plus claire des arbitrages en matière de confidentialité à l’heure actuelle. La brèche chez Revolut a remis Monero dans le débat public, avec une demande de rançon de 3 millions de dollars, tandis que Zcash profite d’une vague de flux institutionnels, d’un accès via ETF et du positionnement des trésoreries de VCs, ce qui a propulsé ZEC vers 1 400 et porté son avance sur XMR à plus de 10 milliards de dollars de capitalisation boursière. Cette tension compte parce que les deux actifs racontent désormais des histoires différentes. Monero est le choix de confidentialité par défaut pour les acteurs illicites : chaque transaction est masquée au niveau du protocole et il n’existe aucune option de clé de consultation. Cela maintient une forte demande dans l’économie souterraine, mais éloigne aussi les plateformes réglementées, Kraken et d’autres acteurs européens ayant déjà restreint XMR avant la banquette de la règle AMLR de juillet 2027. Zcash, en revanche, propose des transactions protégées optionnelles et des clés de consultation qui permettent aux détenteurs de divulguer des détails à des auditeurs ou à des régulateurs—c’est exactement pourquoi Grayscale pourrait lancer un produit coté aux États-Unis et pourquoi des fonds comme Multicoin Capital et Cypherpunk ont constitué de grandes positions en ZEC. Pour les traders, la question est de savoir si l’appétit pour la confidentialité se tourne davantage vers ZEC, ou si le récit d’usage illicite de Monero et la pression de radiation créent une configuration contrariante. ZEC a surperformé en matière d’entrées institutionnelles, avec plus de 34 millions de flux nets rapportés au cours des deux premières semaines du produit ZCSH, et une liquidité nouvelle due à l’intégration de THORChain et à la cotation chez SwissBorg. XMR reste plus sensible aux radiations des plateformes et aux gros titres réglementaires, mais il conserve une liquidité profonde sur le gré à gré (OTC) et sur des sites non-KYC. Surveillez ZEC autour de 1 400 puis de 1 500 pour la prochaine étape, et un échec sous 1 200 signalera un refroidissement de la demande institutionnelle. Pour XMR, observez s’il peut maintenir un support clé une fois que les gros titres de Revolut se seront estompés et si de nouveaux exc... $ZEC
54
Connectez-vous pour découvrir plus de contenu
Rejoignez la communauté mondiale des adeptes de cryptomonnaies sur Binance Square
⚡️ Suviez les dernières informations importantes sur les cryptomonnaies.
💬 Jugé digne de confiance par la plus grande plateforme d’échange de cryptomonnaies au monde.
👍 Découvrez les connaissances que partagent les créateurs vérifiés.
Adresse e-mail/Nº de téléphone
Sujets d’actualité
BinanceLaunchesBinanceIntelligence
411,112 vues
3,112 mentions
#BinanceLaunchesBinanceIntelligence
⚡ L’IA rencontre le trading crypto : Binance Intelligence est disponible ! ⚡
Le trading passe à la vitesse supérieure avec la nouvelle suite d’IA de Binance :
1️⃣ Binance AI : tableaux de bord personnalisés sur les marchés et briefings audio de 4 heures sur la conjoncture des marchés.
2️⃣ Binance AI Pro : créez et exécutez des stratégies automatisées à l’aide de simples instructions en langage naturel.
3️⃣ Binance Agent OS : un environnement de développement pour des agents d’IA financière autonomes.
Décrivez votre stratégie ➔ Testez-la en simulation ➔ Exécutez-la 24 h/24, 7 j/7.
Vous élaborez votre prochaine stratégie de trading avec l’IA ? Dites-nous ce que vous en pensez ci-dessous ! 👇
#BinanceLaunchesBinanceIntelligence #BinanceSquare #CryptoAI #Trading $EDEN
Hazi BNB
·1 mentions J’aime
·896 vues
BitcoinTargets2026OpenAt$87570
2,492 vues
76 mentions
BitcoinRejectedAt$87KThirdTime
2,460 vues
62 mentions