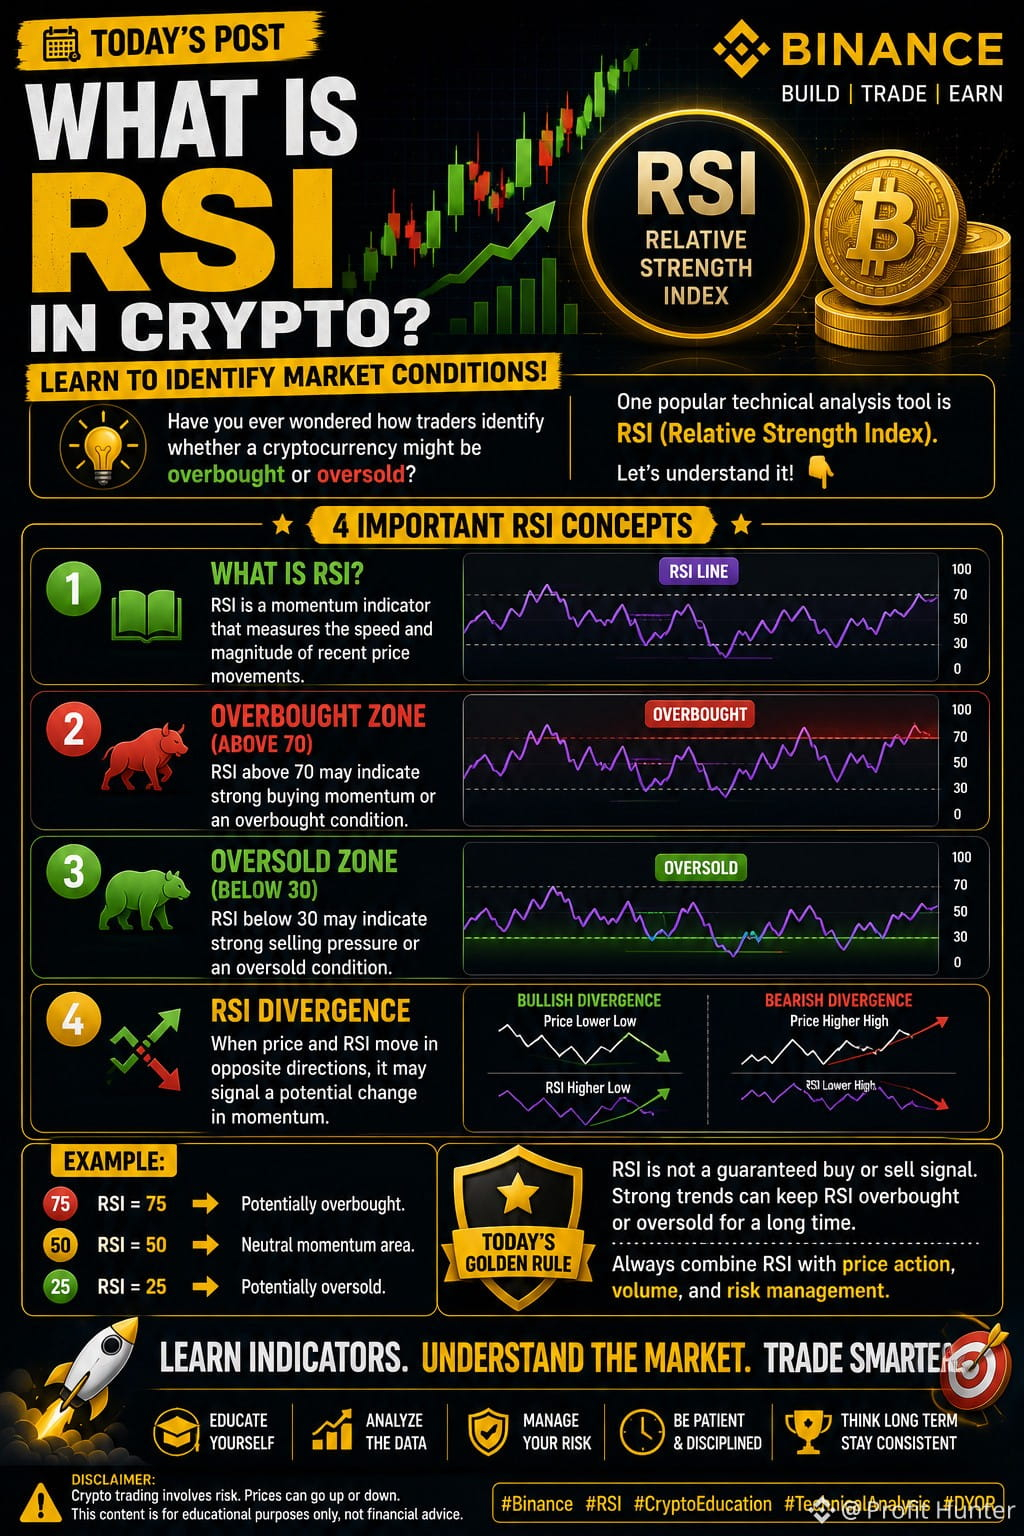
📊 WHAT IS RSI IN CRYPTO? LEARN TO IDENTIFY MARKET CONDITIONS!
Have you ever wondered how traders identify whether a cryptocurrency might be overbought or oversold?
One popular technical analysis tool is RSI (Relative Strength Index).
Let's understand it! 👇
🔥 4 IMPORTANT RSI CONCEPTS:
🔹 1. What Is RSI?
RSI is a momentum indicator that measures the speed and magnitude of recent price movements.
🔹 2. Overbought Zone (Above 70)
RSI above 70 may indicate strong buying momentum or an overbought condition.
🔹 3. Oversold Zone (Below 30)
RSI below 30 may indicate strong selling pressure or an oversold condition.
🔹 4. RSI Divergence
When price and RSI move in opposite directions, it may signal a potential change in momentum.
💡 EXAMPLE:
- RSI = 75 → Potentially overbought.
- RSI = 50 → Neutral momentum area.
- RSI = 25 → Potentially oversold.
⚠️ TODAY'S GOLDEN RULE:
RSI is not a guaranteed buy or sell signal. Strong trends can keep RSI overbought or oversold for a long time.
Always combine RSI with price action, volume, and risk management.
🚀 Learn Indicators. Understand the Market. Trade Smarter!
#TechnicalAnalysiss #CryptoEducation #tradingtips #learncrypto
Have you ever wondered how traders identify whether a cryptocurrency might be overbought or oversold?
One popular technical analysis tool is RSI (Relative Strength Index).
Let's understand it! 👇
🔥 4 IMPORTANT RSI CONCEPTS:
🔹 1. What Is RSI?
RSI is a momentum indicator that measures the speed and magnitude of recent price movements.
🔹 2. Overbought Zone (Above 70)
RSI above 70 may indicate strong buying momentum or an overbought condition.
🔹 3. Oversold Zone (Below 30)
RSI below 30 may indicate strong selling pressure or an oversold condition.
🔹 4. RSI Divergence
When price and RSI move in opposite directions, it may signal a potential change in momentum.
💡 EXAMPLE:
- RSI = 75 → Potentially overbought.
- RSI = 50 → Neutral momentum area.
- RSI = 25 → Potentially oversold.
⚠️ TODAY'S GOLDEN RULE:
RSI is not a guaranteed buy or sell signal. Strong trends can keep RSI overbought or oversold for a long time.
Always combine RSI with price action, volume, and risk management.
🚀 Learn Indicators. Understand the Market. Trade Smarter!
#TechnicalAnalysiss #CryptoEducation #tradingtips #learncrypto