


If you only looked at the candle, last night’s BTC move looked like another messy risk-off flush. The liquidation heatmap tells a cleaner story. Price didn’t randomly fall through $79k. It ran into stacked leverage, tripped it, and then sat underneath the wreckage.
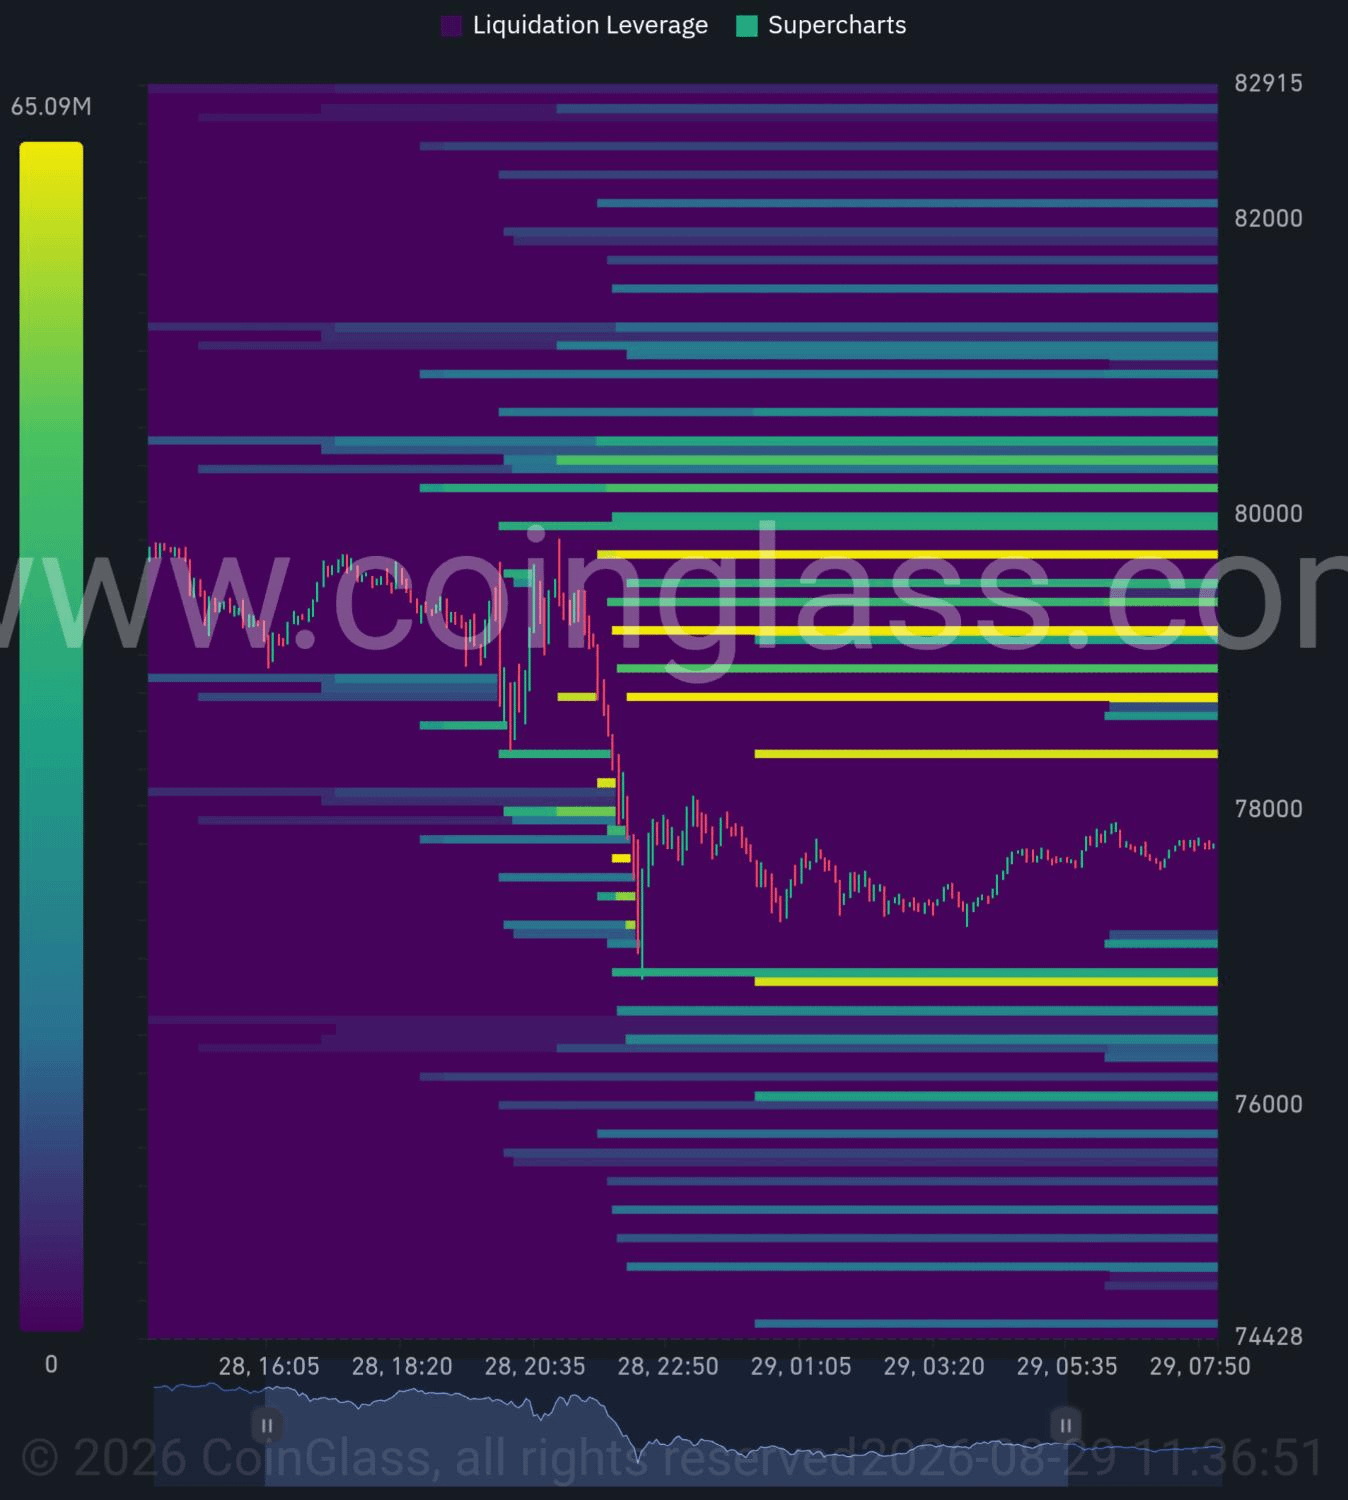
That’s the Coin-Gl-ass BTC/USDT map from late August 28 into the morning of August 29. Read it left to right and the sequence is obvious.
Price was still hanging near $79.5k–$79.8k through the afternoon. Then the drop started. By 20:35–22:50 it wasn’t a slow bleed anymore it was a cascade. Price sliced through $79k, punched into the high $77ks, wicked closer to $77k, and only then found a floor. After that, BTC stopped trending and started chopping around $77.5k–$77.8k while volume dried up. The dump did its job. The follow-through didn’t.
The bright bands are the part most people skip.
Those thick yellow lines sitting just overhead roughly $79.2k, $79.5k, and that fat cluster near $79.7k–$79.8k are the high-leverage pockets. That’s where a lot of positions were crowded before the flush. Once price lost that shelf, those levels flipped from “support people were defending” into “liquidity sitting above the market.” That’s why the bounce so far looks weak. BTC is trading *under* the densest remaining magnet zone, not through it.
Above that, the map stays noisy all the way into $80k–$82k. Lots of thin teal and green shelves. Those are not a clean breakout path. They’re speed bumps. Any reclaim toward $79.5k–$80k is going to run into leftover liquidation fuel first.
Below current price the picture is thinner, which is why the bounce even existed. There’s some liquidity around $77k, then more scattered pockets near $76.5k and $76k, and a deeper air pocket down toward $74.4k. That doesn’t mean $74k is next. It means if $77k fails with volume, the next real cluster is not immediately underneath. That’s how cascade moves get legs not because everyone suddenly turns bearish, but because there’s less leverage parked below to slow the fall.
The bottom panel matters too. Activity was still alive into the drop, then it collapsed after 23:00. That’s typical after a liquidation event: the forced sellers are done, the tourists are gone, and you’re left with a quieter range. Quiet after a flush is not the same thing as strength. It’s just the market catching its breath under resistance.
So what’s the honest read?
This was a liquidity sweep more than a clean trend change. BTC tagged the crowded long/high-leverage zone near $79.5k–$80k, flushed it, and is now digesting below that wall. The bullish version: hold $77k–$77.3k, grind back, and force shorts to cover into that yellow cluster overhead. The bearish version: lose $77k on rising volume and the map still has room toward $76k before the next dense shelf.
For trade setup, I wouldn’t treat $79.8k as “back in play” until price actually reclaims and holds above that yellow band. Until then, this is range logic. Fade the first spike into $79.2k–$79.8k if volume stays weak. Look for longs only if $77k holds and the next push comes with real participation, not just a dead-cat bounce into leftover liquidation.
Heatmaps don’t predict the future. They show you where the bodies are buried. Right now most of them are still sitting above price which is why this bounce has to *earn* $80k. It doesn’t get it for free.
