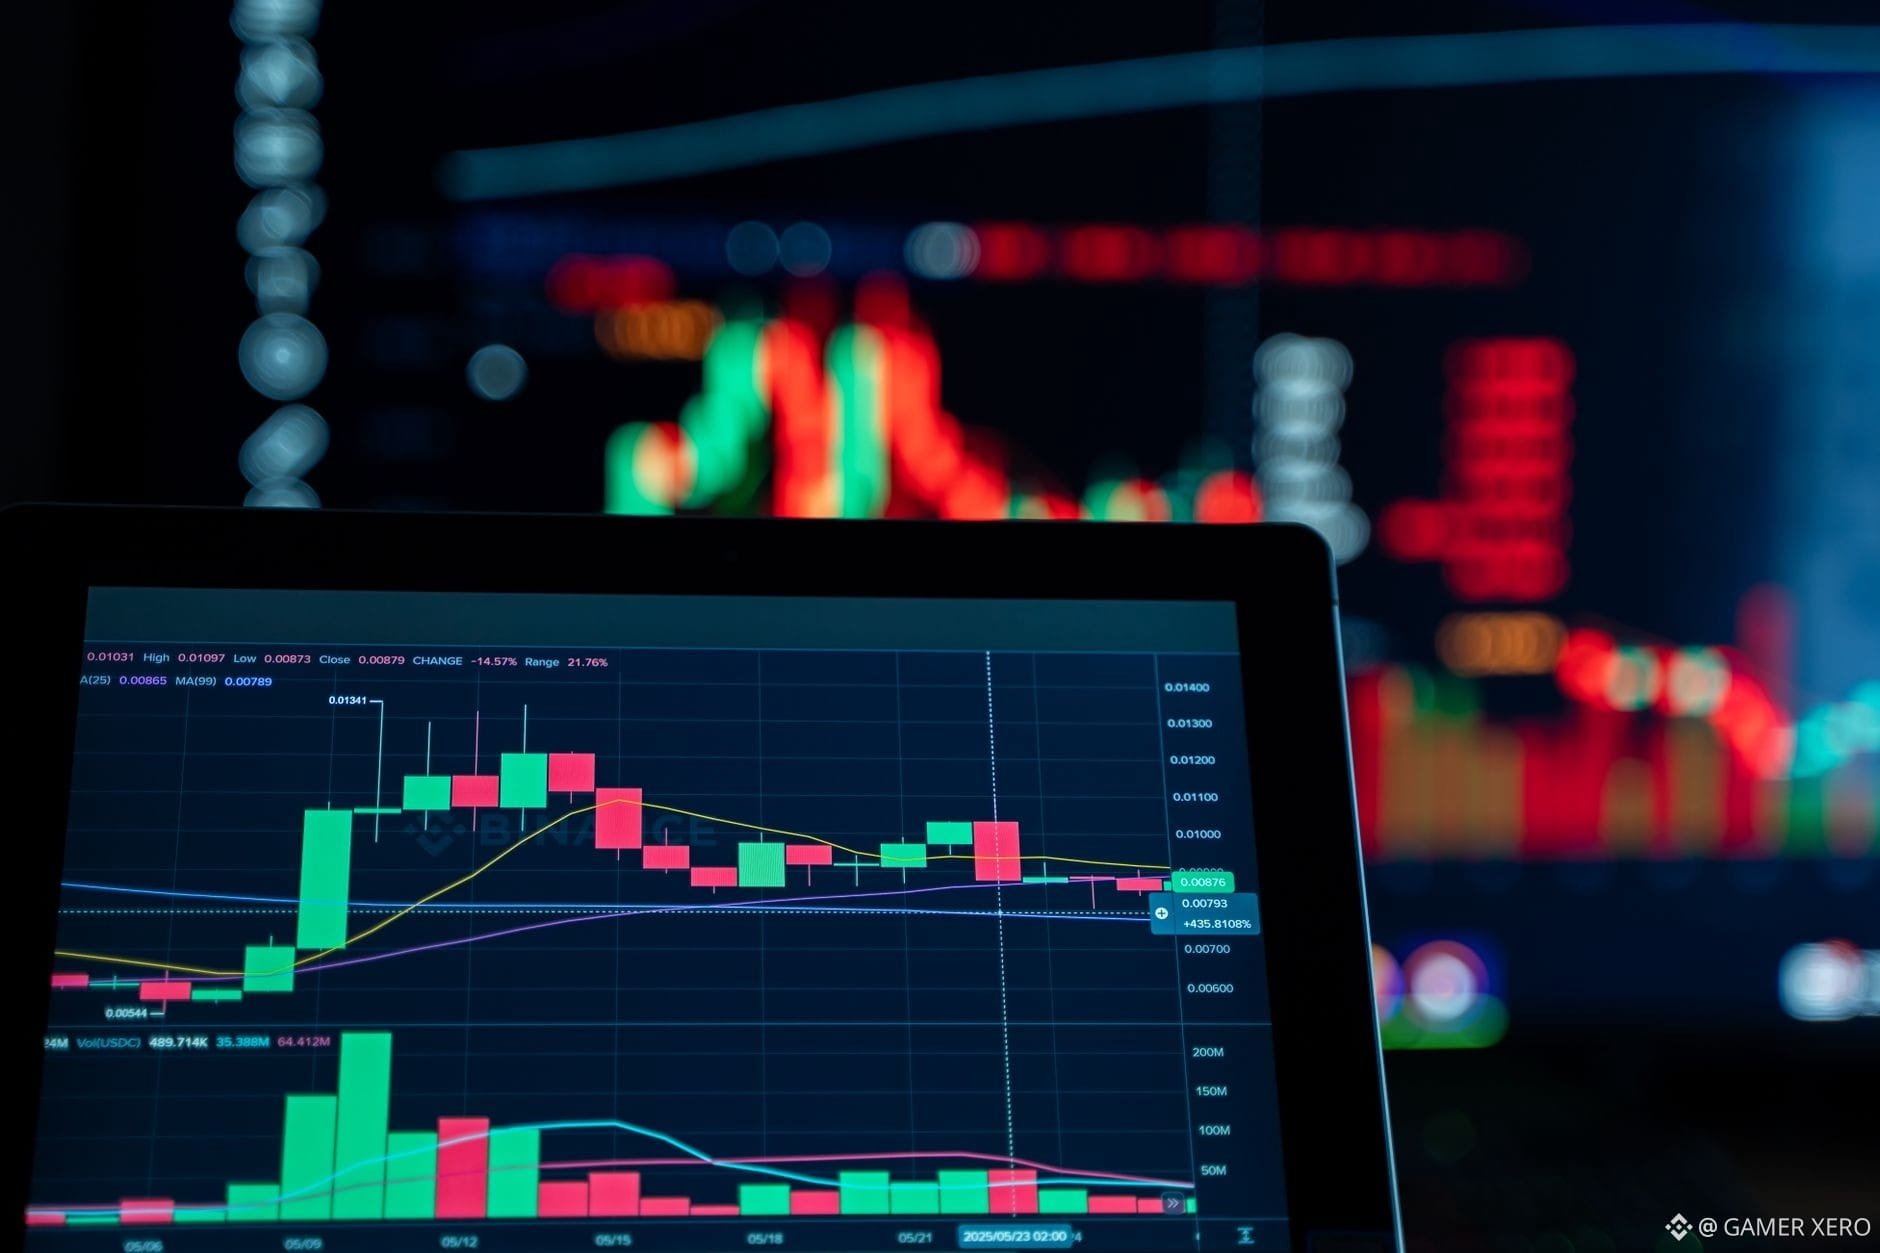
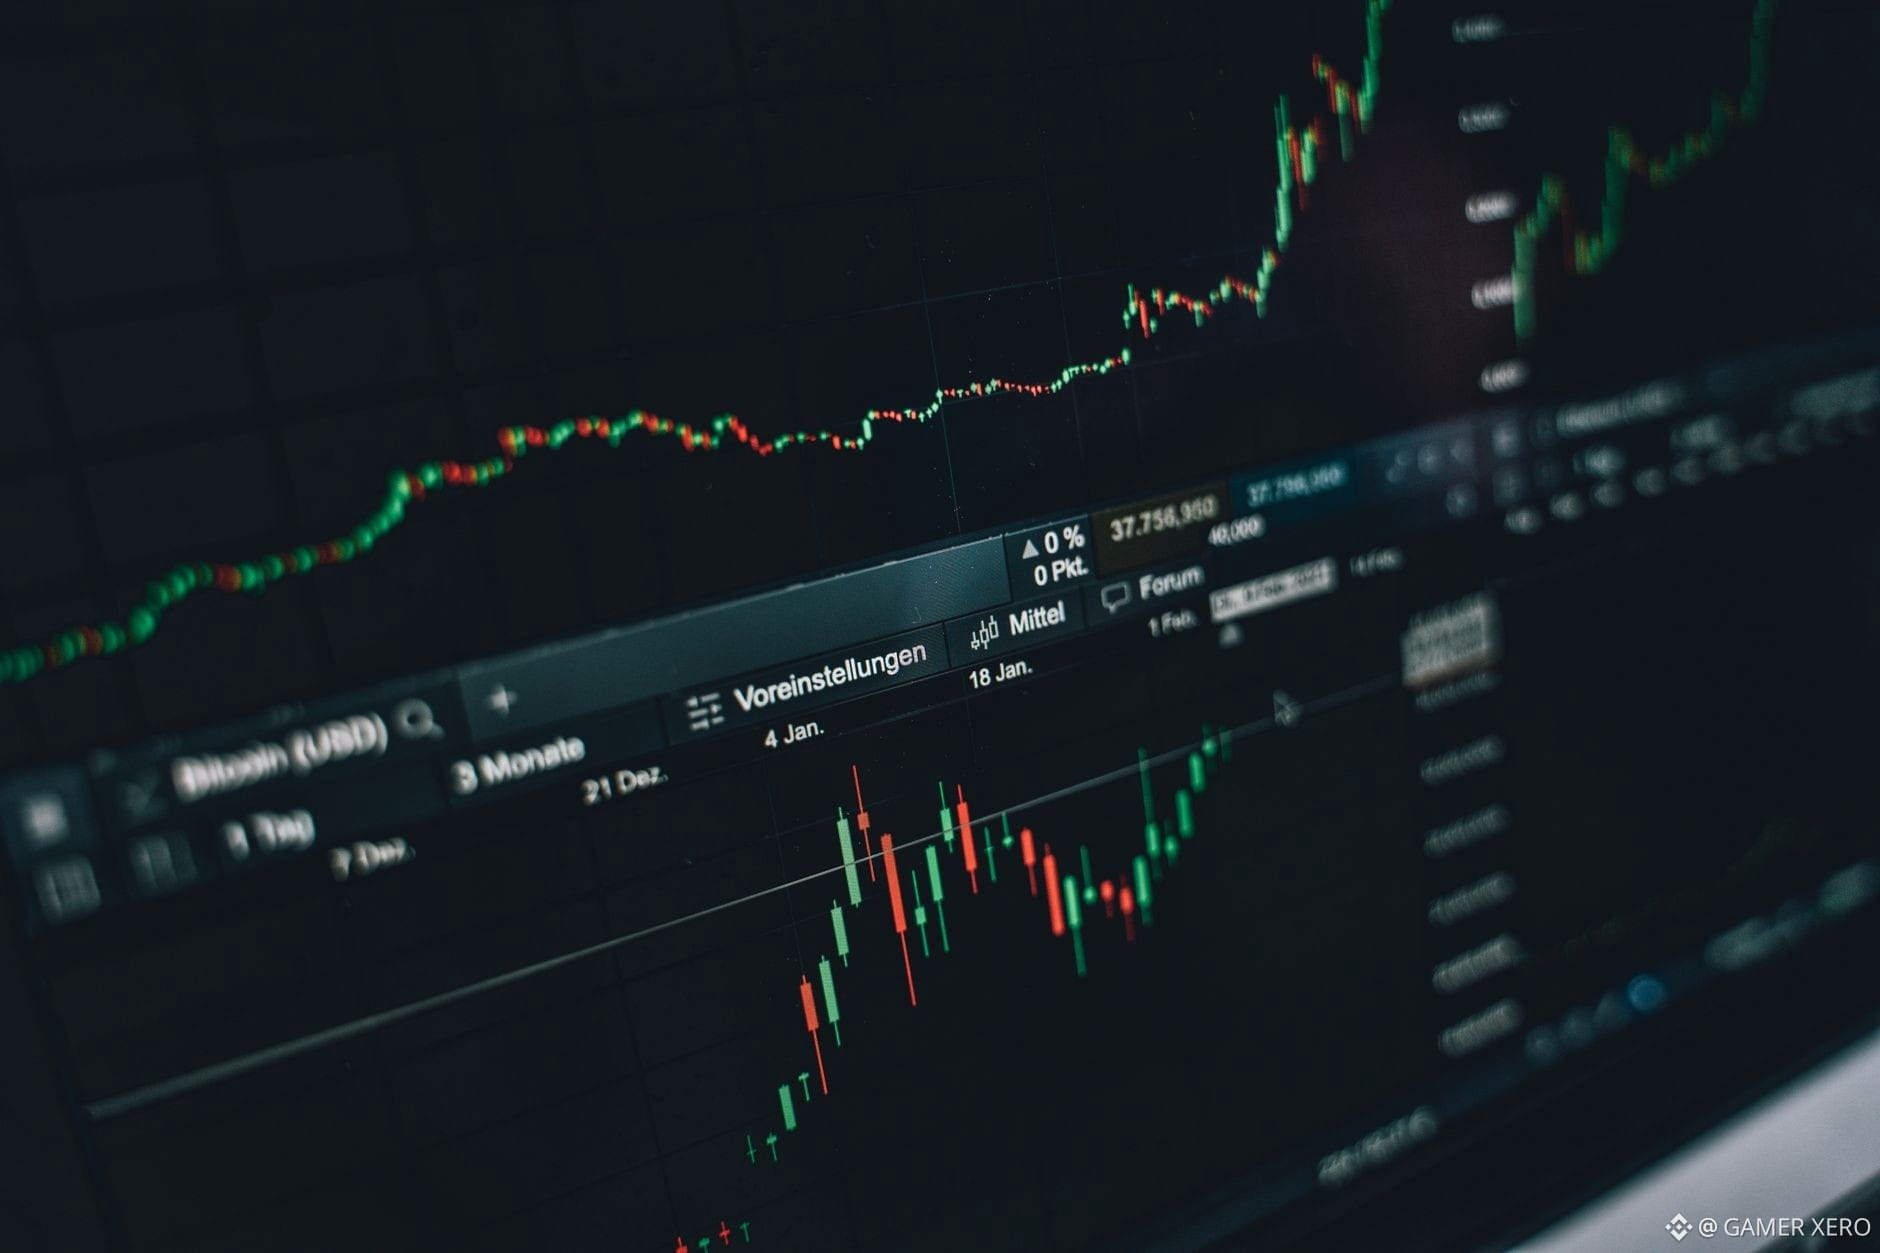
Spotting short‑term pressure on Binance often starts with the Order‑Book Imbalance (OBI). Open the Depth view, set the price window to ±0.5 % of the current $BTC price – that’s roughly $77,220‑$77,785 when $BTC sits at $77,602.45. Count the total bid size versus ask size in that band. If bids outweigh asks by, say, 60 % to 40 %, the market shows buying pressure; a reverse ratio suggests sellers are in control.
This simple read helped me notice a subtle shift this morning. $BTC was hovering just above its 24‑hour low of $76,888, and the OBI within the ±0.5 % window showed a 55 % bid side versus 45 % ask side. The imbalance hinted at a possible floor forming, which later aligned with a modest bounce toward the $77,800 level before the next resistance near the 24‑hour high of $79,999.
Using OBI lets you gauge real‑time sentiment without diving into complex indicators. Have you tried slicing the depth chart this way, and what patterns have you observed?
#CryptoEducation #OnChainTools #TradingTips #GAMERXERO
This simple read helped me notice a subtle shift this morning. $BTC was hovering just above its 24‑hour low of $76,888, and the OBI within the ±0.5 % window showed a 55 % bid side versus 45 % ask side. The imbalance hinted at a possible floor forming, which later aligned with a modest bounce toward the $77,800 level before the next resistance near the 24‑hour high of $79,999.
Using OBI lets you gauge real‑time sentiment without diving into complex indicators. Have you tried slicing the depth chart this way, and what patterns have you observed?
#CryptoEducation #OnChainTools #TradingTips #GAMERXERO