

HYPE/USDT Perpetual · Binance · 15-Minute Chart · August 23, 2026
HYPE has spent the past several sessions carving out one of the cleanest ascending structures on the board. Since bottoming near the low-$69 zone, price has printed a textbook higher-high, higher-low sequence inside a rising channel — and right now it's parked in a tight coil just under a key resistance shelf. Traders are asking the obvious question: does this consolidation resolve up, or is this the top of the move?
Here's what the chart is actually telling us.
The Structure So Far
Zooming out, the market-structure story is straightforward:
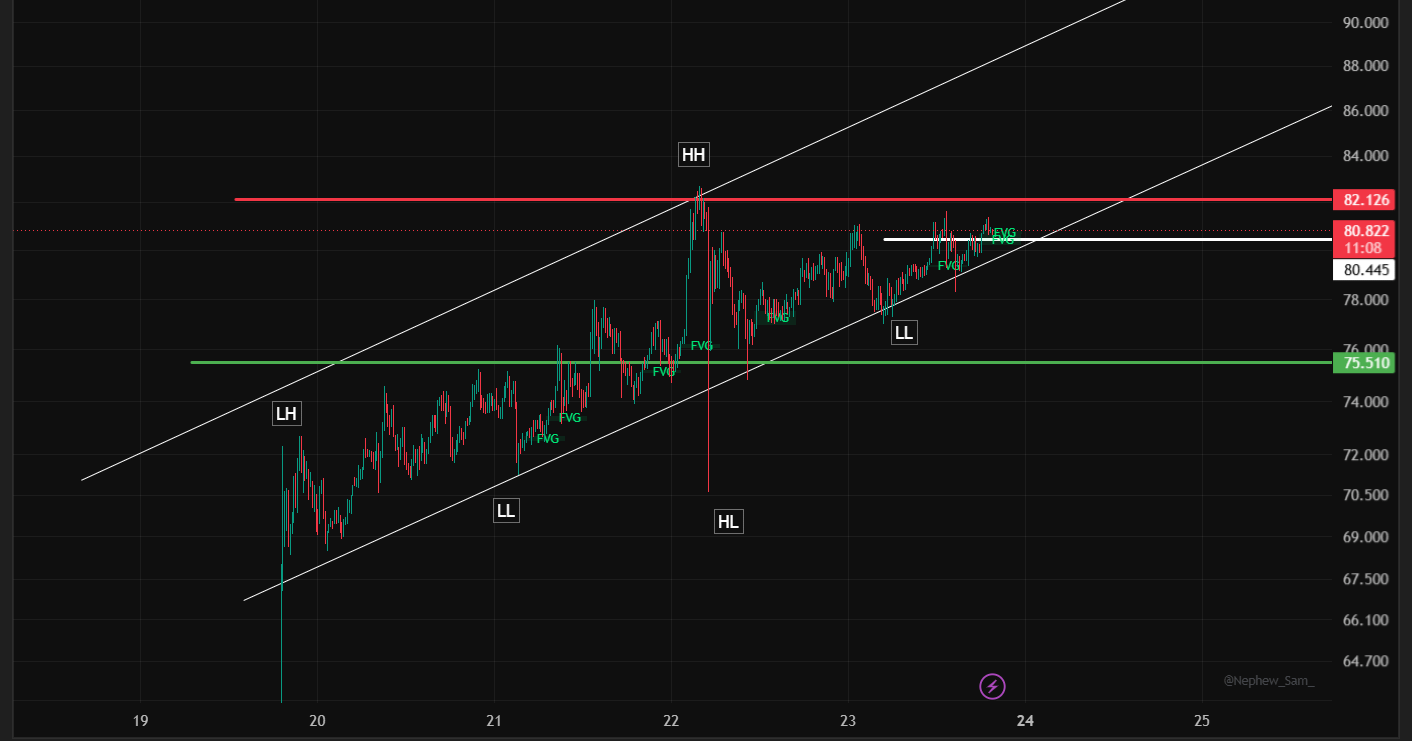
A lower high (LH) near 72.8 kicked off the current leg, followed by a lower low (LL) around 70.8.
From there, buyers stepped in and printed a higher low (HL) in the 68.9 region — the deepest wick on the chart — before staging a sharp impulsive rally.
That rally produced the higher high (HH) at 82.126, which is now acting as the dominant resistance level on the chart.
Since tagging that high, price has pulled back into a lower low (LL) near the 78 area on the retracement, then stabilized and started grinding back up through a series of tightening candles.
The price is currently trading at 80.830, sandwiched between the 82.126 resistance shelf above and a well-tested support band between 80.445 and 75.510 below. Several Fair Value Gaps (FVGs) and inverse FVGs are stacked along the way up, which is generally read as a sign of an efficient, well-supported uptrend rather than a blow-off move — each gap has largely been respected as support on the way through.
Key Levels to Watch
Resistance:
82.126 — the swing high (HH) and the level that has capped every attempt higher since the impulsive move. A confirmed 15-minute close above this, ideally with volume, is the trigger most breakout traders will be watching for.
Support:
80.445 — the immediate shelf from the recent consolidation (visible as the white reference line on the chart). This is the first line of defense for bulls.
75.510 — the larger structural support and the level that defines the bottom of the current higher-low range. A break below this would put the broader uptrend in question.
Trade Setups Worth Considering
1. Breakout-Continuation Long
Entry: On a confirmed close above 82.126 (some traders will want to see a retest of this level turn into support before entering).
Target: First target near 85.50–86.00, in line with the upper boundary of the ascending channel; a stretch target sits higher if momentum accelerates.
Stop-loss: Below 80.445, which invalidates the breakout thesis and signals a false break.
2. Support-Bounce Long (buy the dip)
Entry: Scaling in on a pullback into the 78.00–75.510 zone, where the prior LL and the major support line converge.
Target: Back toward the 82.126 resistance for the first leg.
Stop-loss: A close below 75.00, which would break the current higher-low structure.
3. Fade-the-Resistance Short (counter-trend, higher risk)
Entry: On rejection wicks at or just above 82.126 if price fails to close through it.
Target: Back down to the 78.00 shelf, with an extended target at 75.510.
Stop-loss: A close above 82.50, since a strong close through resistance invalidates the short thesis.
The Bottom Line
The path of least resistance has been up since the higher-low formed near 69, and the tightening range just beneath 82.126 looks more like accumulation than exhaustion — but resistance is resistance until it isn't. Bulls want a decisive close above 82.126 to open the door toward the mid-$80s; a rejection here, followed by a loss of the 80.445 shelf, would instead point back toward a retest of the 75.510 support zone.
As always, patience for confirmation — rather than anticipation of the break — tends to be the difference between a good entry and a liquidity grab.
Disclaimer: This article is for informational and educational purposes only and does not constitute financial, investment, or trading advice. Cryptocurrency derivatives, including perpetual contracts, are highly volatile and leveraged instruments that carry a significant risk of loss. Always conduct your own research and risk management, and consider consulting a licensed financial advisor before making any trading decisions.
@Binance Square Official #BitcoinStrongestWeekSinceMarch2023 #BPIUrgesFinCENExpandStablecoinIDRulesToSecondaryMarkets #AnthropicIPOCouldTopSpaceXRecordReportsSay #Binance #ChartSniper