

15-Minute Chart Analysis | BMT (Bubblemaps) Perpetual Contract (Binance) | August 22, 2026
Cross-check note: live price sources for BMT (CoinGecko, TradingView, CoinGlass, and Binance's own listing pages) currently return inconsistent figures from different dates, and none could be confirmed as matching this exact chart snapshot (0.01666 as of Aug 22, 09:34 UTC) in real time. The structural levels below are read directly from the provided chart; please confirm the live price and current structure on your own Binance terminal before acting, especially given how sharply this asset has already moved.
The Setup
BMT/USDT has just been through a fast, dramatic rally-and-reversal cycle, and the current price action is really about finding out what happens next.
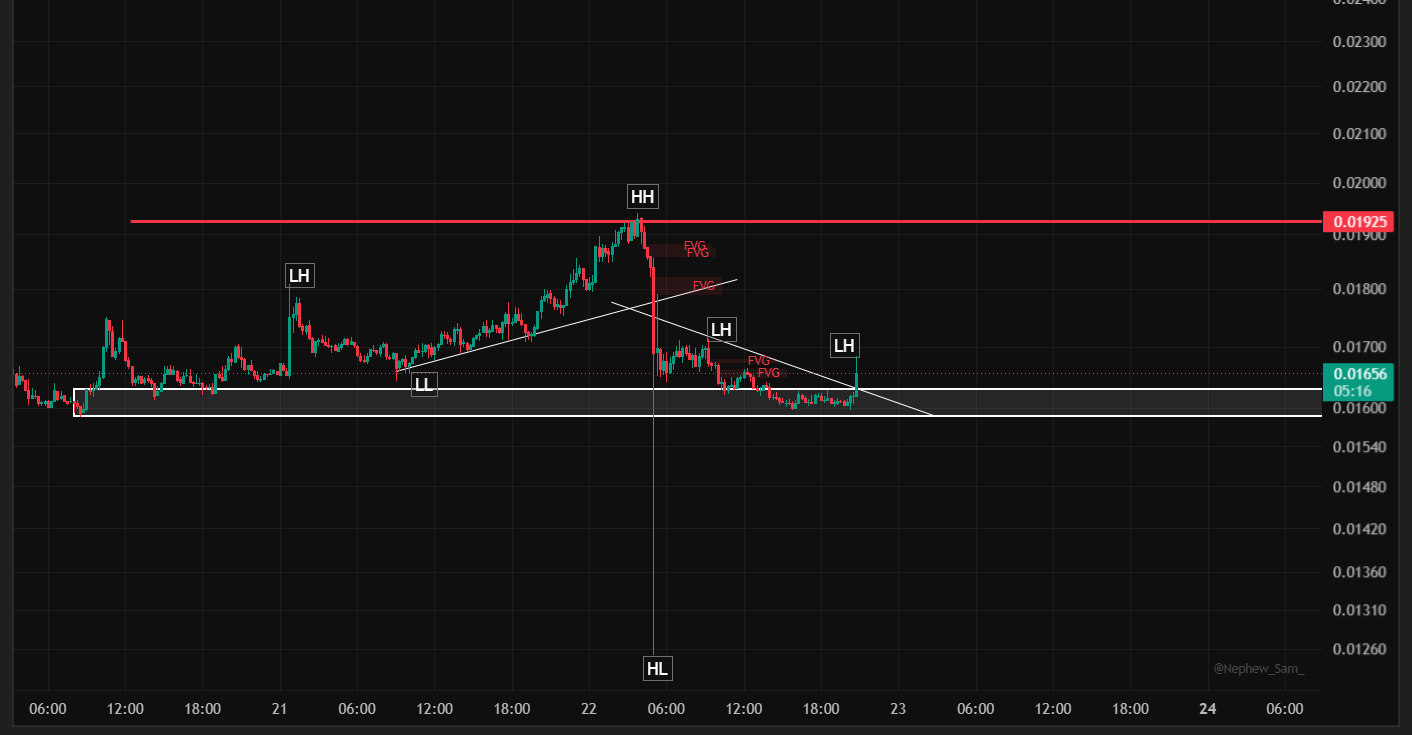
The rally: Price built a rising trendline off a Lower Low (LL) base, climbing steadily through a Lower High (LH) and grinding higher until it broke into a strong impulsive leg, ultimately tagging a Higher High (HH) at 0.01925.
The pop: From that high, BMT reversed violently — a single large red candle tore straight through the FVG stack left behind by the rally and kept going, plunging all the way down to a Higher Low far below, near the bottom of this chart's visible range. That's an extreme, fast move that wiped out a large portion of the prior gains almost immediately.
The aftermath: Since that flush, BMT has stabilized into a range, bouncing between roughly 0.0160 and 0.0170, with a descending trendline now capping the recovery attempts (connecting the HH through two subsequent Lower Highs). Price is currently at 0.01666, up a solid +2.90% intraday, testing the upper part of that range right where the descending trendline and the range ceiling meet.
What This Means
The original rising trendline from before the crash is broken — this is no longer the same clean uptrend it was.
A new, shorter-term descending trendline has taken over, and today's move is testing it directly. A clean break of this line would be the first real sign that the recovery has some teeth.
The 0.0160 – 0.0170 range has held for a couple of days now, which is a constructive sign after such a violent flush — but it's still a range, not a confirmed reversal back to bullish.
Key Levels on the Chart
Resistance above:
0.0170 — the range ceiling and descending trendline confluence, exactly where price is trading right now
0.01925 — the original high, a long way off and only relevant if the descending trendline breaks with real conviction
Support below:
0.0160 — the range floor, the level that's held on multiple tests since the crash
Below that: no clearly defined structure on this chart, meaning a breakdown here would be a genuine warning sign
Trade Plan (Educational Framework Only)
🟢 Range Long — Buy the Floor, Not the Middle
While this remains range-bound, the better-defined trade is at the edges rather than chasing the current bounce.
Entry zone: 0.0160 – 0.0163 (range floor)
Stop loss: Below 0.0155 (a clean break of the established range floor)
Target 1: 0.0170 (range ceiling / descending trendline)
Target 2: Only on confirmed breakout above the descending trendline (see below)
🟡 Breakout Momentum Entry
Since price is testing the descending trendline and range ceiling right now, this is the setup to watch most closely:
Entry: A 15-minute close above 0.0170 with continuation (confirms both the range ceiling and the descending trendline are broken)
Stop loss: Below 0.0163 (back inside the range)
Target 1: 0.0178 (prior Lower High level)
Target 2: 0.01925 (the original high, more ambitious)
🔴 Invalidation
A decisive close below 0.0160 would break the current range floor and suggest the correction isn't over, with no clear support defined below that level on this chart.
Bottom Line
BMT/USDT went through a sharp boom-and-bust cycle, and the market has spent the last couple of days building a base in a defined range. Today's move is testing the exact level — the descending trendline meeting the range ceiling — that would need to break for this to look like a genuine recovery rather than just a bounce inside a larger correction. Until that break is confirmed, trading the edges of the range is the more disciplined approach than chasing the current push.
⚠️ Disclaimer: This article is for educational and informational purposes only and does not constitute financial advice. Cryptocurrency trading carries significant risk, and BMT/USDT — as this chart demonstrates — can move sharply and unpredictably in short windows. Always do your own research (DYOR), verify current live pricing directly on the exchange, and manage risk according to your own financial situation before entering any trade. Past structure and technical patterns do not guarantee future price behavior.
@Binance Square Official #USCanadaTradeTalksCollapseCanadaVowsRetaliation #SP500EndsWeeklyWinStreak #TRUMPBreaksAbove$3.4HighestSinceMarch21 #Binance #ChartSniper