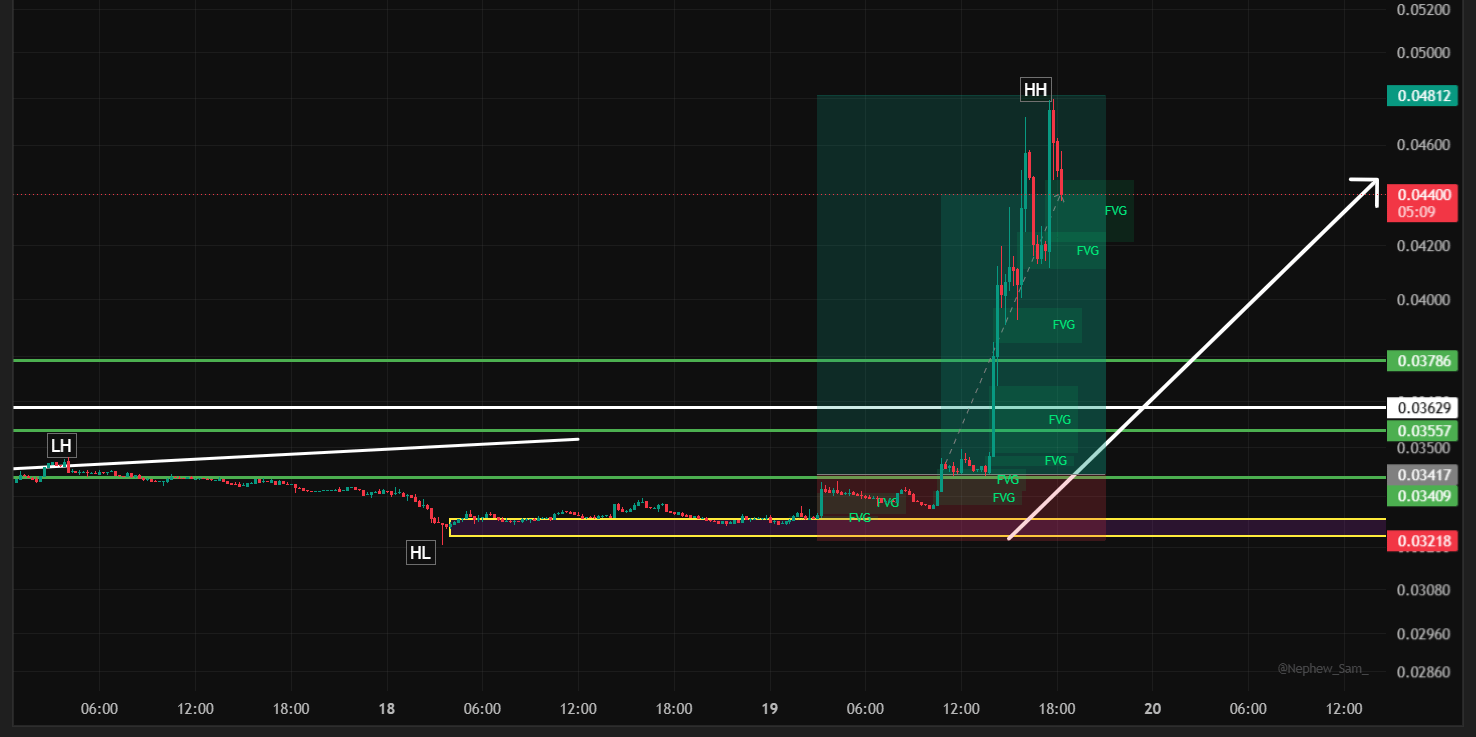

15-Minute Chart Analysis | TREE Perpetual Contract (Binance) | August 19, 2026
📌 Called in advance: The rising wedge structure on TREE — the steady Higher Low sequence climbing into a squeeze, capped by repeated Lower Highs — was flagged as a coiling setup before the breakout. The subsequent flush into the demand zone, the sweep of the range low, and the explosive vertical expansion into a fresh Higher High were anticipated ahead of the move. What's on the chart now is that call playing out in real time, not a story written after the fact.
The Setup
TREE/USDT spent days building a rising wedge — a sequence of Higher Lows (HL) grinding upward while Lower Highs (LH) capped every rally underneath a shrinking channel. Wedges like this typically resolve with a sharp move once the range finally gives way, and that's exactly what happened here.
The sequence on the chart:
An early HH near the top of the range, followed by a pullback into a HL.
Two consecutive LH rejections as the wedge tightened, pressure building with each failed attempt higher.
A decisive breakdown through the wedge's rising trendline into a fresh, lower HL — a liquidity sweep that grabbed the range low before reversing hard.
From that sweep, price exploded vertically through a dense stack of Fair Value Gaps (FVGs), tagging a brand-new Higher High at 0.04783 — smashing straight through the prior HH at 0.03786.
Price has since pulled back modestly from that high, currently trading at 0.04546, still up +1.09% on the session and sitting inside the upper FVG band.
This is a textbook "sweep-then-expand" move: liquidity below the range was taken, then price expanded aggressively in the opposite direction — a strong bullish signal as long as the reclaimed structure holds.
Reading the Pullback
The move from ~0.0325 to 0.04783 happened almost entirely in a handful of candles — an extremely stretched, low-retracement rally. A pullback of this size (from 0.04783 to 0.04546) is healthy and expected after such a vertical thrust; the real test is whether buyers defend the FVG stack on any deeper retracement, or whether this cools into a longer consolidation before the next leg.
A new ascending trendline is already forming off the breakout base, projecting rising support beneath price — worth watching as a dynamic floor if the retracement extends.
Key Levels on the Chart
Resistance above:
0.04783 — the current session Higher High
0.05000 — psychological round-number resistance, untested
Support / demand below (the FVG stack + prior structure):
0.04200 – 0.04400 — mid-to-upper Fair Value Gaps, first reaction zone on any pullback
0.03786 — the previous Higher High, now the key structural support to reclaim/hold
0.03629 — secondary support
0.03557 — resistance-turned-support line
0.03409 / 0.03417 — deeper support band
0.03218 — breaker/invalidation zone at the base of the entire move
Trade Plan (Educational Framework Only)
🟢 Preferred Long Setup — Pullback/FVG Retest
Given how extended this rally already is, chasing the high offers poor risk/reward. The cleaner approach is waiting for price to retrace into the unfilled FVG zone before continuation.
Entry zone: 0.04200 – 0.04400 (FVG confluence, first real demand pocket after the breakout)
Stop loss: Below 0.03786 (a close back below the old HH breaks the bullish thesis)
Target 1: 0.04783 (retest of the current high)
Target 2: 0.05000 (psychological level)
Target 3 (extended): New highs above 0.05000 if momentum sustains
🟡 Aggressive/Momentum Entry
For traders willing to enter into strength with tighter risk:
Entry: Confirmation candles holding above 0.04550 – 0.04600
Stop loss: Below 0.04200 (loss of the FVG zone)
Target 1: 0.04783
Target 2: 0.05000
🔴 Invalidation
A decisive close back below 0.03786 (the previous Higher High) would signal the breakout has failed and reopen downside risk toward 0.03409 and, ultimately, the 0.03218 breaker zone.
Bottom Line
TREE/USDT just delivered a high-momentum breakout out of a multi-day wedge, sweeping liquidity before expanding straight into a new Higher High. The structure remains bullish above 0.03786, but given how far and fast price has already moved, waiting for a retrace into the FVG demand zone offers a far more favorable entry than chasing strength at the highs.
As flagged ahead of time, the wedge break, the liquidity sweep, and the vertical expansion into a fresh HH have all unfolded exactly as anticipated.
⚠️ Disclaimer: This article is for educational and informational purposes only and does not constitute financial advice. Cryptocurrency trading carries significant risk, and TREE/USDT — like most low-cap perpetual contracts — can be highly volatile, especially after a parabolic move. Always do your own research (DYOR) and manage risk according to your own financial situation before entering any trade. Past structure and technical patterns do not guarantee future price behavior.
@Binance Square Official #CryptoRally #FOMCWatch #ColdcardTheftInvestigationAdvances #Binance #ChartSniper