

Two readings turned at the same time this week, and they do not usually turn together.
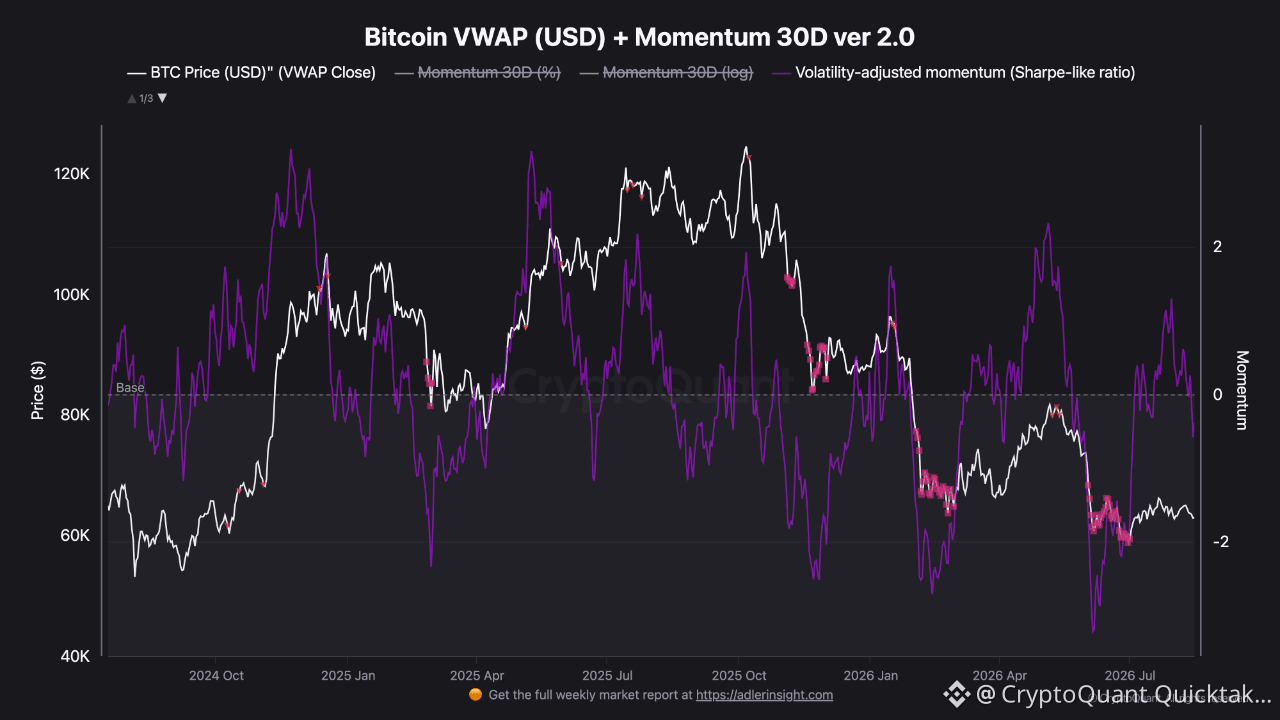
The first is momentum. The volatility-adjusted version, the Sharpe-like ratio, just crossed below its base line. This is the version I pay attention to because raw 30-day momentum will happily print a big number on a move that was mostly noise. Dividing by realized volatility asks a harder question: was the move worth the risk it took to get it? Right now the answer flipped to no. Earlier this year that same line was running above +2. It has been giving that back in steps ever since, and it is now on the wrong side of zero.
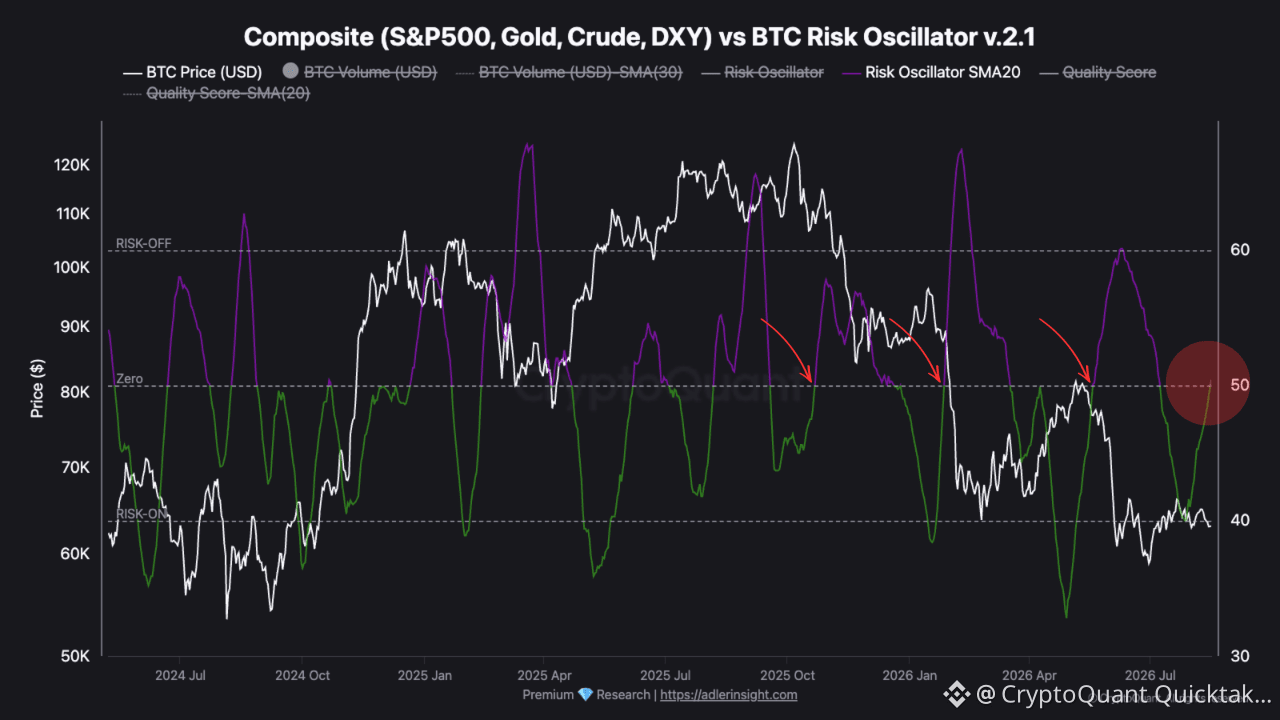
The second is the risk oscillator, measured against a composite of the S&P 500, gold, crude and the dollar. It has climbed back to the zero line. That level has mattered. Marked on the chart are the three previous times it arrived here, and each one was followed by a meaningful leg down in price rather than a bounce. Capital was rotating out of bitcoin and into the rest of that basket each time.
So one indicator says the trend is no longer paying, and the other says the macro bid is moving somewhere else. Individually, neither is a verdict. Together they describe a market with no support from either side of the book.
The honest limits. Three prior instances is a small sample, and small samples flatter whoever is reading them. The oscillator sitting at zero is a boundary, not a confirmation, and boundaries get rejected as often as they get broken. I have written here before about compression building in realized volatility, and compression is not directional. It stores energy without telling you which way it discharges.
What I will say is that the release, whenever it comes, is now arriving into worse conditions than it would have a month ago. Is that telling us the resolution is down? Maybe. I am watching both of these closely.
Written by RugaResearch