

Crypto Signals and Analysis
76 Publications
Crypto Signals and Analysis
Signaler
Bloquer l’utilisateur
Crypto trading signals and market analysis. We identify key levels, clear entry points, and defined targets with a disciplined focus on risk management.
Ouvert au trading
Trade régulièrement
3.4 an(s)
2 Suivis
39 Abonnés
56 J’aime
Publications
Portefeuille
·
--
Baissier
Voir la traduction
$HBAR Price Prediction Today (Oct 29): Hedera Crypto Signal & Technical Analysis 📊
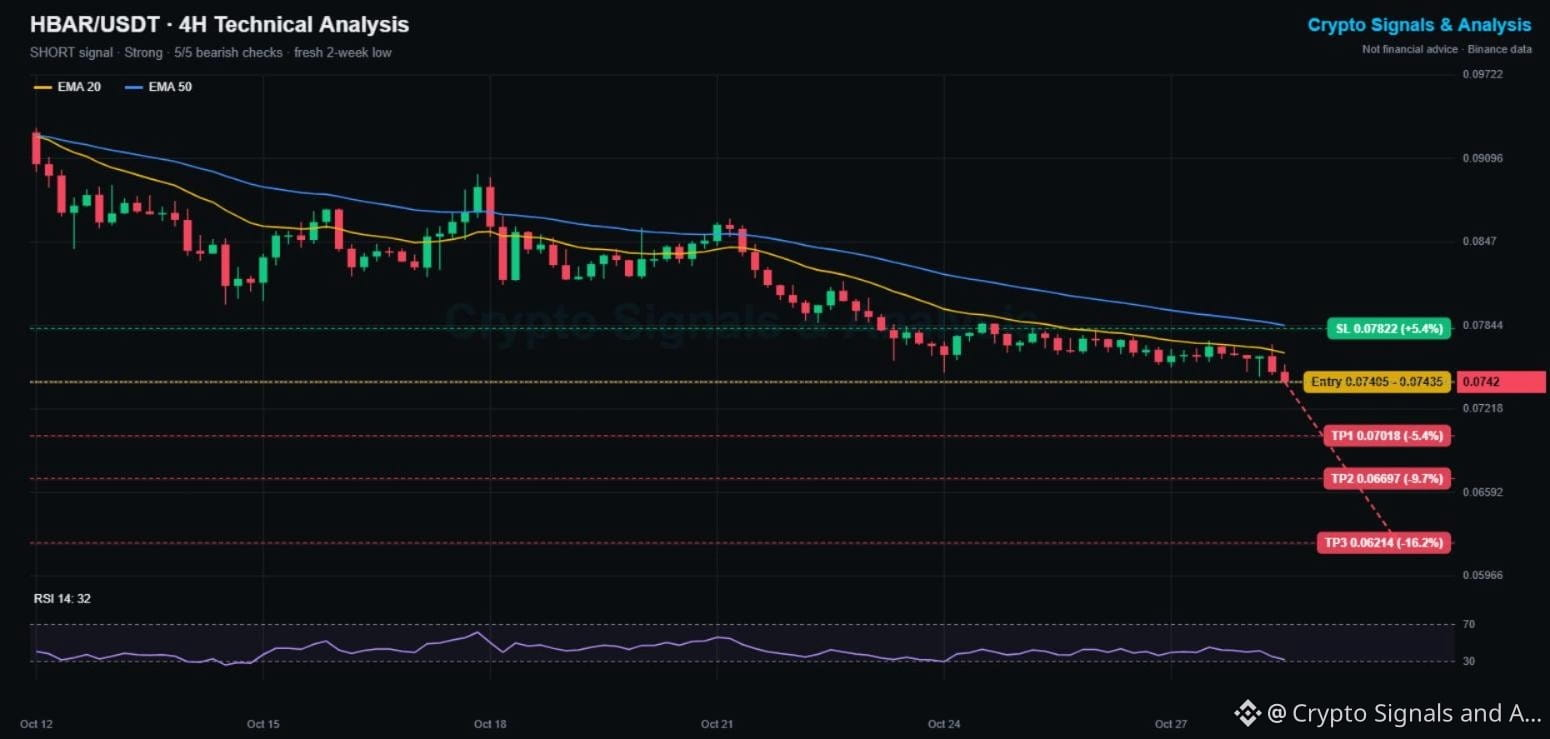
🔴 SHORT | Entry 0.07405 - 0.07435 | TP1 0.07018 | SL 0.07822
👉 Tap $HBAR to place your trade fast
🕒 Updated: Oct 29, 01:43 UTC · price 0.0742
Hedera just broke to a new 2-week low at 0.0742. It is down 3.4% in 24 hours and 10.2% this week, one of the weakest large caps on Binance tonight.
📌 HEDERA TRADING SIGNAL (Strong, 5/5 signals agree)
Entry: 0.07405 - 0.07435
Take profit 1: 0.07018 (-5.4%)
Take profit 2: 0.06697 (-9.7%)
Take profit 3: 0.06214 (-16.2%)
Stop loss: 0.07822 (+5.4%)
📊 HBAR TECHNICAL ANALYSIS (4H CHART)
Price is below the EMA20 (0.0764) and EMA50 (0.0784), both falling, with lower highs since Oct 21. RSI is 32, close to oversold, so a relief bounce toward 0.0764 is possible before the next leg down.
🔑 KEY LEVELS
Support: 0.0742 (new low), then 0.0702
Resistance: 0.0764 (EMA20), then 0.0784
📉 Bearish scenario: staying under 0.0742 opens TP1 at 0.0702.
📈 Bullish scenario: reclaiming the EMA20 slows the drop. A close above 0.07822 cancels this signal.
💡 Bottom line: trend is clearly down, but RSI is low. A bounce into 0.076 is a better entry than shorting the low.
👉 Tap $HBAR
to open the live chart. NFA
🔥 NEW TO BINANCE?
✅ No Binance account yet? Sign up with referral code SQUAREGINOS and get a 10% kickback on your Futures trading fees.
👇👇👇
{spot}(HBARUSDT)
[Sign up on Binance here (10% Futures fee kickback)](https://www.binance.com/join?ref=SQUAREGINOS)
━━━━━━━━━━
Does Hedera bounce from here or slide to 0.070? 👇
Follow Crypto Signals and Analysis for daily signals.
#cryptosignals #HBAR #FOMCWatch
⚠️ Crypto is volatile: risk only what you can afford to lose.
$HBAR Price Prediction Today (Oct 29): Hedera Crypto Signal & Technical Analysis 📊
🔴 SHORT | Entry 0.07405 - 0.07435 | TP1 0.07018 | SL 0.07822
👉 Tap $HBAR to place your trade fast
🕒 Updated: Oct 29, 01:43 UTC · price 0.0742
Hedera just broke to a new 2-week low at 0.0742. It is down 3.4% in 24 hours and 10.2% this week, one of the weakest large caps on Binance tonight.
📌 HEDERA TRADING SIGNAL (Strong, 5/5 signals agree)
Entry: 0.07405 - 0.07435
Take profit 1: 0.07018 (-5.4%)
Take profit 2: 0.06697 (-9.7%)
Take profit 3: 0.06214 (-16.2%)
Stop loss: 0.07822 (+5.4%)
📊 HBAR TECHNICAL ANALYSIS (4H CHART)
Price is below the EMA20 (0.0764) and EMA50 (0.0784), both falling, with lower highs since Oct 21. RSI is 32, close to oversold, so a relief bounce toward 0.0764 is possible before the next leg down.
🔑 KEY LEVELS
Support: 0.0742 (new low), then 0.0702
Resistance: 0.0764 (EMA20), then 0.0784
📉 Bearish scenario: staying under 0.0742 opens TP1 at 0.0702.
📈 Bullish scenario: reclaiming the EMA20 slows the drop. A close above 0.07822 cancels this signal.
💡 Bottom line: trend is clearly down, but RSI is low. A bounce into 0.076 is a better entry than shorting the low.
👉 Tap $HBAR
to open the live chart. NFA
🔥 NEW TO BINANCE?
✅ No Binance account yet? Sign up with referral code SQUAREGINOS and get a 10% kickback on your Futures trading fees.
👇👇👇
Sign up on Binance here (10% Futures fee kickback)
━━━━━━━━━━
Does Hedera bounce from here or slide to 0.070? 👇
Follow Crypto Signals and Analysis for daily signals.
#cryptosignals #HBAR #FOMCWatch
⚠️ Crypto is volatile: risk only what you can afford to lose.
1
·
--
Haussier
Voir la traduction
$ZEC Price Prediction Today (Oct 29): Zcash Crypto Signal & Technical Analysis 📊
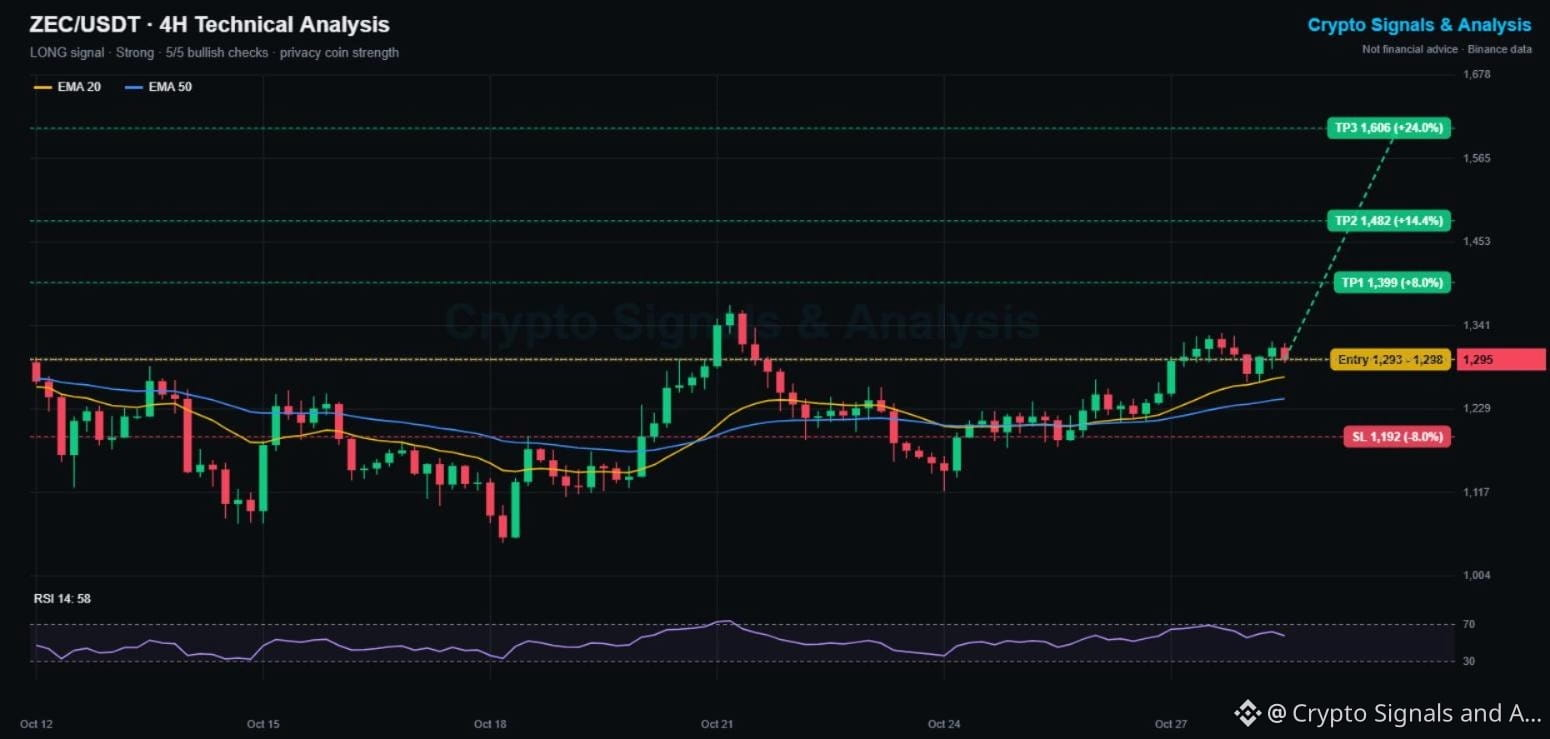
🟢 LONG | Entry 1,293 - 1,298 | TP1 1,399 | SL 1,192
👉 Tap $ZEC to place your trade fast
🕒 Updated: Oct 29, 01:25 UTC · price 1,295
Zcash is one of the few large coins with an uptrend on the 4H chart. It is the 4th most traded coin on Binance spot (about 147M USDT a day) and has held flat on the week while most altcoins lost 5-10%.
📌 ZCASH TRADING SIGNAL (Strong, 5/5 signals agree)
Entry: 1,293 - 1,298
Take profit 1: 1,399 (+8.0%)
Take profit 2: 1,482 (+14.4%)
Take profit 3: 1,606 (+24.0%)
Stop loss: 1,192 (-8.0%)
📊 ZEC TECHNICAL ANALYSIS (4H CHART)
Price is above the EMA20 (1,272) and EMA50 (1,243), both rising. RSI 58 gives room to run. Higher lows since Oct 24 (1,130, then 1,190, then 1,250) show steady buying.
🔑 KEY LEVELS
Support: 1,272 (EMA20), then 1,243
Resistance: 1,331, then 1,368 (Oct 21 high)
📈 Bullish scenario: a 4H close above 1,331 opens TP1 at 1,399.
📉 Bearish scenario: losing 1,243 breaks the higher-low structure. A close under 1,192 cancels this signal.
💡 Bottom line: one of the cleanest uptrends among the majors. 1,331 is the breakout trigger.
👉 Tap $ZEC
to open the live chart. NFA
🔥 NEW TO BINANCE?
✅ No Binance account yet? Sign up with referral code SQUAREGINOS and get a 10% kickback on your Futures trading fees.
👇👇👇
{spot}(ZECUSDT)
[Sign up on Binance here (10% Futures fee kickback)](https://www.binance.com/join?ref=SQUAREGINOS)
━━━━━━━━━━
Can Zcash break its Oct 21 high this week? 👇
Follow Crypto Signals and Analysis for daily signals.
#cryptosignals #ZEC #FOMCWatch
⚠️ Crypto is volatile: risk only what you can afford to lose.
$ZEC Price Prediction Today (Oct 29): Zcash Crypto Signal & Technical Analysis 📊
🟢 LONG | Entry 1,293 - 1,298 | TP1 1,399 | SL 1,192
👉 Tap $ZEC to place your trade fast
🕒 Updated: Oct 29, 01:25 UTC · price 1,295
Zcash is one of the few large coins with an uptrend on the 4H chart. It is the 4th most traded coin on Binance spot (about 147M USDT a day) and has held flat on the week while most altcoins lost 5-10%.
📌 ZCASH TRADING SIGNAL (Strong, 5/5 signals agree)
Entry: 1,293 - 1,298
Take profit 1: 1,399 (+8.0%)
Take profit 2: 1,482 (+14.4%)
Take profit 3: 1,606 (+24.0%)
Stop loss: 1,192 (-8.0%)
📊 ZEC TECHNICAL ANALYSIS (4H CHART)
Price is above the EMA20 (1,272) and EMA50 (1,243), both rising. RSI 58 gives room to run. Higher lows since Oct 24 (1,130, then 1,190, then 1,250) show steady buying.
🔑 KEY LEVELS
Support: 1,272 (EMA20), then 1,243
Resistance: 1,331, then 1,368 (Oct 21 high)
📈 Bullish scenario: a 4H close above 1,331 opens TP1 at 1,399.
📉 Bearish scenario: losing 1,243 breaks the higher-low structure. A close under 1,192 cancels this signal.
💡 Bottom line: one of the cleanest uptrends among the majors. 1,331 is the breakout trigger.
👉 Tap $ZEC
to open the live chart. NFA
🔥 NEW TO BINANCE?
✅ No Binance account yet? Sign up with referral code SQUAREGINOS and get a 10% kickback on your Futures trading fees.
👇👇👇
Sign up on Binance here (10% Futures fee kickback)
━━━━━━━━━━
Can Zcash break its Oct 21 high this week? 👇
Follow Crypto Signals and Analysis for daily signals.
#cryptosignals #ZEC #FOMCWatch
⚠️ Crypto is volatile: risk only what you can afford to lose.
19
·
--
Baissier
Voir la traduction
$DOT Price Prediction Today (Oct 29): Polkadot Crypto Signal & Technical Analysis 📊
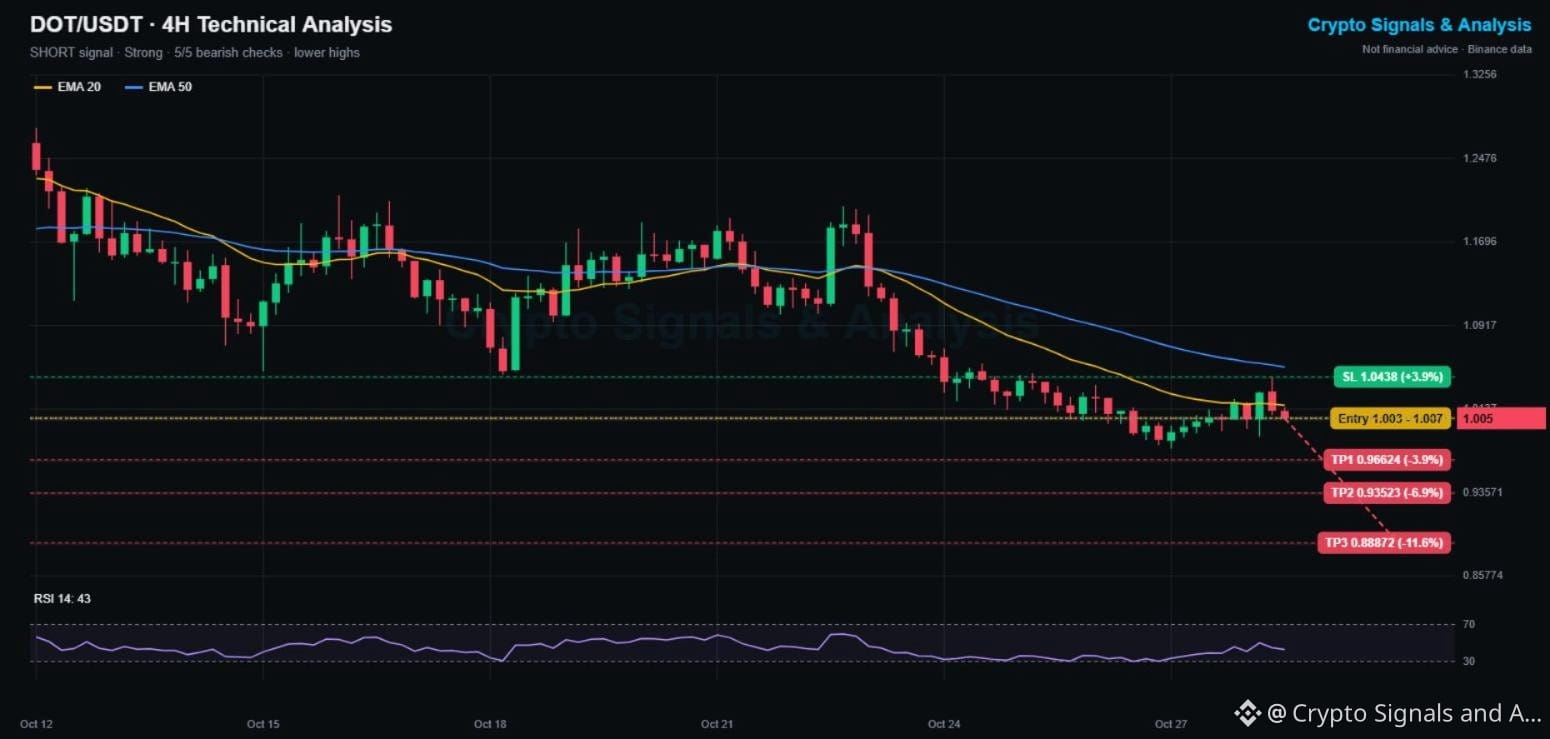
🔴 SHORT | Entry 1.003 - 1.007 | TP1 0.966 | SL 1.044
👉 Tap $DOT to place your trade fast
🕒 Updated: Oct 29, 01:08 UTC · price 1.005
Polkadot is clinging to the 1.00 level after falling 10.9% this week. The latest bounce to 1.043 was rejected under the 4H EMA50, and price is back at the falling EMA20.
📌 POLKADOT TRADING SIGNAL (Strong, 5/5 signals agree)
Entry: 1.003 - 1.007
Take profit 1: 0.966 (-3.9%)
Take profit 2: 0.935 (-6.9%)
Take profit 3: 0.889 (-11.6%)
Stop loss: 1.044 (+3.9%)
📊 DOT TECHNICAL ANALYSIS (4H CHART)
Price is below the EMA20 (1.017) and EMA50 (1.053), both sloping down. RSI 43 shows sellers in control. Lower highs since Oct 22 (1.20, then 1.08, then 1.043) define the trend.
🔑 KEY LEVELS
Support: 1.00, then 0.977 (2-week low)
Resistance: 1.017 (EMA20), then 1.043
📉 Bearish scenario: a 4H close under 0.977 opens TP2 at 0.935.
📈 Bullish scenario: holding 1.00 and reclaiming 1.043 cancels this signal.
💡 Bottom line: 1.00 is the line everyone watches. A clean break below it is the trigger.
👉 Tap $DOT
to open the live chart. NFA
🔥 NEW TO BINANCE?
✅ No Binance account yet? Sign up with referral code SQUAREGINOS and get a 10% kickback on your Futures trading fees.
👇👇👇
{spot}(DOTUSDT)
[Sign up on Binance here (10% Futures fee kickback)](https://www.binance.com/join?ref=SQUAREGINOS)
━━━━━━━━━━
Does Polkadot hold 1.00 or lose it this week? 👇
Follow Crypto Signals and Analysis for daily signals.
#cryptosignals #Polkadot #FOMCWatch
⚠️ Crypto is volatile: risk only what you can afford to lose.
$DOT Price Prediction Today (Oct 29): Polkadot Crypto Signal & Technical Analysis 📊
🔴 SHORT | Entry 1.003 - 1.007 | TP1 0.966 | SL 1.044
👉 Tap $DOT to place your trade fast
🕒 Updated: Oct 29, 01:08 UTC · price 1.005
Polkadot is clinging to the 1.00 level after falling 10.9% this week. The latest bounce to 1.043 was rejected under the 4H EMA50, and price is back at the falling EMA20.
📌 POLKADOT TRADING SIGNAL (Strong, 5/5 signals agree)
Entry: 1.003 - 1.007
Take profit 1: 0.966 (-3.9%)
Take profit 2: 0.935 (-6.9%)
Take profit 3: 0.889 (-11.6%)
Stop loss: 1.044 (+3.9%)
📊 DOT TECHNICAL ANALYSIS (4H CHART)
Price is below the EMA20 (1.017) and EMA50 (1.053), both sloping down. RSI 43 shows sellers in control. Lower highs since Oct 22 (1.20, then 1.08, then 1.043) define the trend.
🔑 KEY LEVELS
Support: 1.00, then 0.977 (2-week low)
Resistance: 1.017 (EMA20), then 1.043
📉 Bearish scenario: a 4H close under 0.977 opens TP2 at 0.935.
📈 Bullish scenario: holding 1.00 and reclaiming 1.043 cancels this signal.
💡 Bottom line: 1.00 is the line everyone watches. A clean break below it is the trigger.
👉 Tap $DOT
to open the live chart. NFA
🔥 NEW TO BINANCE?
✅ No Binance account yet? Sign up with referral code SQUAREGINOS and get a 10% kickback on your Futures trading fees.
👇👇👇
Sign up on Binance here (10% Futures fee kickback)
━━━━━━━━━━
Does Polkadot hold 1.00 or lose it this week? 👇
Follow Crypto Signals and Analysis for daily signals.
#cryptosignals #Polkadot #FOMCWatch
⚠️ Crypto is volatile: risk only what you can afford to lose.
43
$LTC conserve ses gains alors que le marché crypto s’endort à l’ouverture asiatique : Bitcoin bloqué à 81K 📰
🕒 Mis à jour : 29 oct., 00:52 UTC
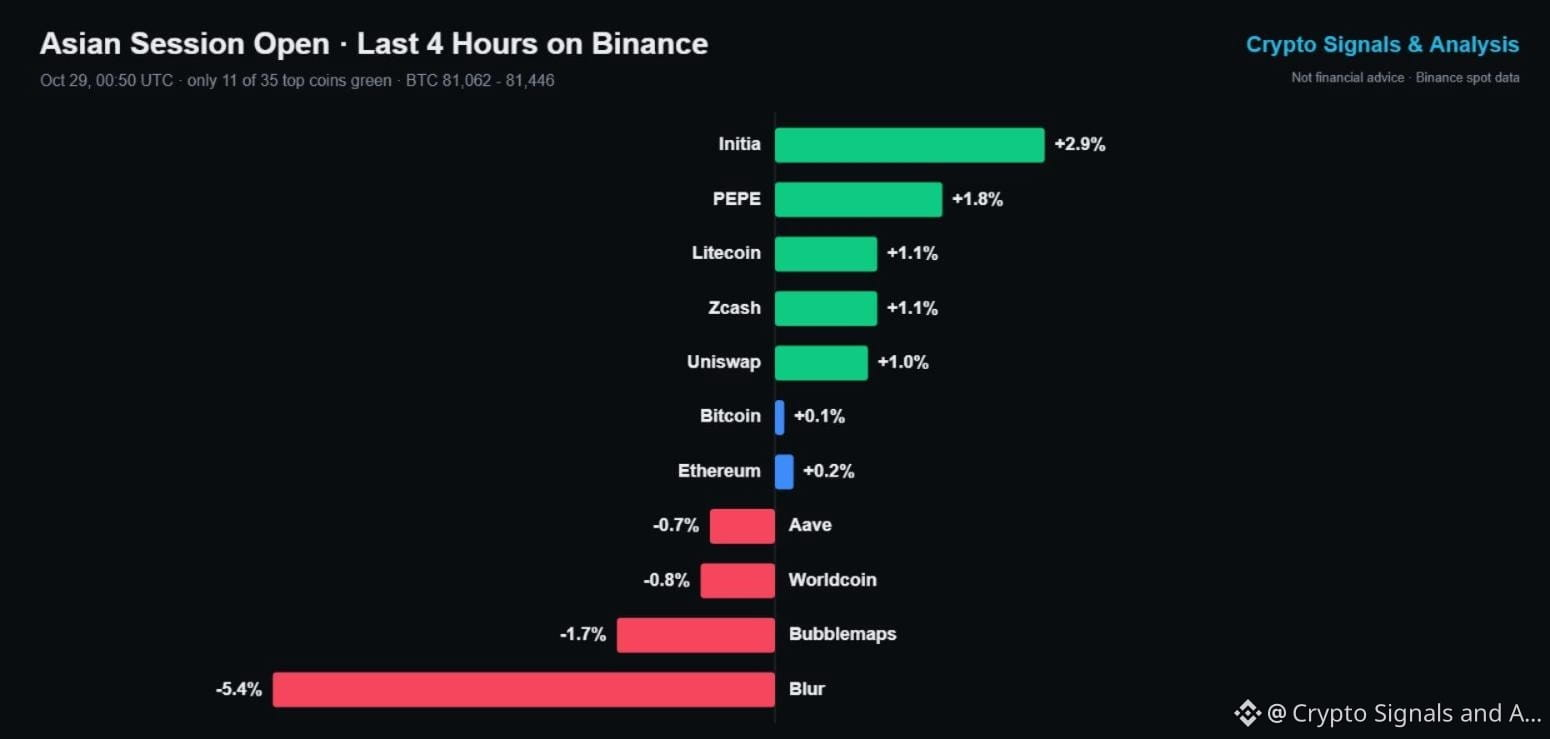
Le rebond des altcoins d’hier perd de son élan. Au cours des 4 dernières heures, seules 11 des 35 cryptomonnaies les plus échangées sur Binance sont dans le vert, et Bitcoin n’a bougé que de 0,5 % (81 062 - 81 446).
📰 CE QUI BOUGE EN CE MOMENT
🟢 Initia (+2,9 %) et PEPE (+1,8 %) poursuivent leur hausse après leurs fortes progressions du 28 oct.
🟢 Litecoin (+1,1 %) continue de grimper et se situe désormais autour de 59,4, en hausse de 4 à 5 % sur la dernière journée.
🔴 Blur (-5,4 %) rend une partie de son envolée de 16 % d’hier.
🟠 Bitcoin et Ethereum sont stables, Ethereum se situant autour de 2 357.
👀 À SURVEILLER
Les heures creuses en Asie précèdent souvent le prochain grand mouvement. Si Bitcoin sort de sa fourchette de 80 400 à 81 800, les petites capitalisations suivent généralement la même direction. D’ici là, attendez-vous à ce que les hausses comme celle de Blur s’essoufflent.
💡 En résumé : marché calme, fourchettes étroites. Ce soir, mieux vaut patienter que courir après les hausses.
👉 Appuyez sur $LTC
pour ouvrir le graphique en direct. Ceci ne constitue pas un conseil financier.
🔥 VOUS DÉCOUVREZ BINANCE ?
✅ Vous n’avez pas encore de compte Binance ? Inscrivez-vous avec le code de parrainage SQUAREGINOS et bénéficiez d’une remise de 10 % sur les frais de trading Futures.
👇👇👇
{spot}(LTCUSDT)
[Sign up on Binance here (10% Futures fee kickback)](https://www.binance.com/join?ref=SQUAREGINOS)
━━━━━━━━━━
Vous tradez pendant la session asiatique ou attendez la cassure ? 👇
Suivez Crypto Signals and Analysis pour recevoir les mises à jour du marché en direct.
#cryptosignals #Litecoin #FOMCWatch
⚠️ Les cryptomonnaies sont volatiles : n’investissez que ce que vous pouvez vous permettre de perdre.
$LTC conserve ses gains alors que le marché crypto s’endort à l’ouverture asiatique : Bitcoin bloqué à 81K 📰
🕒 Mis à jour : 29 oct., 00:52 UTC
Le rebond des altcoins d’hier perd de son élan. Au cours des 4 dernières heures, seules 11 des 35 cryptomonnaies les plus échangées sur Binance sont dans le vert, et Bitcoin n’a bougé que de 0,5 % (81 062 - 81 446).
📰 CE QUI BOUGE EN CE MOMENT
🟢 Initia (+2,9 %) et PEPE (+1,8 %) poursuivent leur hausse après leurs fortes progressions du 28 oct.
🟢 Litecoin (+1,1 %) continue de grimper et se situe désormais autour de 59,4, en hausse de 4 à 5 % sur la dernière journée.
🔴 Blur (-5,4 %) rend une partie de son envolée de 16 % d’hier.
🟠 Bitcoin et Ethereum sont stables, Ethereum se situant autour de 2 357.
👀 À SURVEILLER
Les heures creuses en Asie précèdent souvent le prochain grand mouvement. Si Bitcoin sort de sa fourchette de 80 400 à 81 800, les petites capitalisations suivent généralement la même direction. D’ici là, attendez-vous à ce que les hausses comme celle de Blur s’essoufflent.
💡 En résumé : marché calme, fourchettes étroites. Ce soir, mieux vaut patienter que courir après les hausses.
👉 Appuyez sur $LTC
pour ouvrir le graphique en direct. Ceci ne constitue pas un conseil financier.
🔥 VOUS DÉCOUVREZ BINANCE ?
✅ Vous n’avez pas encore de compte Binance ? Inscrivez-vous avec le code de parrainage SQUAREGINOS et bénéficiez d’une remise de 10 % sur les frais de trading Futures.
👇👇👇
Sign up on Binance here (10% Futures fee kickback)
━━━━━━━━━━
Vous tradez pendant la session asiatique ou attendez la cassure ? 👇
Suivez Crypto Signals and Analysis pour recevoir les mises à jour du marché en direct.
#cryptosignals #Litecoin #FOMCWatch
⚠️ Les cryptomonnaies sont volatiles : n’investissez que ce que vous pouvez vous permettre de perdre.
80
·
--
Haussier
Voir la traduction
$DOGE Price Prediction Today (Oct 29): Dogecoin Crypto Signal & Technical Analysis 📊
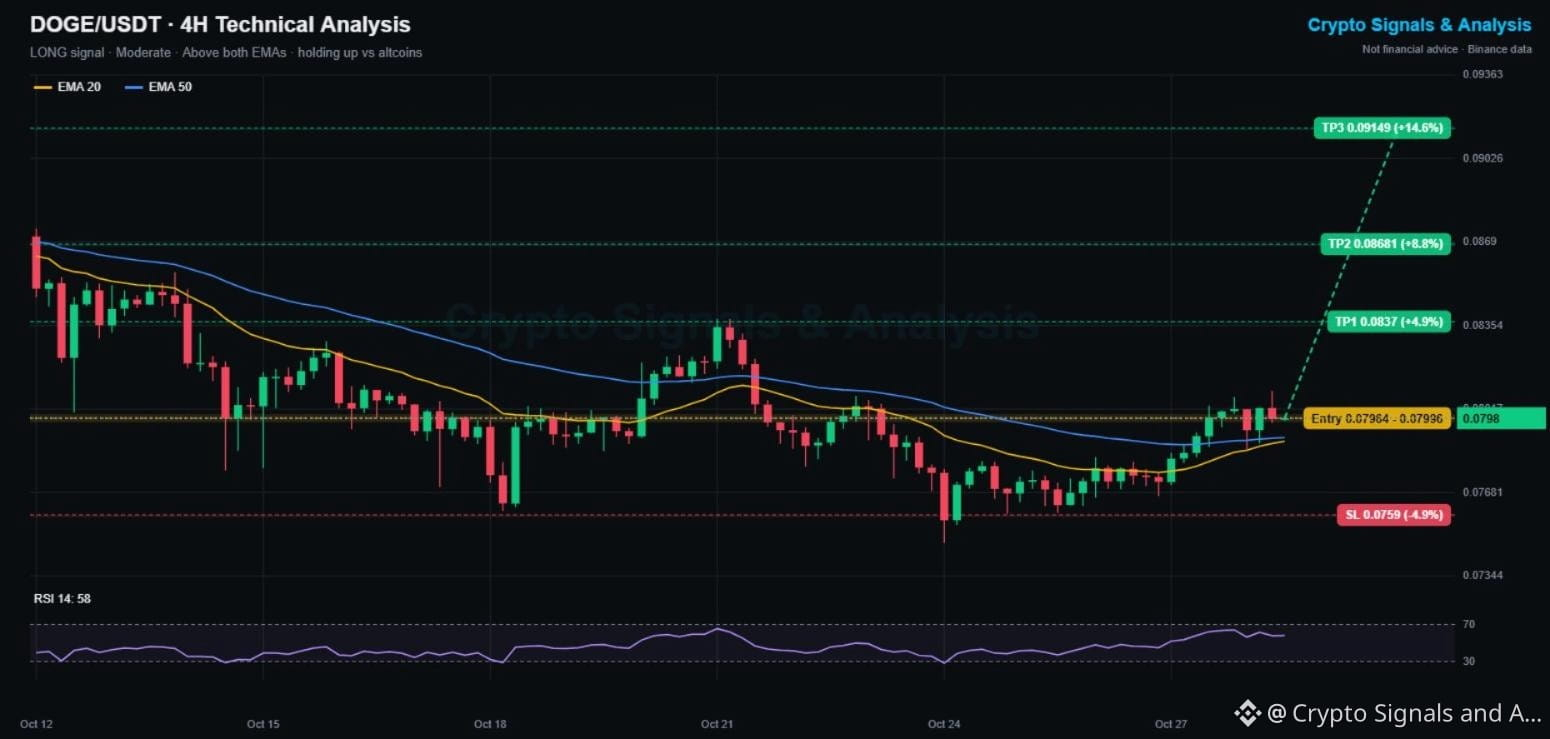
🟢 LONG | Entry 0.07964 - 0.07996 | TP1 0.0837 | SL 0.0759
👉 Tap $DOGE to place your trade fast
🕒 Updated: Oct 29, 00:35 UTC · price 0.0798
Dogecoin is almost flat on the week (-0.7%) while most large altcoins are down 5-10%. Since the Oct 24 low at 0.0748 it has made higher lows and is now trading above both 4H moving averages.
📌 DOGECOIN TRADING SIGNAL (Moderate, 4/5 signals agree)
Entry: 0.07964 - 0.07996
Take profit 1: 0.0837 (+4.9%)
Take profit 2: 0.0868 (+8.8%)
Take profit 3: 0.0915 (+14.6%)
Stop loss: 0.0759 (-4.9%)
📊 DOGE TECHNICAL ANALYSIS (4H CHART)
Price is above the EMA20 (0.0789) and EMA50 (0.0790), and the EMA20 is rising. RSI 58 favors buyers. The weak spot: 0.0809 rejected price twice in the last day.
🔑 KEY LEVELS
Support: 0.0789 (EMAs), then 0.0760
Resistance: 0.0809, then 0.0837 (Oct 21 high)
📈 Bullish scenario: a 4H close above 0.0809 opens TP1 at 0.0837.
📉 Bearish scenario: losing the EMAs puts 0.0760 back in play. A close under 0.0759 cancels this signal.
💡 Bottom line: relative strength is on Dogecoin's side. The trigger is a clean break of 0.0809.
👉 Tap $DOGE
to open the live chart. NFA
🔥 NEW TO BINANCE?
✅ No Binance account yet? Sign up with referral code SQUAREGINOS and get a 10% kickback on your Futures trading fees.
👇👇👇
{spot}(DOGEUSDT)
[Sign up on Binance here (10% Futures fee kickback)](https://www.binance.com/join?ref=SQUAREGINOS)
━━━━━━━━━━
Does Dogecoin finally break 0.081 this week? 👇
Follow Crypto Signals and Analysis for daily signals.
#cryptosignals #DOGE #FOMCWatch
⚠️ Crypto is volatile: risk only what you can afford to lose.
$DOGE Price Prediction Today (Oct 29): Dogecoin Crypto Signal & Technical Analysis 📊
🟢 LONG | Entry 0.07964 - 0.07996 | TP1 0.0837 | SL 0.0759
👉 Tap $DOGE to place your trade fast
🕒 Updated: Oct 29, 00:35 UTC · price 0.0798
Dogecoin is almost flat on the week (-0.7%) while most large altcoins are down 5-10%. Since the Oct 24 low at 0.0748 it has made higher lows and is now trading above both 4H moving averages.
📌 DOGECOIN TRADING SIGNAL (Moderate, 4/5 signals agree)
Entry: 0.07964 - 0.07996
Take profit 1: 0.0837 (+4.9%)
Take profit 2: 0.0868 (+8.8%)
Take profit 3: 0.0915 (+14.6%)
Stop loss: 0.0759 (-4.9%)
📊 DOGE TECHNICAL ANALYSIS (4H CHART)
Price is above the EMA20 (0.0789) and EMA50 (0.0790), and the EMA20 is rising. RSI 58 favors buyers. The weak spot: 0.0809 rejected price twice in the last day.
🔑 KEY LEVELS
Support: 0.0789 (EMAs), then 0.0760
Resistance: 0.0809, then 0.0837 (Oct 21 high)
📈 Bullish scenario: a 4H close above 0.0809 opens TP1 at 0.0837.
📉 Bearish scenario: losing the EMAs puts 0.0760 back in play. A close under 0.0759 cancels this signal.
💡 Bottom line: relative strength is on Dogecoin's side. The trigger is a clean break of 0.0809.
👉 Tap $DOGE
to open the live chart. NFA
🔥 NEW TO BINANCE?
✅ No Binance account yet? Sign up with referral code SQUAREGINOS and get a 10% kickback on your Futures trading fees.
👇👇👇
Sign up on Binance here (10% Futures fee kickback)
━━━━━━━━━━
Does Dogecoin finally break 0.081 this week? 👇
Follow Crypto Signals and Analysis for daily signals.
#cryptosignals #DOGE #FOMCWatch
⚠️ Crypto is volatile: risk only what you can afford to lose.
47
·
--
Baissier
Voir la traduction
$ADA Price Prediction Today (Oct 29): Cardano Crypto Signal & Technical Analysis 📊
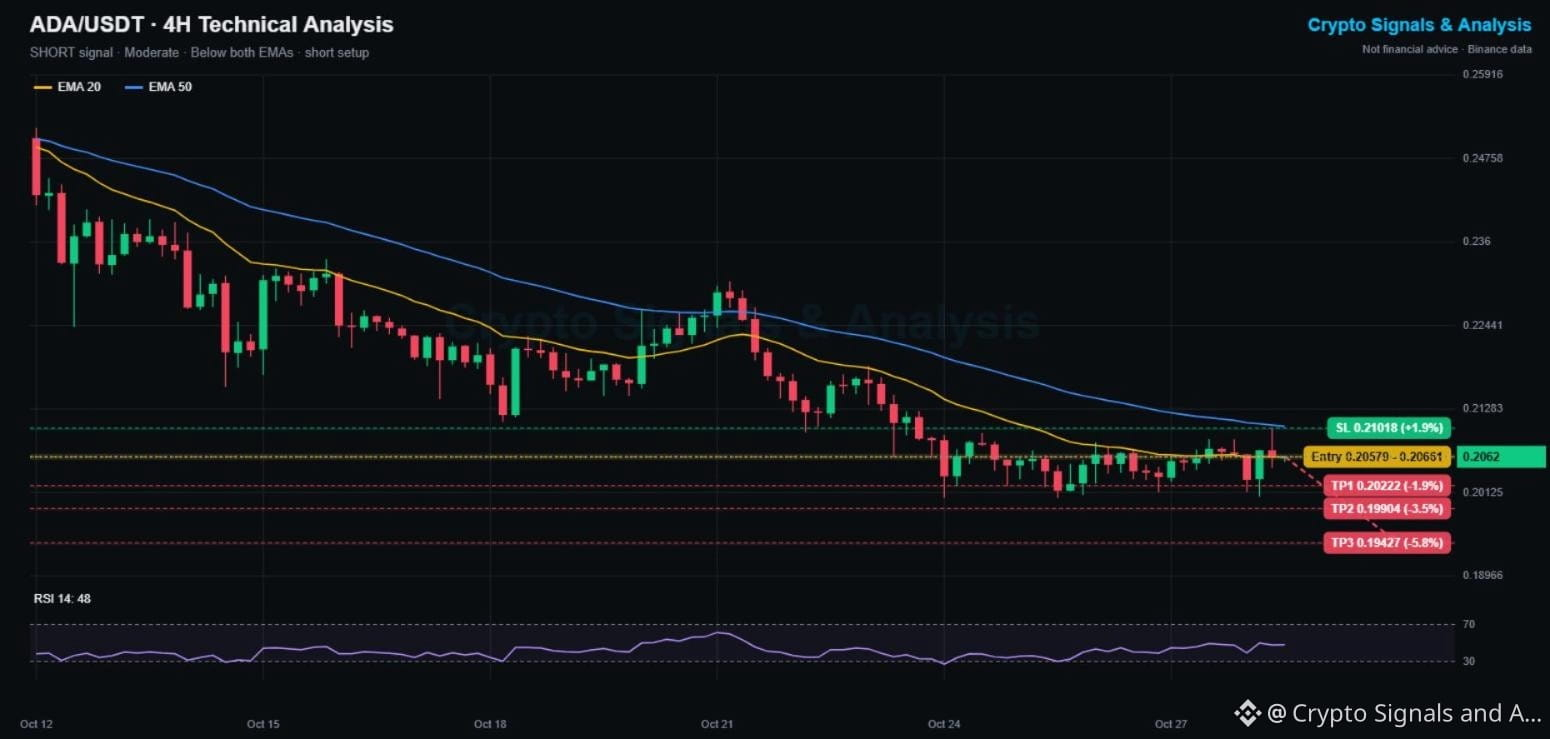
🔴 SHORT | Entry 0.2058 - 0.2066 | TP1 0.2022 | SL 0.2102
👉 Tap $ADA to place your trade fast
🕒 Updated: Oct 29, 00:18 UTC · price 0.2062
Cardano missed yesterday's altcoin bounce: it closed Oct 28 slightly red (-0.5%) and is down 6.6% on the week. Its last push to 0.2101 was rejected right under the 4H EMA50.
📌 CARDANO TRADING SIGNAL (Moderate, 3/5 signals agree)
Entry: 0.2058 - 0.2066
Take profit 1: 0.2022 (-1.9%)
Take profit 2: 0.1990 (-3.5%)
Take profit 3: 0.1943 (-5.8%)
Stop loss: 0.2102 (+1.9%)
📊 ADA TECHNICAL ANALYSIS (4H CHART)
Price sits on the EMA20 (0.2062) and below the falling EMA50 (0.2104). RSI 48 is neutral. One check is bullish: the EMA20 has flattened and ticked up, so this is a range short with a tight stop, not a strong trend trade.
🔑 KEY LEVELS
Support: 0.2005 (2-week low), then 0.1990
Resistance: 0.2101, then 0.2104 (EMA50)
📉 Bearish scenario: a 4H close under 0.2005 opens TP2 and TP3.
📈 Bullish scenario: a close above 0.2102 cancels this signal and breaks the downtrend.
💡 Bottom line: 0.2005 - 0.2101 is the box. Trade the edges, not the middle.
👉 Tap $ADA
to open the live chart. NFA
🔥 NEW TO BINANCE?
✅ No Binance account yet? Sign up with referral code SQUAREGINOS and get a 10% kickback on your Futures trading fees.
👇👇👇
{spot}(ADAUSDT)
[Sign up on Binance here (10% Futures fee kickback)](https://www.binance.com/join?ref=SQUAREGINOS)
━━━━━━━━━━
Does Cardano break 0.2005 or 0.2101 first? 👇
Follow Crypto Signals and Analysis for daily signals.
#cryptosignals #Cardano #FOMCWatch
⚠️ Crypto is volatile: risk only what you can afford to lose.
$ADA Price Prediction Today (Oct 29): Cardano Crypto Signal & Technical Analysis 📊
🔴 SHORT | Entry 0.2058 - 0.2066 | TP1 0.2022 | SL 0.2102
👉 Tap $ADA to place your trade fast
🕒 Updated: Oct 29, 00:18 UTC · price 0.2062
Cardano missed yesterday's altcoin bounce: it closed Oct 28 slightly red (-0.5%) and is down 6.6% on the week. Its last push to 0.2101 was rejected right under the 4H EMA50.
📌 CARDANO TRADING SIGNAL (Moderate, 3/5 signals agree)
Entry: 0.2058 - 0.2066
Take profit 1: 0.2022 (-1.9%)
Take profit 2: 0.1990 (-3.5%)
Take profit 3: 0.1943 (-5.8%)
Stop loss: 0.2102 (+1.9%)
📊 ADA TECHNICAL ANALYSIS (4H CHART)
Price sits on the EMA20 (0.2062) and below the falling EMA50 (0.2104). RSI 48 is neutral. One check is bullish: the EMA20 has flattened and ticked up, so this is a range short with a tight stop, not a strong trend trade.
🔑 KEY LEVELS
Support: 0.2005 (2-week low), then 0.1990
Resistance: 0.2101, then 0.2104 (EMA50)
📉 Bearish scenario: a 4H close under 0.2005 opens TP2 and TP3.
📈 Bullish scenario: a close above 0.2102 cancels this signal and breaks the downtrend.
💡 Bottom line: 0.2005 - 0.2101 is the box. Trade the edges, not the middle.
👉 Tap $ADA
to open the live chart. NFA
🔥 NEW TO BINANCE?
✅ No Binance account yet? Sign up with referral code SQUAREGINOS and get a 10% kickback on your Futures trading fees.
👇👇👇
Sign up on Binance here (10% Futures fee kickback)
━━━━━━━━━━
Does Cardano break 0.2005 or 0.2101 first? 👇
Follow Crypto Signals and Analysis for daily signals.
#cryptosignals #Cardano #FOMCWatch
⚠️ Crypto is volatile: risk only what you can afford to lose.
38
·
--
Haussier
Voir la traduction
$INIT Price Prediction Today (Oct 29): Initia Crypto Signal & Technical Analysis 📊
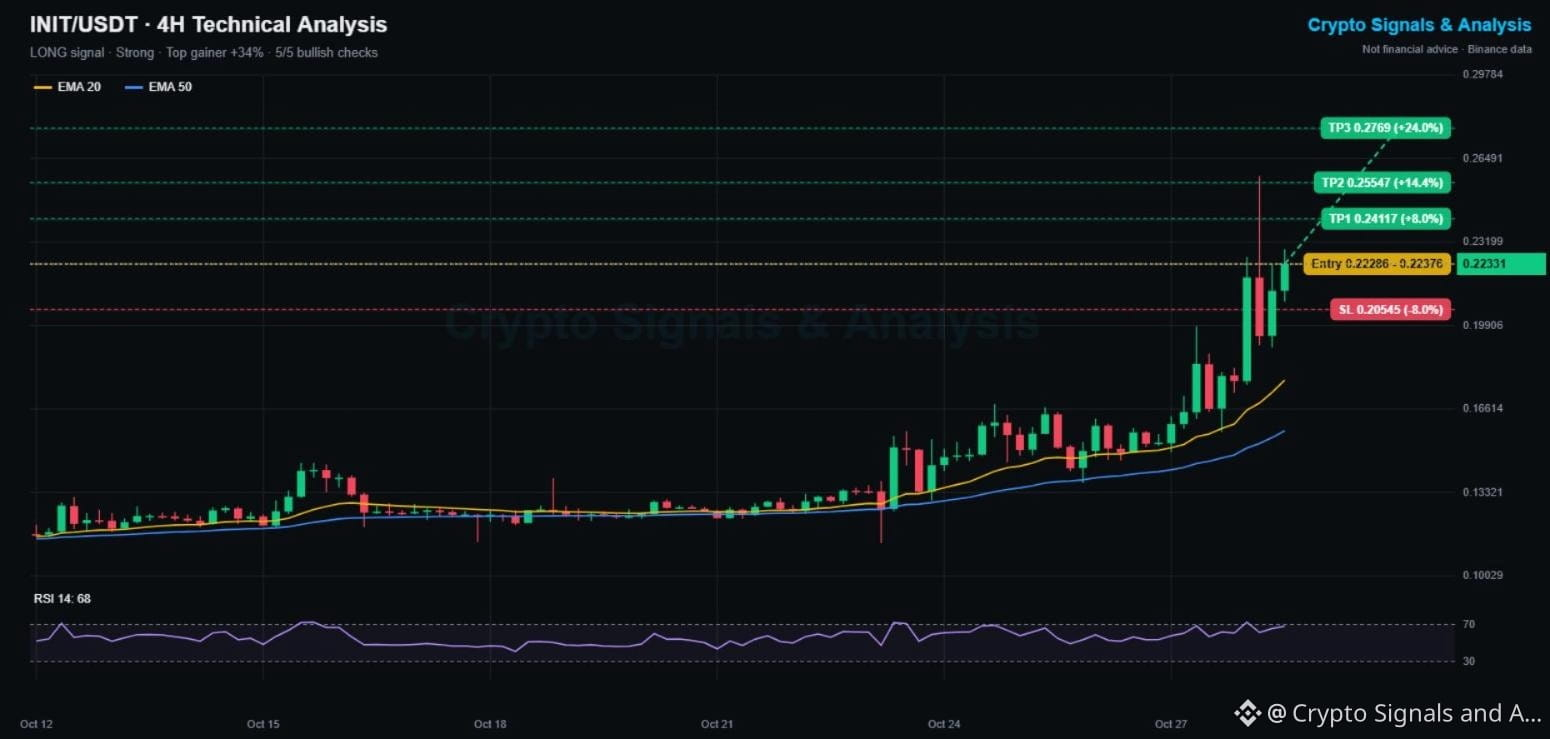
🟢 LONG | Entry 0.2229 - 0.2238 | TP1 0.2412 | SL 0.2055
👉 Tap $INIT to place your trade fast
🕒 Updated: Oct 29, 00:01 UTC · price 0.2233
Initia was Binance's top gainer of Oct 28: +34% in 24 hours and +75% in 7 days. It spiked to 0.258, pulled back to about 0.20, and buyers stepped in again. Trend traders are watching for the next leg.
📌 INITIA TRADING SIGNAL (Strong, 5/5 signals agree)
Entry: 0.2229 - 0.2238
Take profit 1: 0.2412 (+8.0%)
Take profit 2: 0.2555 (+14.4%)
Take profit 3: 0.2769 (+24.0%)
Stop loss: 0.2055 (-8.0%)
📊 INIT TECHNICAL ANALYSIS (4H CHART)
All 5 checks are bullish: price far above the EMA20 (0.1775) and EMA50 (0.1576), both rising, RSI 68 and a huge weekly gain. The risk: price is 25% above the EMA20, so pullbacks can be sharp.
🔑 KEY LEVELS
Support: 0.20 (pullback low), then 0.178 (EMA20)
Resistance: 0.241, then 0.258 (spike high)
📈 Bullish scenario: a 4H close above 0.241 opens a retest of 0.258.
📉 Bearish scenario: losing 0.20 means the pump is fading. A close under 0.2055 cancels this signal.
💡 Bottom line: strongest chart on Binance, but extended. Use small size and respect the stop.
👉 Tap $INIT
to open the live chart. NFA
🔥 NEW TO BINANCE?
✅ No Binance account yet? Sign up with referral code SQUAREGINOS and get a 10% kickback on your Futures trading fees.
👇👇👇
{spot}(INITUSDT)
[Sign up on Binance here (10% Futures fee kickback)](https://www.binance.com/join?ref=SQUAREGINOS)
━━━━━━━━━━
Can Initia break 0.258, or is the top in? 👇
Follow Crypto Signals and Analysis for daily signals.
#cryptosignals #Initia #FOMCWatch
⚠️ Crypto is volatile: risk only what you can afford to lose.
$INIT Price Prediction Today (Oct 29): Initia Crypto Signal & Technical Analysis 📊
🟢 LONG | Entry 0.2229 - 0.2238 | TP1 0.2412 | SL 0.2055
👉 Tap $INIT to place your trade fast
🕒 Updated: Oct 29, 00:01 UTC · price 0.2233
Initia was Binance's top gainer of Oct 28: +34% in 24 hours and +75% in 7 days. It spiked to 0.258, pulled back to about 0.20, and buyers stepped in again. Trend traders are watching for the next leg.
📌 INITIA TRADING SIGNAL (Strong, 5/5 signals agree)
Entry: 0.2229 - 0.2238
Take profit 1: 0.2412 (+8.0%)
Take profit 2: 0.2555 (+14.4%)
Take profit 3: 0.2769 (+24.0%)
Stop loss: 0.2055 (-8.0%)
📊 INIT TECHNICAL ANALYSIS (4H CHART)
All 5 checks are bullish: price far above the EMA20 (0.1775) and EMA50 (0.1576), both rising, RSI 68 and a huge weekly gain. The risk: price is 25% above the EMA20, so pullbacks can be sharp.
🔑 KEY LEVELS
Support: 0.20 (pullback low), then 0.178 (EMA20)
Resistance: 0.241, then 0.258 (spike high)
📈 Bullish scenario: a 4H close above 0.241 opens a retest of 0.258.
📉 Bearish scenario: losing 0.20 means the pump is fading. A close under 0.2055 cancels this signal.
💡 Bottom line: strongest chart on Binance, but extended. Use small size and respect the stop.
👉 Tap $INIT
to open the live chart. NFA
🔥 NEW TO BINANCE?
✅ No Binance account yet? Sign up with referral code SQUAREGINOS and get a 10% kickback on your Futures trading fees.
👇👇👇
Sign up on Binance here (10% Futures fee kickback)
━━━━━━━━━━
Can Initia break 0.258, or is the top in? 👇
Follow Crypto Signals and Analysis for daily signals.
#cryptosignals #Initia #FOMCWatch
⚠️ Crypto is volatile: risk only what you can afford to lose.
10
·
--
Haussier
$SHELL et Initia en tête du bilan crypto du 28 oct. : les altcoins rebondissent, le Bitcoin reste stable 📰
🕒 Mis à jour : 28 oct., 23:45 UTC
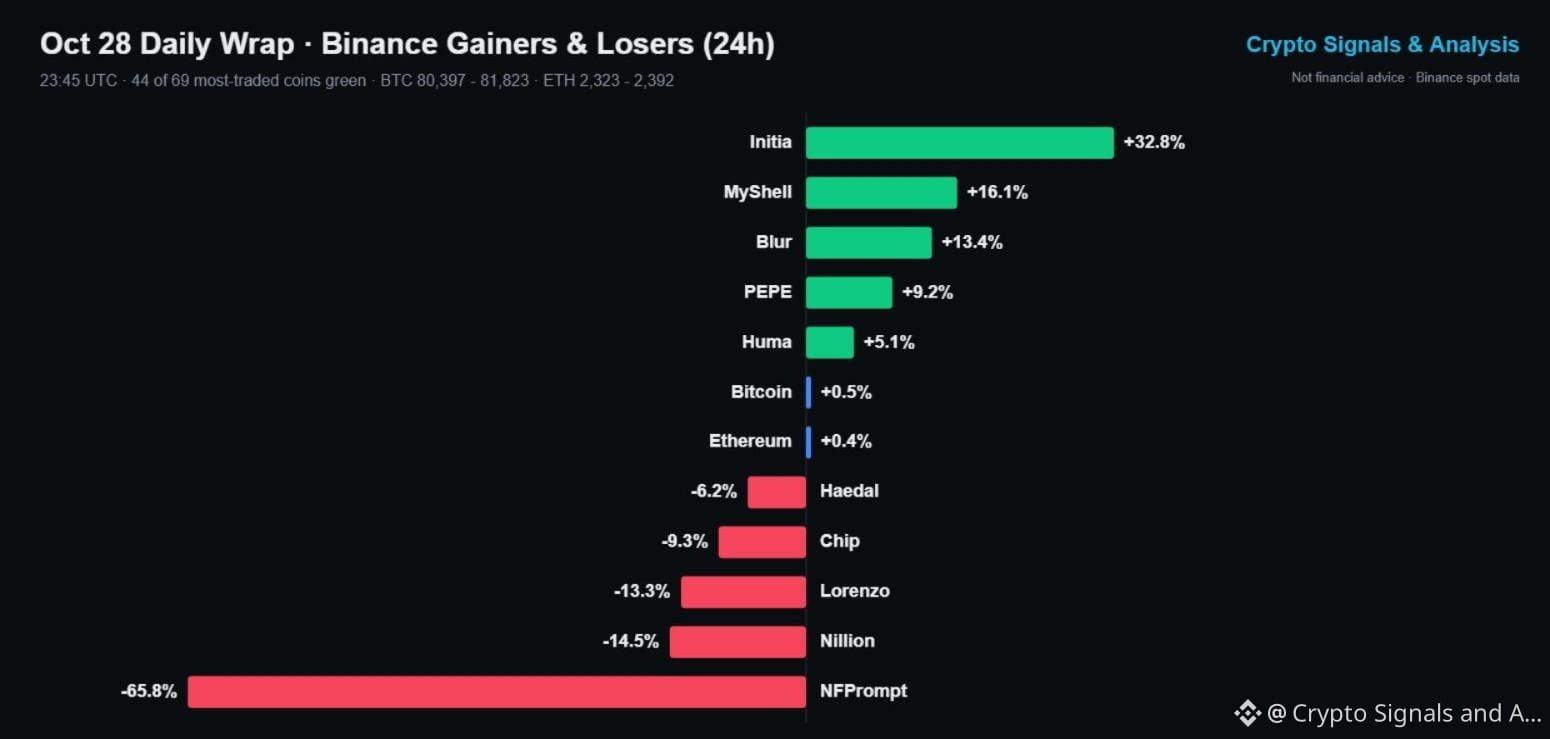
Le lendemain du statu quo de la Fed, la journée a été calme pour le Bitcoin et animée pour les altcoins. 44 des 69 cryptos les plus échangées sur le marché spot de Binance ont clôturé dans le vert.
📰 AUJOURD’HUI EN 4 POINTS
🟠 Le Bitcoin a varié de moins de 2 % sur la journée (80,397 - 81,823) et affiche une hausse de 0,5 %. L’Ethereum progresse de 0,4 %, à 2,360.
🟢 Initia (+32,8 %) est la crypto qui a le plus progressé. MyShell (+16,1 %), Blur (+13,4 %) et PEPE (+9,2 %) suivent.
🔴 Les baisses ont surtout touché les petites capitalisations : NFPrompt -65,8 %, Nillion -14,5 %, Lorenzo -13,3 %.
📊 Les volumes sont restés concentrés sur les principales cryptos : environ 1.06B USDT pour le Bitcoin et 420M pour l’Ethereum sur le marché spot.
👀 À SURVEILLER LE 29 OCT.
La fourchette étroite du Bitcoin est l’élément clé. Une cassure au-dessus de 81,823 attirerait probablement davantage de capitaux vers les altcoins ; une chute sous 80,397 freinerait rapidement le rallye des petites capitalisations. Après une journée comme celle-ci, les grandes gagnantes rendent souvent une partie de leurs gains : surveillez donc si Initia et MyShell conservent leurs gains pendant la session asiatique.
💡 En bref : une rotation, pas une nouvelle tendance. Prenez vos bénéfices quand le marché monte et placez des stops serrés sur les petites capitalisations.
👉 Appuyez sur $SHELL
pour ouvrir le graphique en direct. Ceci ne constitue pas un conseil financier.
🔥 TRADEZ AVEC DES FRAIS RÉDUITS
✅ Obtenez un cashback de 10 % sur vos frais de trading Binance Futures
👇👇👇
{spot}(SHELLUSDT)
[Claim your 10% Futures fee kickback here](https://www.binance.com/join?ref=SQUAREGINOS)
━━━━━━━━━━
Le Bitcoin va-t-il d’abord casser à la hausse ou à la baisse le 29 oct. ? 👇
Suivez Crypto Signals and Analysis pour recevoir les bilans quotidiens du marché.
#cryptosignals #altcoins #FOMCWatch
⚠️ Les cryptos sont volatiles : ne risquez que ce que vous pouvez vous permettre de perdre.
$SHELL et Initia en tête du bilan crypto du 28 oct. : les altcoins rebondissent, le Bitcoin reste stable 📰
🕒 Mis à jour : 28 oct., 23:45 UTC
Le lendemain du statu quo de la Fed, la journée a été calme pour le Bitcoin et animée pour les altcoins. 44 des 69 cryptos les plus échangées sur le marché spot de Binance ont clôturé dans le vert.
📰 AUJOURD’HUI EN 4 POINTS
🟠 Le Bitcoin a varié de moins de 2 % sur la journée (80,397 - 81,823) et affiche une hausse de 0,5 %. L’Ethereum progresse de 0,4 %, à 2,360.
🟢 Initia (+32,8 %) est la crypto qui a le plus progressé. MyShell (+16,1 %), Blur (+13,4 %) et PEPE (+9,2 %) suivent.
🔴 Les baisses ont surtout touché les petites capitalisations : NFPrompt -65,8 %, Nillion -14,5 %, Lorenzo -13,3 %.
📊 Les volumes sont restés concentrés sur les principales cryptos : environ 1.06B USDT pour le Bitcoin et 420M pour l’Ethereum sur le marché spot.
👀 À SURVEILLER LE 29 OCT.
La fourchette étroite du Bitcoin est l’élément clé. Une cassure au-dessus de 81,823 attirerait probablement davantage de capitaux vers les altcoins ; une chute sous 80,397 freinerait rapidement le rallye des petites capitalisations. Après une journée comme celle-ci, les grandes gagnantes rendent souvent une partie de leurs gains : surveillez donc si Initia et MyShell conservent leurs gains pendant la session asiatique.
💡 En bref : une rotation, pas une nouvelle tendance. Prenez vos bénéfices quand le marché monte et placez des stops serrés sur les petites capitalisations.
👉 Appuyez sur $SHELL
pour ouvrir le graphique en direct. Ceci ne constitue pas un conseil financier.
🔥 TRADEZ AVEC DES FRAIS RÉDUITS
✅ Obtenez un cashback de 10 % sur vos frais de trading Binance Futures
👇👇👇
Claim your 10% Futures fee kickback here
━━━━━━━━━━
Le Bitcoin va-t-il d’abord casser à la hausse ou à la baisse le 29 oct. ? 👇
Suivez Crypto Signals and Analysis pour recevoir les bilans quotidiens du marché.
#cryptosignals #altcoins #FOMCWatch
⚠️ Les cryptos sont volatiles : ne risquez que ce que vous pouvez vous permettre de perdre.
91
·
--
Haussier
Voir la traduction
$ETHFI Price Prediction Today (Oct 28, Night Update): ether.fi Crypto Signal & Technical Analysis 📊
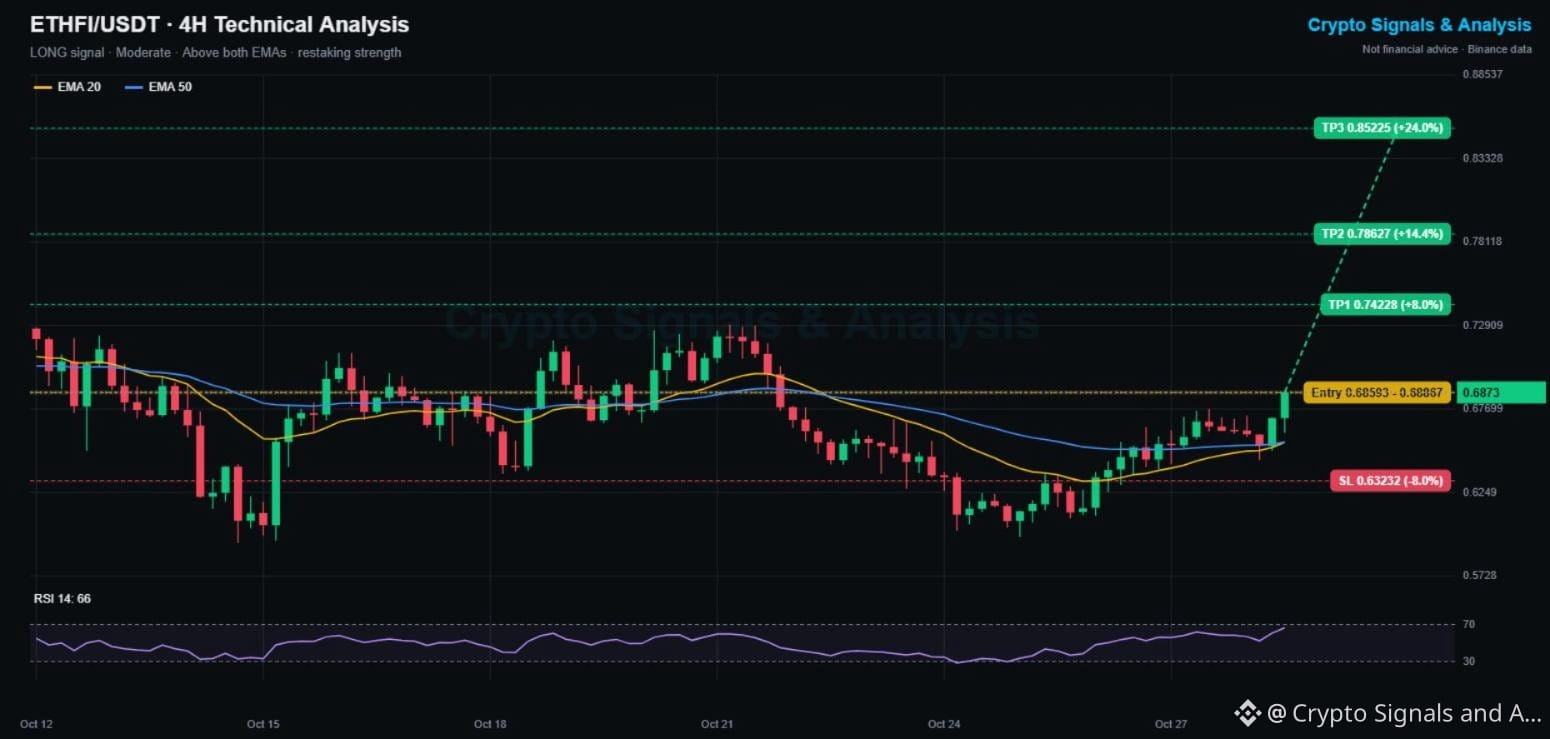
🟢 LONG | Entry 0.6859 - 0.6887 | TP1 0.7423 | SL 0.6323
👉 Tap $ETHFI to place your trade fast
🕒 Updated: Oct 28, 23:26 UTC · price 0.6873
ether.fi is up 3.2% today and just broke to a 3-day high at 0.6874. The restaking token has climbed steadily from the 0.594 low on Oct 24 and is now one of the stronger DeFi charts on Binance.
📌 ETHER.FI TRADING SIGNAL (Moderate, 4/5 signals agree)
Entry: 0.6859 - 0.6887
Take profit 1: 0.7423 (+8.0%)
Take profit 2: 0.7863 (+14.4%)
Take profit 3: 0.8523 (+24.0%)
Stop loss: 0.6323 (-8.0%)
📊 ETHFI TECHNICAL ANALYSIS (4H CHART)
Price is above the EMA20 (0.6563) and EMA50 (0.6563), which just crossed, with the EMA20 turning up. RSI 66 shows strong momentum but leaves little room before overbought, so a retest of 0.675 - 0.68 is possible.
🔑 KEY LEVELS
Support: 0.675, then 0.656 (EMAs)
Resistance: 0.70, then 0.73 (Oct 21 high)
📈 Bullish scenario: holding above 0.6874 targets 0.73 and TP1.
📉 Bearish scenario: falling back under the EMAs means a fake breakout. A close under 0.6323 cancels this signal.
💡 Bottom line: trend just flipped up. A dip toward 0.68 is a cleaner entry than chasing.
👉 Tap $ETHFI
to open the live chart. NFA
🔥 TRADE WITH LOWER FEES
✅ Get a 10% kickback on your Binance Futures trading fees
👇👇👇
{spot}(ETHFIUSDT)
[Claim your 10% Futures fee kickback here](https://www.binance.com/join?ref=SQUAREGINOS)
━━━━━━━━━━
Are restaking tokens about to lead the next DeFi move? 👇
Follow Crypto Signals and Analysis for daily signals.
#cryptosignals #DeFi #FOMCWatch
⚠️ Crypto is volatile: risk only what you can afford to lose.
$ETHFI Price Prediction Today (Oct 28, Night Update): ether.fi Crypto Signal & Technical Analysis 📊
🟢 LONG | Entry 0.6859 - 0.6887 | TP1 0.7423 | SL 0.6323
👉 Tap $ETHFI to place your trade fast
🕒 Updated: Oct 28, 23:26 UTC · price 0.6873
ether.fi is up 3.2% today and just broke to a 3-day high at 0.6874. The restaking token has climbed steadily from the 0.594 low on Oct 24 and is now one of the stronger DeFi charts on Binance.
📌 ETHER.FI TRADING SIGNAL (Moderate, 4/5 signals agree)
Entry: 0.6859 - 0.6887
Take profit 1: 0.7423 (+8.0%)
Take profit 2: 0.7863 (+14.4%)
Take profit 3: 0.8523 (+24.0%)
Stop loss: 0.6323 (-8.0%)
📊 ETHFI TECHNICAL ANALYSIS (4H CHART)
Price is above the EMA20 (0.6563) and EMA50 (0.6563), which just crossed, with the EMA20 turning up. RSI 66 shows strong momentum but leaves little room before overbought, so a retest of 0.675 - 0.68 is possible.
🔑 KEY LEVELS
Support: 0.675, then 0.656 (EMAs)
Resistance: 0.70, then 0.73 (Oct 21 high)
📈 Bullish scenario: holding above 0.6874 targets 0.73 and TP1.
📉 Bearish scenario: falling back under the EMAs means a fake breakout. A close under 0.6323 cancels this signal.
💡 Bottom line: trend just flipped up. A dip toward 0.68 is a cleaner entry than chasing.
👉 Tap $ETHFI
to open the live chart. NFA
🔥 TRADE WITH LOWER FEES
✅ Get a 10% kickback on your Binance Futures trading fees
👇👇👇
Claim your 10% Futures fee kickback here
━━━━━━━━━━
Are restaking tokens about to lead the next DeFi move? 👇
Follow Crypto Signals and Analysis for daily signals.
#cryptosignals #DeFi #FOMCWatch
⚠️ Crypto is volatile: risk only what you can afford to lose.
35
·
--
Baissier
Voir la traduction
$THETA Price Prediction Today (Oct 28, Night Update): Theta Network Crypto Signal & Technical Analysis 📊
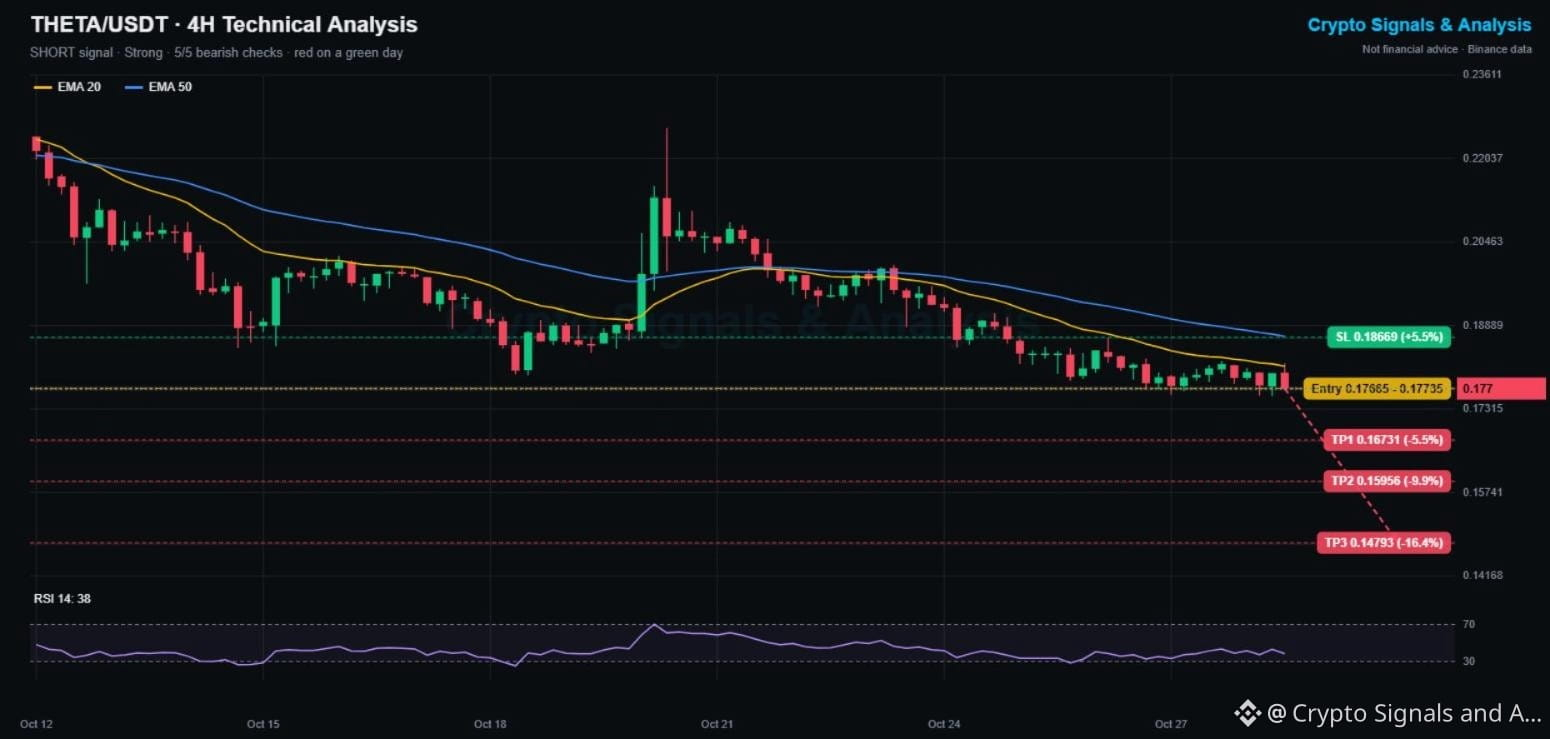
🔴 SHORT | Entry 0.1767 - 0.1774 | TP1 0.1673 | SL 0.1867
👉 Tap $THETA to place your trade fast
🕒 Updated: Oct 28, 23:10 UTC · price 0.177
Theta Network is one of the few large coins in the red tonight (-2.1%) while most of the market bounces. It is down 12.5% this week and just printed its lowest level in 17 days at 0.1756.
📌 THETA NETWORK TRADING SIGNAL (Strong, 5/5 signals agree)
Entry: 0.1767 - 0.1774
Take profit 1: 0.1673 (-5.5%)
Take profit 2: 0.1596 (-9.9%)
Take profit 3: 0.1479 (-16.4%)
Stop loss: 0.1867 (+5.5%)
📊 THETA TECHNICAL ANALYSIS (4H CHART)
Price is below the EMA20 (0.1812) and EMA50 (0.1869), both sloping down. RSI 38 shows strong selling, but it is getting close to oversold, so a short bounce is possible before the next leg.
🔑 KEY LEVELS
Support: 0.1756 (17-day low), then 0.167
Resistance: 0.1812 (EMA20), then 0.1865
📉 Bearish scenario: a 4H close under 0.1756 opens TP1 at 0.1673.
📈 Bullish scenario: reclaiming 0.1812 slows the drop. A close above 0.1867 cancels this signal.
💡 Bottom line: weakest chart on a green day. Better entries come on bounces into the EMA20.
👉 Tap $THETA
to open the live chart. NFA
🔥 TRADE WITH LOWER FEES
✅ Get a 10% kickback on your Binance Futures trading fees
👇👇👇
{spot}(THETAUSDT)
[Claim your 10% Futures fee kickback here](https://www.binance.com/join?ref=SQUAREGINOS)
━━━━━━━━━━
Capitulation soon or more pain for Theta Network? 👇
Follow Crypto Signals and Analysis for daily signals.
#cryptosignals #THETA #FOMCWatch
⚠️ Crypto is volatile: risk only what you can afford to lose.
$THETA Price Prediction Today (Oct 28, Night Update): Theta Network Crypto Signal & Technical Analysis 📊
🔴 SHORT | Entry 0.1767 - 0.1774 | TP1 0.1673 | SL 0.1867
👉 Tap $THETA to place your trade fast
🕒 Updated: Oct 28, 23:10 UTC · price 0.177
Theta Network is one of the few large coins in the red tonight (-2.1%) while most of the market bounces. It is down 12.5% this week and just printed its lowest level in 17 days at 0.1756.
📌 THETA NETWORK TRADING SIGNAL (Strong, 5/5 signals agree)
Entry: 0.1767 - 0.1774
Take profit 1: 0.1673 (-5.5%)
Take profit 2: 0.1596 (-9.9%)
Take profit 3: 0.1479 (-16.4%)
Stop loss: 0.1867 (+5.5%)
📊 THETA TECHNICAL ANALYSIS (4H CHART)
Price is below the EMA20 (0.1812) and EMA50 (0.1869), both sloping down. RSI 38 shows strong selling, but it is getting close to oversold, so a short bounce is possible before the next leg.
🔑 KEY LEVELS
Support: 0.1756 (17-day low), then 0.167
Resistance: 0.1812 (EMA20), then 0.1865
📉 Bearish scenario: a 4H close under 0.1756 opens TP1 at 0.1673.
📈 Bullish scenario: reclaiming 0.1812 slows the drop. A close above 0.1867 cancels this signal.
💡 Bottom line: weakest chart on a green day. Better entries come on bounces into the EMA20.
👉 Tap $THETA
to open the live chart. NFA
🔥 TRADE WITH LOWER FEES
✅ Get a 10% kickback on your Binance Futures trading fees
👇👇👇
Claim your 10% Futures fee kickback here
━━━━━━━━━━
Capitulation soon or more pain for Theta Network? 👇
Follow Crypto Signals and Analysis for daily signals.
#cryptosignals #THETA #FOMCWatch
⚠️ Crypto is volatile: risk only what you can afford to lose.
10
·
--
Haussier
Prédiction du prix de $FLOKI aujourd’hui (28 oct., mise à jour du soir) : signal crypto Floki et analyse technique 📊
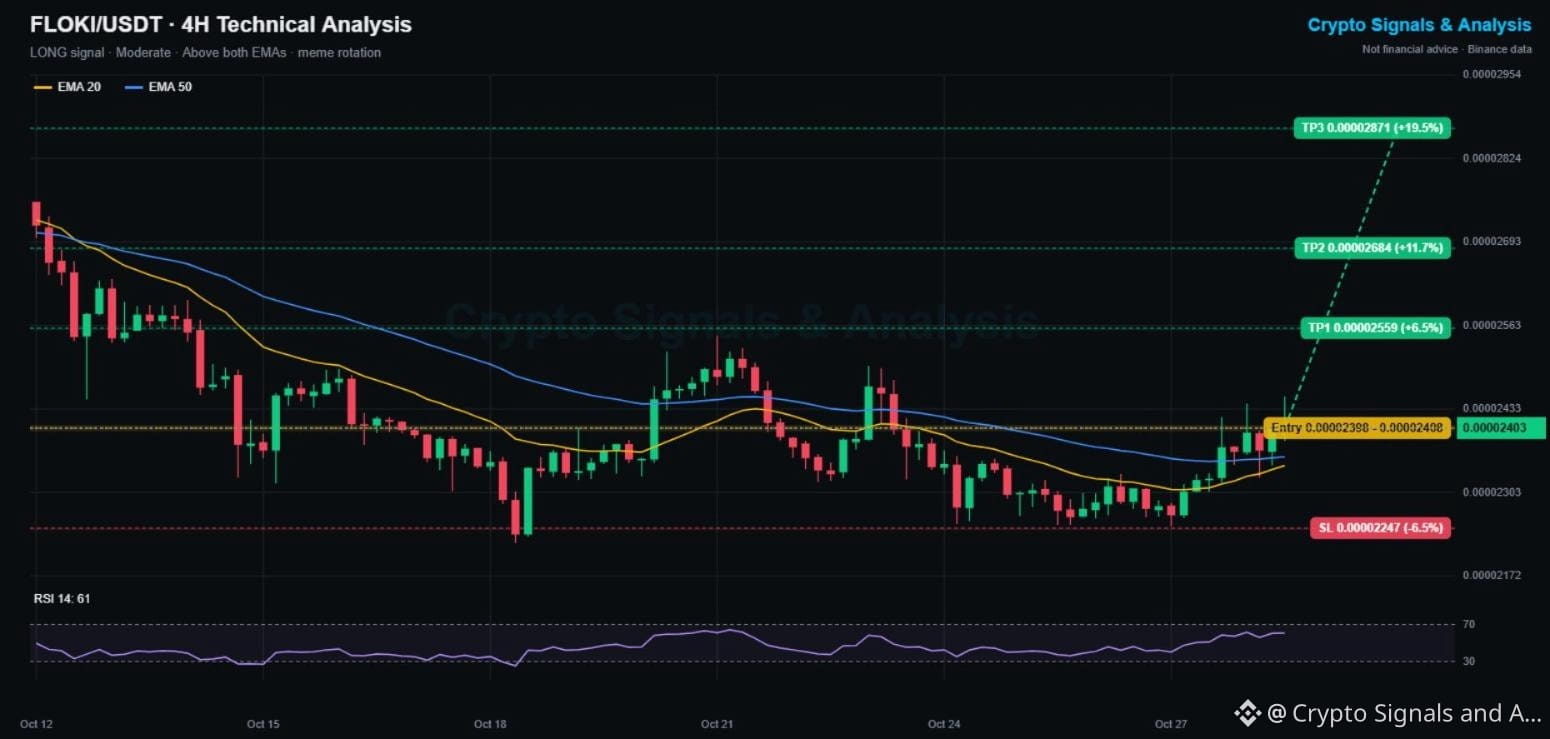
🟢 ACHAT | Entrée 0.00002398 - 0.00002408 | TP1 0.00002559 | SL 0.00002247
👉 Appuyez sur $FLOKI pour passer votre ordre rapidement
🕒 Mis à jour : 28 oct., 22:52 UTC · prix 0.00002403
Les meme coins mènent le rebond de ce soir (PEPE +11 %), et Floki suit le mouvement : +3.4 % aujourd’hui et presque stable sur la semaine (-2.4 %), une performance bien meilleure que celle de la plupart des altcoins. Il vient de passer au-dessus de ses deux moyennes mobiles en 4H pour la première fois depuis le 22 oct.
📌 SIGNAL DE TRADING FLOKI (modéré, 4 signaux sur 5 sont d’accord)
Entrée : 0.00002398 - 0.00002408
Prise de profit 1 : 0.00002559 (+6.5 %)
Prise de profit 2 : 0.00002684 (+11.7 %)
Prise de profit 3 : 0.00002871 (+19.5 %)
Stop-loss : 0.00002247 (-6.5 %)
📊 ANALYSE TECHNIQUE DE FLOKI (GRAPHIQUE 4H)
Le prix est au-dessus de l’EMA20 (0.00002344) et de l’EMA50 (0.00002358), et l’EMA20 commence à remonter. Le RSI à 61 indique que les acheteurs ont la main, sans que le marché soit en situation de surachat.
🔑 NIVEAUX CLÉS
Support : 0.0000235 (EMA), puis 0.0000225
Résistance : 0.0000245, puis 0.0000256
📈 Scénario haussier : une clôture en 4H au-dessus de 0.0000245 ouvre la voie au TP1.
📉 Scénario baissier : une perte des EMA renverrait le cours dans sa fourchette. Une clôture sous 0.00002247 invaliderait ce signal.
💡 En bref : force relative et rotation vers les meme coins. Attendez le franchissement de 0.0000245 pour confirmation.
👉 Appuyez sur $FLOKI
pour ouvrir le graphique en temps réel. NFA
🔥 TRADEZ AVEC DES FRAIS RÉDUITS
✅ Bénéficiez d’un remboursement de 10 % sur vos frais de trading Binance Futures
👇👇👇
{spot}(FLOKIUSDT)
[Claim your 10% Futures fee kickback here](https://www.binance.com/join?ref=SQUAREGINOS)
━━━━━━━━━━
Quel meme coin va décoller ensuite : PEPE, BONK ou Floki ? 👇
Suivez Crypto Signals and Analysis pour recevoir des signaux quotidiens.
#cryptosignals #memecoin #FOMCWatch
⚠️ Les cryptomonnaies sont volatiles : ne risquez que ce que vous pouvez vous permettre de perdre.
Prédiction du prix de $FLOKI aujourd’hui (28 oct., mise à jour du soir) : signal crypto Floki et analyse technique 📊
🟢 ACHAT | Entrée 0.00002398 - 0.00002408 | TP1 0.00002559 | SL 0.00002247
👉 Appuyez sur $FLOKI pour passer votre ordre rapidement
🕒 Mis à jour : 28 oct., 22:52 UTC · prix 0.00002403
Les meme coins mènent le rebond de ce soir (PEPE +11 %), et Floki suit le mouvement : +3.4 % aujourd’hui et presque stable sur la semaine (-2.4 %), une performance bien meilleure que celle de la plupart des altcoins. Il vient de passer au-dessus de ses deux moyennes mobiles en 4H pour la première fois depuis le 22 oct.
📌 SIGNAL DE TRADING FLOKI (modéré, 4 signaux sur 5 sont d’accord)
Entrée : 0.00002398 - 0.00002408
Prise de profit 1 : 0.00002559 (+6.5 %)
Prise de profit 2 : 0.00002684 (+11.7 %)
Prise de profit 3 : 0.00002871 (+19.5 %)
Stop-loss : 0.00002247 (-6.5 %)
📊 ANALYSE TECHNIQUE DE FLOKI (GRAPHIQUE 4H)
Le prix est au-dessus de l’EMA20 (0.00002344) et de l’EMA50 (0.00002358), et l’EMA20 commence à remonter. Le RSI à 61 indique que les acheteurs ont la main, sans que le marché soit en situation de surachat.
🔑 NIVEAUX CLÉS
Support : 0.0000235 (EMA), puis 0.0000225
Résistance : 0.0000245, puis 0.0000256
📈 Scénario haussier : une clôture en 4H au-dessus de 0.0000245 ouvre la voie au TP1.
📉 Scénario baissier : une perte des EMA renverrait le cours dans sa fourchette. Une clôture sous 0.00002247 invaliderait ce signal.
💡 En bref : force relative et rotation vers les meme coins. Attendez le franchissement de 0.0000245 pour confirmation.
👉 Appuyez sur $FLOKI
pour ouvrir le graphique en temps réel. NFA
🔥 TRADEZ AVEC DES FRAIS RÉDUITS
✅ Bénéficiez d’un remboursement de 10 % sur vos frais de trading Binance Futures
👇👇👇
Claim your 10% Futures fee kickback here
━━━━━━━━━━
Quel meme coin va décoller ensuite : PEPE, BONK ou Floki ? 👇
Suivez Crypto Signals and Analysis pour recevoir des signaux quotidiens.
#cryptosignals #memecoin #FOMCWatch
⚠️ Les cryptomonnaies sont volatiles : ne risquez que ce que vous pouvez vous permettre de perdre.
36
·
--
Haussier
$BLUR et Initia en tête des hausses sur Binance ce soir, tandis que Bitcoin se maintient à 81K 📰
🕒 Mis à jour : 28 oct., 22:35 UTC
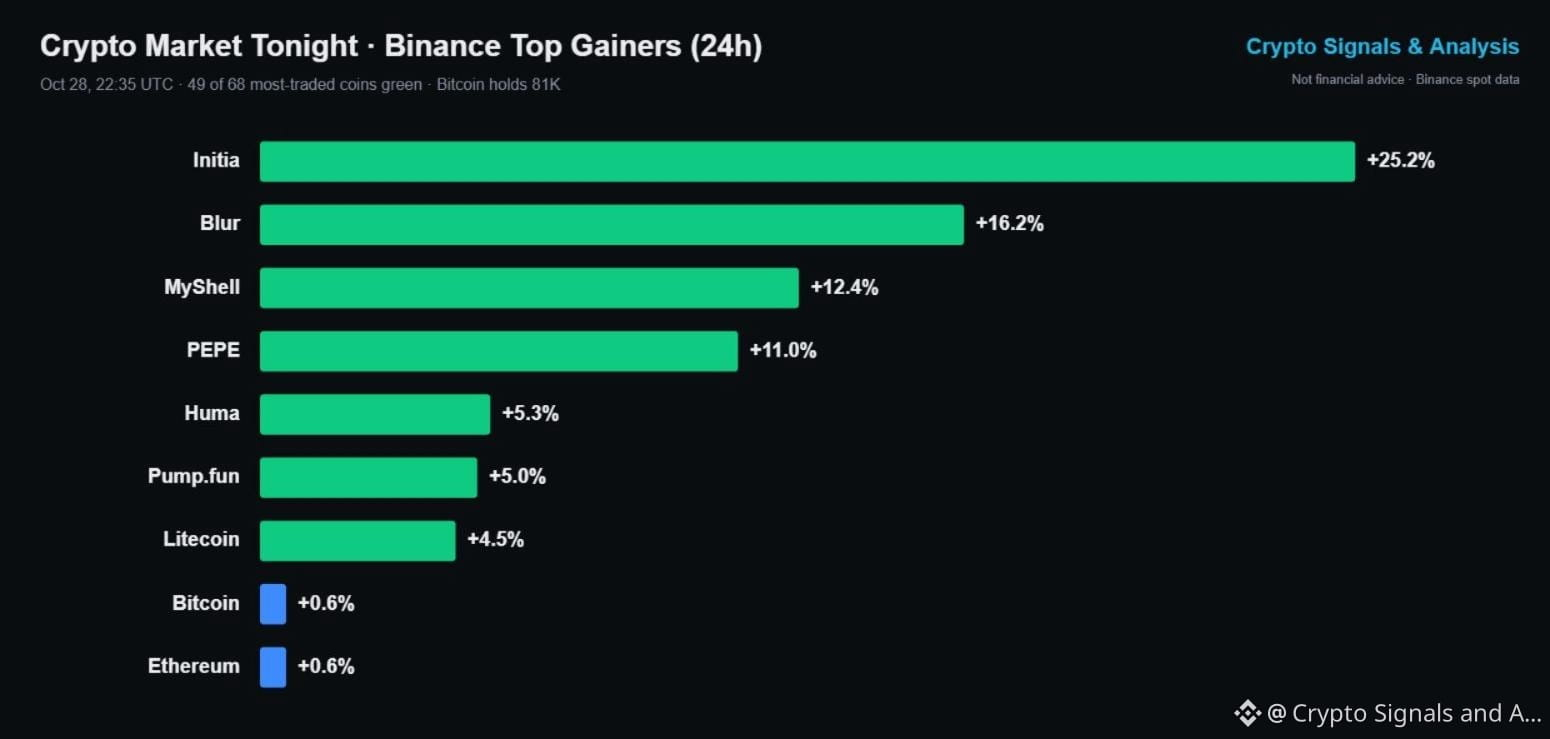
Le rebond des altcoins s’est poursuivi dans la nuit après le statu quo de la Fed. 49 des 68 cryptos les plus échangées sur Binance Spot sont dans le vert sur 24 heures, tandis que Bitcoin et Ethereum ont à peine bougé (+0,6 % chacun).
📰 CE QUI S’EST PASSÉ AUJOURD’HUI
🟢 Initia est la plus forte hausse, à +25,2 %, à 0,2156.
🟢 Blur gagne 16,2 % à 0,00853 après avoir chuté de 60 % depuis la mi-octobre.
🟢 MyShell (+12,4 %) et PEPE (+11,0 %) complètent le top 4.
🟠 Bitcoin reste coincé dans une fourchette étroite de 80,397 à 81,823 : les capitaux se reportent donc sur les petites capitalisations.
✅ NOTRE POSITION SUR BLUR
Ce matin, nous avons publié une position acheteuse sur Blur à 0,00836, avec un TP1 à 0,00903. Le cours a atteint 0,00905 ce soir : le TP1 a donc été touché, et le stop à 0,00769 n’a jamais été atteint.
👀 À SURVEILLER
Le RSI 4H de Blur est à 66, proche de la zone de surachat, et le cours a été rejeté trois fois aujourd’hui à 0,0091. Une nette cassure au-dessus de ce niveau pourrait lancer la prochaine hausse ; une chute sous 0,0082 indiquerait que le rallye s’essouffle.
💡 En résumé : les petites capitalisations sont en feu pendant que Bitcoin fait une pause. Ces rallyes s’essoufflent vite, alors prenez vos bénéfices à mesure que le cours monte.
👉 Touchez $BLUR
pour ouvrir le graphique en direct. NFA
🔥 TRADEZ AVEC DES FRAIS RÉDUITS
✅ Bénéficiez d’un cashback de 10 % sur vos frais de trading Binance Futures
👇👇👇
{spot}(BLURUSDT)
[Claim your 10% Futures fee kickback here](https://www.binance.com/join?ref=SQUAREGINOS)
━━━━━━━━━━
Quelle petite capitalisation surveillez-vous ce soir ? 👇
Suivez Crypto Signals and Analysis pour recevoir chaque jour les dernières actualités des marchés.
#cryptosignals #BLUR #FOMCWatch
⚠️ Les cryptos sont volatiles : ne risquez que ce que vous pouvez vous permettre de perdre.
$BLUR et Initia en tête des hausses sur Binance ce soir, tandis que Bitcoin se maintient à 81K 📰
🕒 Mis à jour : 28 oct., 22:35 UTC
Le rebond des altcoins s’est poursuivi dans la nuit après le statu quo de la Fed. 49 des 68 cryptos les plus échangées sur Binance Spot sont dans le vert sur 24 heures, tandis que Bitcoin et Ethereum ont à peine bougé (+0,6 % chacun).
📰 CE QUI S’EST PASSÉ AUJOURD’HUI
🟢 Initia est la plus forte hausse, à +25,2 %, à 0,2156.
🟢 Blur gagne 16,2 % à 0,00853 après avoir chuté de 60 % depuis la mi-octobre.
🟢 MyShell (+12,4 %) et PEPE (+11,0 %) complètent le top 4.
🟠 Bitcoin reste coincé dans une fourchette étroite de 80,397 à 81,823 : les capitaux se reportent donc sur les petites capitalisations.
✅ NOTRE POSITION SUR BLUR
Ce matin, nous avons publié une position acheteuse sur Blur à 0,00836, avec un TP1 à 0,00903. Le cours a atteint 0,00905 ce soir : le TP1 a donc été touché, et le stop à 0,00769 n’a jamais été atteint.
👀 À SURVEILLER
Le RSI 4H de Blur est à 66, proche de la zone de surachat, et le cours a été rejeté trois fois aujourd’hui à 0,0091. Une nette cassure au-dessus de ce niveau pourrait lancer la prochaine hausse ; une chute sous 0,0082 indiquerait que le rallye s’essouffle.
💡 En résumé : les petites capitalisations sont en feu pendant que Bitcoin fait une pause. Ces rallyes s’essoufflent vite, alors prenez vos bénéfices à mesure que le cours monte.
👉 Touchez $BLUR
pour ouvrir le graphique en direct. NFA
🔥 TRADEZ AVEC DES FRAIS RÉDUITS
✅ Bénéficiez d’un cashback de 10 % sur vos frais de trading Binance Futures
👇👇👇
Claim your 10% Futures fee kickback here
━━━━━━━━━━
Quelle petite capitalisation surveillez-vous ce soir ? 👇
Suivez Crypto Signals and Analysis pour recevoir chaque jour les dernières actualités des marchés.
#cryptosignals #BLUR #FOMCWatch
⚠️ Les cryptos sont volatiles : ne risquez que ce que vous pouvez vous permettre de perdre.
291
·
--
Baissier
Voir la traduction
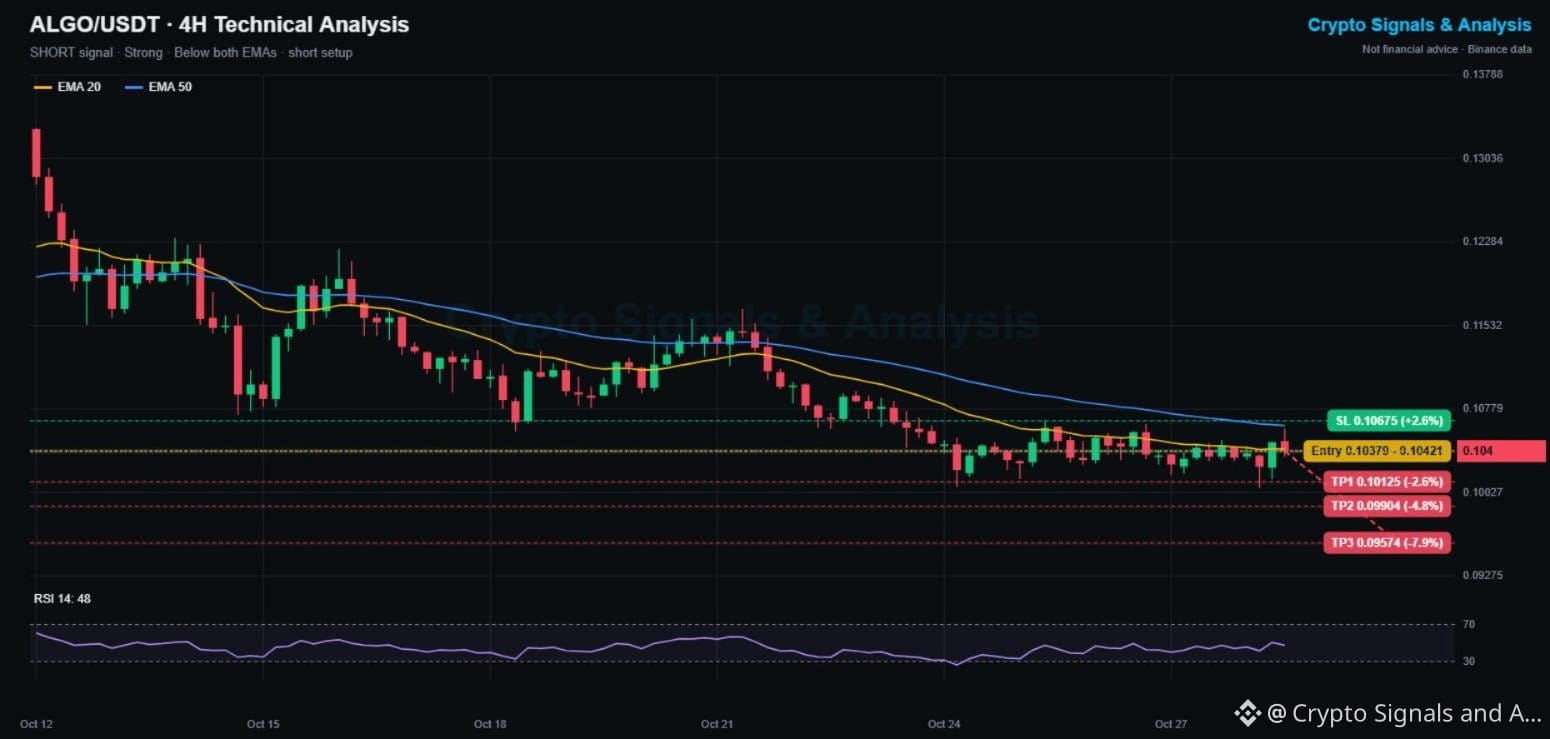
$ALGO Price Prediction Today (Oct 28, Night Update): Algorand Crypto Signal & Technical Analysis 📊
🔴 SHORT | Entry 0.1038 - 0.1042 | TP1 0.1013 | SL 0.1068
👉 Tap $ALGO to place your trade fast
🕒 Updated: Oct 28, 22:18 UTC · price 0.104
Algorand is down 8.2% this week and has made lower highs since the Oct 21 peak near 0.115. Tonight's bounce tagged the falling 4H EMA20 and was sold right away.
📌 ALGORAND TRADING SIGNAL (Strong, 4/5 signals agree)
Entry: 0.1038 - 0.1042
Take profit 1: 0.1013 (-2.6%)
Take profit 2: 0.0990 (-4.8%)
Take profit 3: 0.0957 (-7.9%)
Stop loss: 0.1068 (+2.6%)
📊 ALGO TECHNICAL ANALYSIS (4H CHART)
Price is below the EMA20 (0.1042) and EMA50 (0.1063), and the EMA20 is sloping down. RSI 48 is neutral, so the trend does the work here, not momentum.
🔑 KEY LEVELS
Support: 0.1007 (Oct 24 low), then 0.0990
Resistance: 0.1042 (EMA20), then 0.1067
📉 Bearish scenario: a 4H close under 0.1007 opens TP2 and TP3.
📈 Bullish scenario: a close above 0.1068 cancels this signal and flips the EMA50.
💡 Bottom line: tight range, clear invalidation. Short the rejection, not the breakdown.
👉 Tap $ALGO
to open the live chart. NFA
🔥 TRADE WITH LOWER FEES
✅ Get a 10% kickback on your Binance Futures trading fees
👇👇👇
{spot}(ALGOUSDT)
[Claim your 10% Futures fee kickback here](https://www.binance.com/join?ref=SQUAREGINOS)
━━━━━━━━━━
Does Algorand lose 0.10 this week? Yes or no 👇
Follow Crypto Signals and Analysis for daily signals.
#cryptosignals #Algorand #FOMCWatch
⚠️ Crypto is volatile: risk only what you can afford to lose.
$ALGO Price Prediction Today (Oct 28, Night Update): Algorand Crypto Signal & Technical Analysis 📊
🔴 SHORT | Entry 0.1038 - 0.1042 | TP1 0.1013 | SL 0.1068
👉 Tap $ALGO to place your trade fast
🕒 Updated: Oct 28, 22:18 UTC · price 0.104
Algorand is down 8.2% this week and has made lower highs since the Oct 21 peak near 0.115. Tonight's bounce tagged the falling 4H EMA20 and was sold right away.
📌 ALGORAND TRADING SIGNAL (Strong, 4/5 signals agree)
Entry: 0.1038 - 0.1042
Take profit 1: 0.1013 (-2.6%)
Take profit 2: 0.0990 (-4.8%)
Take profit 3: 0.0957 (-7.9%)
Stop loss: 0.1068 (+2.6%)
📊 ALGO TECHNICAL ANALYSIS (4H CHART)
Price is below the EMA20 (0.1042) and EMA50 (0.1063), and the EMA20 is sloping down. RSI 48 is neutral, so the trend does the work here, not momentum.
🔑 KEY LEVELS
Support: 0.1007 (Oct 24 low), then 0.0990
Resistance: 0.1042 (EMA20), then 0.1067
📉 Bearish scenario: a 4H close under 0.1007 opens TP2 and TP3.
📈 Bullish scenario: a close above 0.1068 cancels this signal and flips the EMA50.
💡 Bottom line: tight range, clear invalidation. Short the rejection, not the breakdown.
👉 Tap $ALGO
to open the live chart. NFA
🔥 TRADE WITH LOWER FEES
✅ Get a 10% kickback on your Binance Futures trading fees
👇👇👇
Claim your 10% Futures fee kickback here
━━━━━━━━━━
Does Algorand lose 0.10 this week? Yes or no 👇
Follow Crypto Signals and Analysis for daily signals.
#cryptosignals #Algorand #FOMCWatch
⚠️ Crypto is volatile: risk only what you can afford to lose.
33
·
--
Haussier
Voir la traduction
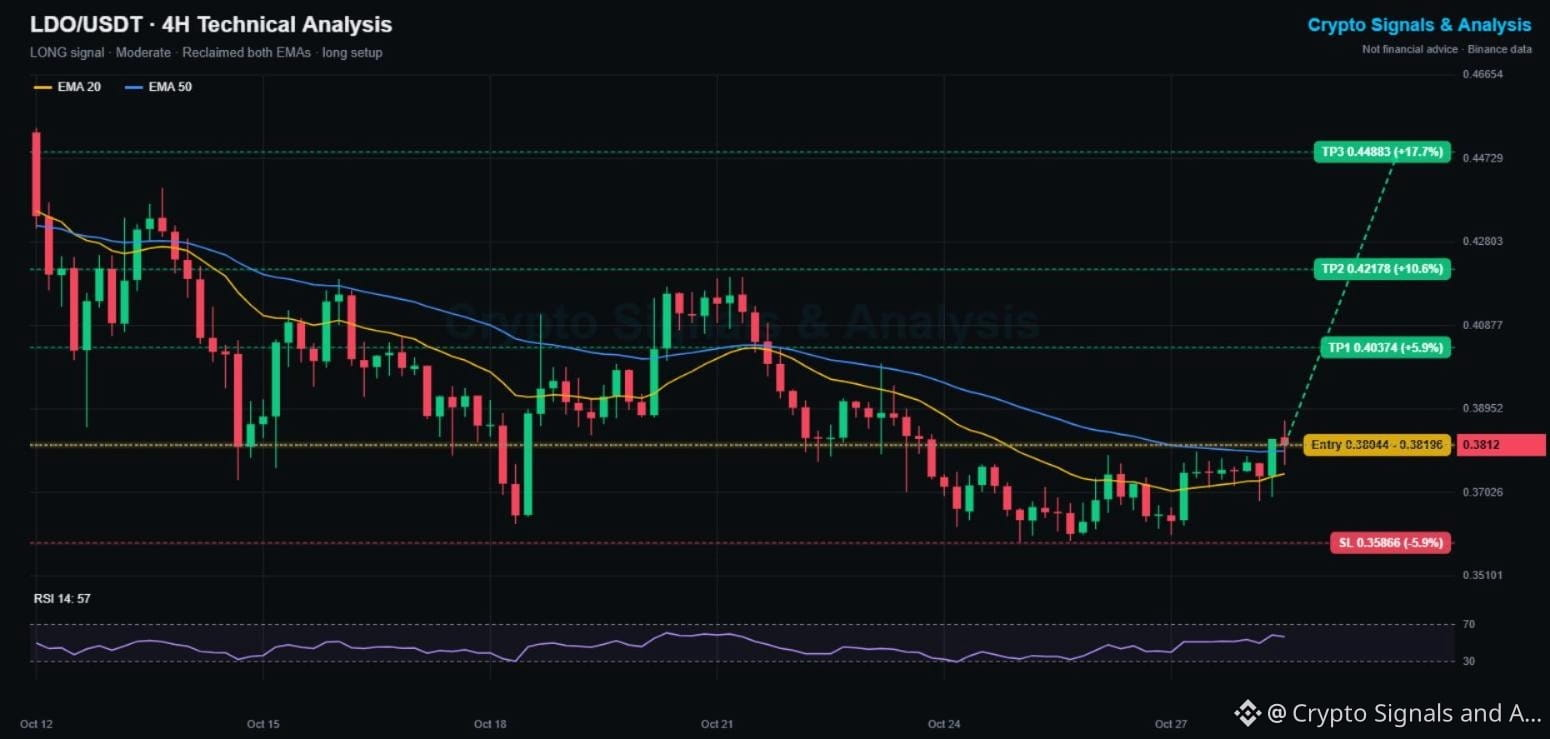
$LDO Price Prediction Today (Oct 28, Night Update): Lido DAO Crypto Signal & Technical Analysis 📊
🟢 LONG | Entry 0.3804 - 0.3820 | TP1 0.4037 | SL 0.3587
👉 Tap $LDO to place your trade fast
🕒 Updated: Oct 28, 22:03 UTC · price 0.3812
Lido DAO built a double bottom at 0.359 (Oct 25 and Oct 27) and has now pushed back above both 4H moving averages for the first time since Oct 21. Ethereum staking names are following ETH higher tonight.
📌 LIDO DAO TRADING SIGNAL (Moderate, 4/5 signals agree)
Entry: 0.3804 - 0.3820
Take profit 1: 0.4037 (+5.9%)
Take profit 2: 0.4218 (+10.6%)
Take profit 3: 0.4488 (+17.7%)
Stop loss: 0.3587 (-5.9%)
📊 LDO TECHNICAL ANALYSIS (4H CHART)
Price is above the EMA20 (0.3746) and EMA50 (0.3799), and the EMA20 has turned up. RSI 57 favors buyers. The one bearish check: still down 5.9% on the week.
🔑 KEY LEVELS
Support: 0.3799 (EMA50), then 0.359 (double bottom)
Resistance: 0.3868, then 0.404 and 0.42
📈 Bullish scenario: a 4H close above 0.3868 opens TP1 at 0.4037.
📉 Bearish scenario: losing 0.375 sends it back to the range. A close under 0.3587 cancels this signal.
💡 Bottom line: clean reversal structure with a clear invalidation. Let 0.3868 confirm.
👉 Tap $LDO
to open the live chart. NFA
🔥 TRADE WITH LOWER FEES
✅ Get a 10% kickback on your Binance Futures trading fees
👇👇👇
{spot}(LDOUSDT)
[Claim your 10% Futures fee kickback here](https://www.binance.com/join?ref=SQUAREGINOS)
━━━━━━━━━━
Double bottom confirmed or one more retest first? 👇
Follow Crypto Signals and Analysis for daily signals.
#cryptosignals #LDO #FOMCWatch
⚠️ Crypto is volatile: risk only what you can afford to lose.
$LDO Price Prediction Today (Oct 28, Night Update): Lido DAO Crypto Signal & Technical Analysis 📊
🟢 LONG | Entry 0.3804 - 0.3820 | TP1 0.4037 | SL 0.3587
👉 Tap $LDO to place your trade fast
🕒 Updated: Oct 28, 22:03 UTC · price 0.3812
Lido DAO built a double bottom at 0.359 (Oct 25 and Oct 27) and has now pushed back above both 4H moving averages for the first time since Oct 21. Ethereum staking names are following ETH higher tonight.
📌 LIDO DAO TRADING SIGNAL (Moderate, 4/5 signals agree)
Entry: 0.3804 - 0.3820
Take profit 1: 0.4037 (+5.9%)
Take profit 2: 0.4218 (+10.6%)
Take profit 3: 0.4488 (+17.7%)
Stop loss: 0.3587 (-5.9%)
📊 LDO TECHNICAL ANALYSIS (4H CHART)
Price is above the EMA20 (0.3746) and EMA50 (0.3799), and the EMA20 has turned up. RSI 57 favors buyers. The one bearish check: still down 5.9% on the week.
🔑 KEY LEVELS
Support: 0.3799 (EMA50), then 0.359 (double bottom)
Resistance: 0.3868, then 0.404 and 0.42
📈 Bullish scenario: a 4H close above 0.3868 opens TP1 at 0.4037.
📉 Bearish scenario: losing 0.375 sends it back to the range. A close under 0.3587 cancels this signal.
💡 Bottom line: clean reversal structure with a clear invalidation. Let 0.3868 confirm.
👉 Tap $LDO
to open the live chart. NFA
🔥 TRADE WITH LOWER FEES
✅ Get a 10% kickback on your Binance Futures trading fees
👇👇👇
Claim your 10% Futures fee kickback here
━━━━━━━━━━
Double bottom confirmed or one more retest first? 👇
Follow Crypto Signals and Analysis for daily signals.
#cryptosignals #LDO #FOMCWatch
⚠️ Crypto is volatile: risk only what you can afford to lose.
1
40
·
--
Baissier
Voir la traduction
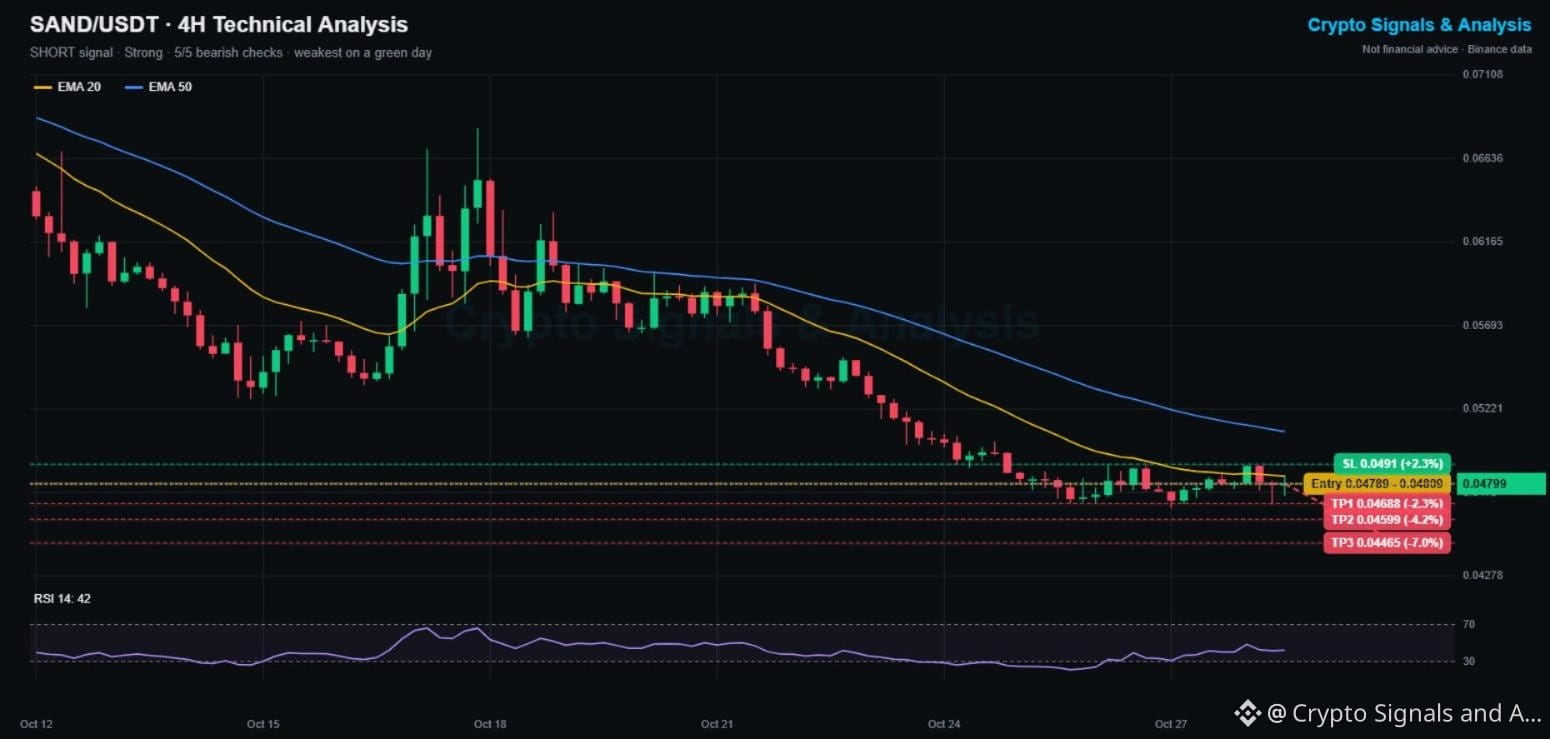
$SAND Price Prediction Today (Oct 28, Night Update): The Sandbox Crypto Signal & Technical Analysis 📊
🔴 SHORT | Entry 0.04789 - 0.04809 | TP1 0.04688 | SL 0.0491
👉 Tap $SAND to place your trade fast
🕒 Updated: Oct 28, 21:45 UTC · price 0.04799
While most altcoins are green tonight, The Sandbox is red (-0.5%) and down 16.9% this week. It has slid from 0.068 on Oct 18 to a fresh low at 0.04662 and still can't hold above its 4H EMA20.
📌 THE SANDBOX TRADING SIGNAL (Strong, 5/5 signals agree)
Entry: 0.04789 - 0.04809
Take profit 1: 0.04688 (-2.3%)
Take profit 2: 0.04599 (-4.2%)
Take profit 3: 0.04465 (-7.0%)
Stop loss: 0.0491 (+2.3%)
📊 SAND TECHNICAL ANALYSIS (4H CHART)
Price is below the EMA20 (0.04842) and EMA50 (0.05094), both sloping down. RSI 42. Price has gone sideways near the lows for 3 days, so this is a tight-stop trade: a break of 0.04662 is what sends it lower.
🔑 KEY LEVELS
Support: 0.04662, then 0.0446
Resistance: 0.04842 (EMA20), then 0.0491
📉 Bearish scenario: a 4H close under 0.04662 opens TP2 and TP3.
📈 Bullish scenario: a close above 0.0491 cancels this signal and points to the EMA50 near 0.051.
💡 Bottom line: trend is down, but the range is tight. Small size, strict stop.
👉 Tap $SAND
to open the live chart. NFA
🔥 TRADE WITH LOWER FEES
✅ Get a 10% kickback on your Binance Futures trading fees
👇👇👇
{spot}(SANDUSDT)
[Claim your 10% Futures fee kickback here](https://www.binance.com/join?ref=SQUAREGINOS)
━━━━━━━━━━
Are metaverse coins done, or is this the bottom zone? 👇
Follow Crypto Signals and Analysis for daily signals.
#cryptosignals #SAND #FOMCWatch
⚠️ Crypto is volatile: risk only what you can afford to lose.
$SAND Price Prediction Today (Oct 28, Night Update): The Sandbox Crypto Signal & Technical Analysis 📊
🔴 SHORT | Entry 0.04789 - 0.04809 | TP1 0.04688 | SL 0.0491
👉 Tap $SAND to place your trade fast
🕒 Updated: Oct 28, 21:45 UTC · price 0.04799
While most altcoins are green tonight, The Sandbox is red (-0.5%) and down 16.9% this week. It has slid from 0.068 on Oct 18 to a fresh low at 0.04662 and still can't hold above its 4H EMA20.
📌 THE SANDBOX TRADING SIGNAL (Strong, 5/5 signals agree)
Entry: 0.04789 - 0.04809
Take profit 1: 0.04688 (-2.3%)
Take profit 2: 0.04599 (-4.2%)
Take profit 3: 0.04465 (-7.0%)
Stop loss: 0.0491 (+2.3%)
📊 SAND TECHNICAL ANALYSIS (4H CHART)
Price is below the EMA20 (0.04842) and EMA50 (0.05094), both sloping down. RSI 42. Price has gone sideways near the lows for 3 days, so this is a tight-stop trade: a break of 0.04662 is what sends it lower.
🔑 KEY LEVELS
Support: 0.04662, then 0.0446
Resistance: 0.04842 (EMA20), then 0.0491
📉 Bearish scenario: a 4H close under 0.04662 opens TP2 and TP3.
📈 Bullish scenario: a close above 0.0491 cancels this signal and points to the EMA50 near 0.051.
💡 Bottom line: trend is down, but the range is tight. Small size, strict stop.
👉 Tap $SAND
to open the live chart. NFA
🔥 TRADE WITH LOWER FEES
✅ Get a 10% kickback on your Binance Futures trading fees
👇👇👇
Claim your 10% Futures fee kickback here
━━━━━━━━━━
Are metaverse coins done, or is this the bottom zone? 👇
Follow Crypto Signals and Analysis for daily signals.
#cryptosignals #SAND #FOMCWatch
⚠️ Crypto is volatile: risk only what you can afford to lose.
81
·
--
Haussier
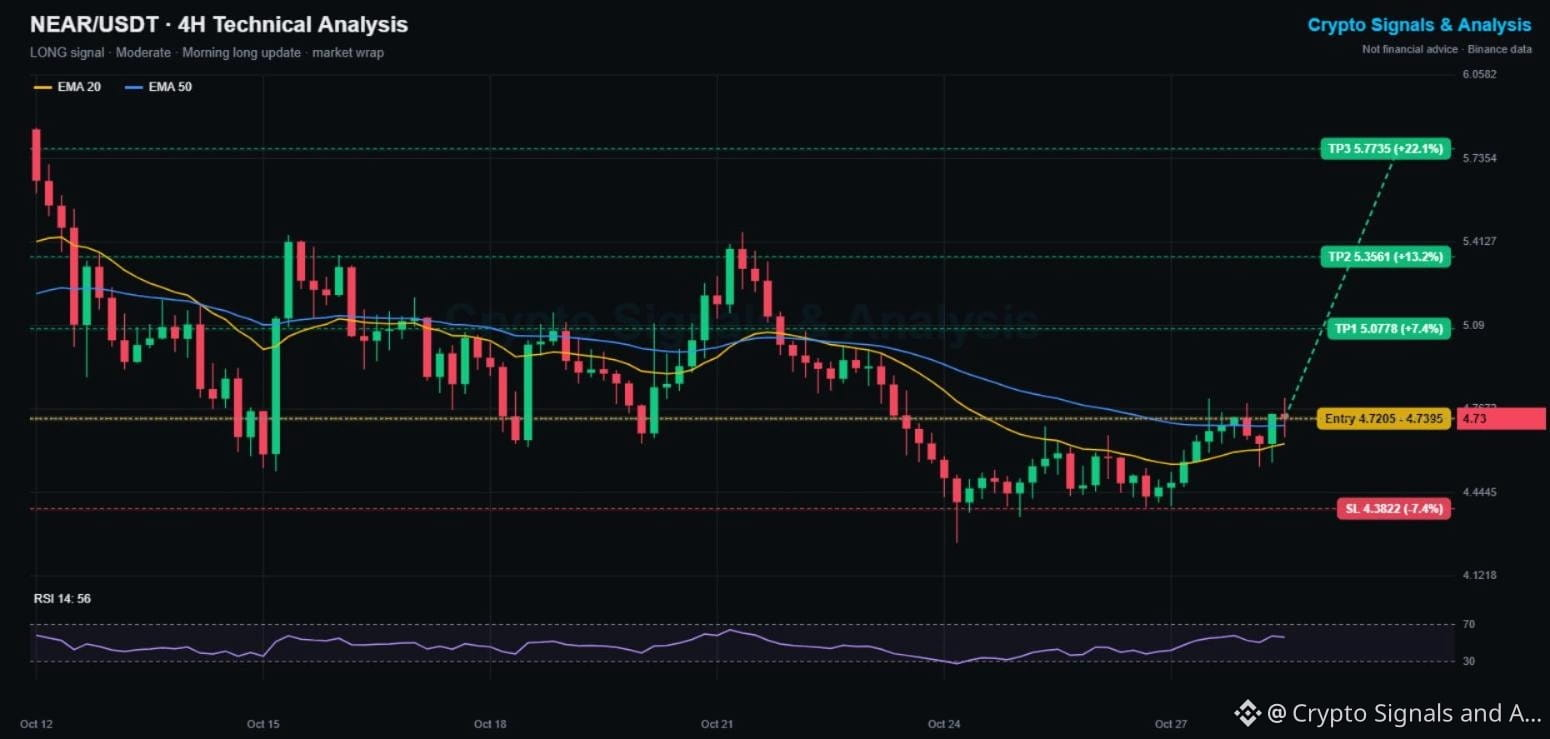
Prévision du prix de $NEAR aujourd’hui (28 oct., mise à jour du soir) : 39 des 49 principales cryptos dans le vert après la Fed, mise à jour du signal NEAR 📰
🟢 LONG | Entrée 4.7205 - 4.7395 | TP1 5.0778 | SL 4.3822
👉 Appuyez sur $NEAR pour passer votre ordre rapidement
🕒 Mis à jour : 28 oct., 21:30 UTC · prix 4.73
📰 RÉCAPITULATIF DU MARCHÉ
Au lendemain du statu quo de la Fed, 39 des 49 cryptos les plus échangées sur le marché spot de Binance sont dans le vert. Le Bitcoin gagne 0.9 %, autour de 81,350, et l’Ethereum 1.0 %. Initia (+22.8 %) et PEPE (+12.9 %) sont en tête des hausses. NEAR Protocol est la 8e crypto la plus échangée aujourd’hui, avec un volume d’environ 85M USDT.
⏳ MISE À JOUR DU SIGNAL NEAR DE CE MATIN
La position longue prise ce matin à 4.614 est toujours ouverte et en profit (+2.5 %). Le plus haut atteint jusqu’ici est de 4.81, juste en dessous du TP1 à 4.882. Le plus bas était de 4.544, bien au-dessus du stop à 4.346.
📌 NOUVELLE CONFIGURATION NEAR (modérée, 4/5 signaux concordent)
Entrée : 4.7205 - 4.7395
Take profit 1 : 5.0778 (+7.4 %)
Take profit 2 : 5.3561 (+13.2 %)
Take profit 3 : 5.7735 (+22.1 %)
Stop loss : 4.3822 (-7.4 %)
📊 GRAPHIQUE 4H
Le prix est repassé au-dessus des EMA20 (4.633) et EMA50 (4.704), et l’EMA20 s’oriente à la hausse. RSI 56. Point faible : le cours reste en baisse de 10 % sur la semaine.
🔑 NIVEAUX CLÉS
Support : 4.70 (EMA50), puis 4.39
Résistance : 4.81, puis 5.08
💡 En résumé : une clôture en 4H au-dessus de 4.81 confirmerait la cassure. Si le cours passe sous 4.70, mieux vaut attendre.
👉 Appuyez sur $NEAR
pour ouvrir le graphique en direct. Ceci ne constitue pas un conseil financier.
🔥 TRADEZ AVEC DES FRAIS RÉDUITS
✅ Récupérez 10 % de vos frais de trading sur Binance Futures
👇👇👇
{spot}(NEARUSDT)
[Claim your 10% Futures fee kickback here](https://www.binance.com/join?ref=SQUAREGINOS)
━━━━━━━━━━
S’agit-il d’une véritable reprise des altcoins ou simplement d’un rebond technique ? 👇
Suivez Crypto Signals and Analysis pour recevoir des signaux quotidiens.
#cryptosignals #NEAR #FOMCWatch
⚠️ Les cryptos sont volatiles : ne risquez que ce que vous pouvez vous permettre de perdre.
Prévision du prix de $NEAR aujourd’hui (28 oct., mise à jour du soir) : 39 des 49 principales cryptos dans le vert après la Fed, mise à jour du signal NEAR 📰
🟢 LONG | Entrée 4.7205 - 4.7395 | TP1 5.0778 | SL 4.3822
👉 Appuyez sur $NEAR pour passer votre ordre rapidement
🕒 Mis à jour : 28 oct., 21:30 UTC · prix 4.73
📰 RÉCAPITULATIF DU MARCHÉ
Au lendemain du statu quo de la Fed, 39 des 49 cryptos les plus échangées sur le marché spot de Binance sont dans le vert. Le Bitcoin gagne 0.9 %, autour de 81,350, et l’Ethereum 1.0 %. Initia (+22.8 %) et PEPE (+12.9 %) sont en tête des hausses. NEAR Protocol est la 8e crypto la plus échangée aujourd’hui, avec un volume d’environ 85M USDT.
⏳ MISE À JOUR DU SIGNAL NEAR DE CE MATIN
La position longue prise ce matin à 4.614 est toujours ouverte et en profit (+2.5 %). Le plus haut atteint jusqu’ici est de 4.81, juste en dessous du TP1 à 4.882. Le plus bas était de 4.544, bien au-dessus du stop à 4.346.
📌 NOUVELLE CONFIGURATION NEAR (modérée, 4/5 signaux concordent)
Entrée : 4.7205 - 4.7395
Take profit 1 : 5.0778 (+7.4 %)
Take profit 2 : 5.3561 (+13.2 %)
Take profit 3 : 5.7735 (+22.1 %)
Stop loss : 4.3822 (-7.4 %)
📊 GRAPHIQUE 4H
Le prix est repassé au-dessus des EMA20 (4.633) et EMA50 (4.704), et l’EMA20 s’oriente à la hausse. RSI 56. Point faible : le cours reste en baisse de 10 % sur la semaine.
🔑 NIVEAUX CLÉS
Support : 4.70 (EMA50), puis 4.39
Résistance : 4.81, puis 5.08
💡 En résumé : une clôture en 4H au-dessus de 4.81 confirmerait la cassure. Si le cours passe sous 4.70, mieux vaut attendre.
👉 Appuyez sur $NEAR
pour ouvrir le graphique en direct. Ceci ne constitue pas un conseil financier.
🔥 TRADEZ AVEC DES FRAIS RÉDUITS
✅ Récupérez 10 % de vos frais de trading sur Binance Futures
👇👇👇
Claim your 10% Futures fee kickback here
━━━━━━━━━━
S’agit-il d’une véritable reprise des altcoins ou simplement d’un rebond technique ? 👇
Suivez Crypto Signals and Analysis pour recevoir des signaux quotidiens.
#cryptosignals #NEAR #FOMCWatch
⚠️ Les cryptos sont volatiles : ne risquez que ce que vous pouvez vous permettre de perdre.
148
·
--
Baissier
Voir la traduction
$VET Price Prediction Today (Oct 28, Evening Update): VeChain Crypto Signal & Technical Analysis 📊
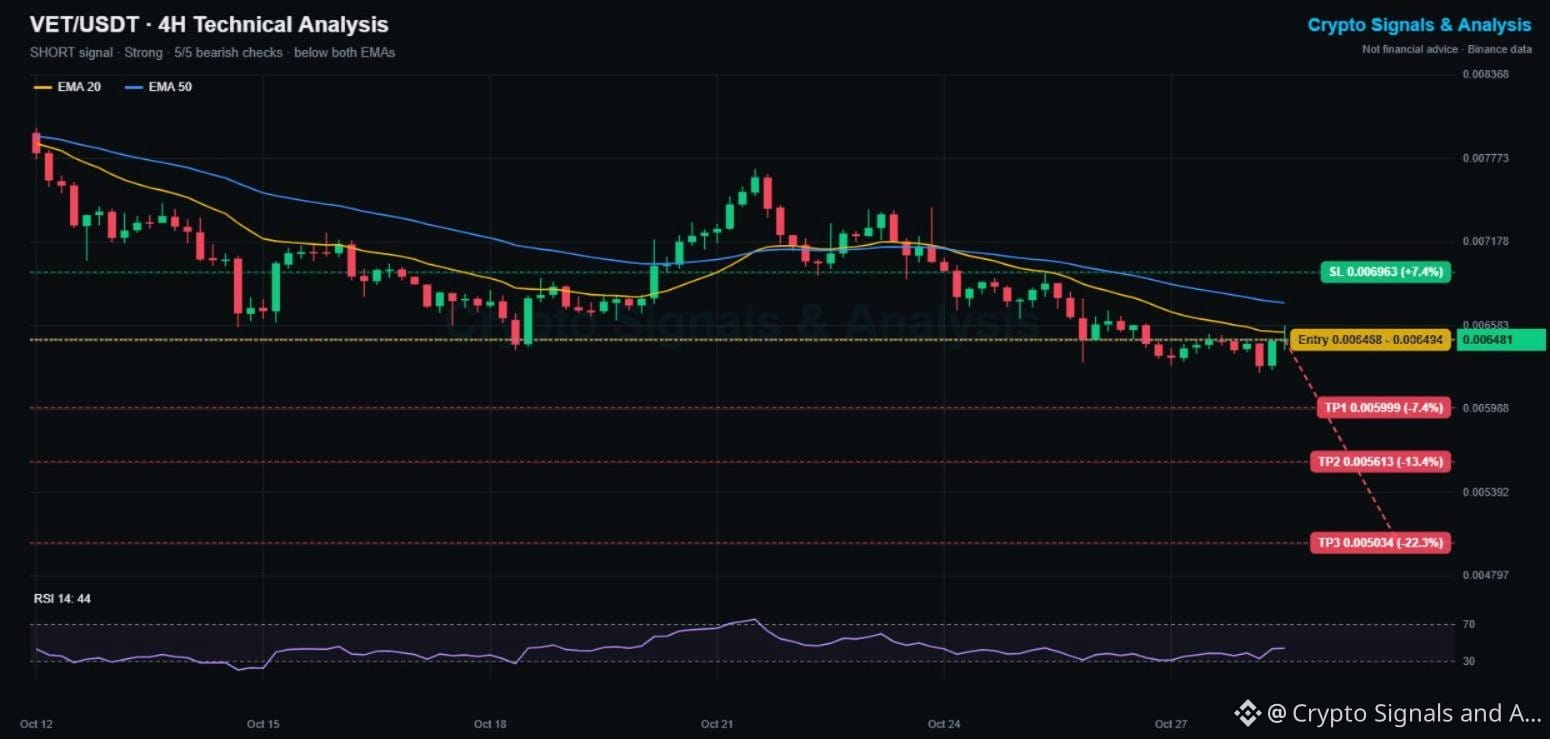
🔴 SHORT | Entry 0.006468 - 0.006494 | TP1 0.005999 | SL 0.006963
👉 Tap $VET to place your trade fast
🕒 Updated: Oct 28, 21:10 UTC · price 0.006481
VeChain is down 15.2% this week and printed a fresh 2-week low at 0.006247 yesterday. Tonight's bounce is running straight into the falling 4H EMA20, the same line that has capped it since Oct 24.
📌 VECHAIN TRADING SIGNAL (Strong, 5/5 signals agree)
Entry: 0.006468 - 0.006494
Take profit 1: 0.005999 (-7.4%)
Take profit 2: 0.005613 (-13.4%)
Take profit 3: 0.005034 (-22.3%)
Stop loss: 0.006963 (+7.4%)
📊 VET TECHNICAL ANALYSIS (4H CHART)
Price is below the EMA20 (0.006534) and EMA50 (0.006743), both sloping down. RSI at 44 keeps sellers in control. Lower highs since the Oct 21 peak near 0.0078 define the trend.
🔑 KEY LEVELS
Support: 0.006247 (2-week low), then 0.0060
Resistance: 0.006534 (EMA20), then 0.006743
📉 Bearish scenario: losing 0.006247 opens TP1 near 0.0060.
📈 Bullish scenario: a 4H close above the EMA50 flips the bias. A close above 0.006963 cancels this signal.
💡 Bottom line: rejection at the EMA20 is the trigger. Wait for it, keep the stop.
👉 Tap $VET
to open the live chart. NFA
🔥 TRADE WITH LOWER FEES
✅ Get a 10% kickback on your Binance Futures trading fees
👇👇👇
{spot}(VETUSDT)
[Claim your 10% Futures fee kickback here](https://www.binance.com/join?ref=SQUAREGINOS)
━━━━━━━━━━
Does VeChain hold 0.006247 or break lower? 👇
Follow Crypto Signals and Analysis for daily signals.
#cryptosignals #VeChain #FOMCWatch
⚠️ Crypto is volatile: risk only what you can afford to lose.
$VET Price Prediction Today (Oct 28, Evening Update): VeChain Crypto Signal & Technical Analysis 📊
🔴 SHORT | Entry 0.006468 - 0.006494 | TP1 0.005999 | SL 0.006963
👉 Tap $VET to place your trade fast
🕒 Updated: Oct 28, 21:10 UTC · price 0.006481
VeChain is down 15.2% this week and printed a fresh 2-week low at 0.006247 yesterday. Tonight's bounce is running straight into the falling 4H EMA20, the same line that has capped it since Oct 24.
📌 VECHAIN TRADING SIGNAL (Strong, 5/5 signals agree)
Entry: 0.006468 - 0.006494
Take profit 1: 0.005999 (-7.4%)
Take profit 2: 0.005613 (-13.4%)
Take profit 3: 0.005034 (-22.3%)
Stop loss: 0.006963 (+7.4%)
📊 VET TECHNICAL ANALYSIS (4H CHART)
Price is below the EMA20 (0.006534) and EMA50 (0.006743), both sloping down. RSI at 44 keeps sellers in control. Lower highs since the Oct 21 peak near 0.0078 define the trend.
🔑 KEY LEVELS
Support: 0.006247 (2-week low), then 0.0060
Resistance: 0.006534 (EMA20), then 0.006743
📉 Bearish scenario: losing 0.006247 opens TP1 near 0.0060.
📈 Bullish scenario: a 4H close above the EMA50 flips the bias. A close above 0.006963 cancels this signal.
💡 Bottom line: rejection at the EMA20 is the trigger. Wait for it, keep the stop.
👉 Tap $VET
to open the live chart. NFA
🔥 TRADE WITH LOWER FEES
✅ Get a 10% kickback on your Binance Futures trading fees
👇👇👇
Claim your 10% Futures fee kickback here
━━━━━━━━━━
Does VeChain hold 0.006247 or break lower? 👇
Follow Crypto Signals and Analysis for daily signals.
#cryptosignals #VeChain #FOMCWatch
⚠️ Crypto is volatile: risk only what you can afford to lose.
25
·
--
Haussier
$TRUMP Prévision du prix aujourd’hui (28 oct., mise à jour du soir) : signal officiel sur Trump et analyse technique 📊
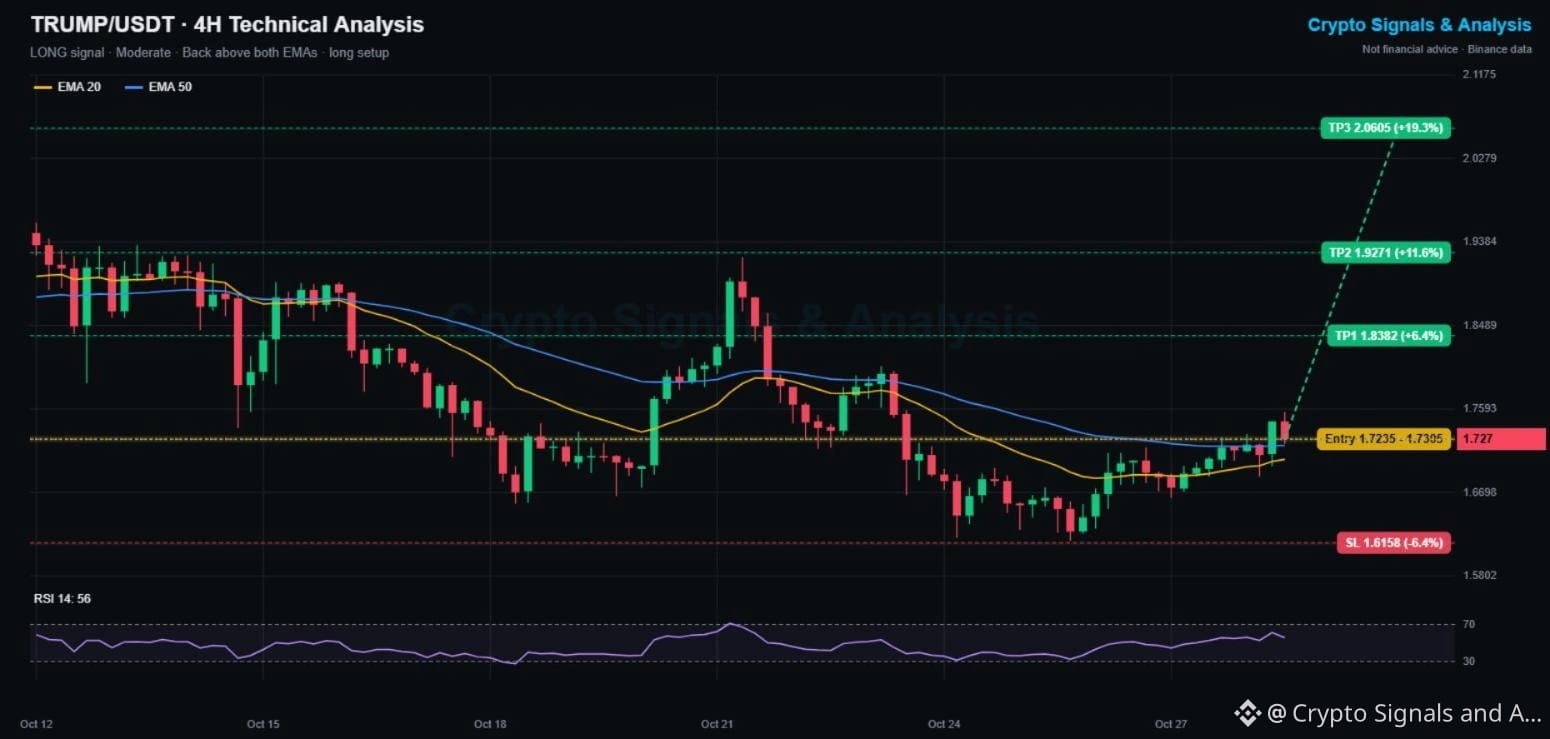
🟢 LONG | Entrée 1.7235 - 1.7305 | TP1 1.8382 | SL 1.6158
👉 Appuyez sur $TRUMP pour passer rapidement votre ordre
🕒 Mis à jour : 28 oct., 20:52 UTC · prix 1.727
Official Trump a rebondi après avoir atteint 1.618 (son plus bas niveau depuis plus de deux semaines) et vient de repasser au-dessus de ses deux moyennes mobiles en 4H. Alors que les memecoins sont en tête ce soir, il s’agit de son premier véritable changement de tendance depuis le 22 oct.
📌 SIGNAL DE TRADING OFFICIAL TRUMP (modéré, 4/5 indicateurs convergent)
Entrée : 1.7235 - 1.7305
Objectif de profit 1 : 1.8382 (+6.4%)
Objectif de profit 2 : 1.9271 (+11.6%)
Objectif de profit 3 : 2.0605 (+19.3%)
Stop-loss : 1.6158 (-6.4%)
📊 ANALYSE TECHNIQUE DE TRUMP (GRAPHIQUE 4H)
Le prix est au-dessus des EMA20 (1.705) et EMA50 (1.720), et l’EMA20 est repartie à la hausse. Le RSI à 56 favorise les acheteurs. Seul bémol : le cours reste en baisse de 6.5% sur la semaine. Il s’agit donc d’un retournement précoce, pas encore d’une tendance confirmée.
🔑 NIVEAUX CLÉS
Support : 1.705 (EMA20), puis 1.618
Résistance : 1.756, puis 1.84 et 1.93
📈 Scénario haussier : une clôture en 4H au-dessus de 1.756 ouvre la voie à TP1 à 1.838.
📉 Scénario baissier : une cassure sous 1.70 remet le creux de 1.618 en jeu. Une clôture sous 1.6158 invalide ce signal.
💡 En résumé : bon rapport risque/rendement après un nouveau plus bas, mais gardez une petite position jusqu’au franchissement de 1.756.
👉 Appuyez sur $TRUMP
pour ouvrir le graphique en direct. NFA
🔥 TRADEZ AVEC DES FRAIS RÉDUITS
✅ Bénéficiez d’un remboursement de 10% sur vos frais de trading Binance Futures
👇👇👇
{spot}(TRUMPUSDT)
[Claim your 10% Futures fee kickback here](https://www.binance.com/join?ref=SQUAREGINOS)
━━━━━━━━━━
Véritable retournement ou simple rebond du chat mort ? Votez ci-dessous 👇
Suivez Crypto Signals and Analysis pour recevoir des signaux quotidiens.
#cryptosignals #TRUMP #FOMCWatch
⚠️ Les cryptos sont volatiles : ne risquez que ce que vous pouvez vous permettre de perdre.
$TRUMP Prévision du prix aujourd’hui (28 oct., mise à jour du soir) : signal officiel sur Trump et analyse technique 📊
🟢 LONG | Entrée 1.7235 - 1.7305 | TP1 1.8382 | SL 1.6158
👉 Appuyez sur $TRUMP pour passer rapidement votre ordre
🕒 Mis à jour : 28 oct., 20:52 UTC · prix 1.727
Official Trump a rebondi après avoir atteint 1.618 (son plus bas niveau depuis plus de deux semaines) et vient de repasser au-dessus de ses deux moyennes mobiles en 4H. Alors que les memecoins sont en tête ce soir, il s’agit de son premier véritable changement de tendance depuis le 22 oct.
📌 SIGNAL DE TRADING OFFICIAL TRUMP (modéré, 4/5 indicateurs convergent)
Entrée : 1.7235 - 1.7305
Objectif de profit 1 : 1.8382 (+6.4%)
Objectif de profit 2 : 1.9271 (+11.6%)
Objectif de profit 3 : 2.0605 (+19.3%)
Stop-loss : 1.6158 (-6.4%)
📊 ANALYSE TECHNIQUE DE TRUMP (GRAPHIQUE 4H)
Le prix est au-dessus des EMA20 (1.705) et EMA50 (1.720), et l’EMA20 est repartie à la hausse. Le RSI à 56 favorise les acheteurs. Seul bémol : le cours reste en baisse de 6.5% sur la semaine. Il s’agit donc d’un retournement précoce, pas encore d’une tendance confirmée.
🔑 NIVEAUX CLÉS
Support : 1.705 (EMA20), puis 1.618
Résistance : 1.756, puis 1.84 et 1.93
📈 Scénario haussier : une clôture en 4H au-dessus de 1.756 ouvre la voie à TP1 à 1.838.
📉 Scénario baissier : une cassure sous 1.70 remet le creux de 1.618 en jeu. Une clôture sous 1.6158 invalide ce signal.
💡 En résumé : bon rapport risque/rendement après un nouveau plus bas, mais gardez une petite position jusqu’au franchissement de 1.756.
👉 Appuyez sur $TRUMP
pour ouvrir le graphique en direct. NFA
🔥 TRADEZ AVEC DES FRAIS RÉDUITS
✅ Bénéficiez d’un remboursement de 10% sur vos frais de trading Binance Futures
👇👇👇
Claim your 10% Futures fee kickback here
━━━━━━━━━━
Véritable retournement ou simple rebond du chat mort ? Votez ci-dessous 👇
Suivez Crypto Signals and Analysis pour recevoir des signaux quotidiens.
#cryptosignals #TRUMP #FOMCWatch
⚠️ Les cryptos sont volatiles : ne risquez que ce que vous pouvez vous permettre de perdre.
243
·
--
Baissier
Voir la traduction
$CRV Price Prediction Today (Oct 28, Evening Update): Curve DAO Crypto Signal & Technical Analysis 📊
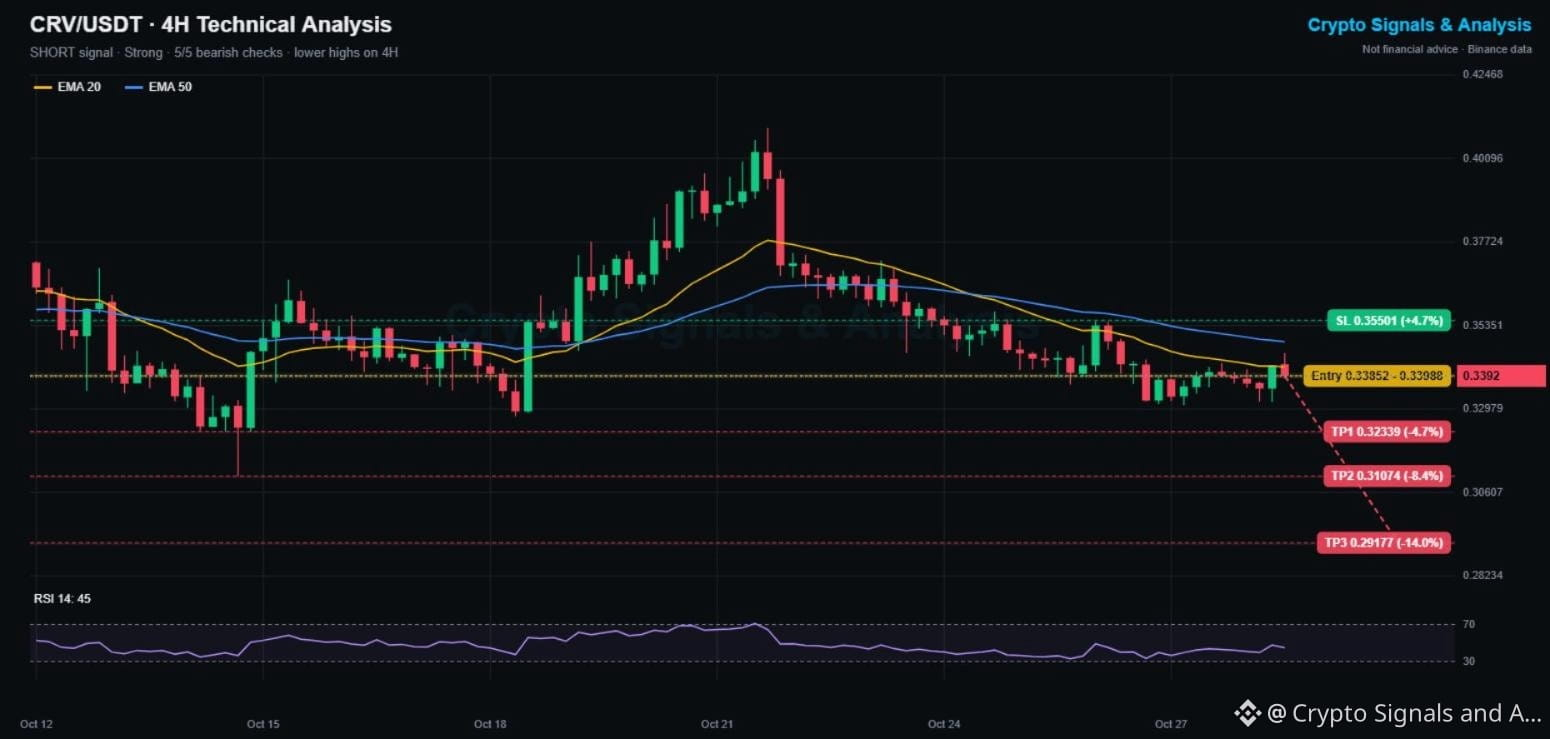
🔴 SHORT | Entry 0.3385 - 0.3399 | TP1 0.3234 | SL 0.3550
👉 Tap $CRV to place your trade fast
🕒 Updated: Oct 28, 20:35 UTC · price 0.3392
Curve DAO is one of the weakest large DeFi tokens this week: down 15.8% in 7 days and flat today while memes rally. Since the Oct 21 rejection near 0.41, every 4H bounce has made a lower high.
📌 CURVE DAO TRADING SIGNAL (Strong, 5/5 signals agree)
Entry: 0.3385 - 0.3399
Take profit 1: 0.3234 (-4.7%)
Take profit 2: 0.3107 (-8.4%)
Take profit 3: 0.2918 (-14.0%)
Stop loss: 0.3550 (+4.7%)
📊 CRV TECHNICAL ANALYSIS (4H CHART)
Price is below the EMA20 (0.3417) and EMA50 (0.3489), and both are sloping down. RSI at 45 shows sellers in control without being oversold. The latest bounce died right at the EMA20.
🔑 KEY LEVELS
Support: 0.331, then 0.311 (Oct 18 low)
Resistance: 0.342 (EMA20), then 0.355
📉 Bearish scenario: a 4H close under 0.331 opens TP1 and the 0.311 low.
📈 Bullish scenario: reclaiming 0.349 (EMA50) flips the bias. A close above 0.3550 cancels this signal.
💡 Bottom line: trend, momentum and weekly change all point down. Respect the stop.
👉 Tap $CRV
to open the live chart. NFA
🔥 TRADE WITH LOWER FEES
✅ Get a 10% kickback on your Binance Futures trading fees
👇👇👇
{spot}(CRVUSDT)
[Claim your 10% Futures fee kickback here](https://www.binance.com/join?ref=SQUAREGINOS)
━━━━━━━━━━
Is DeFi bleeding out, or is Curve DAO close to a bottom? 👇
Follow Crypto Signals and Analysis for daily signals.
#cryptosignals #CRV #FOMCWatch
⚠️ Crypto is volatile: risk only what you can afford to lose.
$CRV Price Prediction Today (Oct 28, Evening Update): Curve DAO Crypto Signal & Technical Analysis 📊
🔴 SHORT | Entry 0.3385 - 0.3399 | TP1 0.3234 | SL 0.3550
👉 Tap $CRV to place your trade fast
🕒 Updated: Oct 28, 20:35 UTC · price 0.3392
Curve DAO is one of the weakest large DeFi tokens this week: down 15.8% in 7 days and flat today while memes rally. Since the Oct 21 rejection near 0.41, every 4H bounce has made a lower high.
📌 CURVE DAO TRADING SIGNAL (Strong, 5/5 signals agree)
Entry: 0.3385 - 0.3399
Take profit 1: 0.3234 (-4.7%)
Take profit 2: 0.3107 (-8.4%)
Take profit 3: 0.2918 (-14.0%)
Stop loss: 0.3550 (+4.7%)
📊 CRV TECHNICAL ANALYSIS (4H CHART)
Price is below the EMA20 (0.3417) and EMA50 (0.3489), and both are sloping down. RSI at 45 shows sellers in control without being oversold. The latest bounce died right at the EMA20.
🔑 KEY LEVELS
Support: 0.331, then 0.311 (Oct 18 low)
Resistance: 0.342 (EMA20), then 0.355
📉 Bearish scenario: a 4H close under 0.331 opens TP1 and the 0.311 low.
📈 Bullish scenario: reclaiming 0.349 (EMA50) flips the bias. A close above 0.3550 cancels this signal.
💡 Bottom line: trend, momentum and weekly change all point down. Respect the stop.
👉 Tap $CRV
to open the live chart. NFA
🔥 TRADE WITH LOWER FEES
✅ Get a 10% kickback on your Binance Futures trading fees
👇👇👇
Claim your 10% Futures fee kickback here
━━━━━━━━━━
Is DeFi bleeding out, or is Curve DAO close to a bottom? 👇
Follow Crypto Signals and Analysis for daily signals.
#cryptosignals #CRV #FOMCWatch
⚠️ Crypto is volatile: risk only what you can afford to lose.
51
·
--
Haussier
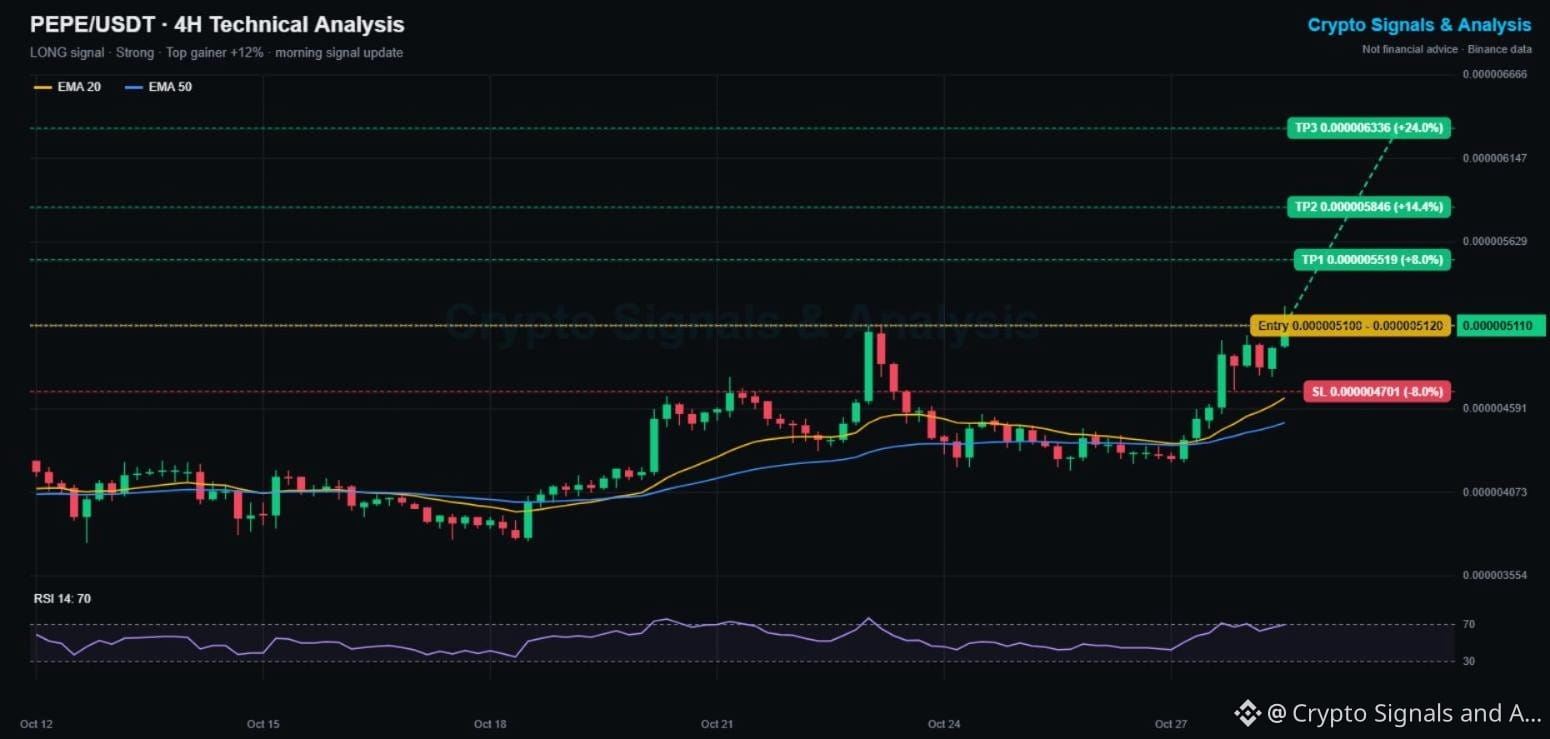
Prévision du prix de $PEPE aujourd’hui (28 oct., mise à jour du soir) : PEPE en tête des hausses sur Binance avec +12 %, le signal du matin atteint TP1 🚀
🟢 LONG | Entrée 0.00000510 - 0.00000512 | TP1 0.00000552 | SL 0.00000470
👉 Appuyez sur $PEPE pour passer votre trade rapidement
🕒 Mis à jour : 28 oct., 20:20 UTC · prix 0.00000511
📰 ACTUALITÉ DU MARCHÉ
PEPE est la crypto à forte hausse parmi les cryptos à volume élevé sur le marché spot de Binance ce soir : +12.4 % en 24 heures, avec un volume d’environ 102M USDT. Bitcoin ne progresse que de 0.6 % après le statu quo de la Fed, les memecoins sont donc en tête de ce rebond.
✅ RÉSULTAT DU SIGNAL DU MATIN
Ce matin, nous avons partagé un signal long sur PEPE à partir de 0.00000484. Au cours de la dernière heure, le prix a atteint 0.00000523, soit TP1 (+8 %). Le stop à 0.00000445 n’a jamais été touché. TP2 et TP3 sont toujours en attente.
📌 NOUVELLE CONFIGURATION PEPE (forte, 5/5 signaux concordent)
Entrée : 0.00000510 - 0.00000512
Prise de profit 1 : 0.00000552 (+8 %)
Prise de profit 2 : 0.00000585 (+14 %)
Prise de profit 3 : 0.00000634 (+24 %)
Stop loss : 0.00000470 (-8 %)
📊 GRAPHIQUE 4H
Le prix est bien au-dessus des EMA20 (0.00000466) et EMA50 (0.00000451). Le RSI est à 70 : la dynamique est forte, mais le marché est tendu. Entrer maintenant est plus risqué que ce matin ; un repli vers 0.00000497 - 0.00000500 offrirait un meilleur point d’entrée.
🔑 NIVEAUX CLÉS
Support : 0.00000500, puis 0.00000470
Résistance : 0.00000523 (plus haut du jour), puis 0.00000552
💡 En bref : la tendance est à la hausse, mais prenez des profits partiels aux objectifs et maintenez votre stop.
👉 Appuyez sur $PEPE
pour ouvrir le graphique en direct. Ceci ne constitue pas un conseil financier.
🔥 TRADEZ AVEC DES FRAIS RÉDUITS
✅ Bénéficiez d’un cashback de 10 % sur vos frais de trading Binance Futures
👇👇👇
{spot}(PEPEUSDT)
[Claim your 10% Futures fee kickback here](https://www.binance.com/join?ref=SQUAREGINOS)
━━━━━━━━━━
Avez-vous profité du mouvement de PEPE ou attendez-vous un repli ? 👇
Suivez Crypto Signals and Analysis pour recevoir des signaux quotidiens.
#cryptosignals #PEPE #FOMCWatch
⚠️ Les cryptomonnaies sont volatiles : ne risquez que ce que vous pouvez vous permettre de perdre.
Prévision du prix de $PEPE aujourd’hui (28 oct., mise à jour du soir) : PEPE en tête des hausses sur Binance avec +12 %, le signal du matin atteint TP1 🚀
🟢 LONG | Entrée 0.00000510 - 0.00000512 | TP1 0.00000552 | SL 0.00000470
👉 Appuyez sur $PEPE pour passer votre trade rapidement
🕒 Mis à jour : 28 oct., 20:20 UTC · prix 0.00000511
📰 ACTUALITÉ DU MARCHÉ
PEPE est la crypto à forte hausse parmi les cryptos à volume élevé sur le marché spot de Binance ce soir : +12.4 % en 24 heures, avec un volume d’environ 102M USDT. Bitcoin ne progresse que de 0.6 % après le statu quo de la Fed, les memecoins sont donc en tête de ce rebond.
✅ RÉSULTAT DU SIGNAL DU MATIN
Ce matin, nous avons partagé un signal long sur PEPE à partir de 0.00000484. Au cours de la dernière heure, le prix a atteint 0.00000523, soit TP1 (+8 %). Le stop à 0.00000445 n’a jamais été touché. TP2 et TP3 sont toujours en attente.
📌 NOUVELLE CONFIGURATION PEPE (forte, 5/5 signaux concordent)
Entrée : 0.00000510 - 0.00000512
Prise de profit 1 : 0.00000552 (+8 %)
Prise de profit 2 : 0.00000585 (+14 %)
Prise de profit 3 : 0.00000634 (+24 %)
Stop loss : 0.00000470 (-8 %)
📊 GRAPHIQUE 4H
Le prix est bien au-dessus des EMA20 (0.00000466) et EMA50 (0.00000451). Le RSI est à 70 : la dynamique est forte, mais le marché est tendu. Entrer maintenant est plus risqué que ce matin ; un repli vers 0.00000497 - 0.00000500 offrirait un meilleur point d’entrée.
🔑 NIVEAUX CLÉS
Support : 0.00000500, puis 0.00000470
Résistance : 0.00000523 (plus haut du jour), puis 0.00000552
💡 En bref : la tendance est à la hausse, mais prenez des profits partiels aux objectifs et maintenez votre stop.
👉 Appuyez sur $PEPE
pour ouvrir le graphique en direct. Ceci ne constitue pas un conseil financier.
🔥 TRADEZ AVEC DES FRAIS RÉDUITS
✅ Bénéficiez d’un cashback de 10 % sur vos frais de trading Binance Futures
👇👇👇
Claim your 10% Futures fee kickback here
━━━━━━━━━━
Avez-vous profité du mouvement de PEPE ou attendez-vous un repli ? 👇
Suivez Crypto Signals and Analysis pour recevoir des signaux quotidiens.
#cryptosignals #PEPE #FOMCWatch
⚠️ Les cryptomonnaies sont volatiles : ne risquez que ce que vous pouvez vous permettre de perdre.
51
Connectez-vous pour découvrir plus de contenu
Rejoignez la communauté mondiale des adeptes de cryptomonnaies sur Binance Square
⚡️ Suviez les dernières informations importantes sur les cryptomonnaies.
💬 Jugé digne de confiance par la plus grande plateforme d’échange de cryptomonnaies au monde.
👍 Découvrez les connaissances que partagent les créateurs vérifiés.
Adresse e-mail/Nº de téléphone