Binance Square
#iamcryptoprince

iamcryptoprince

236,645 vues
121 mentions
iamcryptoprince
·
--
Haussier
Voir la traduction
Sol signal Support: 100–102 Resistance: 110 Next resistance: 114–115 Buy = 102.25 to 103.50 Sell = 110.20 If $SOL breaks out 111 then sell accordingly to next resistance. #iamcryptoprince {spot}(SOLUSDT)

Sol signal

Support: 100–102
Resistance: 110
Next resistance: 114–115

Buy = 102.25 to 103.50
Sell = 110.20

If $SOL breaks out 111 then sell accordingly to next resistance.

#iamcryptoprince
Article
Voir la traduction
Portfolio managementHow to Invest from 100 to 10,000 dollars. Rules : 1 = Don't invest in every coin. 2 = Don't go for more than 5 coins. 3 = Plan DCA. 4 = Maximum entry in any coin should be 500. 5 = Do day trading and longterm together. 6 = Always buy at support or after breakout confirmation. 7 = No future trading in this setup is explained. 8 = Sell on small profits again and again. Let's start : Use atleast 5 planned entries so you always have capital available if the price hits lowest. 1 = Starting with 100 dollars? Pick 1 coin 20 × 5 = 100 Total 100 Entries look small but they worth it,you ll never get stuck,always buy at support only. 2 = Starting with 1000 dollars? Pick 1 coin 100 × 10 = 1000 Total 1000 Let's take example of sol coin,you buy it at 97 and it drops to 93 so you buy again at 93 and it goes up to 95 so your average buying price is 95 now,take 100 dollars first entry out and now buying rate is 95 for first entry so you can place maximum sell limit for it and wait for next bottom,you still have 9 entries left for big instant dumps,that's the proper way of day trading and long term holding. 3 = Starting with 2000 dollars? Pick 2 coins 100 × 10 = 1000 100 × 10 = 1000 Total 2000 Or pick 1 coin. 200 × 10 = 2000 Total 2000 In this budget either you can pick two coins or double the investment ratio to 200 dollars for 1 coin. (Double better) 4 = Starting with 5000 dollars? Same rule like 2000 dollars,either pick 5 coins or increase the invest to 500 for 2 coin as per your choice. ( I shall increase ammount). Pick 5 coins 200 × 5 = 1000 200 × 5 = 1000 200 × 5 = 1000 200 × 5 = 1000 200 × 5 = 1000 Total 5000 Or pick 2 coins 500 × 5 = 2,500 500 × 5 = 2500 Total 5000 Or pick 1 coin only 500 × 10 = 5000 Total 5000 Always remember rule no.4 5 = Starting with 10000 dollars? In this budget you can pick 4 coins and remember that the maximum entry is 500. 500 × 5 = 2500 500 × 5 = 2500 500 × 5 = 2500 500 × 5 = 2500 Total 10000 Or pick 1 coin again (much better). 500 × 20 = 10000 Total 10000 I know you are not going to do this but still guiding you. Reasons : Nobody knows the exact bottom and If you put everything in at once and the coin drops, you have no capital left to buy at better prices. With 5 to 10 planned entries, you can build your position gradually and keep cash available for deeper dips. Your first entry gets you into the market.Your next entries allow you to buy lower.Your final entries give you more flexibility if the market falls further.The goal is to catch good bottom with maximum returns of day trading.The goal is to control your capital and avoid putting everything into one price. Invest patiently. Keep capital available. Don’t chase the market,you'll get coin on your desired price eventually it's my 5 years experience. #iamcryptoprince

Portfolio management

How to Invest from 100 to 10,000 dollars.
Rules :
1 = Don't invest in every coin.
2 = Don't go for more than 5 coins.
3 = Plan DCA.
4 = Maximum entry in any coin should be 500.
5 = Do day trading and longterm together.
6 = Always buy at support or after breakout confirmation.
7 = No future trading in this setup is explained.
8 = Sell on small profits again and again.
Let's start :
Use atleast 5 planned entries so you always have capital available if the price hits lowest.
1 = Starting with 100 dollars?
Pick 1 coin
20 × 5 = 100
Total 100
Entries look small but they worth it,you ll never get stuck,always buy at support only.
2 = Starting with 1000 dollars?
Pick 1 coin
100 × 10 = 1000
Total 1000
Let's take example of sol coin,you buy it at 97 and it drops to 93 so you buy again at 93 and it goes up to 95 so your average buying price is 95 now,take 100 dollars first entry out and now buying rate is 95 for first entry so you can place maximum sell limit for it and wait for next bottom,you still have 9 entries left for big instant dumps,that's the proper way of day trading and long term holding.
3 = Starting with 2000 dollars?
Pick 2 coins
100 × 10 = 1000
100 × 10 = 1000
Total 2000
Or pick 1 coin.
200 × 10 = 2000
Total 2000
In this budget either you can pick two coins or double the investment ratio to 200 dollars for 1 coin. (Double better)
4 = Starting with 5000 dollars?
Same rule like 2000 dollars,either pick 5 coins or increase the invest to 500 for 2 coin as per your choice. ( I shall increase ammount).
Pick 5 coins
200 × 5 = 1000
200 × 5 = 1000
200 × 5 = 1000
200 × 5 = 1000
200 × 5 = 1000
Total 5000
Or pick 2 coins
500 × 5 = 2,500
500 × 5 = 2500
Total 5000
Or pick 1 coin only
500 × 10 = 5000
Total 5000
Always remember rule no.4
5 = Starting with 10000 dollars?
In this budget you can pick 4 coins and remember that the maximum entry is 500.
500 × 5 = 2500
500 × 5 = 2500
500 × 5 = 2500
500 × 5 = 2500
Total 10000
Or pick 1 coin again (much better).
500 × 20 = 10000
Total 10000
I know you are not going to do this but still guiding you.
Reasons :
Nobody knows the exact bottom and If you put everything in at once and the coin drops, you have no capital left to buy at better prices. With 5 to 10 planned entries, you can build your position gradually and keep cash available for deeper dips.
Your first entry gets you into the market.Your next entries allow you to buy lower.Your final entries give you more flexibility if the market falls further.The goal is to catch good bottom with maximum returns of day trading.The goal is to control your capital and avoid putting everything into one price.
Invest patiently. Keep capital available. Don’t chase the market,you'll get coin on your desired price eventually it's my 5 years experience.
#iamcryptoprince
·
--
Baissier
Mise à jour SOL SOL affiche toujours une faiblesse autour de 96,38. Support = 95,30 et 93,64 Résistance = 97,25 puis 98,74 puis 103,08 Pour l’instant, j’attends 93,60. Je préfère acheter un repli plus solide ou attendre que SOL regagne 97,25 avec confirmation plutôt que courir après le prix actuel. La patience vaut mieux que de forcer une entrée. #iamcryptoprince
Mise à jour SOL

SOL affiche toujours une faiblesse autour de 96,38.

Support = 95,30 et 93,64
Résistance = 97,25 puis 98,74 puis 103,08

Pour l’instant, j’attends 93,60. Je préfère acheter un repli plus solide ou attendre que SOL regagne 97,25 avec confirmation plutôt que courir après le prix actuel. La patience vaut mieux que de forcer une entrée.

#iamcryptoprince
·
--
Baissier
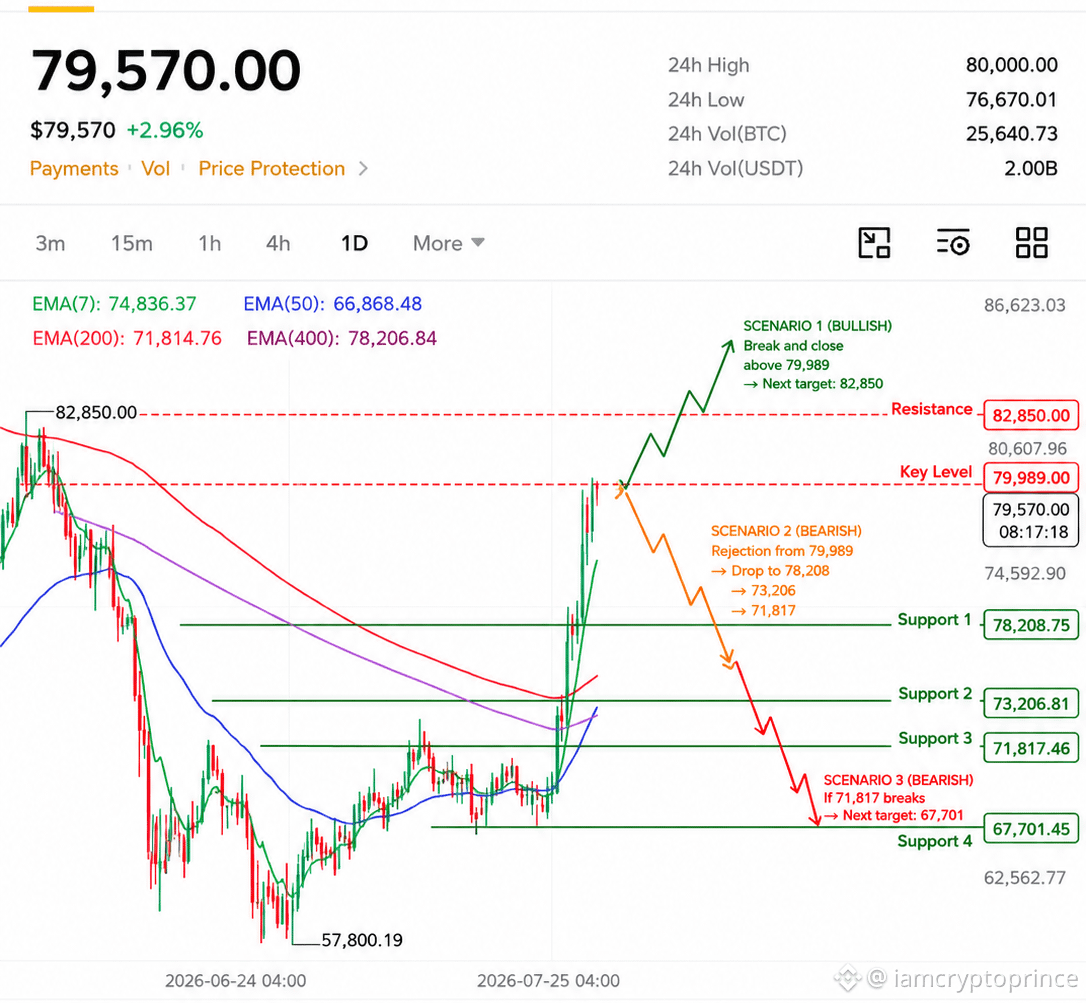
Mise à jour Bitcoin BTC est autour de 79570. La hausse rapide du prix du Bitcoin cette semaine peut facilement être considérée comme un piège haussier. Résistance : 80000 → 82850 Support : 78208 → 73206 → 71817 → 67701 Si $BTC franchit et se maintient au-dessus de 80000, alors 82850 sera la prochaine étape. Mais s’il est rejeté ici, la première correction plus profonde pourrait faire revenir le BTC vers 73206 et 71817. Et si 71817 est aussi franchi, alors 67701 deviendra le prochain support majeur. La réaction autour de 80000–82850 devrait être très importante pour le prochain mouvement. #iamcryptoprince
Mise à jour Bitcoin

BTC est autour de 79570. La hausse rapide du prix du Bitcoin cette semaine peut facilement être considérée comme un piège haussier.

Résistance : 80000 → 82850
Support : 78208 → 73206 → 71817 → 67701

Si $BTC franchit et se maintient au-dessus de 80000, alors 82850 sera la prochaine étape. Mais s’il est rejeté ici, la première correction plus profonde pourrait faire revenir le BTC vers 73206 et 71817. Et si 71817 est aussi franchi, alors 67701 deviendra le prochain support majeur.

La réaction autour de 80000–82850 devrait être très importante pour le prochain mouvement.

#iamcryptoprince
·
--
Haussier
Mise à jour sur SOL et signal Support = 90, puis 88–89 Résistance = 95–97, puis 100–102 Prix d’achat = 89 à 93 Prix de vente = 97 à 102 (selon les conditions du marché) Si BTC reste au-dessus de 75,5 K$, SOL pourrait récupérer vers la résistance et repassera au-dessus de 100. Si BTC le perd à nouveau, $SOL pourrait tester le support inférieur. La tendance n’est pas morte. #iamcryptoprince
Mise à jour sur SOL et signal

Support = 90, puis 88–89
Résistance = 95–97, puis 100–102

Prix d’achat = 89 à 93
Prix de vente = 97 à 102 (selon les conditions du marché)

Si BTC reste au-dessus de 75,5 K$, SOL pourrait récupérer vers la résistance et repassera au-dessus de 100. Si BTC le perd à nouveau, $SOL pourrait tester le support inférieur.

La tendance n’est pas morte.

#iamcryptoprince
·
--
Haussier
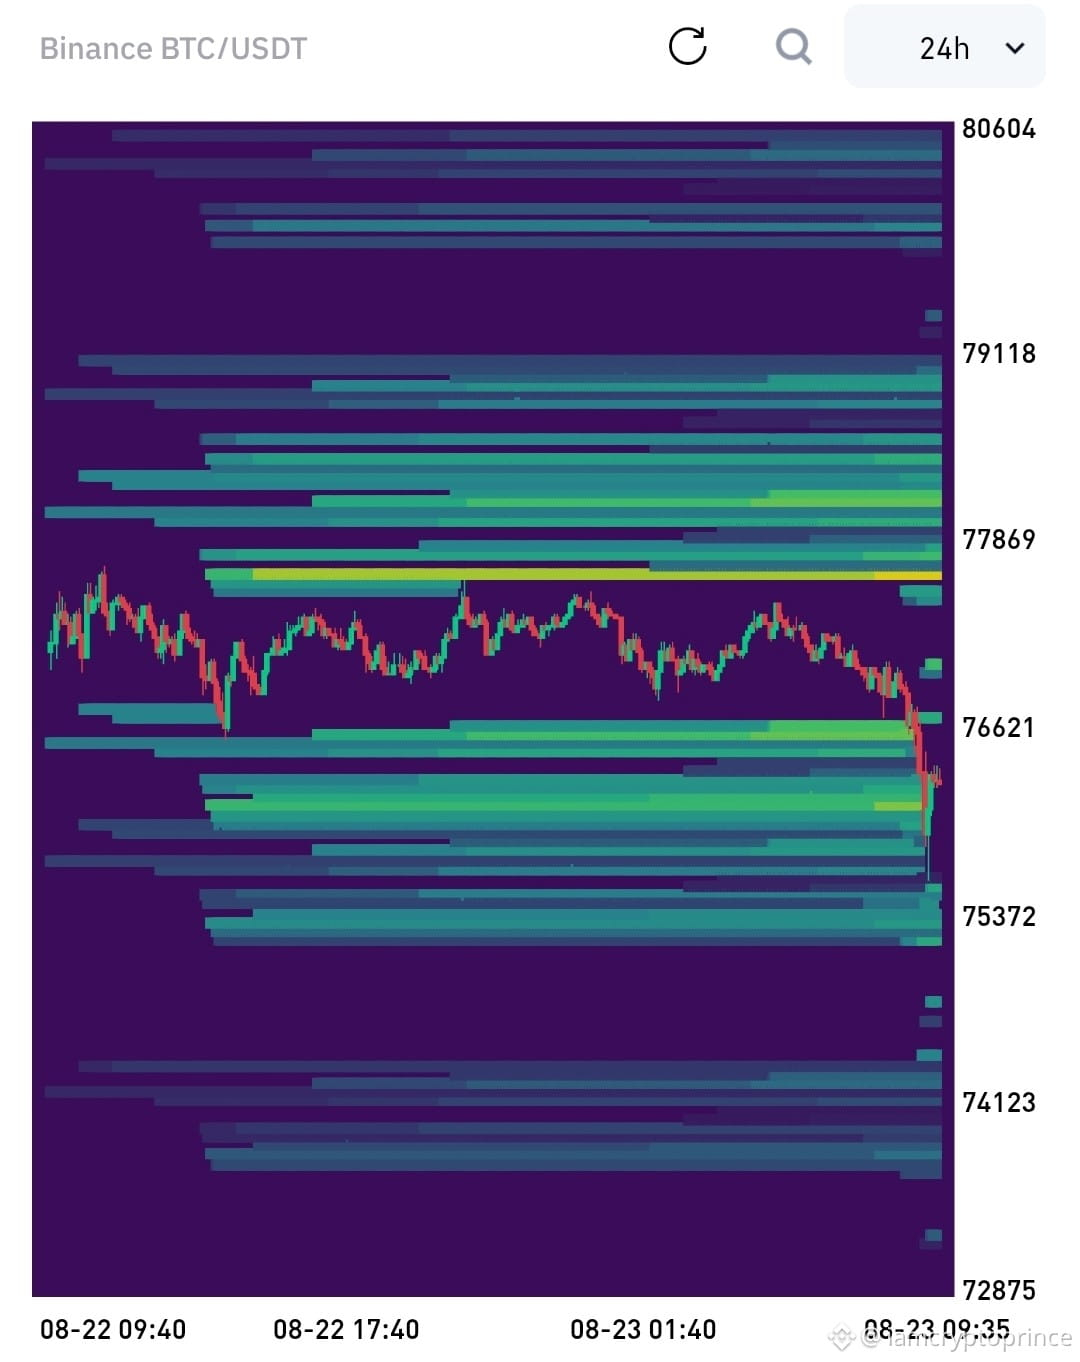
Mise à jour Bitcoin Comme prévu dans mon précédent post $BTC 75,500, la liquidité a été absorbée et le BTC se situe maintenant autour de 76 200 après une baisse. Et ensuite : Si 75 500 tient = rebond probable vers 77 500 → 78 500 Si 75 500 casse fortement = prochain objectif baissier autour de 74 000 → 73 000 Si le BTC reprend 77 500, la liquidité au-dessus de 79 000–80 000 devient l’objectif principal. Le balayage à 75,5K ressemble davantage à une prise de liquidité qu’à un vrai retournement de tendance, et je pense que l’objectif suivant est 77 500. #iamcryptoprince
Mise à jour Bitcoin

Comme prévu dans mon précédent post $BTC 75,500, la liquidité a été absorbée et le BTC se situe maintenant autour de 76 200 après une baisse.

Et ensuite :

Si 75 500 tient = rebond probable vers 77 500 → 78 500

Si 75 500 casse fortement = prochain objectif baissier autour de 74 000 → 73 000

Si le BTC reprend 77 500, la liquidité au-dessus de 79 000–80 000 devient l’objectif principal.

Le balayage à 75,5K ressemble davantage à une prise de liquidité qu’à un vrai retournement de tendance, et je pense que l’objectif suivant est 77 500.

#iamcryptoprince
·
--
Baissier
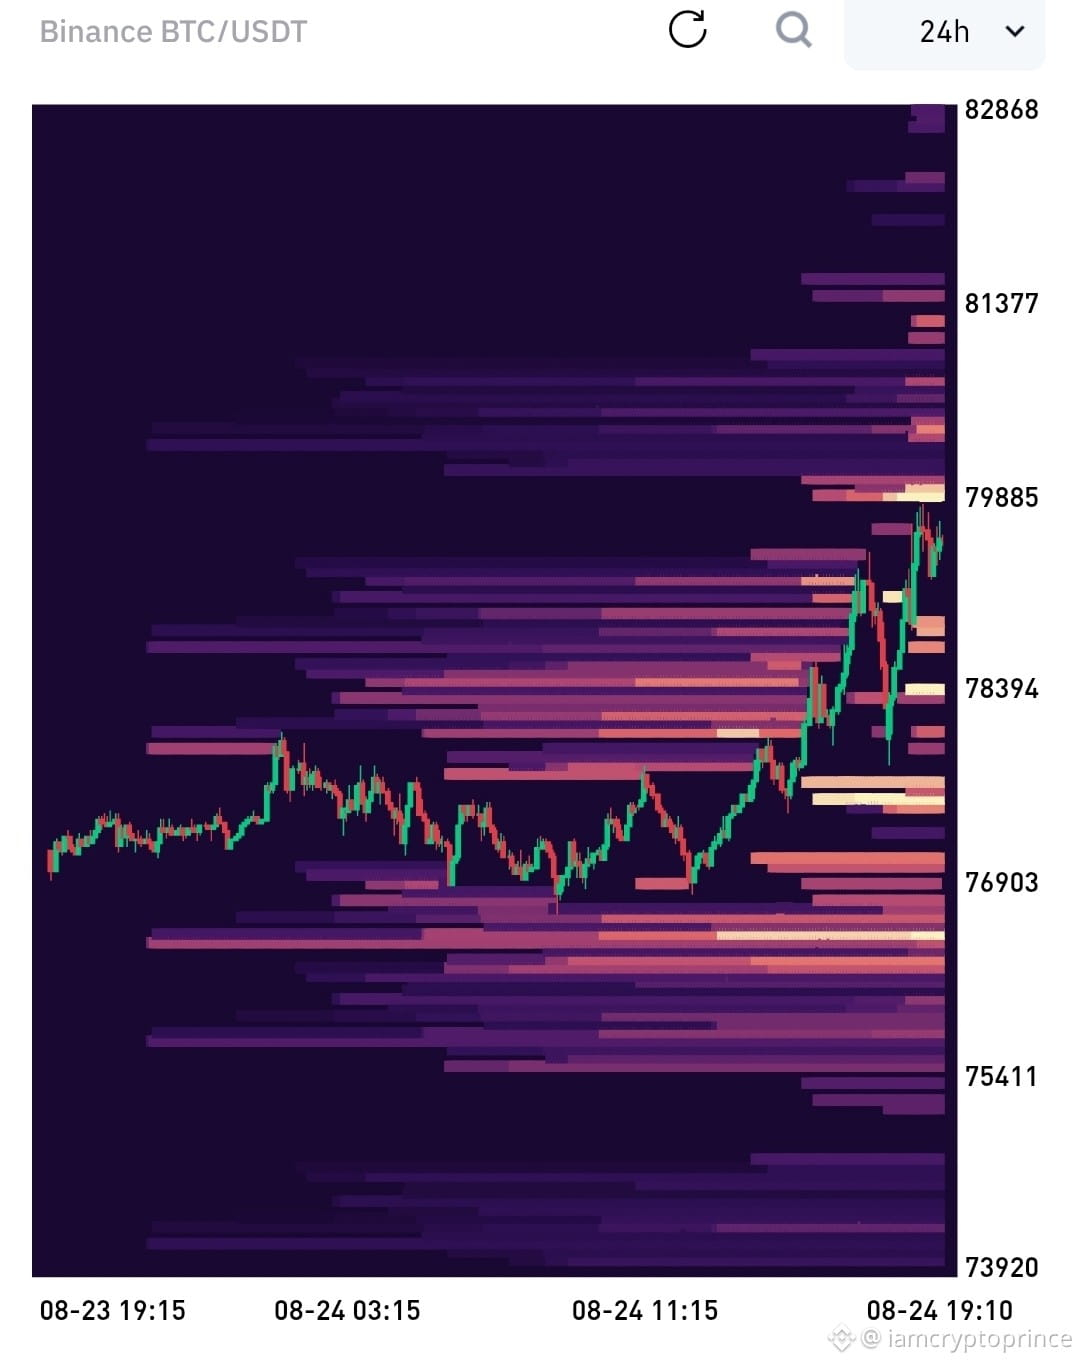
Mise à jour sur Bitcoin $BTC est monté presque sans interruption pendant les 5 derniers jours, donc cette correction était attendue. Mais franchement, j’ai l’impression que la correction n’est peut-être pas encore assez profonde. Je surveille d’abord la zone 76K–75K. Si elle casse, la prochaine zone importante pourrait être 73K–74K. Une baisse vers 70K–72K représenterait un reset beaucoup plus fort. Si le BTC se maintient autour de 77K et remonte rapidement au-dessus de 79K–80K, alors il se pourrait que ce ne soit qu’une petite pause. Personnellement, je préférerais que le BTC fasse une correction correcte, se stabilise, puis reparte à la hausse plutôt que de monter directement. #iamcryptoprince
Mise à jour sur Bitcoin

$BTC est monté presque sans interruption pendant les 5 derniers jours, donc cette correction était attendue. Mais franchement, j’ai l’impression que la correction n’est peut-être pas encore assez profonde.

Je surveille d’abord la zone 76K–75K. Si elle casse, la prochaine zone importante pourrait être 73K–74K. Une baisse vers 70K–72K représenterait un reset beaucoup plus fort.

Si le BTC se maintient autour de 77K et remonte rapidement au-dessus de 79K–80K, alors il se pourrait que ce ne soit qu’une petite pause.

Personnellement, je préférerais que le BTC fasse une correction correcte, se stabilise, puis reparte à la hausse plutôt que de monter directement.

#iamcryptoprince
Article
Voir la traduction
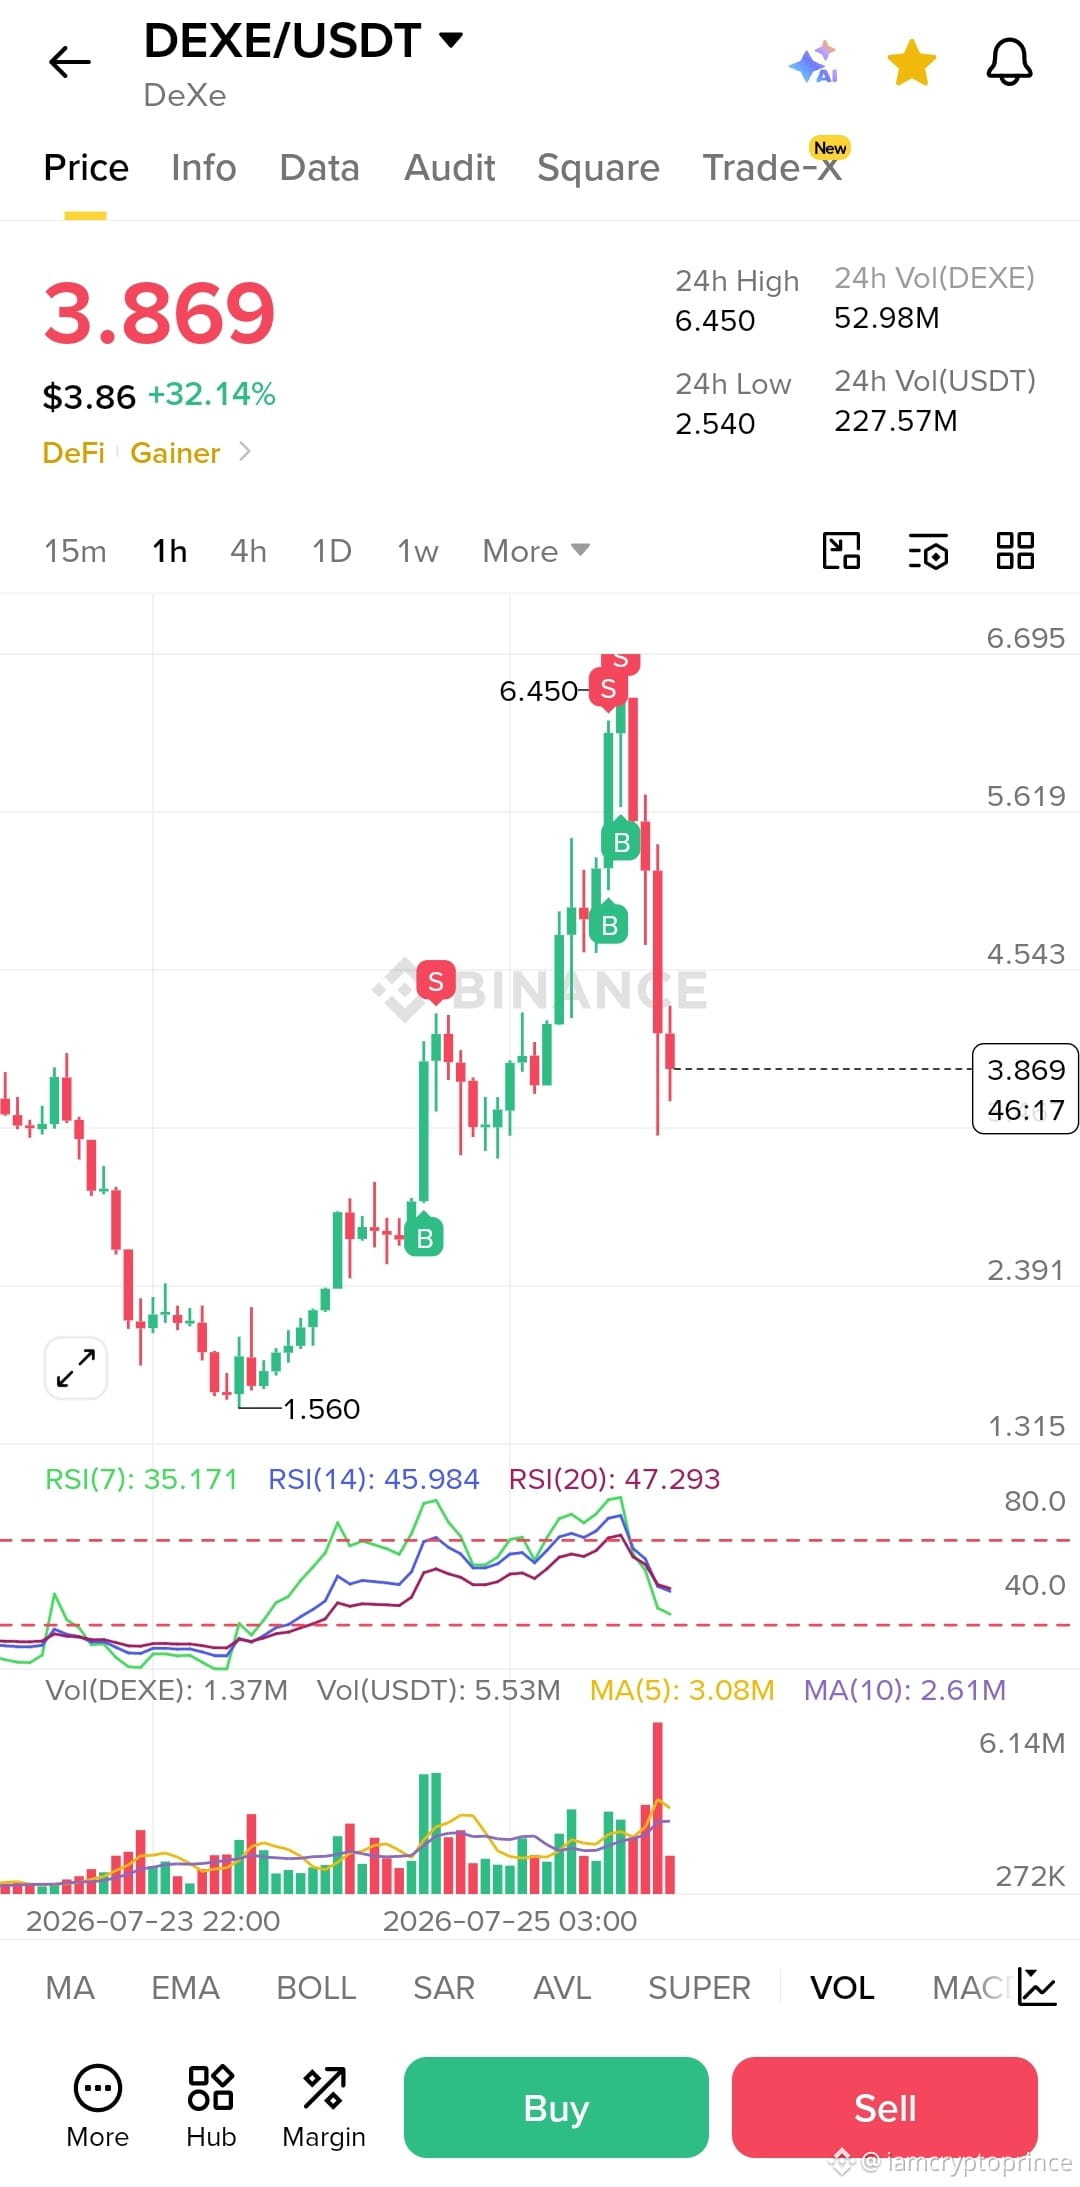
Learn 11 indicators1st = RSI Rsi shows strength of price movement. Setting Set RSI to 7 14 20 (for all charts) Signals : (14 and 20 is for understanding and longterm.RSI 7 is enough for daytrading) 1 : Short trade 3 and 15 mint charts 2 : Med trade 1 hour 4 hour 1 day charts 3 : Long trade week month charts Use : Buy near 7 in RSI 7 and sell near 70 to 90 or as per market situation. 2nd = EMA/MA EMA shows trend direction. Setting : Set EMA or MA to 7 50 200 400 (for all charts) Signals : (Usually 7 and 50 are enough for understanding,daytrading and mid term trading,check if candles are below or above,if below EMA then market may go down.If above then market may go up) Use : 1 : Short trade 7 2 : Med trade 50 3 : Long trade 200 400 3rd = Boll BOLL is a volatility indicator and It has 3 lines. Lines : Middle line: moving average (usually 20 SMA) Upper band: middle + volatility Lower band: middle − volatility Use : Price near upper band → overbought (may drop) Price near lower band → oversold (may rise) Bands widen → high volatility Bands tight → market is calm, breakout coming Used for spotting trend strength + entry/exit timing. Settings (Use default for all type of charts. Length: 20 Source: Close Std Dev: 2 4rth = SAR SAR shows trend direction and it's dots appear above or below price Signals : Dots below price → uptrend (buy pressure) Dots above price → downtrend (sell pressure) Dot flips → possible trend change Use: Good for entry/exit timing, especially in trending markets. Settings (Use default for all charts) Step: 0.02 Maximum: 0.2 5th = AVL AVL shows average trading volume over time and helps confirm strength of price moves. Signals : Volume above line = real movement, below = weak movement. Breakout + high volume above AVL → strong buy signal Setting (Use default for all charts) 6th = Super Super shows trend direction using ATR (volatility) Signals : Line below price (green) → BUY trend Line above price (red) → SELL trend Flip = possible trend change Use : Follow trend only.Its good for entry/exit in strong moves but avoid in sideways market. Setting (Use default) 7th = MACD MACD shows momentum + trend strength Main parts : 1 : MACD line 2 : Signal line 3 : Histogram (bars) Signals: MACD crosses above signal → BUY MACD crosses below signal → SELL Histogram growing → strong trend Histogram shrinking → weak trend / reversal coming Settings (Use default): Fast Length: 12 Slow Length: 26 Signal Smoothing: 9 8th = KDJ KDJ shows overbought / oversold + momentum Lines : K line = fast D line = slow J line = strongest signal (moves fastest) Signals : K crosses above D → BUY K crosses below D → SELL J above 100 → overbought J below 0 → oversold Use : Good for short-term entries, but avoid alone in sideways market. Setting (Use default) K period: 9 D period: 3 J period: 3 9th = OBV OBV shows volume flow (buying vs selling pressure) Signals : OBV rising → buying pressure (bullish) OBV falling → selling pressure (bearish) Price up + OBV up → strong trend Price up + OBV flat/down → weak move (fake breakout risk) Use : Confirm trend strength,not for entry alone. Setting (Use default) 10th = WR Williams %R shows overbought / oversold levels (momentum) Signals : Above -20 → overbought (sell zone) Below -80 → oversold (buy zone) Moving up from -80 → possible buy Moving down from -20 → possible sell Settings (Use default) Period: 14 11th = Stockrsi Stockrsi shows overbought / oversold condition. Signals : Above 70 → overbought (sell zone) Below 30 → oversold (buy zone) 50 line → trend strength (above = bullish, below = bearish) Use : Best for confirming entries, not alone for trading. Setting (Use default) Period: 14 If anything is missing inform me and i 'll add it.thank you #iamcryptoprince

Learn 11 indicators

1st = RSI
Rsi shows strength of price movement.
Setting
Set RSI to
7
14
20
(for all charts)
Signals :
(14 and 20 is for understanding and longterm.RSI 7 is enough for daytrading)
1 : Short trade 3 and 15 mint charts
2 : Med trade 1 hour 4 hour 1 day charts
3 : Long trade week month charts
Use :
Buy near 7 in RSI 7 and sell near 70 to 90 or as per market situation.
2nd = EMA/MA
EMA shows trend direction.
Setting :
Set EMA or MA to
7
50
200
400
(for all charts)
Signals :
(Usually 7 and 50 are enough for understanding,daytrading and mid term trading,check if candles are below or above,if below EMA then market may go down.If above then market may go up)
Use :
1 : Short trade 7
2 : Med trade 50
3 : Long trade 200 400
3rd = Boll
BOLL is a volatility indicator and It has 3 lines.
Lines :
Middle line: moving average (usually 20 SMA)
Upper band: middle + volatility
Lower band: middle − volatility
Use :
Price near upper band → overbought (may drop)
Price near lower band → oversold (may rise)
Bands widen → high volatility
Bands tight → market is calm, breakout coming
Used for spotting trend strength + entry/exit timing.
Settings (Use default for all type of charts.
Length: 20
Source: Close
Std Dev: 2
4rth = SAR
SAR shows trend direction and it's dots appear above or below price
Signals :
Dots below price → uptrend (buy pressure)
Dots above price → downtrend (sell pressure)
Dot flips → possible trend change
Use:
Good for entry/exit timing, especially in trending markets.
Settings (Use default for all charts)
Step: 0.02
Maximum: 0.2
5th = AVL
AVL shows average trading volume over time and helps confirm strength of price moves.
Signals :
Volume above line = real movement, below = weak movement.
Breakout + high volume above AVL → strong buy signal
Setting (Use default for all charts)
6th = Super
Super shows trend direction using ATR (volatility)
Signals :
Line below price (green) → BUY trend
Line above price (red) → SELL trend
Flip = possible trend change
Use :
Follow trend only.Its good for entry/exit in strong moves but avoid in sideways market.
Setting (Use default)
7th = MACD
MACD shows momentum + trend strength
Main parts :
1 : MACD line
2 : Signal line
3 : Histogram (bars)
Signals:
MACD crosses above signal → BUY
MACD crosses below signal → SELL
Histogram growing → strong trend
Histogram shrinking → weak trend / reversal coming
Settings (Use default):
Fast Length: 12
Slow Length: 26
Signal Smoothing: 9
8th = KDJ
KDJ shows overbought / oversold + momentum
Lines :
K line = fast
D line = slow
J line = strongest signal (moves fastest)
Signals :
K crosses above D → BUY
K crosses below D → SELL
J above 100 → overbought
J below 0 → oversold
Use :
Good for short-term entries, but avoid alone in sideways market.
Setting (Use default)
K period: 9
D period: 3
J period: 3
9th = OBV
OBV shows volume flow (buying vs selling pressure)
Signals :
OBV rising → buying pressure (bullish)
OBV falling → selling pressure (bearish)
Price up + OBV up → strong trend
Price up + OBV flat/down → weak move (fake breakout risk)
Use :
Confirm trend strength,not for entry alone.
Setting (Use default)
10th = WR
Williams %R shows overbought / oversold levels (momentum)
Signals :
Above -20 → overbought (sell zone)
Below -80 → oversold (buy zone)
Moving up from -80 → possible buy
Moving down from -20 → possible sell
Settings (Use default)
Period: 14
11th = Stockrsi
Stockrsi shows overbought / oversold condition.
Signals :
Above 70 → overbought (sell zone)
Below 30 → oversold (buy zone)
50 line → trend strength (above = bullish, below = bearish)
Use :
Best for confirming entries, not alone for trading.
Setting (Use default)
Period: 14
If anything is missing inform me and i 'll add it.thank you
#iamcryptoprince
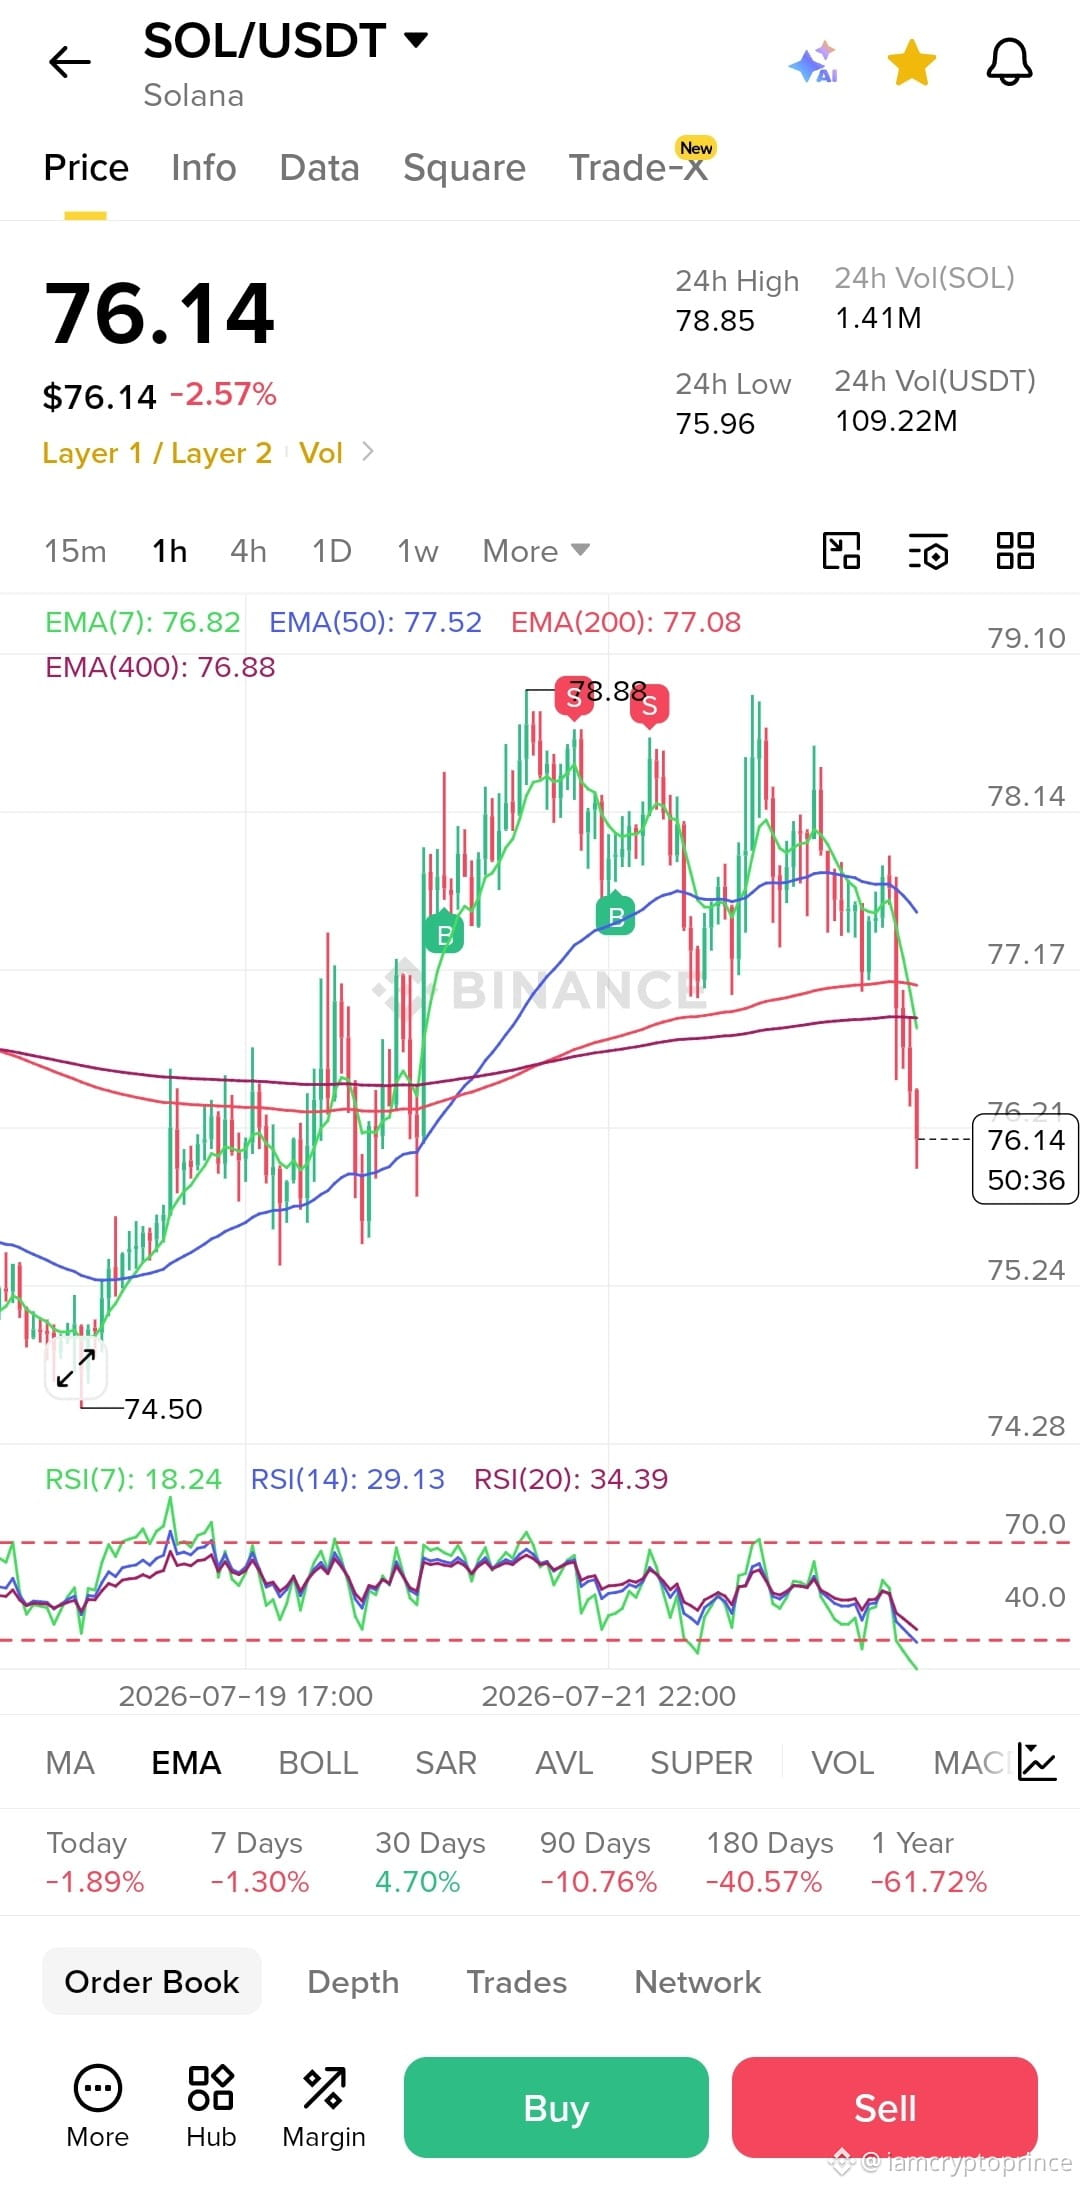
$SOL Sol est actuellement baissier et il se situe entre le support et la résistance. Supports : 1 = 76,50 $ — support immédiat (zone actuelle) 2 = 75,20–75,50 $ — support plus solide / zone d’achat possible 3 = 74,50 $ — support majeur Résistance : 1 = 77,10–77,60 $ — première résistance (à récupérer) 2 = 78,50–78,80 $ — résistance solide / plus haut récent Objectifs achat/vente : Entrée 1 (plus prudent) : 75,20–75,50 $ après une confirmation du rebond Objectifs de vente : 77,60 $ (premier objectif) 78,50–78,80 $ (objectif principal) Entrée 2 (cassure) : Au-dessus de 77,60–77,80 Objectifs de vente : 78,50 $ 79,50–80,00 $ si l’élan se poursuit Au moment où je le publie, il a déjà cassé son support de 76,50, donc j’attends maintenant l’objectif suivant. J’espère que cela vous aide #iamcryptoprince
$SOL Sol est actuellement baissier et il se situe entre le support et la résistance.

Supports :

1 = 76,50 $ — support immédiat (zone actuelle)

2 = 75,20–75,50 $ — support plus solide / zone d’achat possible

3 = 74,50 $ — support majeur

Résistance :

1 = 77,10–77,60 $ — première résistance (à récupérer)

2 = 78,50–78,80 $ — résistance solide / plus haut récent

Objectifs achat/vente :

Entrée 1 (plus prudent) :

75,20–75,50 $ après une confirmation du rebond

Objectifs de vente :

77,60 $ (premier objectif)

78,50–78,80 $ (objectif principal)

Entrée 2 (cassure) :

Au-dessus de 77,60–77,80

Objectifs de vente :

78,50 $

79,50–80,00 $ si l’élan se poursuit

Au moment où je le publie, il a déjà cassé son support de 76,50, donc j’attends maintenant l’objectif suivant. J’espère que cela vous aide
#iamcryptoprince
·
--
Baissier
Grosse actualité du marché cette semaine : 29 juillet – décision de la Réserve fédérale américaine sur les taux d’intérêt. 30 juillet – données sur l’inflation et le PIB aux États-Unis. 31 juillet – données sur l’emploi et la confiance des consommateurs. Cette semaine pourrait entraîner de forts mouvements sur les cryptomonnaies, alors prenez vos positions en gardant ces dates à l’esprit. #iamcryptoprince
Grosse actualité du marché cette semaine :

29 juillet – décision de la Réserve fédérale américaine sur les taux d’intérêt.

30 juillet – données sur l’inflation et le PIB aux États-Unis.

31 juillet – données sur l’emploi et la confiance des consommateurs.

Cette semaine pourrait entraîner de forts mouvements sur les cryptomonnaies, alors prenez vos positions en gardant ces dates à l’esprit.
#iamcryptoprince
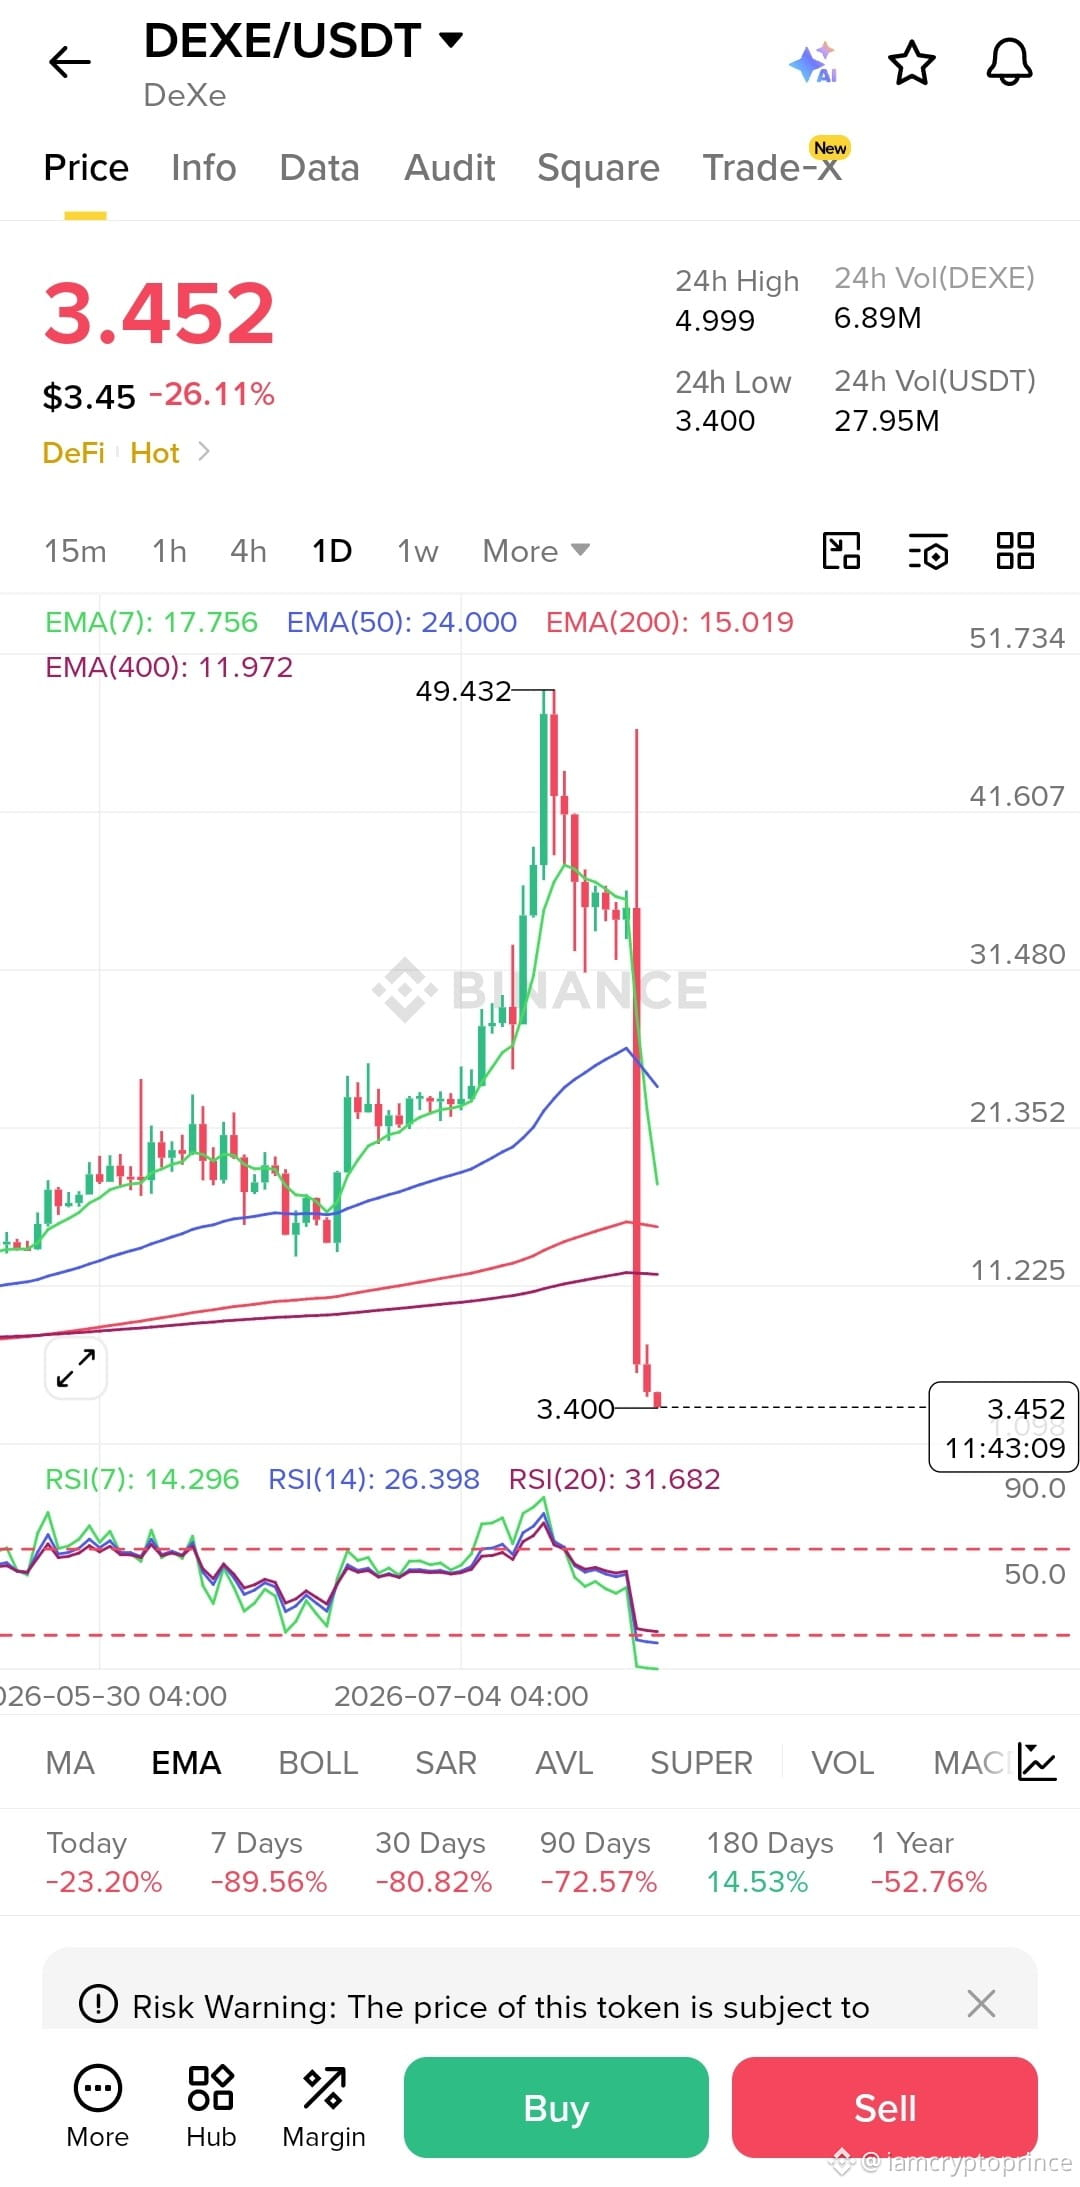
$DEXE DEXE Crash : que doivent faire les détenteurs ensuite ? Le récent crash de DEXE a surpris de nombreux traders. Qu’est-ce qui s’est probablement passé ? Le crash semble être dû à des baleines prenant leurs profits après un rallye de plus de 20× en quelques mois, ce qui aurait déclenché la première phase de vente. La pression vendeuse a provoqué la panique, des liquidations longues et a accéléré la baisse. À ce jour, aucune preuve confirmée ne fait état d’un piratage ou d’une défaillance de la blockchain. Situation du marché : 1 - Le prix est passé d’environ 46,93 à 3,50, perdant plus de 90 %. 2 - Toutes les principales EMA (7, 50, 200, 400) se trouvent au-dessus du prix, ce qui indique une tendance baissière. 3 - Le RSI est proche de niveaux de survente, mais la survente ne garantit pas un redressement immédiat. 4 - Le mouvement actuel en range autour des plus bas montre que les acheteurs restent faibles. Pour les détenteurs en perte : 1 = Évitez la vente en panique sous le coup de l’émotion. 2 = Ne poursuivez pas chaque petit rebond. 3 = Ne faites pas de DCA sans confirmation. Attendez une base correcte avec des plus hauts plus élevés et des plus bas plus élevés. Un rebond à court terme est possible, mais acheter maintenant comporte un risque élevé tant que le graphique ne montre pas des signes de reprise et que la confiance ne revient pas. #iamcryptoprince
$DEXE DEXE Crash : que doivent faire les détenteurs ensuite ?

Le récent crash de DEXE a surpris de nombreux traders. Qu’est-ce qui s’est probablement passé ?

Le crash semble être dû à des baleines prenant leurs profits après un rallye de plus de 20× en quelques mois, ce qui aurait déclenché la première phase de vente. La pression vendeuse a provoqué la panique, des liquidations longues et a accéléré la baisse.
À ce jour, aucune preuve confirmée ne fait état d’un piratage ou d’une défaillance de la blockchain.

Situation du marché :

1 - Le prix est passé d’environ 46,93 à 3,50, perdant plus de 90 %.
2 - Toutes les principales EMA (7, 50, 200, 400) se trouvent au-dessus du prix, ce qui indique une tendance baissière.
3 - Le RSI est proche de niveaux de survente, mais la survente ne garantit pas un redressement immédiat.
4 - Le mouvement actuel en range autour des plus bas montre que les acheteurs restent faibles.

Pour les détenteurs en perte :

1 = Évitez la vente en panique sous le coup de l’émotion.
2 = Ne poursuivez pas chaque petit rebond.
3 = Ne faites pas de DCA sans confirmation. Attendez une base correcte avec des plus hauts plus élevés et des plus bas plus élevés.

Un rebond à court terme est possible, mais acheter maintenant comporte un risque élevé tant que le graphique ne montre pas des signes de reprise et que la confiance ne revient pas.
#iamcryptoprince
Connectez-vous pour découvrir plus de contenu
Rejoignez la communauté mondiale des adeptes de cryptomonnaies sur Binance Square
⚡️ Suviez les dernières informations importantes sur les cryptomonnaies.
💬 Jugé digne de confiance par la plus grande plateforme d’échange de cryptomonnaies au monde.
👍 Découvrez les connaissances que partagent les créateurs vérifiés.
Adresse e-mail/Nº de téléphone