

iamcryptoprince
107 Publications

iamcryptoprince
Signaler
Bloquer l’utilisateur
Let's trade
Ouvert au trading
Trade régulièrement
4.6 mois
0 Suivis
12 Abonnés
24 J’aime
Publications
Portefeuille
Tous
Citations
Vidéos
Voir la traduction
Because of this type of mind set i lost 2300 dollars.
#iamcryptoprince
Because of this type of mind set i lost 2300 dollars.
#iamcryptoprince
#iamcryptoprince

HK1535
·
--
Que le prix baisse ou monte, je continuerai d’acheter du LUNC jusqu’à ma mort.
Soit le plus bas, soit tout en haut.
Pour toujours #lunc
Soit le plus bas, soit tout en haut.
Pour toujours #lunc
65
Voir la traduction
Tired of these creators who keep posting, “I’m gonna be a millionaire when this coin hits $1.”
Wake up,it’s never gonna happen.
#iamcryptoprince
Tired of these creators who keep posting, “I’m gonna be a millionaire when this coin hits $1.”
Wake up,it’s never gonna happen.
#iamcryptoprince
Wake up,it’s never gonna happen.
#iamcryptoprince
1
2
Voir la traduction
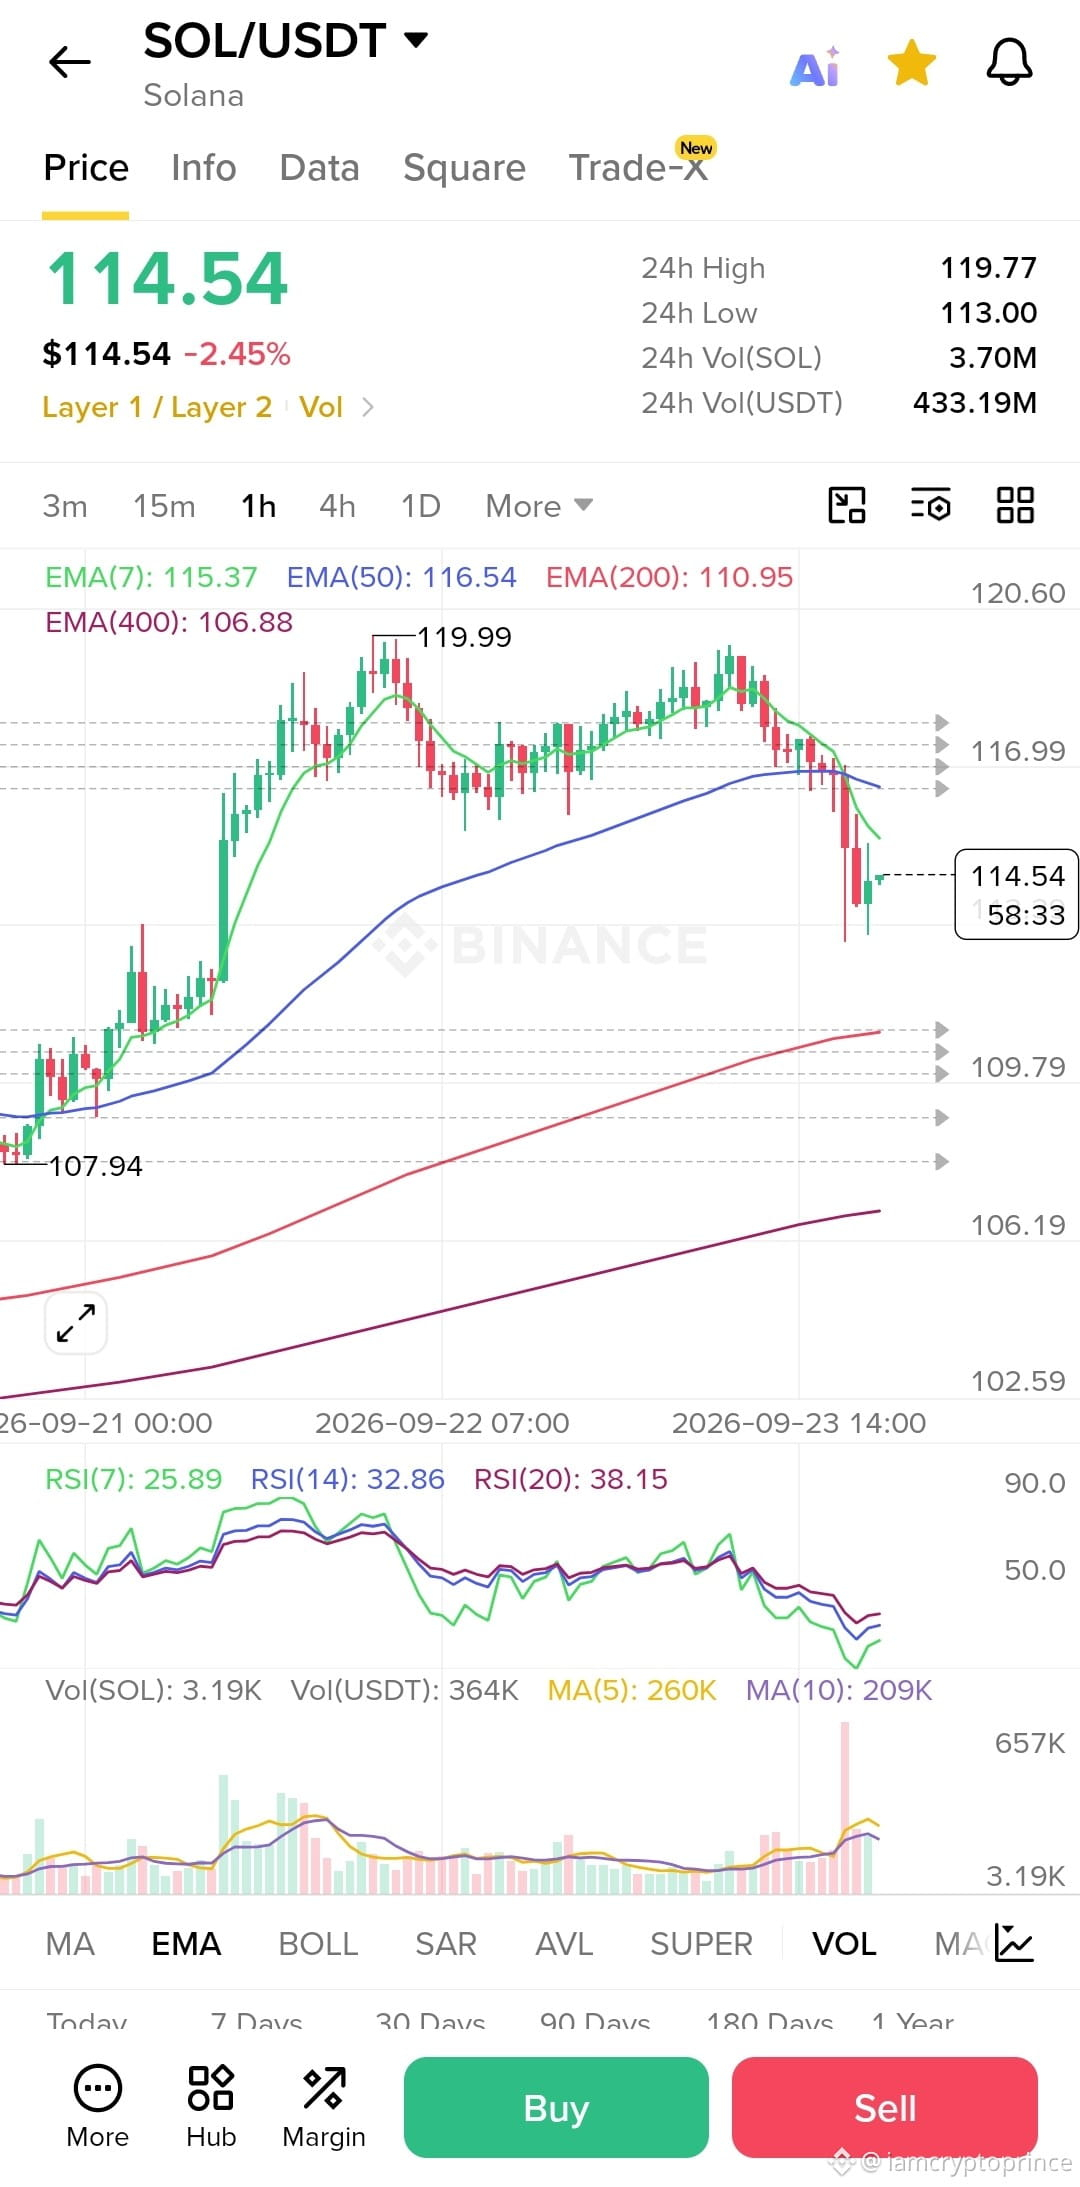
My chart and indicators setting if you needed.
#iamcryptoprince
My chart and indicators setting if you needed.
#iamcryptoprince
#iamcryptoprince
72
25
Voir la traduction
Binance Square wasn’t like this 2 or 3 years ago. Now, it’s mostly girls posting their pictures for cheap fame. Binance Square used to be focused on trading, and I really miss that!
#iamcryptoprince
Binance Square wasn’t like this 2 or 3 years ago. Now, it’s mostly girls posting their pictures for cheap fame. Binance Square used to be focused on trading, and I really miss that!
#iamcryptoprince
#iamcryptoprince
47
Voir la traduction
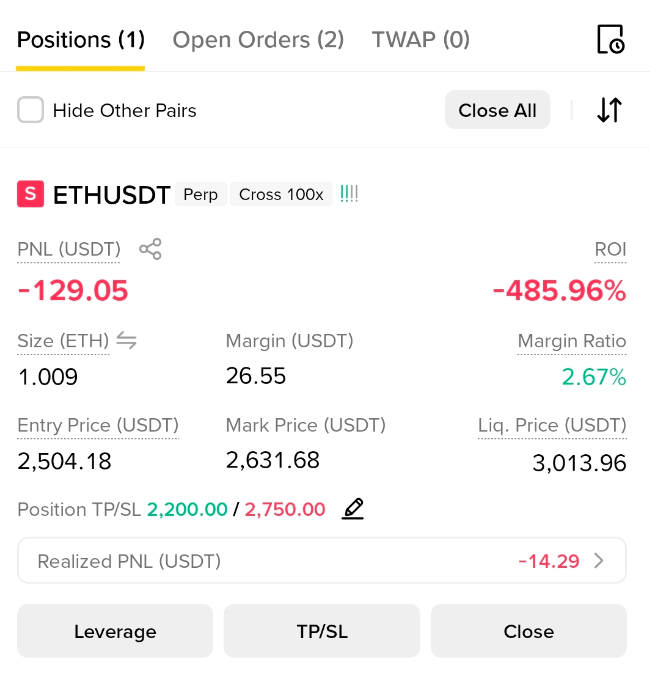
I wonder why you guys never ask for guidance before taking a trade?
I wonder why you guys never ask for guidance before taking a trade?

Crypto_Guru12
·
--
s’il vous plaît, guidez-moi $ETH 😭😭
68
86
Voir la traduction
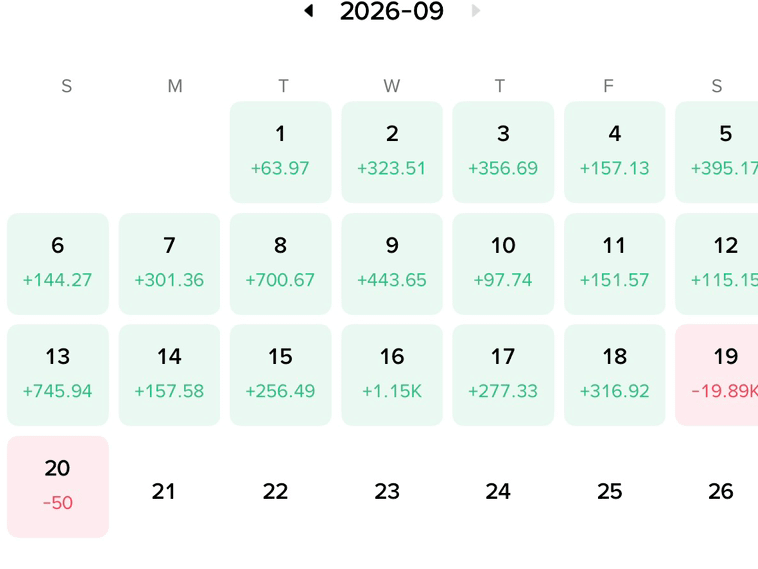
You guys have 20k and still can't trade safely?
You guys have 20k and still can't trade safely?

Scalper IR
·
--
Je reviendrai après trois ans. Restez avec nous ! Vous pouvez me contacter à tout moment, et je serai heureux de vous conseiller. Pour l’instant, je veux simplement prendre une pause. Au revoir cypto …..
40
48
Voir la traduction
Less profit is still profit.
#iamcryptoprince
Less profit is still profit.
#iamcryptoprince
#iamcryptoprince
81
Zec me fait penser à Luna, de 15 dollars à 1500 dollars, incroyable.
#iamcryptoprince
Zec me fait penser à Luna, de 15 dollars à 1500 dollars, incroyable.
#iamcryptoprince
#iamcryptoprince
170
Voir la traduction
I see many posts about cross-margin futures trading every day, but I never give them any suggestions. I simply hate cross margin.
#iamcryptoprince
I see many posts about cross-margin futures trading every day, but I never give them any suggestions. I simply hate cross margin.
#iamcryptoprince
#iamcryptoprince
1
1
Voir la traduction
Trading charts
For short term trades :
3 minutes , 15 minutes , 1 hour
For long term trades :
1 hour , 4 hours , 1 day chart
For holders :
1 day , 1 week , 1 month
Also 1 minute is for understanding 3 minutes chart,3 minutes is to understabd the details of 15 minutes chart and goes on further.
#iamcryptoprince
Trading charts
For short term trades :
3 minutes , 15 minutes , 1 hour
For long term trades :
1 hour , 4 hours , 1 day chart
For holders :
1 day , 1 week , 1 month
Also 1 minute is for understanding 3 minutes chart,3 minutes is to understabd the details of 15 minutes chart and goes on further.
#iamcryptoprince
For short term trades :
3 minutes , 15 minutes , 1 hour
For long term trades :
1 hour , 4 hours , 1 day chart
For holders :
1 day , 1 week , 1 month
Also 1 minute is for understanding 3 minutes chart,3 minutes is to understabd the details of 15 minutes chart and goes on further.
#iamcryptoprince
3
Voir la traduction
Instead of adding more trades to your futures position, add margin, sit back, and relax.
#iamcryptoprince
Instead of adding more trades to your futures position, add margin, sit back, and relax.
#iamcryptoprince
#iamcryptoprince
23
Article
Voir la traduction
Future trade setupMost people who start trading jump into futures trading without a strategy. 80% of them don’t know what their liquidation price will be if they open a short or long at a certain price. They only find out after opening the trade. Then they start managing it by adding more orders or margin. That’s not a strategy; that’s blind gambling.
Binance gives you the option to demo trade, so use it and learn properly. In this article, I’m going to show you how you should set up your futures trades.
Rules :
Never open cross trade,never !Use 3000% to 5000% of your initial trade.310 to 510 reserves for 1 coin.Leverage doesn't matter,margin matters.Should never need stop loss.Less profit is better than getting stuck.
Explanation
For example we open a short trade with 10 dollars on sol coin and use 50x leverage. On sol coin with 50x leverage you get 1 dollar liquid price ratio for long or short. As your liquid price is near you don't add another order instead you add margin of 100 dollars and liquid price moves 22 dollars further . Add 100 more and liquid price moves another 22 dollars. Use 300 dollars margin for 10 dollars trade minimum. Sounds riddiculous but it works well and you 'll understand when you try.
Short trade
Entry price : 108.65
Liquid price : 109.68
Add margin to reduce liquid price
100 dollars = liquid price moves to 131.20
100 dollars = liquid price moves to 152.73
100 dollars = liquid price moves to 174.25
Long trade
Entry price : 108.84
Liquid price : 107.65
Add margin to reduce liquid price
100 dollars = liquid price moves to 85.69
100 dollars = liquid price moves to 63.73
100 dollars = liquid price moves to 41.77
Profit ratio
If it goes 1 dollar up or down gives you profit or loss of 4.60 dollars!
Conclusion
For each trade you need 3000% to 5000% margin so it's like 310 to 510 dollars for each coin. You 'll never get liquidated. I posted pictures too you can check.
What if?
What if you use 20 dollars? You can but you ll need to double the margin if you double initial trade money so for 20 dollars trade you 'll need 600 dollars for that same 22 dollars liquid price rule. For 30 dollars trade you ll need 900 dollars margin. Same thing happens if you increase or decrease your leverage too. The less money and leverage you use in your trade the less margin you need to save it.
If any questions please comment. Thank you for your time. Check pictures below.
#iamcryptoprince
Future trade setup
Most people who start trading jump into futures trading without a strategy. 80% of them don’t know what their liquidation price will be if they open a short or long at a certain price. They only find out after opening the trade. Then they start managing it by adding more orders or margin. That’s not a strategy; that’s blind gambling.
Binance gives you the option to demo trade, so use it and learn properly. In this article, I’m going to show you how you should set up your futures trades.
Rules :
Never open cross trade,never !Use 3000% to 5000% of your initial trade.310 to 510 reserves for 1 coin.Leverage doesn't matter,margin matters.Should never need stop loss.Less profit is better than getting stuck.
Explanation
For example we open a short trade with 10 dollars on sol coin and use 50x leverage. On sol coin with 50x leverage you get 1 dollar liquid price ratio for long or short. As your liquid price is near you don't add another order instead you add margin of 100 dollars and liquid price moves 22 dollars further . Add 100 more and liquid price moves another 22 dollars. Use 300 dollars margin for 10 dollars trade minimum. Sounds riddiculous but it works well and you 'll understand when you try.
Short trade
Entry price : 108.65
Liquid price : 109.68
Add margin to reduce liquid price
100 dollars = liquid price moves to 131.20
100 dollars = liquid price moves to 152.73
100 dollars = liquid price moves to 174.25
Long trade
Entry price : 108.84
Liquid price : 107.65
Add margin to reduce liquid price
100 dollars = liquid price moves to 85.69
100 dollars = liquid price moves to 63.73
100 dollars = liquid price moves to 41.77
Profit ratio
If it goes 1 dollar up or down gives you profit or loss of 4.60 dollars!
Conclusion
For each trade you need 3000% to 5000% margin so it's like 310 to 510 dollars for each coin. You 'll never get liquidated. I posted pictures too you can check.
What if?
What if you use 20 dollars? You can but you ll need to double the margin if you double initial trade money so for 20 dollars trade you 'll need 600 dollars for that same 22 dollars liquid price rule. For 30 dollars trade you ll need 900 dollars margin. Same thing happens if you increase or decrease your leverage too. The less money and leverage you use in your trade the less margin you need to save it.
If any questions please comment. Thank you for your time. Check pictures below.
#iamcryptoprince
Binance gives you the option to demo trade, so use it and learn properly. In this article, I’m going to show you how you should set up your futures trades.
Rules :
Never open cross trade,never !Use 3000% to 5000% of your initial trade.310 to 510 reserves for 1 coin.Leverage doesn't matter,margin matters.Should never need stop loss.Less profit is better than getting stuck.
Explanation
For example we open a short trade with 10 dollars on sol coin and use 50x leverage. On sol coin with 50x leverage you get 1 dollar liquid price ratio for long or short. As your liquid price is near you don't add another order instead you add margin of 100 dollars and liquid price moves 22 dollars further . Add 100 more and liquid price moves another 22 dollars. Use 300 dollars margin for 10 dollars trade minimum. Sounds riddiculous but it works well and you 'll understand when you try.
Short trade
Entry price : 108.65
Liquid price : 109.68
Add margin to reduce liquid price
100 dollars = liquid price moves to 131.20
100 dollars = liquid price moves to 152.73
100 dollars = liquid price moves to 174.25
Long trade
Entry price : 108.84
Liquid price : 107.65
Add margin to reduce liquid price
100 dollars = liquid price moves to 85.69
100 dollars = liquid price moves to 63.73
100 dollars = liquid price moves to 41.77
Profit ratio
If it goes 1 dollar up or down gives you profit or loss of 4.60 dollars!
Conclusion
For each trade you need 3000% to 5000% margin so it's like 310 to 510 dollars for each coin. You 'll never get liquidated. I posted pictures too you can check.
What if?
What if you use 20 dollars? You can but you ll need to double the margin if you double initial trade money so for 20 dollars trade you 'll need 600 dollars for that same 22 dollars liquid price rule. For 30 dollars trade you ll need 900 dollars margin. Same thing happens if you increase or decrease your leverage too. The less money and leverage you use in your trade the less margin you need to save it.
If any questions please comment. Thank you for your time. Check pictures below.
#iamcryptoprince
1
1
92
·
--
Haussier
J’ai déjà eu 11000 abonnés sur mon ancien compte Binance, mais j’ai dû le supprimer et en créer un nouveau pour une raison quelconque. Puis-je tout récupérer ?
#iamcryptoprince
J’ai déjà eu 11000 abonnés sur mon ancien compte Binance, mais j’ai dû le supprimer et en créer un nouveau pour une raison quelconque. Puis-je tout récupérer ?
#iamcryptoprince
#iamcryptoprince
1
31
·
--
Haussier
Signal Sol
Support : 100–102
Résistance : 110
Prochaine résistance : 114–115
Achat = 102,25 à 103,50
Vente = 110,20
Si $SOL perce 111 alors vendre en conséquence jusqu’à la prochaine résistance.
#iamcryptoprince
{spot}(SOLUSDT)
Signal Sol
Support : 100–102
Résistance : 110
Prochaine résistance : 114–115
Achat = 102,25 à 103,50
Vente = 110,20
Si $SOL perce 111 alors vendre en conséquence jusqu’à la prochaine résistance.
#iamcryptoprince
Support : 100–102
Résistance : 110
Prochaine résistance : 114–115
Achat = 102,25 à 103,50
Vente = 110,20
Si $SOL perce 111 alors vendre en conséquence jusqu’à la prochaine résistance.
#iamcryptoprince
84
Connectez-vous pour découvrir plus de contenu
Rejoignez la communauté mondiale des adeptes de cryptomonnaies sur Binance Square
⚡️ Suviez les dernières informations importantes sur les cryptomonnaies.
💬 Jugé digne de confiance par la plus grande plateforme d’échange de cryptomonnaies au monde.
👍 Découvrez les connaissances que partagent les créateurs vérifiés.
Adresse e-mail/Nº de téléphone
Sujets d’actualité
NFPWatch
10.8M vues
19,098 mentions
Actualités crypto | Le bitcoin se rapproche de 85 000 $ alors que les rendements du Trésor baissent avant le rapport NFP américain
Binance News
·37 mentions J’aime
·48.2k vues
BitcoinFundingRateTriplesTo10%
134,739 vues
1,058 mentions
BitcoinSurpasses$86KUp2.99%
43,196 vues
106 mentions