
fiziji
6 Publications

fiziji
Signaler
Bloquer l’utilisateur
Ouvert au trading
2.8 mois
11 Suivis
0 Abonnés
1 J’aime
Publications
Portefeuille
·
--
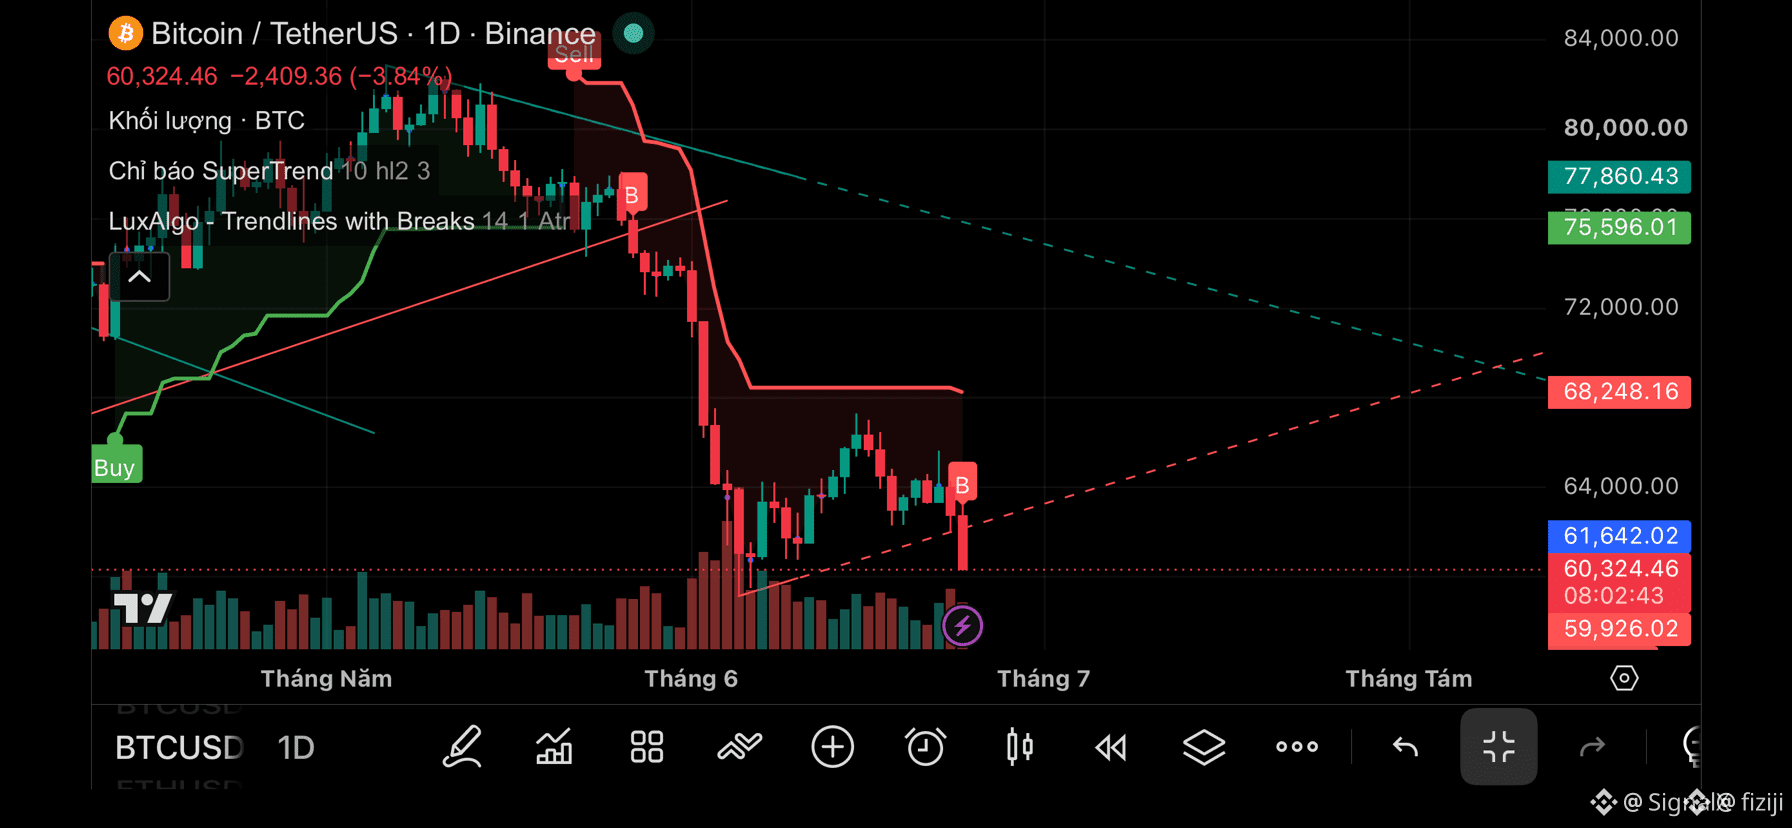
Analyse rapide du BTC (1J)
Le BTC reste baissier après la perte de sa ligne de tendance haussière à court terme. Les vendeurs restent aux commandes et le prix a du mal à reprendre la zone de résistance des 63K-64K.
Le BTC peut-il passer sous les 60K $ ?
👉 Oui, le risque est élevé.
* Une clôture quotidienne sous les 60K $ pourrait déclencher une nouvelle baisse vers 58K $-57K $.
* Si les acheteurs défendent les 60K $ et reprennent les 62K $-63K $, le BTC pourrait alors entrer dans une phase de consolidation.
Niveau clé : 60K $ est le support le plus important actuellement.
❓Votre avis : le BTC va-t-il tenir les 60K $ ou les casser ? 📊
{spot}(BTCUSDT)
Analyse rapide du BTC (1J)
Le BTC reste baissier après la perte de sa ligne de tendance haussière à court terme. Les vendeurs restent aux commandes et le prix a du mal à reprendre la zone de résistance des 63K-64K.
Le BTC peut-il passer sous les 60K $ ?
👉 Oui, le risque est élevé.
* Une clôture quotidienne sous les 60K $ pourrait déclencher une nouvelle baisse vers 58K $-57K $.
* Si les acheteurs défendent les 60K $ et reprennent les 62K $-63K $, le BTC pourrait alors entrer dans une phase de consolidation.
Niveau clé : 60K $ est le support le plus important actuellement.
❓Votre avis : le BTC va-t-il tenir les 60K $ ou les casser ? 📊
Le BTC reste baissier après la perte de sa ligne de tendance haussière à court terme. Les vendeurs restent aux commandes et le prix a du mal à reprendre la zone de résistance des 63K-64K.
Le BTC peut-il passer sous les 60K $ ?
👉 Oui, le risque est élevé.
* Une clôture quotidienne sous les 60K $ pourrait déclencher une nouvelle baisse vers 58K $-57K $.
* Si les acheteurs défendent les 60K $ et reprennent les 62K $-63K $, le BTC pourrait alors entrer dans une phase de consolidation.
Niveau clé : 60K $ est le support le plus important actuellement.
❓Votre avis : le BTC va-t-il tenir les 60K $ ou les casser ? 📊
56
·
--
Mise à jour hebdomadaire sur Bitcoin
Je ne pense pas qu’il soit nécessaire d’écrire un long message quand il n’y a pas grand-chose de changé en termes de prix.
Le graphique hebdomadaire reste dans une tendance baissière globale. Le prix a été rejeté de la zone 65k–67k dont nous avons parlé dans les deux dernières mises à jour hebdomadaires. Cela montre clairement que les haussiers sont encore faibles.
Je vois que le sentiment est extrêmement positif, et honnêtement, je ne comprends pas pourquoi. Le prix a presque rien fait, et la structure globale hebdomadaire reste encore baissière.
En regardant le graphique hebdomadaire, le rejet de 65k–67k est très net. Même si le prix remonte jusqu’à 70k–72k, cela ne changerait pas grand-chose à l’échelle hebdomadaire.
Je ne vois aucune raison de poursuivre le prix ou de me laisser emporter par l’excitation sur les réseaux sociaux quand les graphiques ne m’envoient pas de signal haussier. En ce qui concerne le graphique hebdomadaire, je ne vois toujours rien de encourageant.
**BTC Petits Timeframes**
La semaine dernière, Bitcoin se négociait autour de la zone 67k, et j’ai dit que toute faiblesse à cet endroit enverrait probablement le prix de retour vers la zone 60k–62k. La semaine dernière, le prix a chuté jusqu’à environ 62,2k, exactement comme prévu.
Globalement, je pense que les plus petits timeframes restent dans une fourchette.
Les 67k restent la résistance clé.
La zone 60k–62k reste le support clé.
Tant que le prix continue de s’échanger à l’intérieur de cette fourchette, c’est pour moi une zone sans transaction. Une cassure dans un sens ou dans l’autre mènerait probablement à la poursuite de la tendance.
{spot}(BTCUSDT)
Mise à jour hebdomadaire sur Bitcoin
Je ne pense pas qu’il soit nécessaire d’écrire un long message quand il n’y a pas grand-chose de changé en termes de prix.
Le graphique hebdomadaire reste dans une tendance baissière globale. Le prix a été rejeté de la zone 65k–67k dont nous avons parlé dans les deux dernières mises à jour hebdomadaires. Cela montre clairement que les haussiers sont encore faibles.
Je vois que le sentiment est extrêmement positif, et honnêtement, je ne comprends pas pourquoi. Le prix a presque rien fait, et la structure globale hebdomadaire reste encore baissière.
En regardant le graphique hebdomadaire, le rejet de 65k–67k est très net. Même si le prix remonte jusqu’à 70k–72k, cela ne changerait pas grand-chose à l’échelle hebdomadaire.
Je ne vois aucune raison de poursuivre le prix ou de me laisser emporter par l’excitation sur les réseaux sociaux quand les graphiques ne m’envoient pas de signal haussier. En ce qui concerne le graphique hebdomadaire, je ne vois toujours rien de encourageant.
**BTC Petits Timeframes**
La semaine dernière, Bitcoin se négociait autour de la zone 67k, et j’ai dit que toute faiblesse à cet endroit enverrait probablement le prix de retour vers la zone 60k–62k. La semaine dernière, le prix a chuté jusqu’à environ 62,2k, exactement comme prévu.
Globalement, je pense que les plus petits timeframes restent dans une fourchette.
Les 67k restent la résistance clé.
La zone 60k–62k reste le support clé.
Tant que le prix continue de s’échanger à l’intérieur de cette fourchette, c’est pour moi une zone sans transaction. Une cassure dans un sens ou dans l’autre mènerait probablement à la poursuite de la tendance.
Je ne pense pas qu’il soit nécessaire d’écrire un long message quand il n’y a pas grand-chose de changé en termes de prix.
Le graphique hebdomadaire reste dans une tendance baissière globale. Le prix a été rejeté de la zone 65k–67k dont nous avons parlé dans les deux dernières mises à jour hebdomadaires. Cela montre clairement que les haussiers sont encore faibles.
Je vois que le sentiment est extrêmement positif, et honnêtement, je ne comprends pas pourquoi. Le prix a presque rien fait, et la structure globale hebdomadaire reste encore baissière.
En regardant le graphique hebdomadaire, le rejet de 65k–67k est très net. Même si le prix remonte jusqu’à 70k–72k, cela ne changerait pas grand-chose à l’échelle hebdomadaire.
Je ne vois aucune raison de poursuivre le prix ou de me laisser emporter par l’excitation sur les réseaux sociaux quand les graphiques ne m’envoient pas de signal haussier. En ce qui concerne le graphique hebdomadaire, je ne vois toujours rien de encourageant.
**BTC Petits Timeframes**
La semaine dernière, Bitcoin se négociait autour de la zone 67k, et j’ai dit que toute faiblesse à cet endroit enverrait probablement le prix de retour vers la zone 60k–62k. La semaine dernière, le prix a chuté jusqu’à environ 62,2k, exactement comme prévu.
Globalement, je pense que les plus petits timeframes restent dans une fourchette.
Les 67k restent la résistance clé.
La zone 60k–62k reste le support clé.
Tant que le prix continue de s’échanger à l’intérieur de cette fourchette, c’est pour moi une zone sans transaction. Une cassure dans un sens ou dans l’autre mènerait probablement à la poursuite de la tendance.
30
·
--
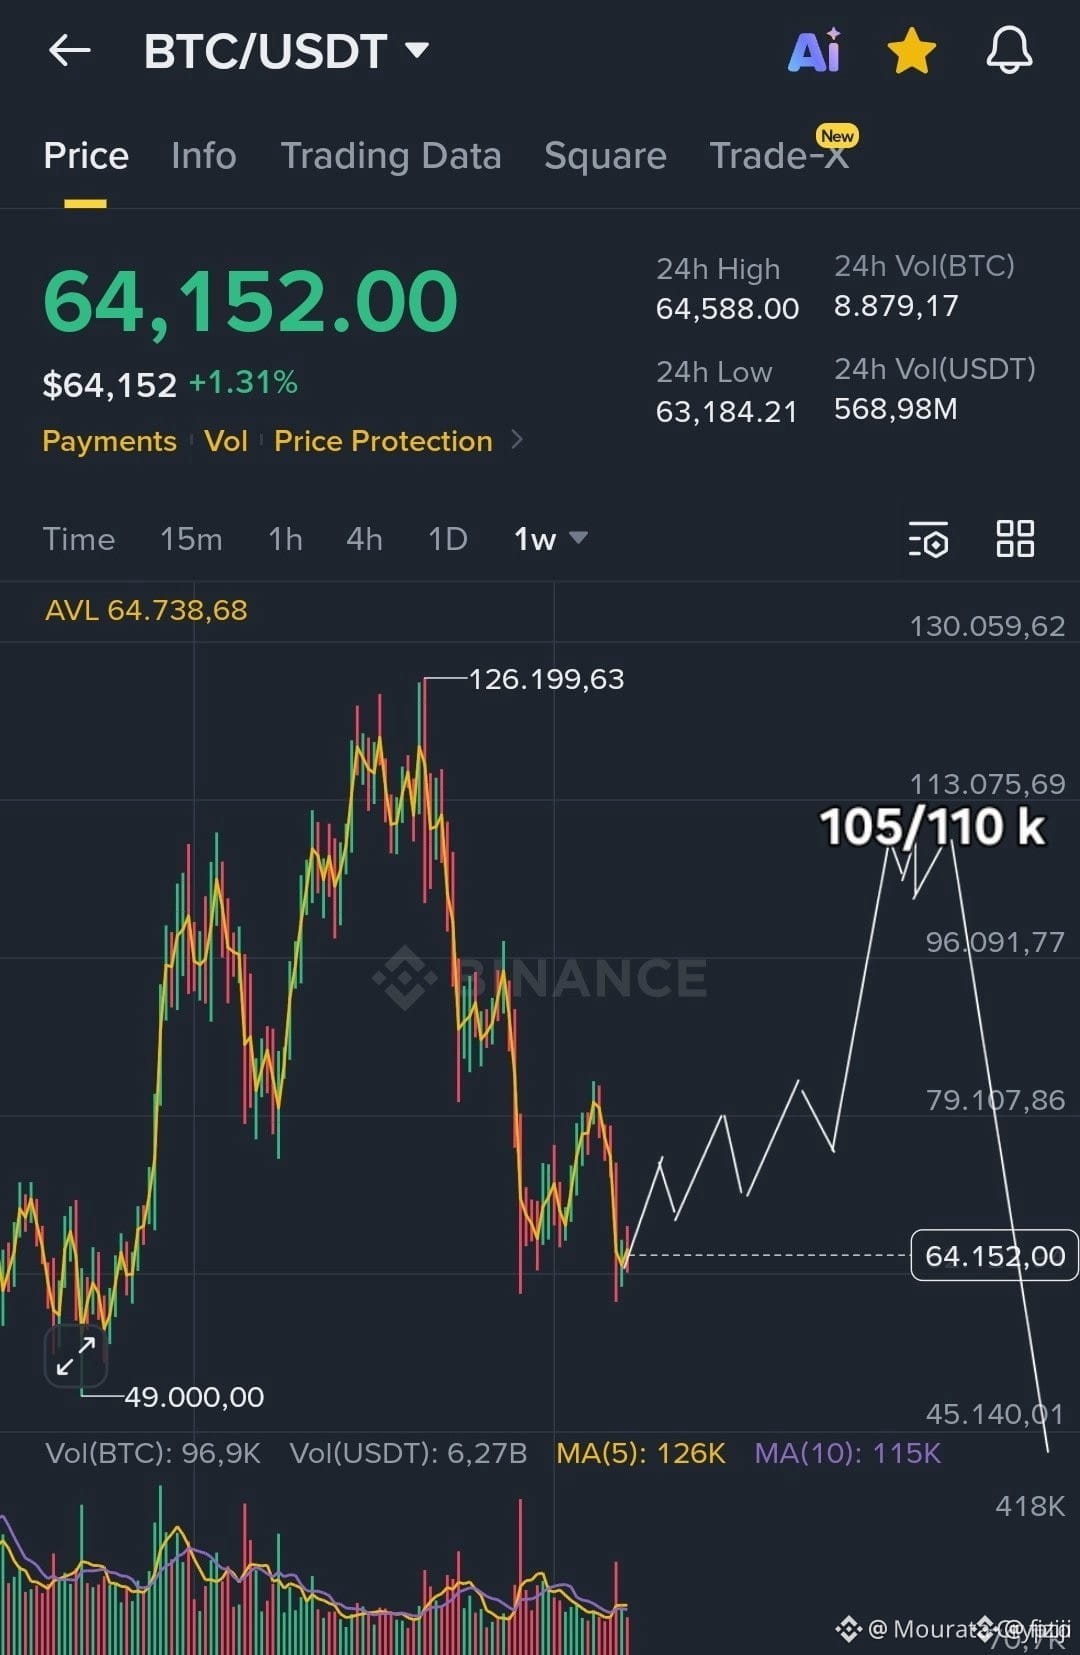
🚨🤯💥 ALERTE DE CONFIGURATION FOLLE $BTC ! 💥🤯🚨
🟢 Le BTC tourne autour de 64 000 $ pendant que les traders surveillent un mouvement potentiellement explosif vers 105 000 $-110 000 $ 📈🚀
🐂 Les taureaux y voient la zone d’accumulation parfaite avant la prochaine impulsion à la hausse. 🐻 Les ours avertissent qu’une fausse cassure pourrait déclencher d’abord une vente brutale. ⚠️📉$BTC
{spot}(BTCUSDT)
🚨🤯💥 ALERTE DE CONFIGURATION FOLLE $BTC ! 💥🤯🚨
🟢 Le BTC tourne autour de 64 000 $ pendant que les traders surveillent un mouvement potentiellement explosif vers 105 000 $-110 000 $ 📈🚀
🐂 Les taureaux y voient la zone d’accumulation parfaite avant la prochaine impulsion à la hausse. 🐻 Les ours avertissent qu’une fausse cassure pourrait déclencher d’abord une vente brutale. ⚠️📉$BTC
🟢 Le BTC tourne autour de 64 000 $ pendant que les traders surveillent un mouvement potentiellement explosif vers 105 000 $-110 000 $ 📈🚀
🐂 Les taureaux y voient la zone d’accumulation parfaite avant la prochaine impulsion à la hausse. 🐻 Les ours avertissent qu’une fausse cassure pourrait déclencher d’abord une vente brutale. ⚠️📉$BTC
33
·
--
$BTC Forte reprise haussière
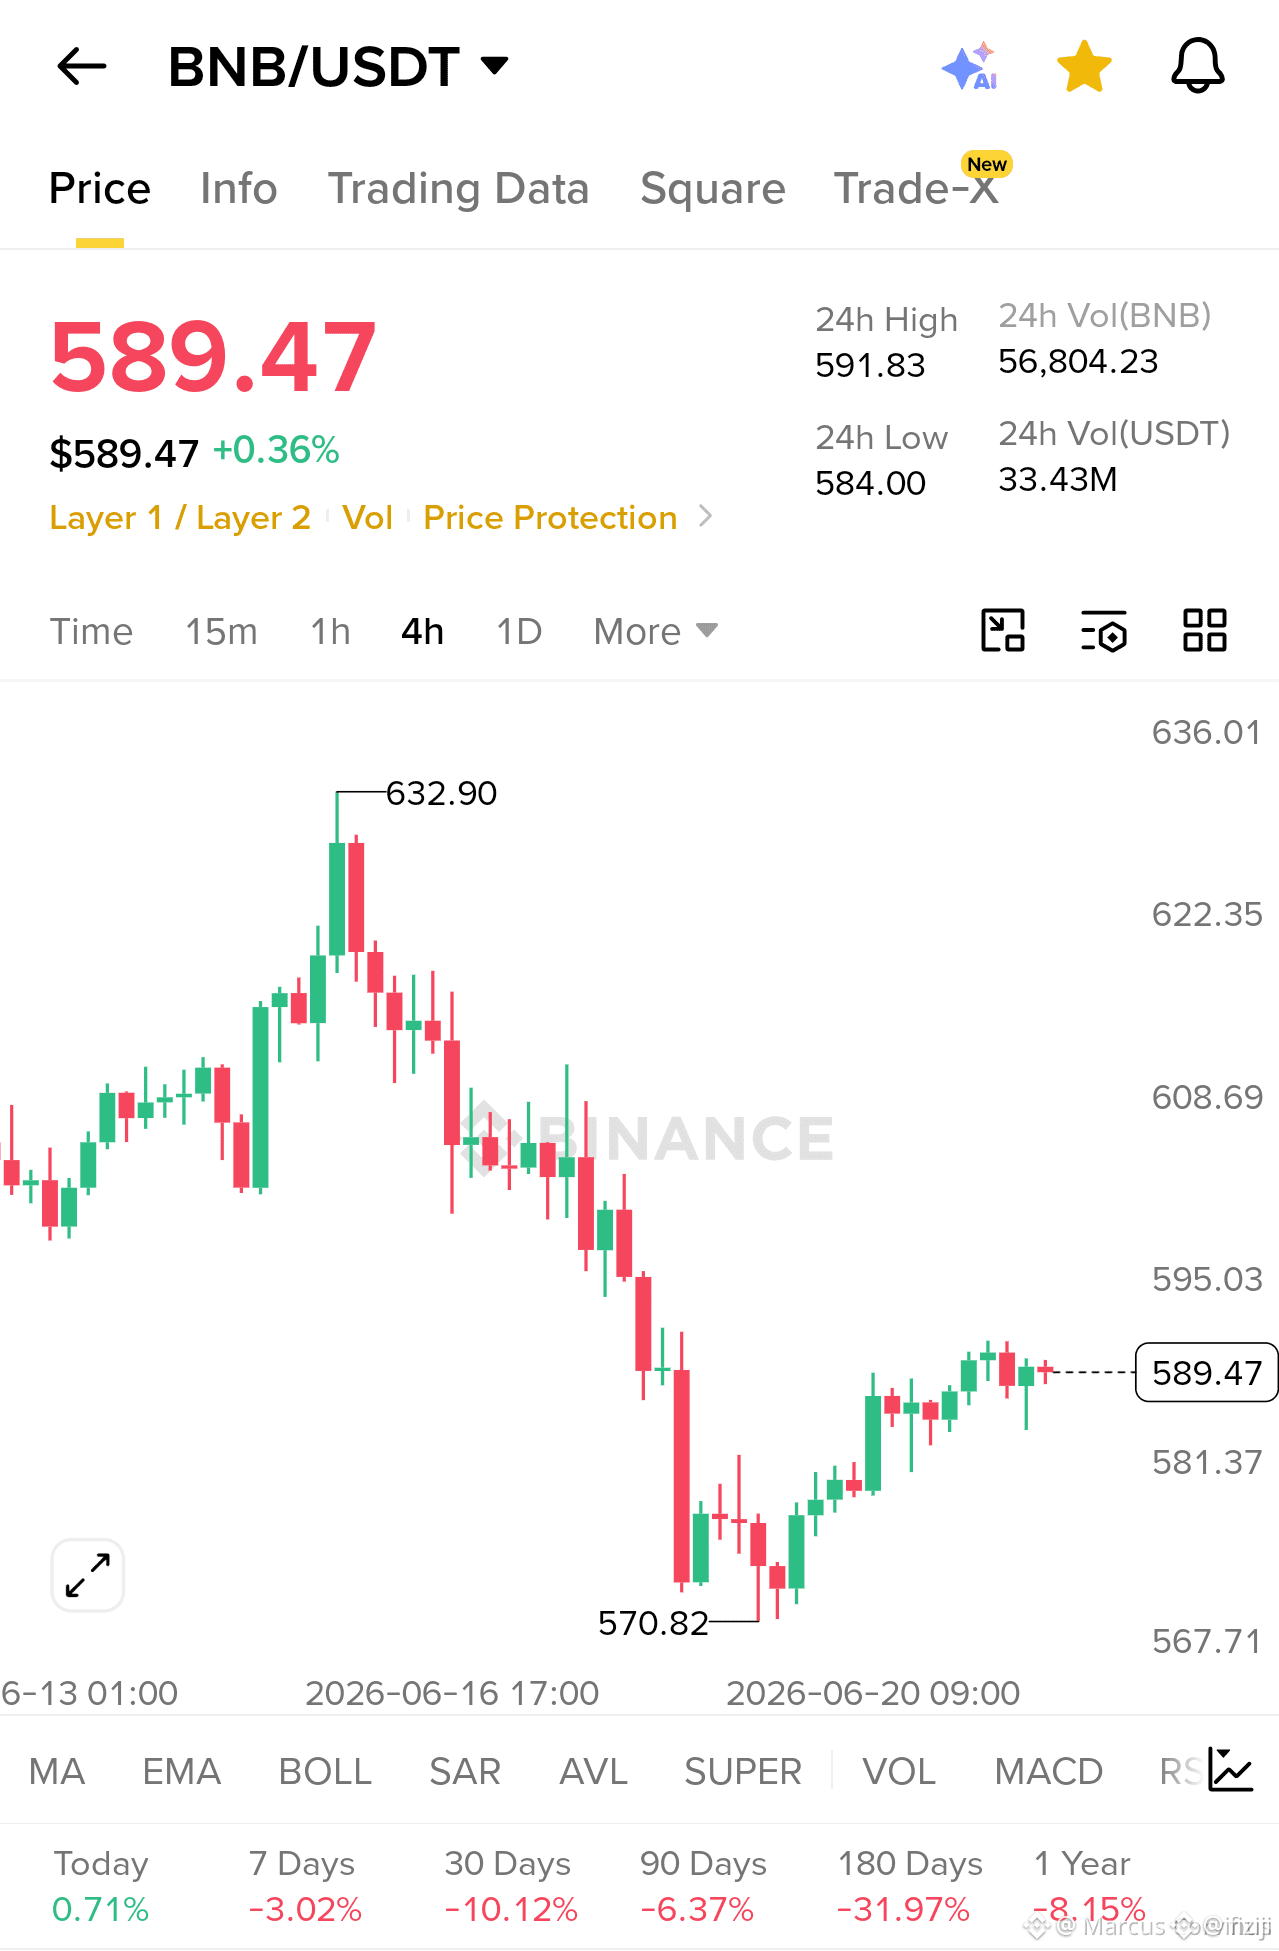
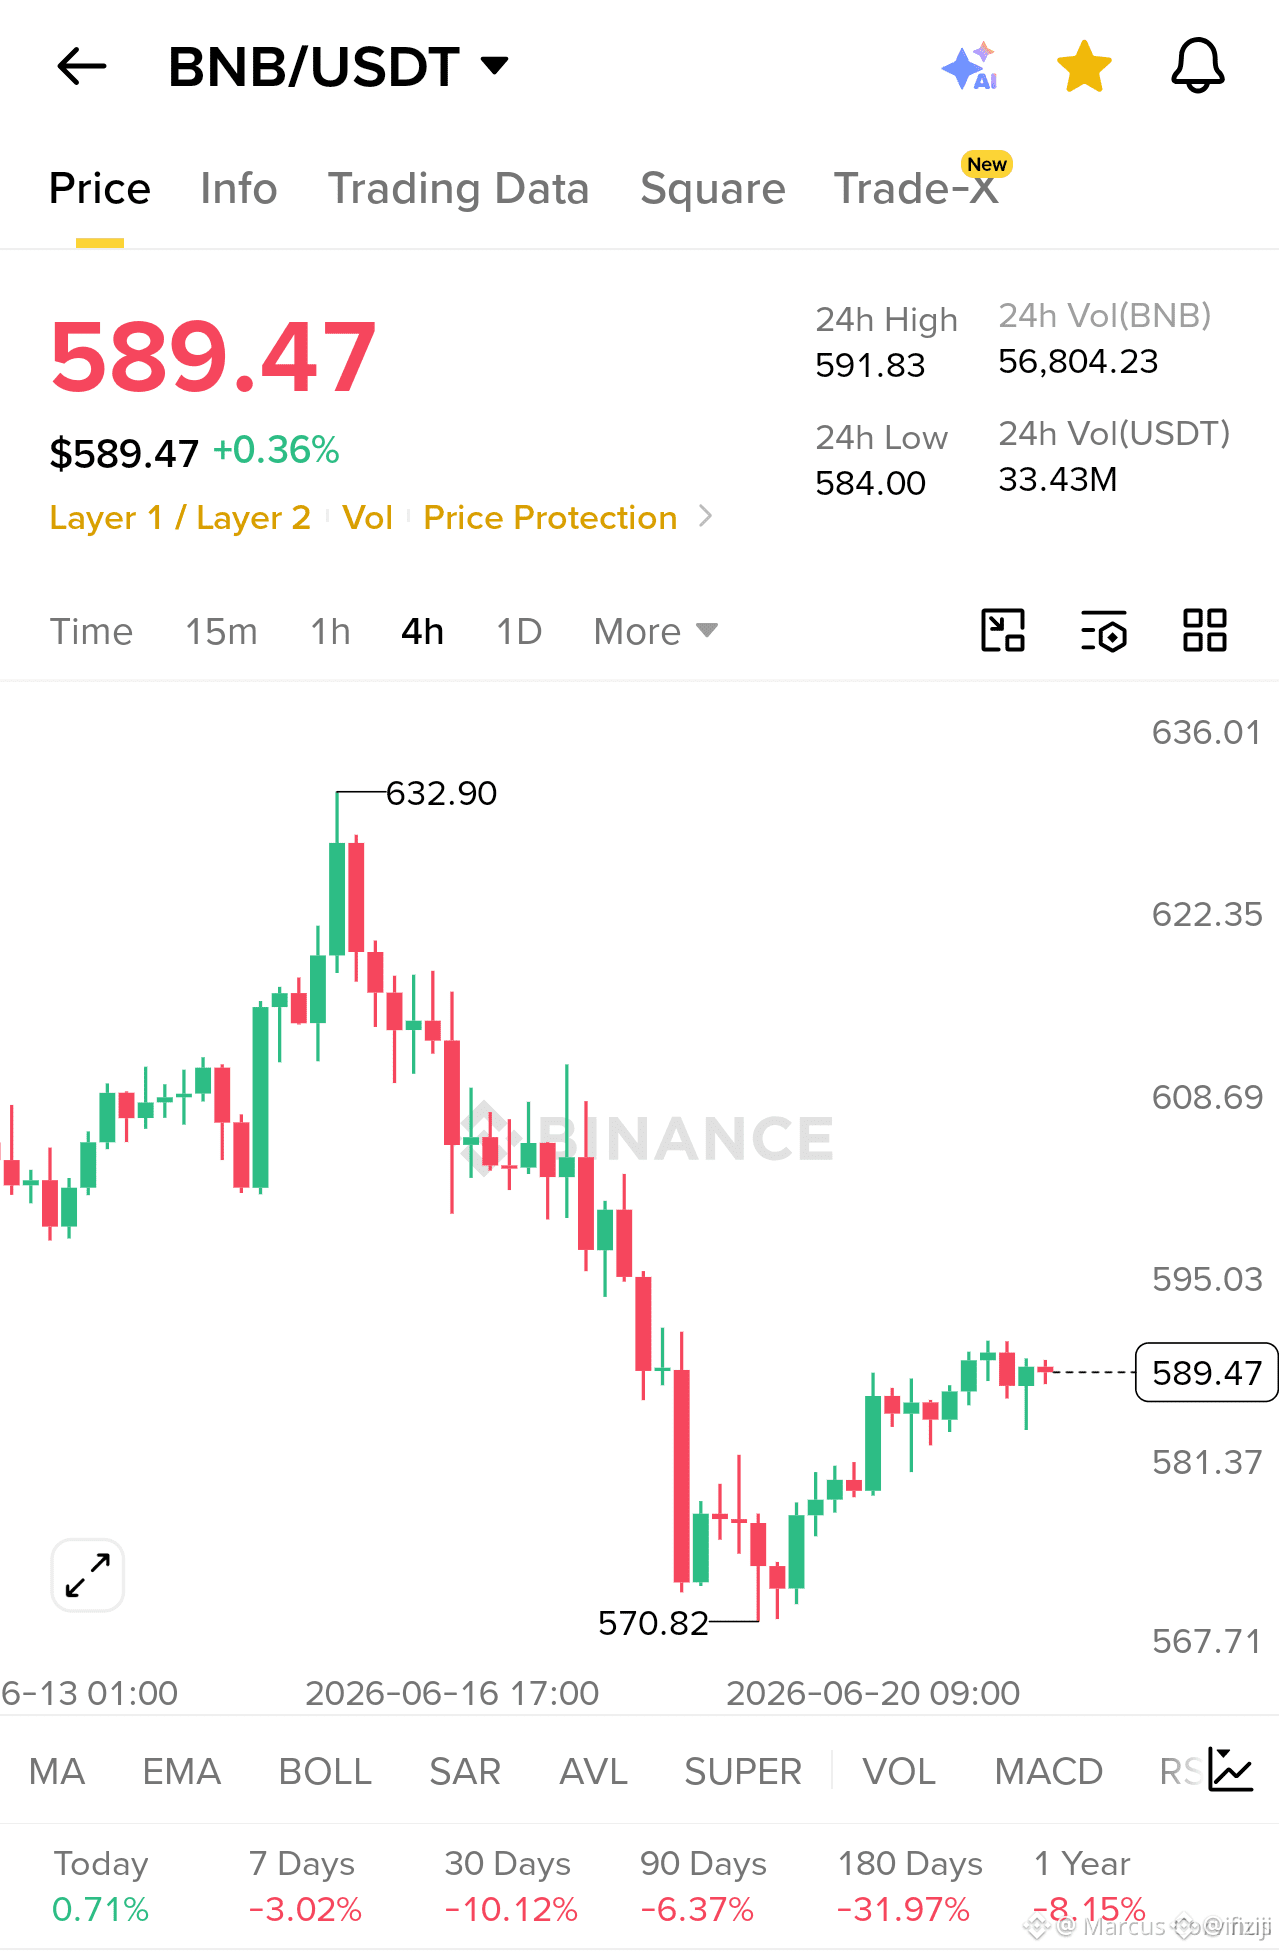
Je constate que $BNB fait preuve de force après une correction marquée de $632.90 à $570.82. Les acheteurs ont défendu la zone de support majeure et le prix forme désormais des plus bas plus élevés sur le timeframe 4H. Cette structure de reprise suggère que l’élan haussier se construit progressivement.
Raison
Je suis haussier parce que le marché a fortement rejeté la zone de support à $570. La pression vendeuse s’est affaiblie, les acheteurs reviennent progressivement, et le prix continue de se maintenir au-dessus des niveaux récents de reprise. Tant que le support reste intact, la probabilité favorise de nouveaux mouvements à la hausse.
Configuration de la transaction
Entrée : $586.00 - $590.00
Stop Loss : $579.00
Objectif 1 : $598.00
Objectif 2 : $608.00
Objectif 3 : $620.00
Objectif 4 : $632.00
Comment c’est possible
Je vois une accumulation après la récente baisse. Le rebond depuis $570.82 confirme un fort intérêt acheteur aux niveaux plus bas. Si le prix continue de se maintenir au-dessus de la zone d’entrée et casse au-dessus de $595.00, l’élan d’achat peut augmenter et conduire au prochain mouvement vers $608.00, $620.00, puis finalement $632.00.
Gestion du risque
• N’entrer que dans la zone d’entrée.
• Garder le stop loss fixe à $579.00.
• Sécuriser des profits partiels à chaque objectif.
• Déplacer le stop loss à l’équilibre après l’objectif 1.
Je suis haussier sur BTS tant que le prix reste au-dessus du support clé et continue de former des plus bas plus élevés.
On y va, passons à la Trade maintenant $BTC
#HormuzTrafficRises #OilPriceFalls #TrumpSeeks20%MiddleEastOilRevenue #USIranFirstRoundTalksShowProgress #ChinaAddsUSRareEarthProducersToExportControls
{spot}(BTCUSDT)
$
$BTC Forte reprise haussière
Je constate que $BNB fait preuve de force après une correction marquée de $632.90 à $570.82. Les acheteurs ont défendu la zone de support majeure et le prix forme désormais des plus bas plus élevés sur le timeframe 4H. Cette structure de reprise suggère que l’élan haussier se construit progressivement.
Raison
Je suis haussier parce que le marché a fortement rejeté la zone de support à $570. La pression vendeuse s’est affaiblie, les acheteurs reviennent progressivement, et le prix continue de se maintenir au-dessus des niveaux récents de reprise. Tant que le support reste intact, la probabilité favorise de nouveaux mouvements à la hausse.
Configuration de la transaction
Entrée : $586.00 - $590.00
Stop Loss : $579.00
Objectif 1 : $598.00
Objectif 2 : $608.00
Objectif 3 : $620.00
Objectif 4 : $632.00
Comment c’est possible
Je vois une accumulation après la récente baisse. Le rebond depuis $570.82 confirme un fort intérêt acheteur aux niveaux plus bas. Si le prix continue de se maintenir au-dessus de la zone d’entrée et casse au-dessus de $595.00, l’élan d’achat peut augmenter et conduire au prochain mouvement vers $608.00, $620.00, puis finalement $632.00.
Gestion du risque
• N’entrer que dans la zone d’entrée.
• Garder le stop loss fixe à $579.00.
• Sécuriser des profits partiels à chaque objectif.
• Déplacer le stop loss à l’équilibre après l’objectif 1.
Je suis haussier sur BTS tant que le prix reste au-dessus du support clé et continue de former des plus bas plus élevés.
On y va, passons à la Trade maintenant $BTC
#HormuzTrafficRises #OilPriceFalls #TrumpSeeks20%MiddleEastOilRevenue #USIranFirstRoundTalksShowProgress #ChinaAddsUSRareEarthProducersToExportControls
$
Je constate que $BNB fait preuve de force après une correction marquée de $632.90 à $570.82. Les acheteurs ont défendu la zone de support majeure et le prix forme désormais des plus bas plus élevés sur le timeframe 4H. Cette structure de reprise suggère que l’élan haussier se construit progressivement.
Raison
Je suis haussier parce que le marché a fortement rejeté la zone de support à $570. La pression vendeuse s’est affaiblie, les acheteurs reviennent progressivement, et le prix continue de se maintenir au-dessus des niveaux récents de reprise. Tant que le support reste intact, la probabilité favorise de nouveaux mouvements à la hausse.
Configuration de la transaction
Entrée : $586.00 - $590.00
Stop Loss : $579.00
Objectif 1 : $598.00
Objectif 2 : $608.00
Objectif 3 : $620.00
Objectif 4 : $632.00
Comment c’est possible
Je vois une accumulation après la récente baisse. Le rebond depuis $570.82 confirme un fort intérêt acheteur aux niveaux plus bas. Si le prix continue de se maintenir au-dessus de la zone d’entrée et casse au-dessus de $595.00, l’élan d’achat peut augmenter et conduire au prochain mouvement vers $608.00, $620.00, puis finalement $632.00.
Gestion du risque
• N’entrer que dans la zone d’entrée.
• Garder le stop loss fixe à $579.00.
• Sécuriser des profits partiels à chaque objectif.
• Déplacer le stop loss à l’équilibre après l’objectif 1.
Je suis haussier sur BTS tant que le prix reste au-dessus du support clé et continue de former des plus bas plus élevés.
On y va, passons à la Trade maintenant $BTC
#HormuzTrafficRises #OilPriceFalls #TrumpSeeks20%MiddleEastOilRevenue #USIranFirstRoundTalksShowProgress #ChinaAddsUSRareEarthProducersToExportControls
$
54
·
--
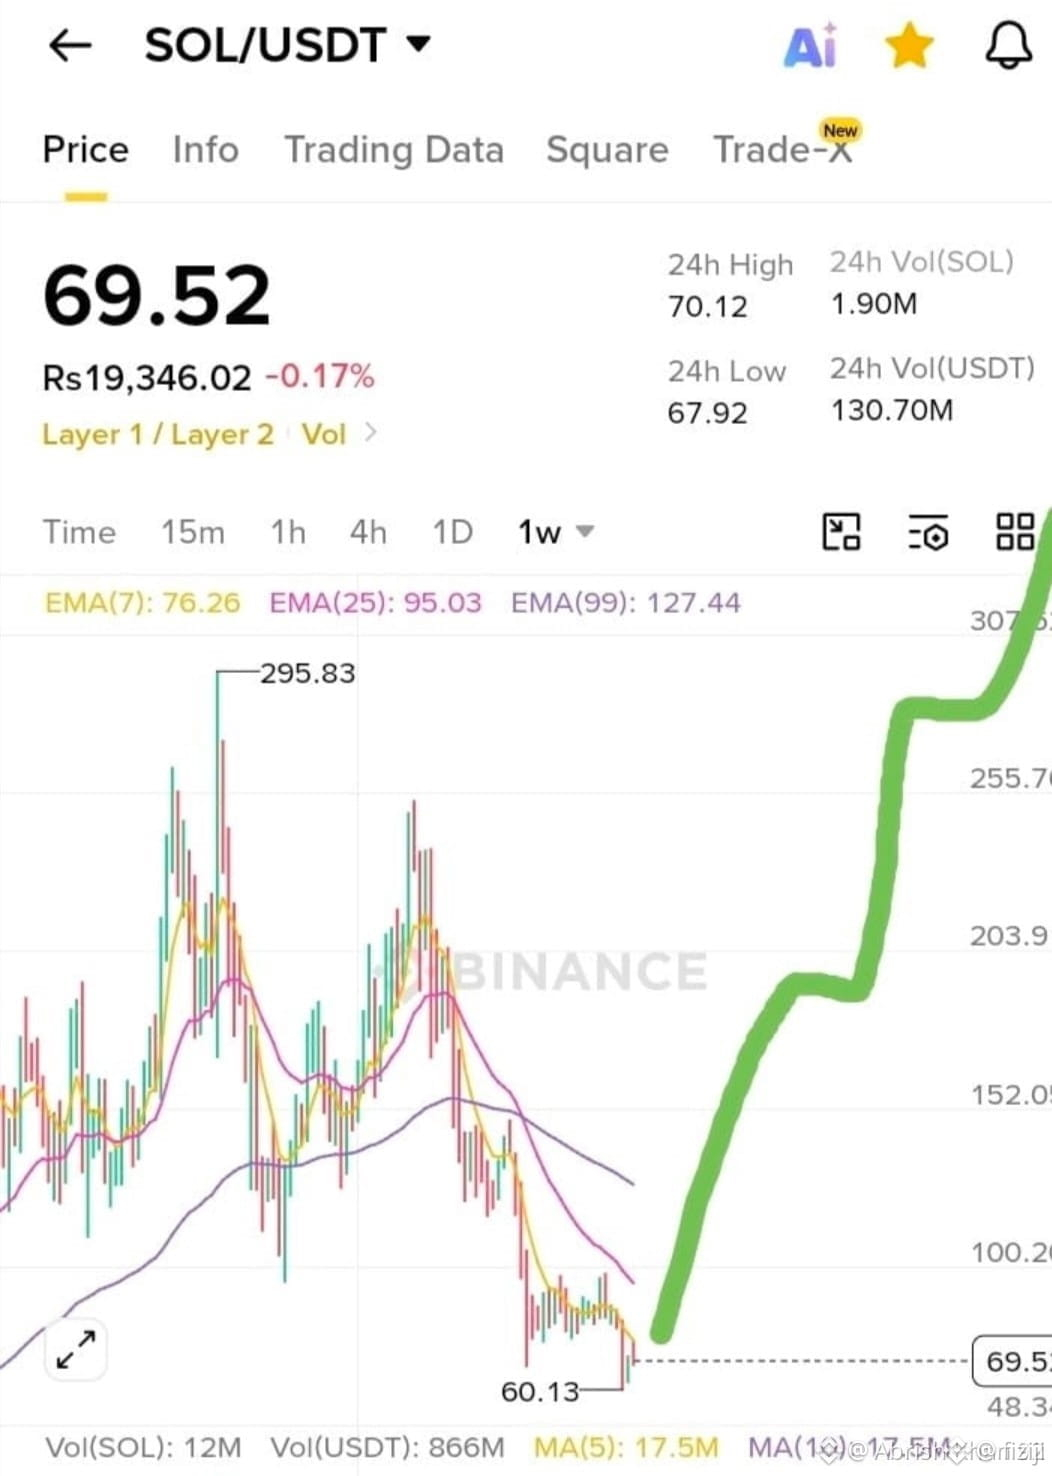
Je suis toujours un fier croyant de $SOL. 💚
Garder Solana pendant un an et demi n'a pas été facile—cela a été rempli de stress, de patience et de moments difficiles. Mais je n'ai jamais perdu foi en la vision à long terme.
Maintenant, j'espère que c'est enfin le moment pour $SOL de récompenser tous ceux qui sont restés à travers la tempête. Un $BTC
{future}(BTCUSDT)
Je suis toujours un fier croyant de $SOL. 💚
Garder Solana pendant un an et demi n'a pas été facile—cela a été rempli de stress, de patience et de moments difficiles. Mais je n'ai jamais perdu foi en la vision à long terme.
Maintenant, j'espère que c'est enfin le moment pour $SOL de récompenser tous ceux qui sont restés à travers la tempête. Un $BTC
Garder Solana pendant un an et demi n'a pas été facile—cela a été rempli de stress, de patience et de moments difficiles. Mais je n'ai jamais perdu foi en la vision à long terme.
Maintenant, j'espère que c'est enfin le moment pour $SOL de récompenser tous ceux qui sont restés à travers la tempête. Un $BTC
60
·
--
Rédigez une brève analyse de pari Cion letiest avec le lanceur


Bitcoin$BTC Short Dernière analyse
Le Bitcoin évolue autour de la fourchette 65 000 $–67 000 $, montrant des signes de reprise après la volatilité récente du marché. La cassure au-dessus de niveaux de résistance clés a amélioré le sentiment du marché, mais la demande institutionnelle reste modérée.
Haussier : Le maintien au-dessus de 65 000 $ pourrait conduire à un mouvement vers des niveaux de résistance plus élevés.
Baissier : Une chute sous le support pourrait déclencher une nouvelle période de consolidation et une volatilité accrue.
Facteur clé : Le sentiment des investisseurs, les nouvelles macroéconomiques et la participation institutionnelle restent les principaux catalyseurs
#CrudeFuturesSink #IranDelegationRefusesToReturnToTalks #OilPriceFalls #TrumpSeeks20%MiddleEastOilRevenue #USIranFirstRoundTalksShowProgress
{spot}(BTCUSDT)
Rédigez une brève analyse de pari Cion letiest avec le lanceur


Bitcoin$BTC Short Dernière analyse
Le Bitcoin évolue autour de la fourchette 65 000 $–67 000 $, montrant des signes de reprise après la volatilité récente du marché. La cassure au-dessus de niveaux de résistance clés a amélioré le sentiment du marché, mais la demande institutionnelle reste modérée.
Haussier : Le maintien au-dessus de 65 000 $ pourrait conduire à un mouvement vers des niveaux de résistance plus élevés.
Baissier : Une chute sous le support pourrait déclencher une nouvelle période de consolidation et une volatilité accrue.
Facteur clé : Le sentiment des investisseurs, les nouvelles macroéconomiques et la participation institutionnelle restent les principaux catalyseurs
#CrudeFuturesSink #IranDelegationRefusesToReturnToTalks #OilPriceFalls #TrumpSeeks20%MiddleEastOilRevenue #USIranFirstRoundTalksShowProgress


Bitcoin$BTC Short Dernière analyse
Le Bitcoin évolue autour de la fourchette 65 000 $–67 000 $, montrant des signes de reprise après la volatilité récente du marché. La cassure au-dessus de niveaux de résistance clés a amélioré le sentiment du marché, mais la demande institutionnelle reste modérée.
Haussier : Le maintien au-dessus de 65 000 $ pourrait conduire à un mouvement vers des niveaux de résistance plus élevés.
Baissier : Une chute sous le support pourrait déclencher une nouvelle période de consolidation et une volatilité accrue.
Facteur clé : Le sentiment des investisseurs, les nouvelles macroéconomiques et la participation institutionnelle restent les principaux catalyseurs
#CrudeFuturesSink #IranDelegationRefusesToReturnToTalks #OilPriceFalls #TrumpSeeks20%MiddleEastOilRevenue #USIranFirstRoundTalksShowProgress
1
90
Connectez-vous pour découvrir plus de contenu
Rejoignez la communauté mondiale des adeptes de cryptomonnaies sur Binance Square
⚡️ Suviez les dernières informations importantes sur les cryptomonnaies.
💬 Jugé digne de confiance par la plus grande plateforme d’échange de cryptomonnaies au monde.
👍 Découvrez les connaissances que partagent les créateurs vérifiés.
Adresse e-mail/Nº de téléphone
Sujets d’actualité
BitcoinHoldsAbove$77000
623 vues
48 mentions
#anthropicceocallsforaislowdown
🚨 $BTC DÉTIENT 77 000 $ ALORS QUE LE MARCHÉ SE FOCALISE SUR BTC & ETH ! 🦅
Le Bitcoin respecte la ligne de tendance en 4H, maintenant le setup haussier actif ! 🎯
📍 Entrée : 76,826 – 76,500
🎯 Objectifs : 76,900 ➔ 77,000 ➔ 77,300
🛑 Stop Loss : 76,400
⚠️ Règle stricte : Le setup n’est valable que tant que la structure clé tient. La perte de la zone de stop invalide la transaction.
⚡ Actifs à surveiller :
🪙 $BTC — Respect de support technique clé avant une volatilité macro ! 📈
🌐 $ETH — Consolidation serrée autour de zones de demande clés pour un potentiel mouvement de cassure ! 📊
Gérez le levier avec prudence et attendez que le prix atteigne votre zone de chasse prédéfinie ! 🛡️🧠
❓ Quelle est votre action ? Acheter BTC ici ou attendre des entrées plus basses ? Déposez votre plan ci-dessous ! 👇
Avertissement : Faites vos propres recherches (DYOR). Ce n’est pas un conseil financier.
#BitcoinHoldsAbove$77000
#AvalancheIntegratesIntoUAEPassDigitalVault
#AnthropicCEOCallsForAISlowdown
#BrazilCentralBankRaisesVASPCapitalRequirements
Hifza Rubab
·0 mentions J’aime
·63 vues
FedHikeOddsRiseTo89%
1,677 vues
118 mentions
BitcoinCrosses$78000
2,934 vues
135 mentions