

AH ASIF
7 Publications

AH ASIF
Signaler
Bloquer l’utilisateur
Ouvert au trading
Trade régulièrement
2.1 an(s)
2 Suivis
2 Abonnés
0 J’aime
Publications
Portefeuille
·
--
#BinanceLaunchesBinanceIntelligence #Bitcoin❗ #BNB走势 #USDT #BTC走势分析
Bitcoin (BTC) is the world’s first decentralized cryptocurrency. It works without a central bank and uses blockchain technology to record transactions.
BTC has a limited supply: Only 21 million Bitcoin can ever exist.
Price: Bitcoin is highly volatile, so its price can rise or fall quickly.
Market trend: Traders usually watch support, resistance, trading volume, and market sentiment.
Long-term view: Many investors consider Bitcoin a digital asset and a possible store of value, but it also carries significant risk.
Important: Never invest money you cannot afford to lose, especially because crypto prices can change very quickly.
#BinanceLaunchesBinanceIntelligence #Bitcoin❗ #BNB走势 #USDT #BTC走势分析
Bitcoin (BTC) is the world’s first decentralized cryptocurrency. It works without a central bank and uses blockchain technology to record transactions.
BTC has a limited supply: Only 21 million Bitcoin can ever exist.
Price: Bitcoin is highly volatile, so its price can rise or fall quickly.
Market trend: Traders usually watch support, resistance, trading volume, and market sentiment.
Long-term view: Many investors consider Bitcoin a digital asset and a possible store of value, but it also carries significant risk.
Important: Never invest money you cannot afford to lose, especially because crypto prices can change very quickly.
Bitcoin (BTC) is the world’s first decentralized cryptocurrency. It works without a central bank and uses blockchain technology to record transactions.
BTC has a limited supply: Only 21 million Bitcoin can ever exist.
Price: Bitcoin is highly volatile, so its price can rise or fall quickly.
Market trend: Traders usually watch support, resistance, trading volume, and market sentiment.
Long-term view: Many investors consider Bitcoin a digital asset and a possible store of value, but it also carries significant risk.
Important: Never invest money you cannot afford to lose, especially because crypto prices can change very quickly.
91
·
--
#Bitcoin❗ #Bianace #BNB_Market_Update #CoinClub #All_Time_High
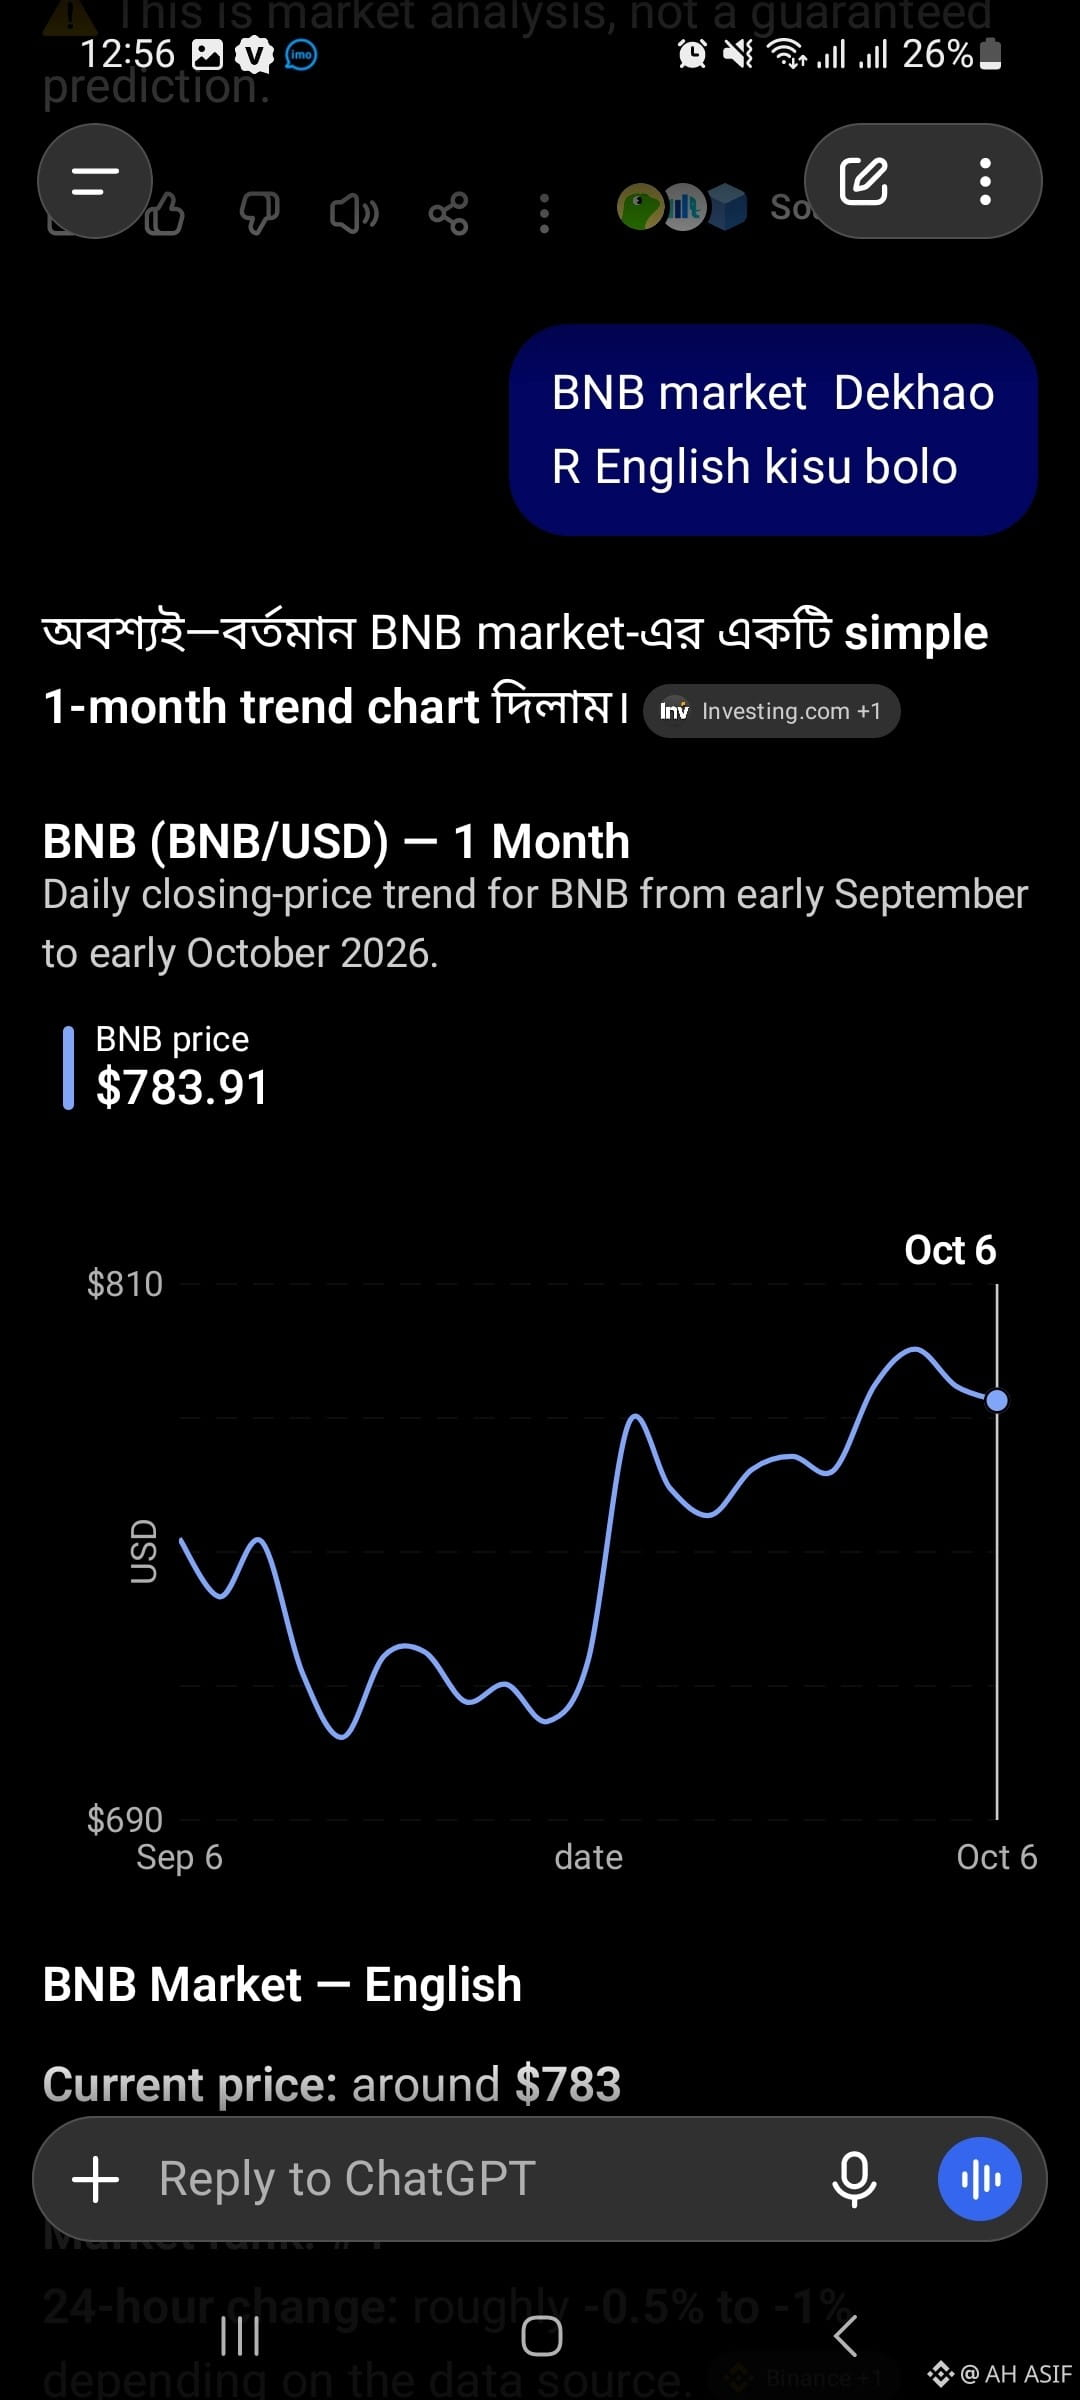
BNB Market — English
Current price: around $783
Market cap: about $104 billion
Market rank: #4
24-hour change: roughly -0.5% to -1% depending on the data source. �
Binance +1
1-month performance: BNB is roughly +5% over the last 30 days. �
Bybit
Key levels:
🟢 Support: around $760–$770
🔴 Resistance: around $800–$810
🚀 A sustained break above $810 could make the chart more bullish.
⚠️ A drop below the $760 area would weaken the short-term structure.
Simple English:
“BNB has recovered strongly during the last month. It is currently trading near $783 and is approaching the important $800–$810 resistance zone. A strong breakout above this area could indicate further upside, while rejection could bring the price back toward the $760–$770 support zone.”
#Bitcoin❗ #Bianace #BNB_Market_Update #CoinClub #All_Time_High
BNB Market — English
Current price: around $783
Market cap: about $104 billion
Market rank: #4
24-hour change: roughly -0.5% to -1% depending on the data source. �
Binance +1
1-month performance: BNB is roughly +5% over the last 30 days. �
Bybit
Key levels:
🟢 Support: around $760–$770
🔴 Resistance: around $800–$810
🚀 A sustained break above $810 could make the chart more bullish.
⚠️ A drop below the $760 area would weaken the short-term structure.
Simple English:
“BNB has recovered strongly during the last month. It is currently trading near $783 and is approaching the important $800–$810 resistance zone. A strong breakout above this area could indicate further upside, while rejection could bring the price back toward the $760–$770 support zone.”
BNB Market — English
Current price: around $783
Market cap: about $104 billion
Market rank: #4
24-hour change: roughly -0.5% to -1% depending on the data source. �
Binance +1
1-month performance: BNB is roughly +5% over the last 30 days. �
Bybit
Key levels:
🟢 Support: around $760–$770
🔴 Resistance: around $800–$810
🚀 A sustained break above $810 could make the chart more bullish.
⚠️ A drop below the $760 area would weaken the short-term structure.
Simple English:
“BNB has recovered strongly during the last month. It is currently trading near $783 and is approaching the important $800–$810 resistance zone. A strong breakout above this area could indicate further upside, while rejection could bring the price back toward the $760–$770 support zone.”
36
·
--
#BinanceLaunchesBinanceIntelligence
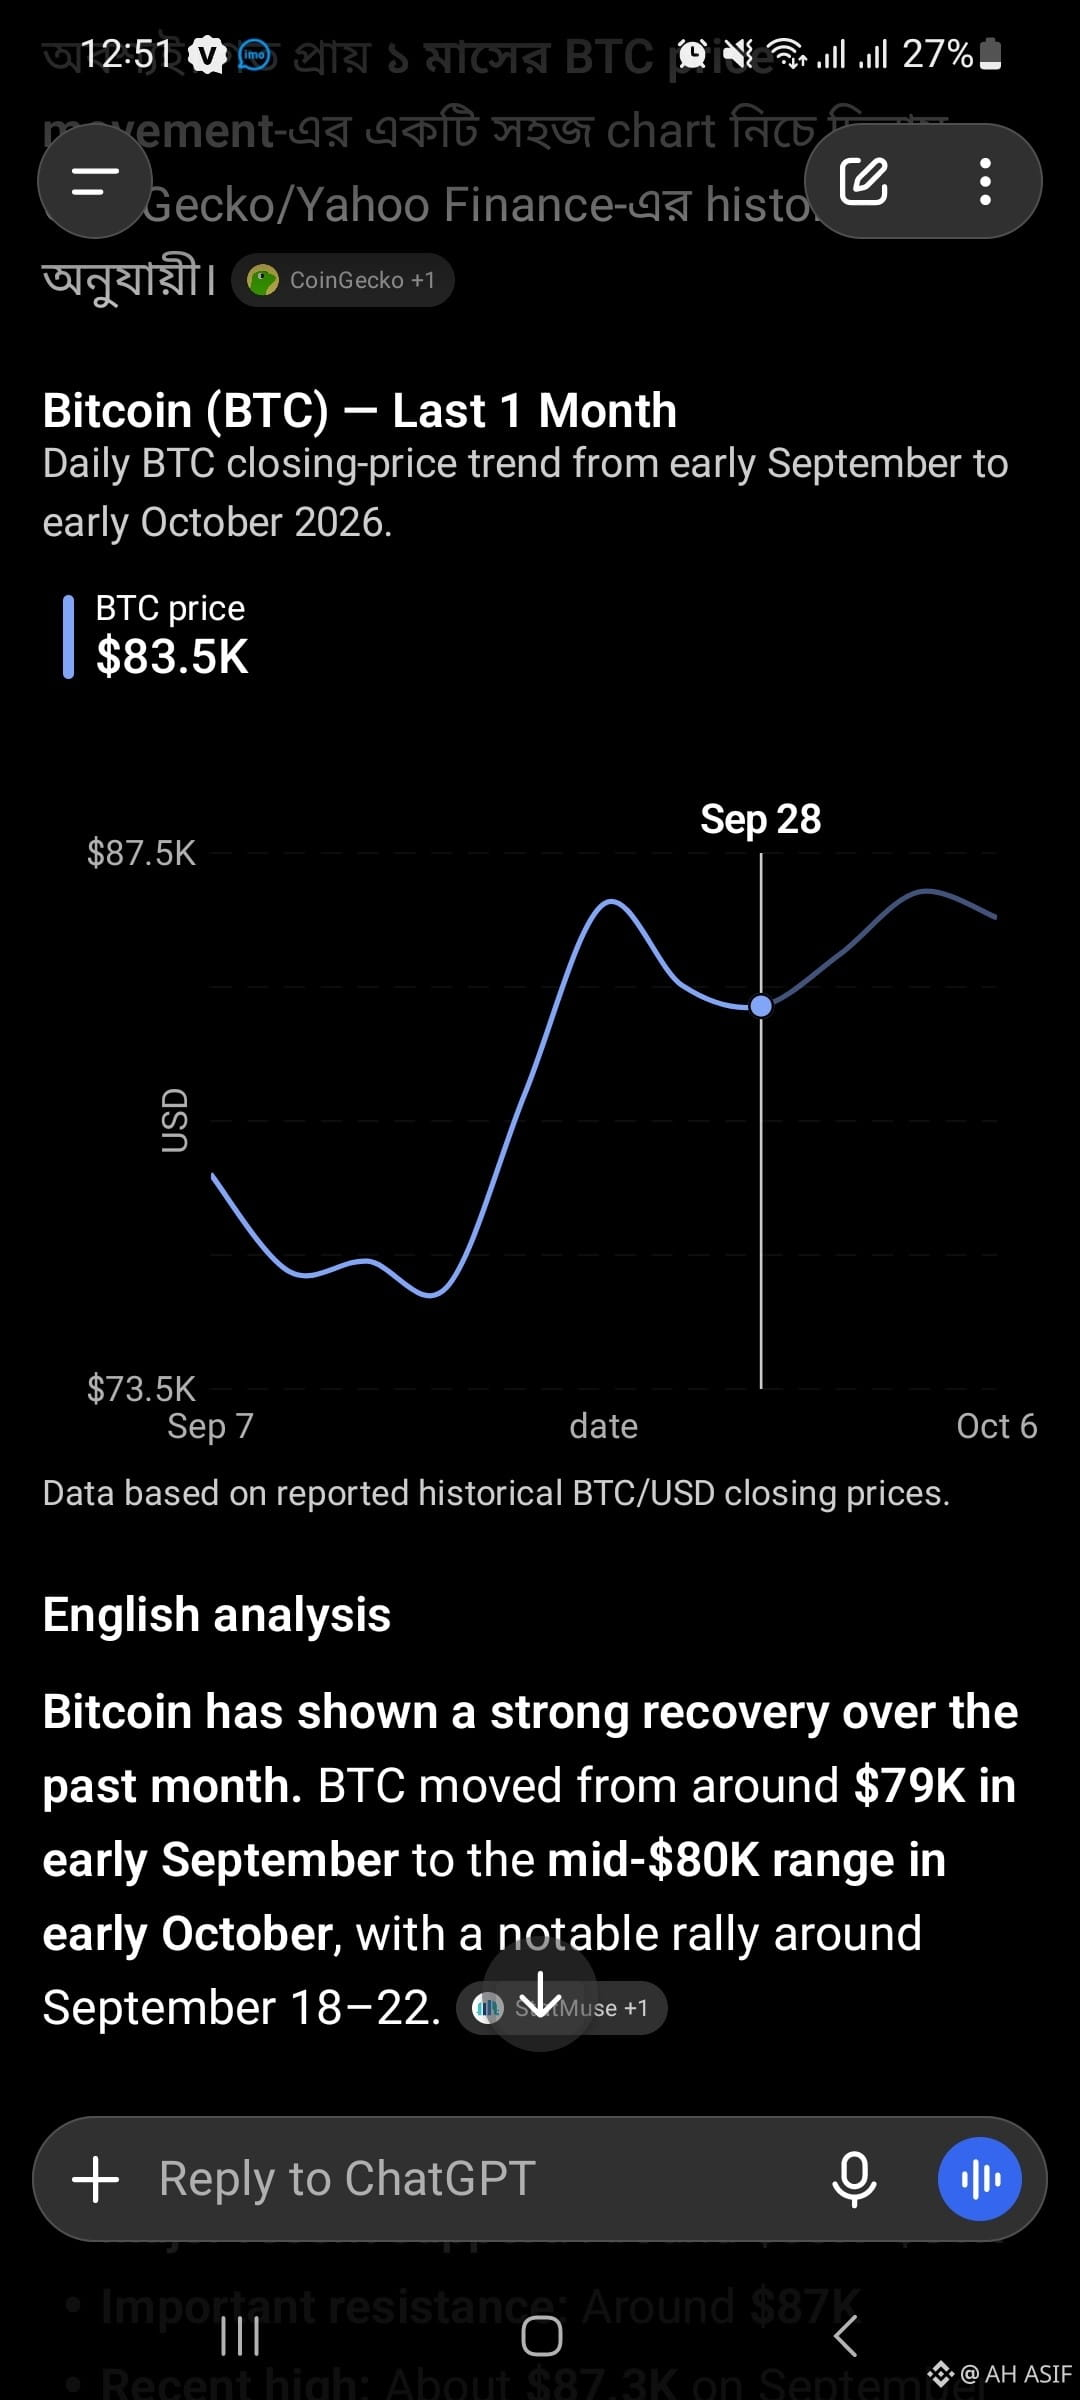
Bitcoin has shown a strong recovery over the past month. BTC moved from around $79K in early September to the mid-$80K range in early October, with a notable rally around September 18–22. �
StatMuse +1
Monthly direction: Generally bullish 📈
Major recent support: Around $80K–$81K
Important resistance: Around $87K
Recent high: About $87.3K on September 21–23
Current zone: Mid-$80K
Key point: BTC needs to break and hold above roughly $87K–$87.5K to strengthen the bullish setup; $81K is an important support level. �
blockchain-council.org
In simple English:
“Bitcoin has recovered strongly during the last month. The price is now testing an important resistance area near $87K. If BTC breaks above this level with strong buying pressure, the next move could be higher. If it fails, the $81K area becomes an important support zone.”
#BinanceLaunchesBinanceIntelligence
Bitcoin has shown a strong recovery over the past month. BTC moved from around $79K in early September to the mid-$80K range in early October, with a notable rally around September 18–22. �
StatMuse +1
Monthly direction: Generally bullish 📈
Major recent support: Around $80K–$81K
Important resistance: Around $87K
Recent high: About $87.3K on September 21–23
Current zone: Mid-$80K
Key point: BTC needs to break and hold above roughly $87K–$87.5K to strengthen the bullish setup; $81K is an important support level. �
blockchain-council.org
In simple English:
“Bitcoin has recovered strongly during the last month. The price is now testing an important resistance area near $87K. If BTC breaks above this level with strong buying pressure, the next move could be higher. If it fails, the $81K area becomes an important support zone.”
Bitcoin has shown a strong recovery over the past month. BTC moved from around $79K in early September to the mid-$80K range in early October, with a notable rally around September 18–22. �
StatMuse +1
Monthly direction: Generally bullish 📈
Major recent support: Around $80K–$81K
Important resistance: Around $87K
Recent high: About $87.3K on September 21–23
Current zone: Mid-$80K
Key point: BTC needs to break and hold above roughly $87K–$87.5K to strengthen the bullish setup; $81K is an important support level. �
blockchain-council.org
In simple English:
“Bitcoin has recovered strongly during the last month. The price is now testing an important resistance area near $87K. If BTC breaks above this level with strong buying pressure, the next move could be higher. If it fails, the $81K area becomes an important support zone.”
51
·
--
#BinanceLaunchesBinanceIntelligence
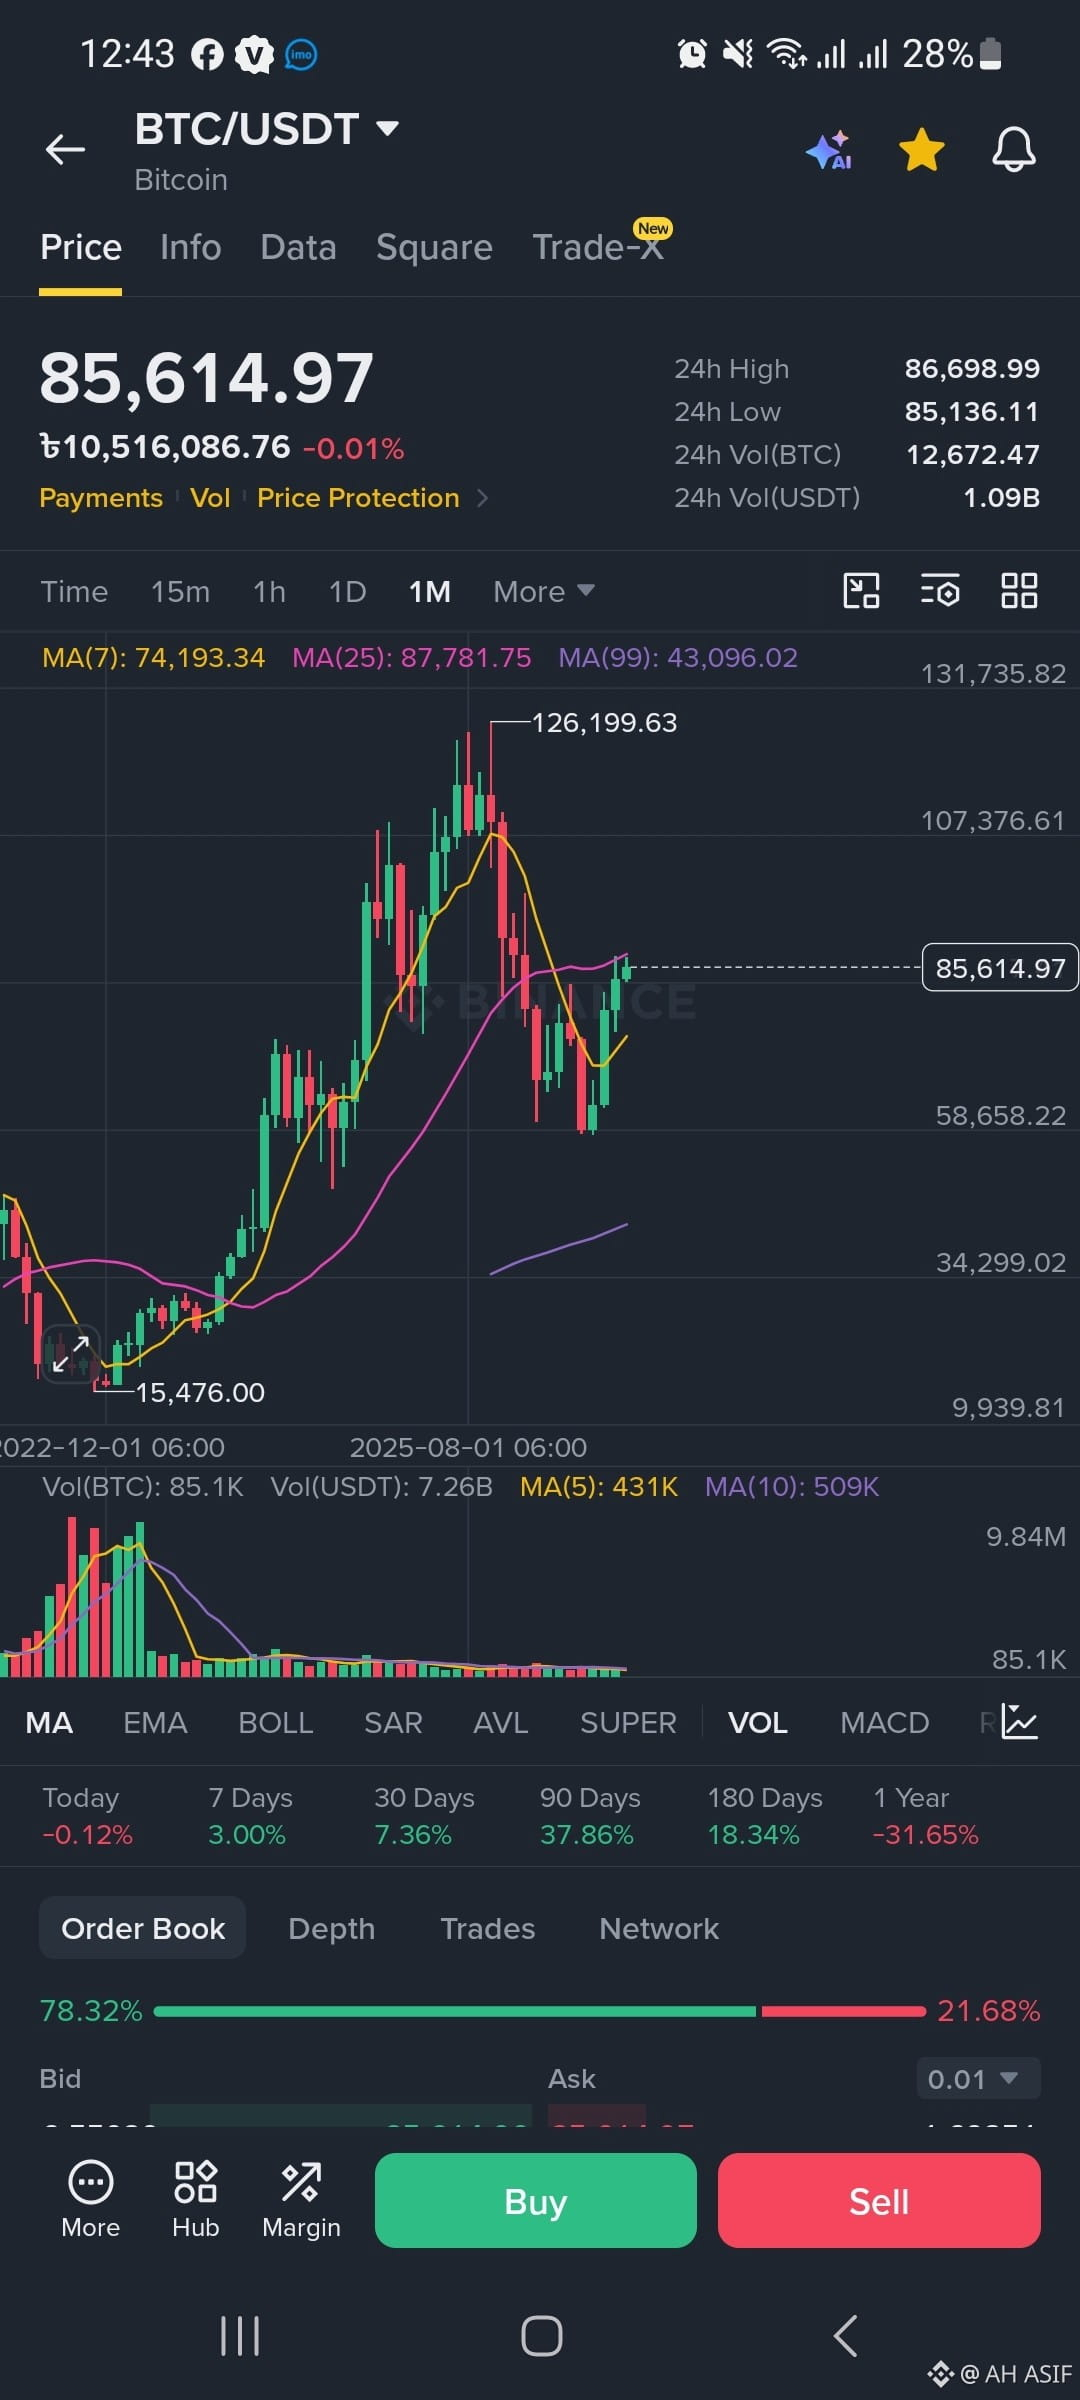
Important Resistance Areas
The main levels visible are:
$86.7K: Current 24-hour high
$87.8K: MA(25)
$100K+: Psychological/technical resistance area
$107K: Major chart level
$126.2K: Previous major high shown on the chart
A sustained move above $87K–$88K would make the chart look stronger. A move toward the previous high would require BTC to overcome several resistance areas along the way.
📊 Volume
The volume shown at the bottom has become much smaller compared with the huge volume during the earlier major price movements.
That means the current recovery should be watched together with volume confirmation. A strong price breakout accompanied by increasing volume is generally more convincing than a breakout with weak volume.
#BinanceLaunchesBinanceIntelligence
Important Resistance Areas
The main levels visible are:
$86.7K: Current 24-hour high
$87.8K: MA(25)
$100K+: Psychological/technical resistance area
$107K: Major chart level
$126.2K: Previous major high shown on the chart
A sustained move above $87K–$88K would make the chart look stronger. A move toward the previous high would require BTC to overcome several resistance areas along the way.
📊 Volume
The volume shown at the bottom has become much smaller compared with the huge volume during the earlier major price movements.
That means the current recovery should be watched together with volume confirmation. A strong price breakout accompanied by increasing volume is generally more convincing than a breakout with weak volume.
Important Resistance Areas
The main levels visible are:
$86.7K: Current 24-hour high
$87.8K: MA(25)
$100K+: Psychological/technical resistance area
$107K: Major chart level
$126.2K: Previous major high shown on the chart
A sustained move above $87K–$88K would make the chart look stronger. A move toward the previous high would require BTC to overcome several resistance areas along the way.
📊 Volume
The volume shown at the bottom has become much smaller compared with the huge volume during the earlier major price movements.
That means the current recovery should be watched together with volume confirmation. A strong price breakout accompanied by increasing volume is generally more convincing than a breakout with weak volume.
75
·
--
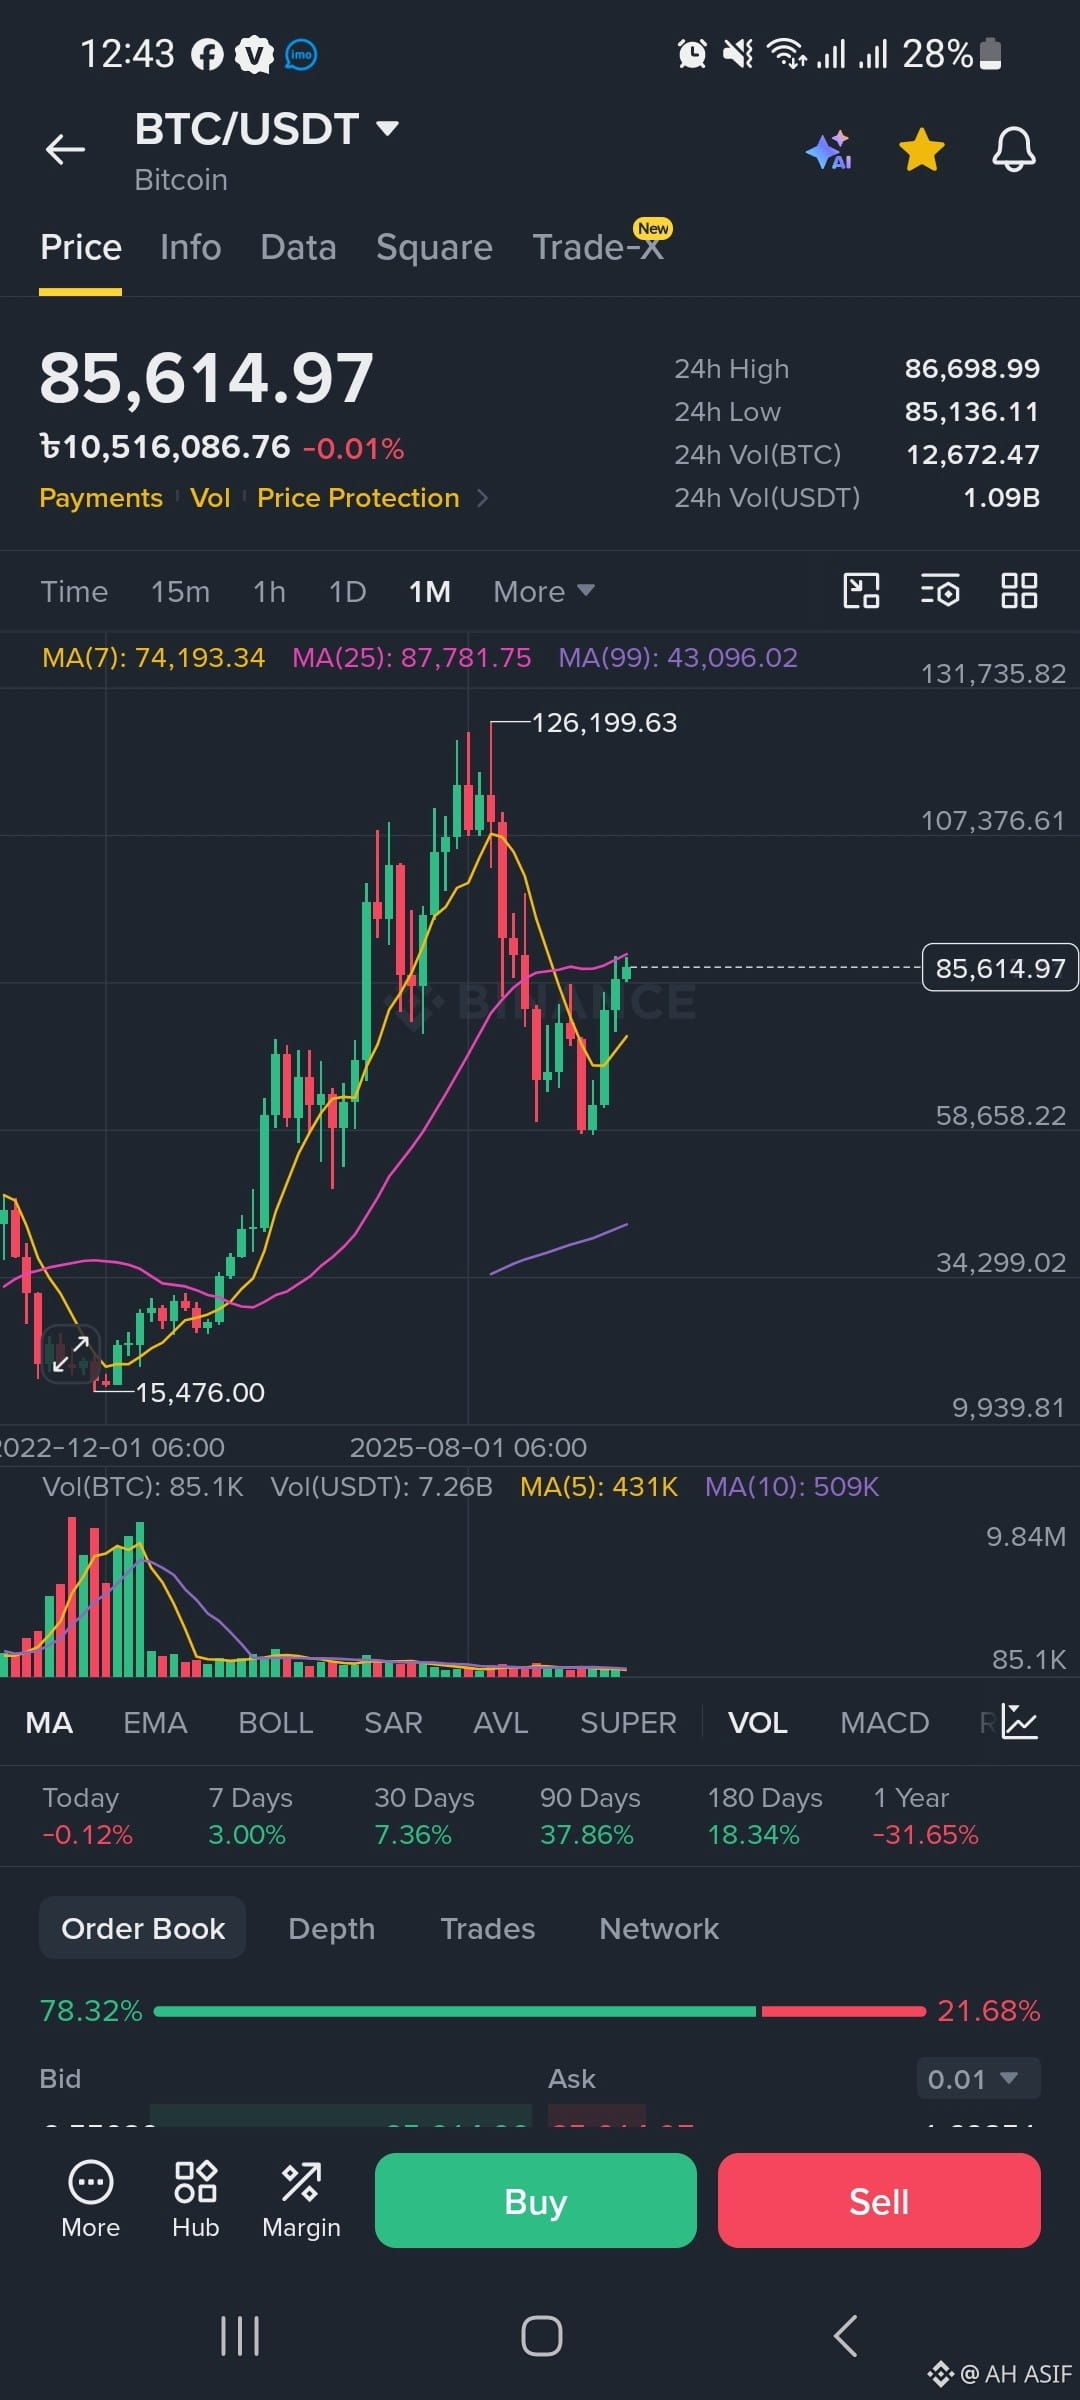
Sure. Here is a detailed English analysis of the BTC/USDT chart in your screenshot:
📊 Bitcoin (BTC/USDT) — Chart Analysis
The screenshot shows Bitcoin trading around $85,614.97 against USDT.
Current price: $85,614.97
24H High: $86,698.99
24H Low: $85,136.11
24H Volume: ~12,672 BTC / $1.09B USDT
🕯️ Timeframe: 1 Month (1M)
This is a monthly candlestick chart, so each candle represents approximately one month. That means the chart is useful for understanding the long-term trend, rather than short-term entries.
Bitcoin previously reached a major high of approximately $126,199.63 on this chart. After that peak, BTC experienced a significant correction and dropped toward the $58,000 area.
More recently, BTC has recovered strongly from that region and is now around $85.6K.
📈 Moving Averages
The screenshot shows:
MA(7): $74,193
MA(25): $87,781
MA(99): $43,096
The current price is above the MA(7), which is generally a positive sign for the shorter part of this monthly trend.
However, BTC is currently slightly below the MA(25) at ~$87,782. That makes the $87K–$88K area important resistance.
The MA(99) is much lower, around $43K, indicating that the longer-term structure shown on this chart remains considerably higher than that average.
🟢 Important Support Areas
Based on the visible chart, some important areas to watch are:
$85K: Current area
$80K–$82K: Potential near-term support
$74K: MA(7) support area
$58K–$60K: Major previous support zone
If BTC continues falling, the $58K–$60K region would be much more significant than the smaller short-term levels.
Sure. Here is a detailed English analysis of the BTC/USDT chart in your screenshot:
📊 Bitcoin (BTC/USDT) — Chart Analysis
The screenshot shows Bitcoin trading around $85,614.97 against USDT.
Current price: $85,614.97
24H High: $86,698.99
24H Low: $85,136.11
24H Volume: ~12,672 BTC / $1.09B USDT
🕯️ Timeframe: 1 Month (1M)
This is a monthly candlestick chart, so each candle represents approximately one month. That means the chart is useful for understanding the long-term trend, rather than short-term entries.
Bitcoin previously reached a major high of approximately $126,199.63 on this chart. After that peak, BTC experienced a significant correction and dropped toward the $58,000 area.
More recently, BTC has recovered strongly from that region and is now around $85.6K.
📈 Moving Averages
The screenshot shows:
MA(7): $74,193
MA(25): $87,781
MA(99): $43,096
The current price is above the MA(7), which is generally a positive sign for the shorter part of this monthly trend.
However, BTC is currently slightly below the MA(25) at ~$87,782. That makes the $87K–$88K area important resistance.
The MA(99) is much lower, around $43K, indicating that the longer-term structure shown on this chart remains considerably higher than that average.
🟢 Important Support Areas
Based on the visible chart, some important areas to watch are:
$85K: Current area
$80K–$82K: Potential near-term support
$74K: MA(7) support area
$58K–$60K: Major previous support zone
If BTC continues falling, the $58K–$60K region would be much more significant than the smaller short-term levels.
📊 Bitcoin (BTC/USDT) — Chart Analysis
The screenshot shows Bitcoin trading around $85,614.97 against USDT.
Current price: $85,614.97
24H High: $86,698.99
24H Low: $85,136.11
24H Volume: ~12,672 BTC / $1.09B USDT
🕯️ Timeframe: 1 Month (1M)
This is a monthly candlestick chart, so each candle represents approximately one month. That means the chart is useful for understanding the long-term trend, rather than short-term entries.
Bitcoin previously reached a major high of approximately $126,199.63 on this chart. After that peak, BTC experienced a significant correction and dropped toward the $58,000 area.
More recently, BTC has recovered strongly from that region and is now around $85.6K.
📈 Moving Averages
The screenshot shows:
MA(7): $74,193
MA(25): $87,781
MA(99): $43,096
The current price is above the MA(7), which is generally a positive sign for the shorter part of this monthly trend.
However, BTC is currently slightly below the MA(25) at ~$87,782. That makes the $87K–$88K area important resistance.
The MA(99) is much lower, around $43K, indicating that the longer-term structure shown on this chart remains considerably higher than that average.
🟢 Important Support Areas
Based on the visible chart, some important areas to watch are:
$85K: Current area
$80K–$82K: Potential near-term support
$74K: MA(7) support area
$58K–$60K: Major previous support zone
If BTC continues falling, the $58K–$60K region would be much more significant than the smaller short-term levels.
104
Connectez-vous pour découvrir plus de contenu
Rejoignez la communauté mondiale des adeptes de cryptomonnaies sur Binance Square
⚡️ Suviez les dernières informations importantes sur les cryptomonnaies.
💬 Jugé digne de confiance par la plus grande plateforme d’échange de cryptomonnaies au monde.
👍 Découvrez les connaissances que partagent les créateurs vérifiés.
Adresse e-mail/Nº de téléphone
Sujets d’actualité
FedMinutesFocusOnOctoberPause
24,616 vues
495 mentions
#fedminutesfocusonoctoberpause
🚨 OCTOBER FED HIKE ODDS COLLAPSE TO 21.6%… Is $BTC About to React? 👀
The Fed is about to give markets another major clue.
Investors are waiting for today’s FOMC minutes — and the biggest question is whether October brings another rate hike… or a pause.
Right now, the odds of a 25-basis-point October hike have fallen to just 21.6%.
That’s a huge shift in expectations.
But here’s what makes this interesting… 👀
The Fed raised rates to 3.75%–4.00% in September, but recent weakness in jobs data and softer inflation have made another immediate hike look less certain.
And for crypto, this matters.
A Fed pause could reduce pressure on financial conditions and potentially improve risk appetite.
That could become a tailwind for BTC
But there’s a catch…
Bitcoin is already under pressure as the dollar and Treasury yields move higher.
So tonight’s minutes could become a volatility trigger.
Dovish Fed → liquidity hopes → bullish .
BTC narrative?
Hawkish Fed → higher-rate fears → more pressure on risk assets?
The real question:
Is October becoming the pause Bitcoin bulls have been waiting for… or could the Fed surprise the market again? 👀
Watch BTC + Fed expectations + Treasury yields closely.
#FederalReserve #Fed #Crypto #InterestRates
$ETH
$SOL
Shae Cassler Sw9r
·17 mentions J’aime
·34.1k vues
BinanceLaunchesBinanceIntelligence
944,148 vues
5,751 mentions
EvernorthDelaysNasdaqDebutToOct12
4 vues
13 mentions