

Bart Bottex skig
4 Publications

Bart Bottex skig
Signaler
Bloquer l’utilisateur
Ouvert au trading
Trade occasionnellement
2.3 an(s)
1 Suivis
1 Abonnés
3 J’aime
Publications
Portefeuille
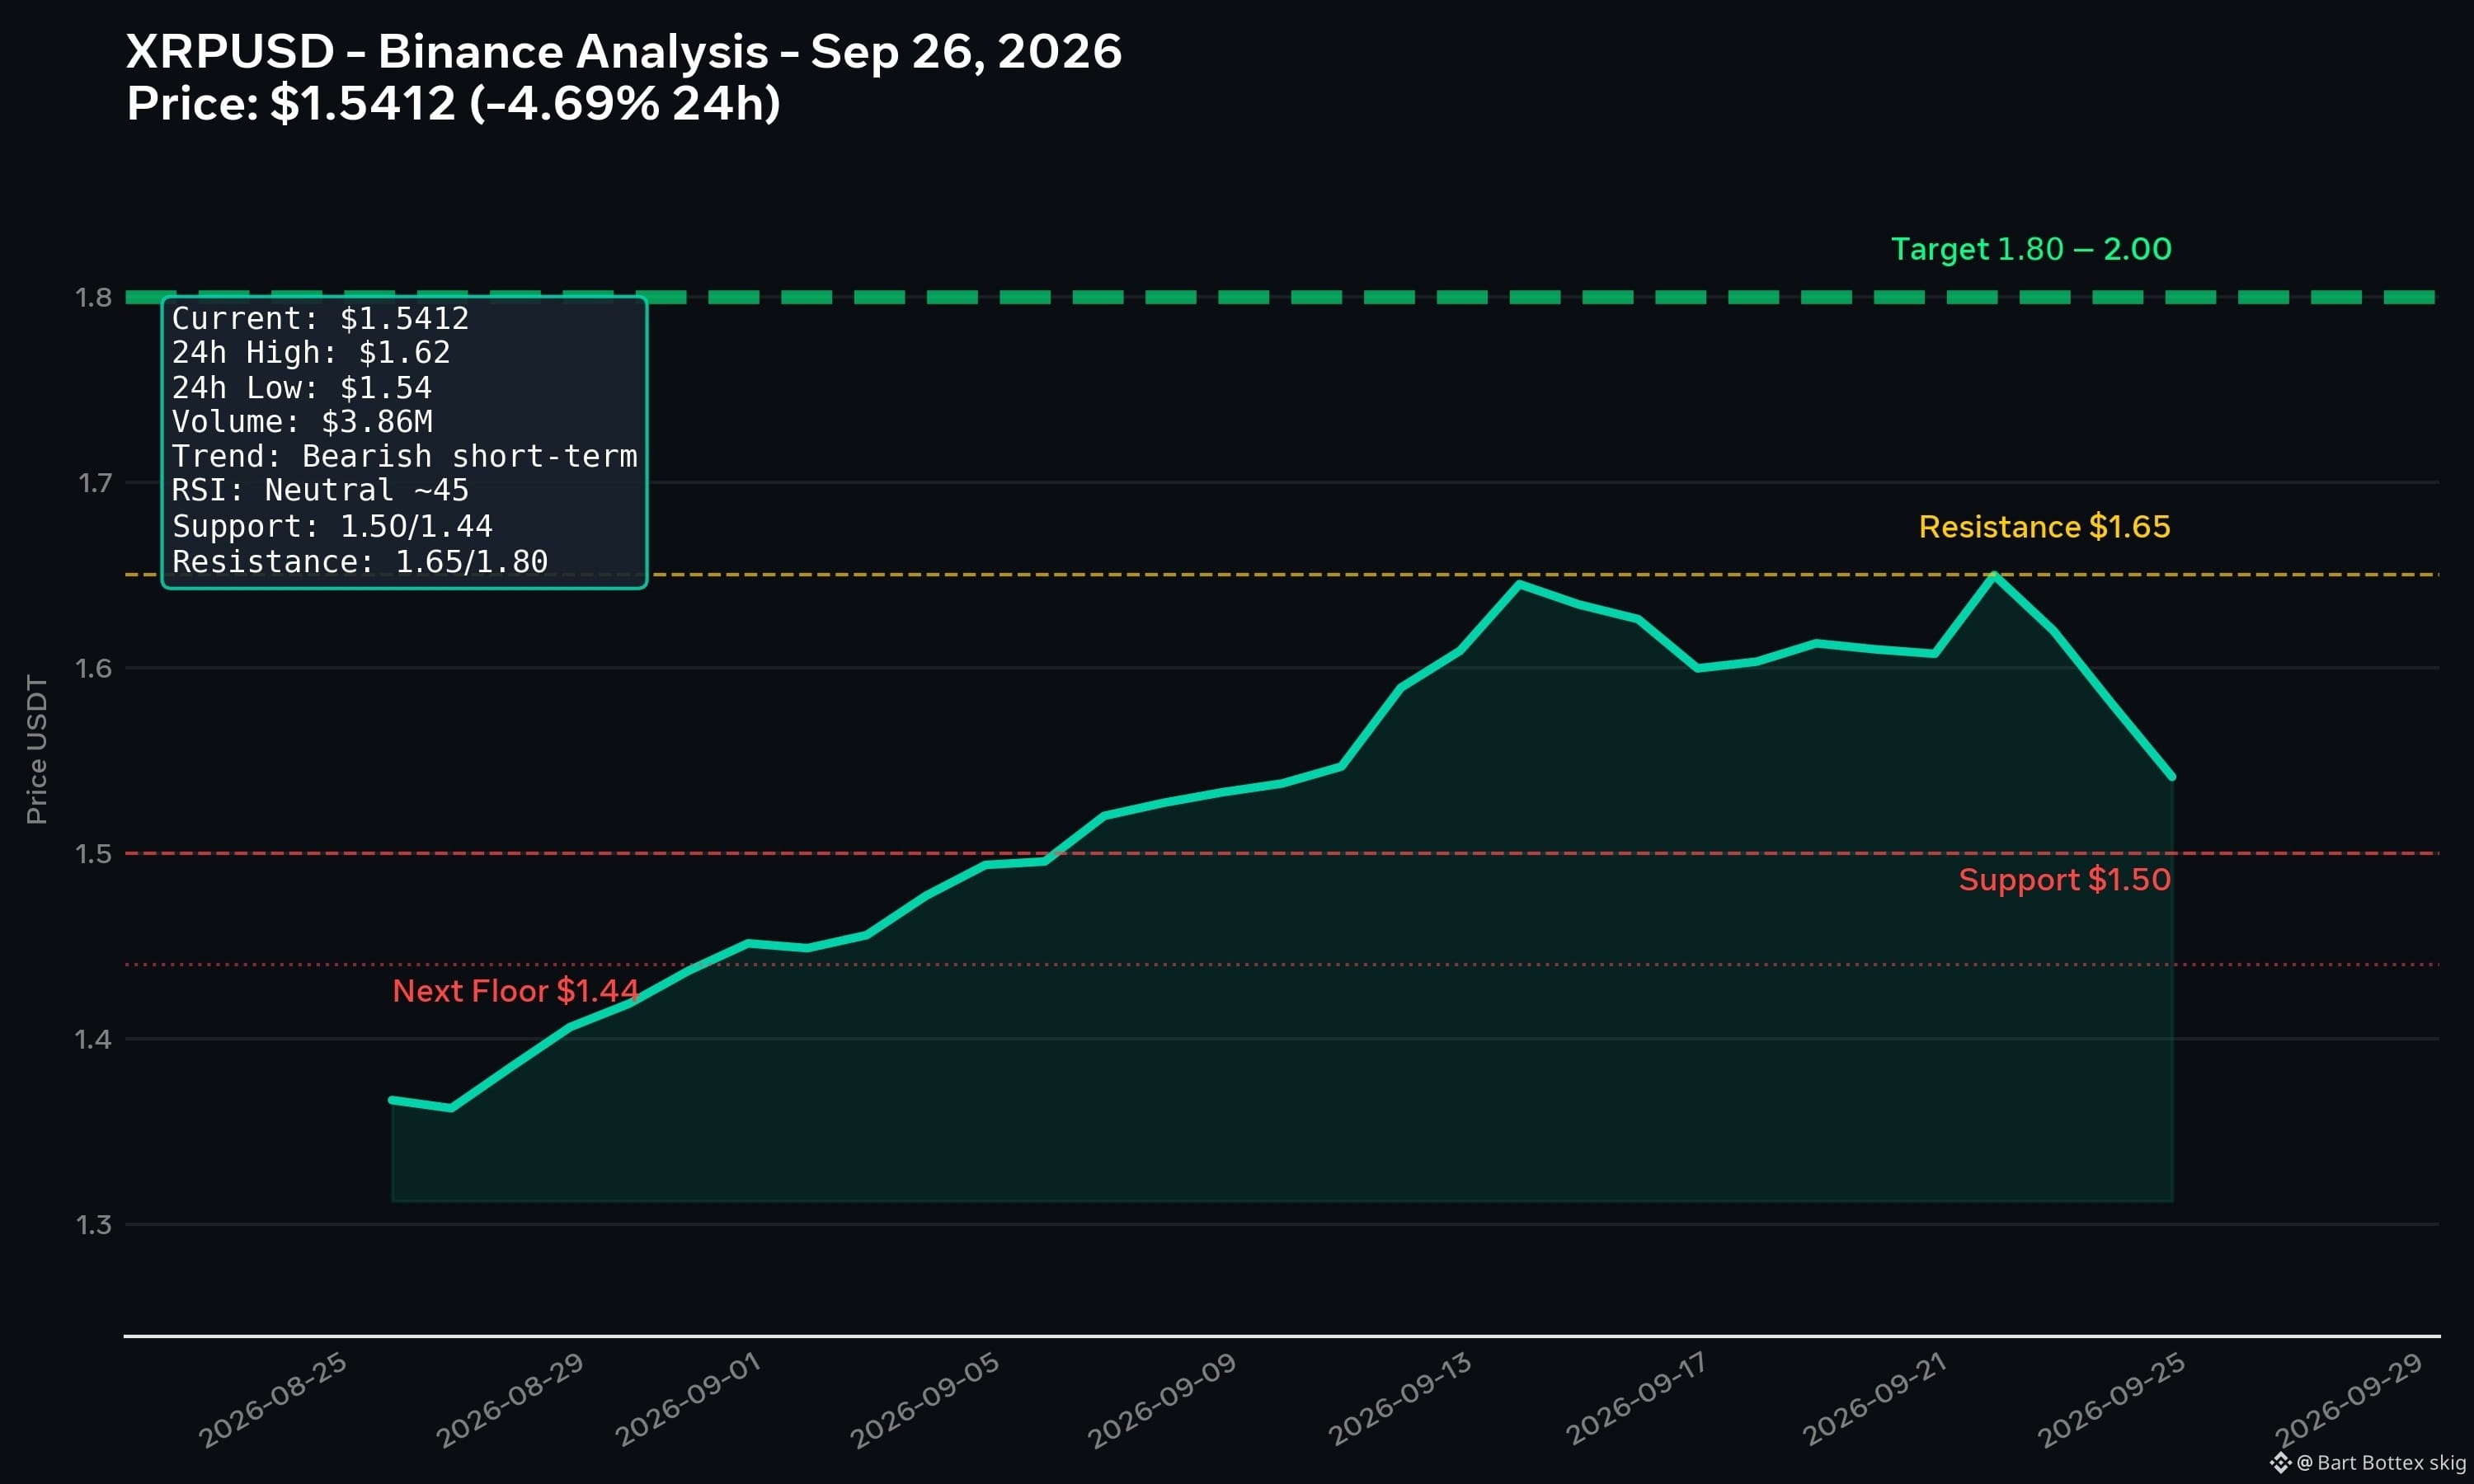
$XRP *Current Price: $1.5412 (-4.69% 24h)* 086e
*5-Point Analysis:*
1. *Price Action:* XRP touched $1.65 earlier this week then dropped to $1.54 today. Holding above $1.50 is critical
2. *Support:* $1.50 strong support — rebound held firm there. If breaks, next floor $1.44
3. *Resistance:* $1.65 is main resistance. Break above $1.65 opens path to $2.00
4. *Target:* Analysts expecting $1.80 by end of week if bounce holds, $2.00 if Batch V1.1 upgrade on Sep 29 is bullish
5. *Risk:* Open Interest high near 400M XRP — leverage fragile. Watch Binance funding rates. Daily close above $1.53 confirms breakout, below $1.50 = bearish to $1.35 077dead9
*Binance Strategy:* Wait for $1.50 hold + volume. Entry on daily close >$1.55, SL $1.44, TP1 $1.65, TP2 $1.80, TP3 $2.00. Not financial advice.
{spot}(XRPUSDT)
#PolymarketBankFailureBetsDrawFDICConcern #QNTRises39% #BitwiseFilesToListNEARETFOnNYSEArca #CircleMints500MUSDCOnSolana
$XRP *Current Price: $1.5412 (-4.69% 24h)* 086e
*5-Point Analysis:*
1. *Price Action:* XRP touched $1.65 earlier this week then dropped to $1.54 today. Holding above $1.50 is critical
2. *Support:* $1.50 strong support — rebound held firm there. If breaks, next floor $1.44
3. *Resistance:* $1.65 is main resistance. Break above $1.65 opens path to $2.00
4. *Target:* Analysts expecting $1.80 by end of week if bounce holds, $2.00 if Batch V1.1 upgrade on Sep 29 is bullish
5. *Risk:* Open Interest high near 400M XRP — leverage fragile. Watch Binance funding rates. Daily close above $1.53 confirms breakout, below $1.50 = bearish to $1.35 077dead9
*Binance Strategy:* Wait for $1.50 hold + volume. Entry on daily close >$1.55, SL $1.44, TP1 $1.65, TP2 $1.80, TP3 $2.00. Not financial advice.
#PolymarketBankFailureBetsDrawFDICConcern #QNTRises39% #BitwiseFilesToListNEARETFOnNYSEArca #CircleMints500MUSDCOnSolana
*5-Point Analysis:*
1. *Price Action:* XRP touched $1.65 earlier this week then dropped to $1.54 today. Holding above $1.50 is critical
2. *Support:* $1.50 strong support — rebound held firm there. If breaks, next floor $1.44
3. *Resistance:* $1.65 is main resistance. Break above $1.65 opens path to $2.00
4. *Target:* Analysts expecting $1.80 by end of week if bounce holds, $2.00 if Batch V1.1 upgrade on Sep 29 is bullish
5. *Risk:* Open Interest high near 400M XRP — leverage fragile. Watch Binance funding rates. Daily close above $1.53 confirms breakout, below $1.50 = bearish to $1.35 077dead9
*Binance Strategy:* Wait for $1.50 hold + volume. Entry on daily close >$1.55, SL $1.44, TP1 $1.65, TP2 $1.80, TP3 $2.00. Not financial advice.
#PolymarketBankFailureBetsDrawFDICConcern #QNTRises39% #BitwiseFilesToListNEARETFOnNYSEArca #CircleMints500MUSDCOnSolana
1
22
$SOL PROFESSIONAL TECHNICAL SUMMARY*
*Exchange: Binance | Pair: SOL/USDT*
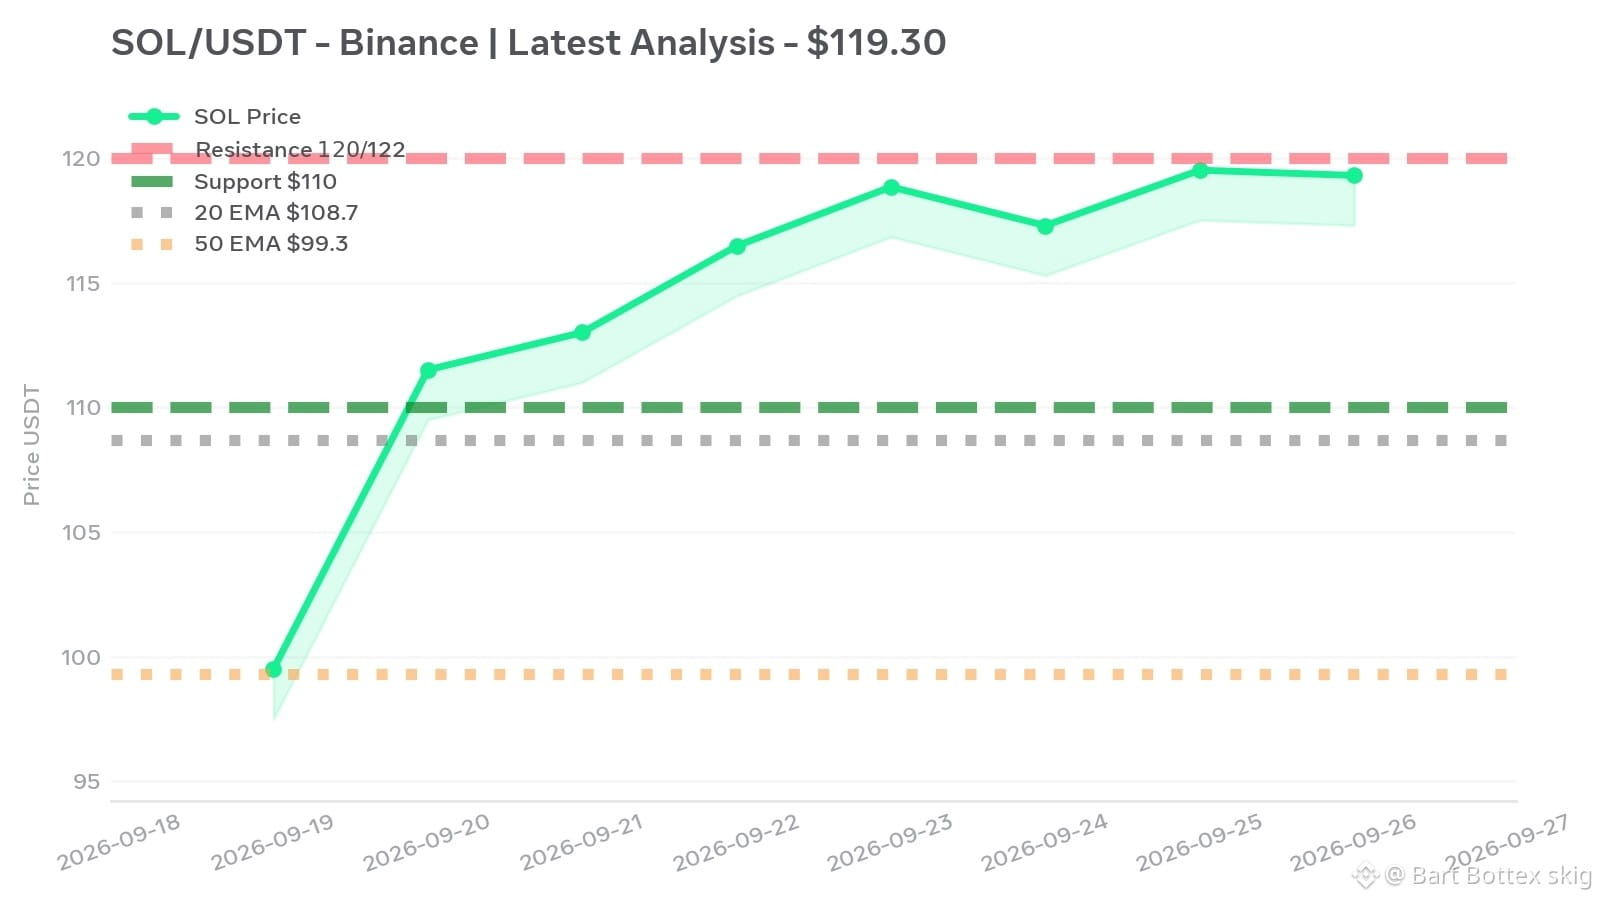
*Date: 26 September 2026 | Price: $119.30*
*Executive Summary:*
Solana maintains a strong bullish structure on the daily timeframe, trading just below the key psychological resistance of $120. While the higher-timeframe trend remains intact with a clean EMA bullish stack, short-term momentum shows signs of deceleration on intraday charts, indicating a potential consolidation or healthy pullback before the next leg up.
*Technical Breakdown:*
- *Trend:* Uptrend intact. Price trading above 20 EMA ($108.70), 50 EMA ($99.32), and 200 EMA ($91.67).
- *Momentum:* Daily RSI at 67.49 – approaching overbought but not extreme. MACD remains bullish with positive histogram (+1.01). Intraday RSI (1H: 63.81, 15M: 55.98) indicates momentum fatigue.
- *Volatility:* Trading near upper Bollinger Band ($121.98), suggesting overextension in short term.
- *Volume:* Daily volume $5.5B (+27% vs previous session), confirming buyer interest at higher levels.
*Key Levels:*
- *Resistance:* $120.00 (Psychological), $122.61 (Daily), $130.00 (Breakout Target)
- *Support:* $110.00-$115.00 (Immediate Demand), $108.70 (20 EMA), $97.69 (Trend Invalidation)
*Market Context:*
Fear & Greed Index at 71 (Greed). Total crypto market cap at $2.913T (-0.50%). BTC dominance at 58.27%, requiring altcoin rotation for continuation. Network fundamentals positive – reduced block time and 12-week institutional inflow streak.
*Outlook:*
*Bias: Bullish (7/10) – Hold/ Buy on Dips*
Immediate strategy is to avoid chasing at resistance. A daily closing above $120 with strong volume will trigger upside toward $130 and $149. A pullback toward $110-$112 presents a high-probability long opportunity. A daily close below $97.69 invalidates the bullish thesis.
*Risk:* Overbought on daily, high BTC dominance, and intraday momentum divergence.
{spot}(SOLUSDT)
#PolymarketBankFailureBetsDrawFDICConcern #BlackRockBuildsTokenizedPortfoliosForOndo #BitwiseFilesToListNEARETFOnNYSEArca #QNTRises39%
$SOL PROFESSIONAL TECHNICAL SUMMARY*
*Exchange: Binance | Pair: SOL/USDT*
*Date: 26 September 2026 | Price: $119.30*
*Executive Summary:*
Solana maintains a strong bullish structure on the daily timeframe, trading just below the key psychological resistance of $120. While the higher-timeframe trend remains intact with a clean EMA bullish stack, short-term momentum shows signs of deceleration on intraday charts, indicating a potential consolidation or healthy pullback before the next leg up.
*Technical Breakdown:*
- *Trend:* Uptrend intact. Price trading above 20 EMA ($108.70), 50 EMA ($99.32), and 200 EMA ($91.67).
- *Momentum:* Daily RSI at 67.49 – approaching overbought but not extreme. MACD remains bullish with positive histogram (+1.01). Intraday RSI (1H: 63.81, 15M: 55.98) indicates momentum fatigue.
- *Volatility:* Trading near upper Bollinger Band ($121.98), suggesting overextension in short term.
- *Volume:* Daily volume $5.5B (+27% vs previous session), confirming buyer interest at higher levels.
*Key Levels:*
- *Resistance:* $120.00 (Psychological), $122.61 (Daily), $130.00 (Breakout Target)
- *Support:* $110.00-$115.00 (Immediate Demand), $108.70 (20 EMA), $97.69 (Trend Invalidation)
*Market Context:*
Fear & Greed Index at 71 (Greed). Total crypto market cap at $2.913T (-0.50%). BTC dominance at 58.27%, requiring altcoin rotation for continuation. Network fundamentals positive – reduced block time and 12-week institutional inflow streak.
*Outlook:*
*Bias: Bullish (7/10) – Hold/ Buy on Dips*
Immediate strategy is to avoid chasing at resistance. A daily closing above $120 with strong volume will trigger upside toward $130 and $149. A pullback toward $110-$112 presents a high-probability long opportunity. A daily close below $97.69 invalidates the bullish thesis.
*Risk:* Overbought on daily, high BTC dominance, and intraday momentum divergence.
#PolymarketBankFailureBetsDrawFDICConcern #BlackRockBuildsTokenizedPortfoliosForOndo #BitwiseFilesToListNEARETFOnNYSEArca #QNTRises39%
*Exchange: Binance | Pair: SOL/USDT*
*Date: 26 September 2026 | Price: $119.30*
*Executive Summary:*
Solana maintains a strong bullish structure on the daily timeframe, trading just below the key psychological resistance of $120. While the higher-timeframe trend remains intact with a clean EMA bullish stack, short-term momentum shows signs of deceleration on intraday charts, indicating a potential consolidation or healthy pullback before the next leg up.
*Technical Breakdown:*
- *Trend:* Uptrend intact. Price trading above 20 EMA ($108.70), 50 EMA ($99.32), and 200 EMA ($91.67).
- *Momentum:* Daily RSI at 67.49 – approaching overbought but not extreme. MACD remains bullish with positive histogram (+1.01). Intraday RSI (1H: 63.81, 15M: 55.98) indicates momentum fatigue.
- *Volatility:* Trading near upper Bollinger Band ($121.98), suggesting overextension in short term.
- *Volume:* Daily volume $5.5B (+27% vs previous session), confirming buyer interest at higher levels.
*Key Levels:*
- *Resistance:* $120.00 (Psychological), $122.61 (Daily), $130.00 (Breakout Target)
- *Support:* $110.00-$115.00 (Immediate Demand), $108.70 (20 EMA), $97.69 (Trend Invalidation)
*Market Context:*
Fear & Greed Index at 71 (Greed). Total crypto market cap at $2.913T (-0.50%). BTC dominance at 58.27%, requiring altcoin rotation for continuation. Network fundamentals positive – reduced block time and 12-week institutional inflow streak.
*Outlook:*
*Bias: Bullish (7/10) – Hold/ Buy on Dips*
Immediate strategy is to avoid chasing at resistance. A daily closing above $120 with strong volume will trigger upside toward $130 and $149. A pullback toward $110-$112 presents a high-probability long opportunity. A daily close below $97.69 invalidates the bullish thesis.
*Risk:* Overbought on daily, high BTC dominance, and intraday momentum divergence.
#PolymarketBankFailureBetsDrawFDICConcern #BlackRockBuildsTokenizedPortfoliosForOndo #BitwiseFilesToListNEARETFOnNYSEArca #QNTRises39%
89
$ETH Binance Analysis*
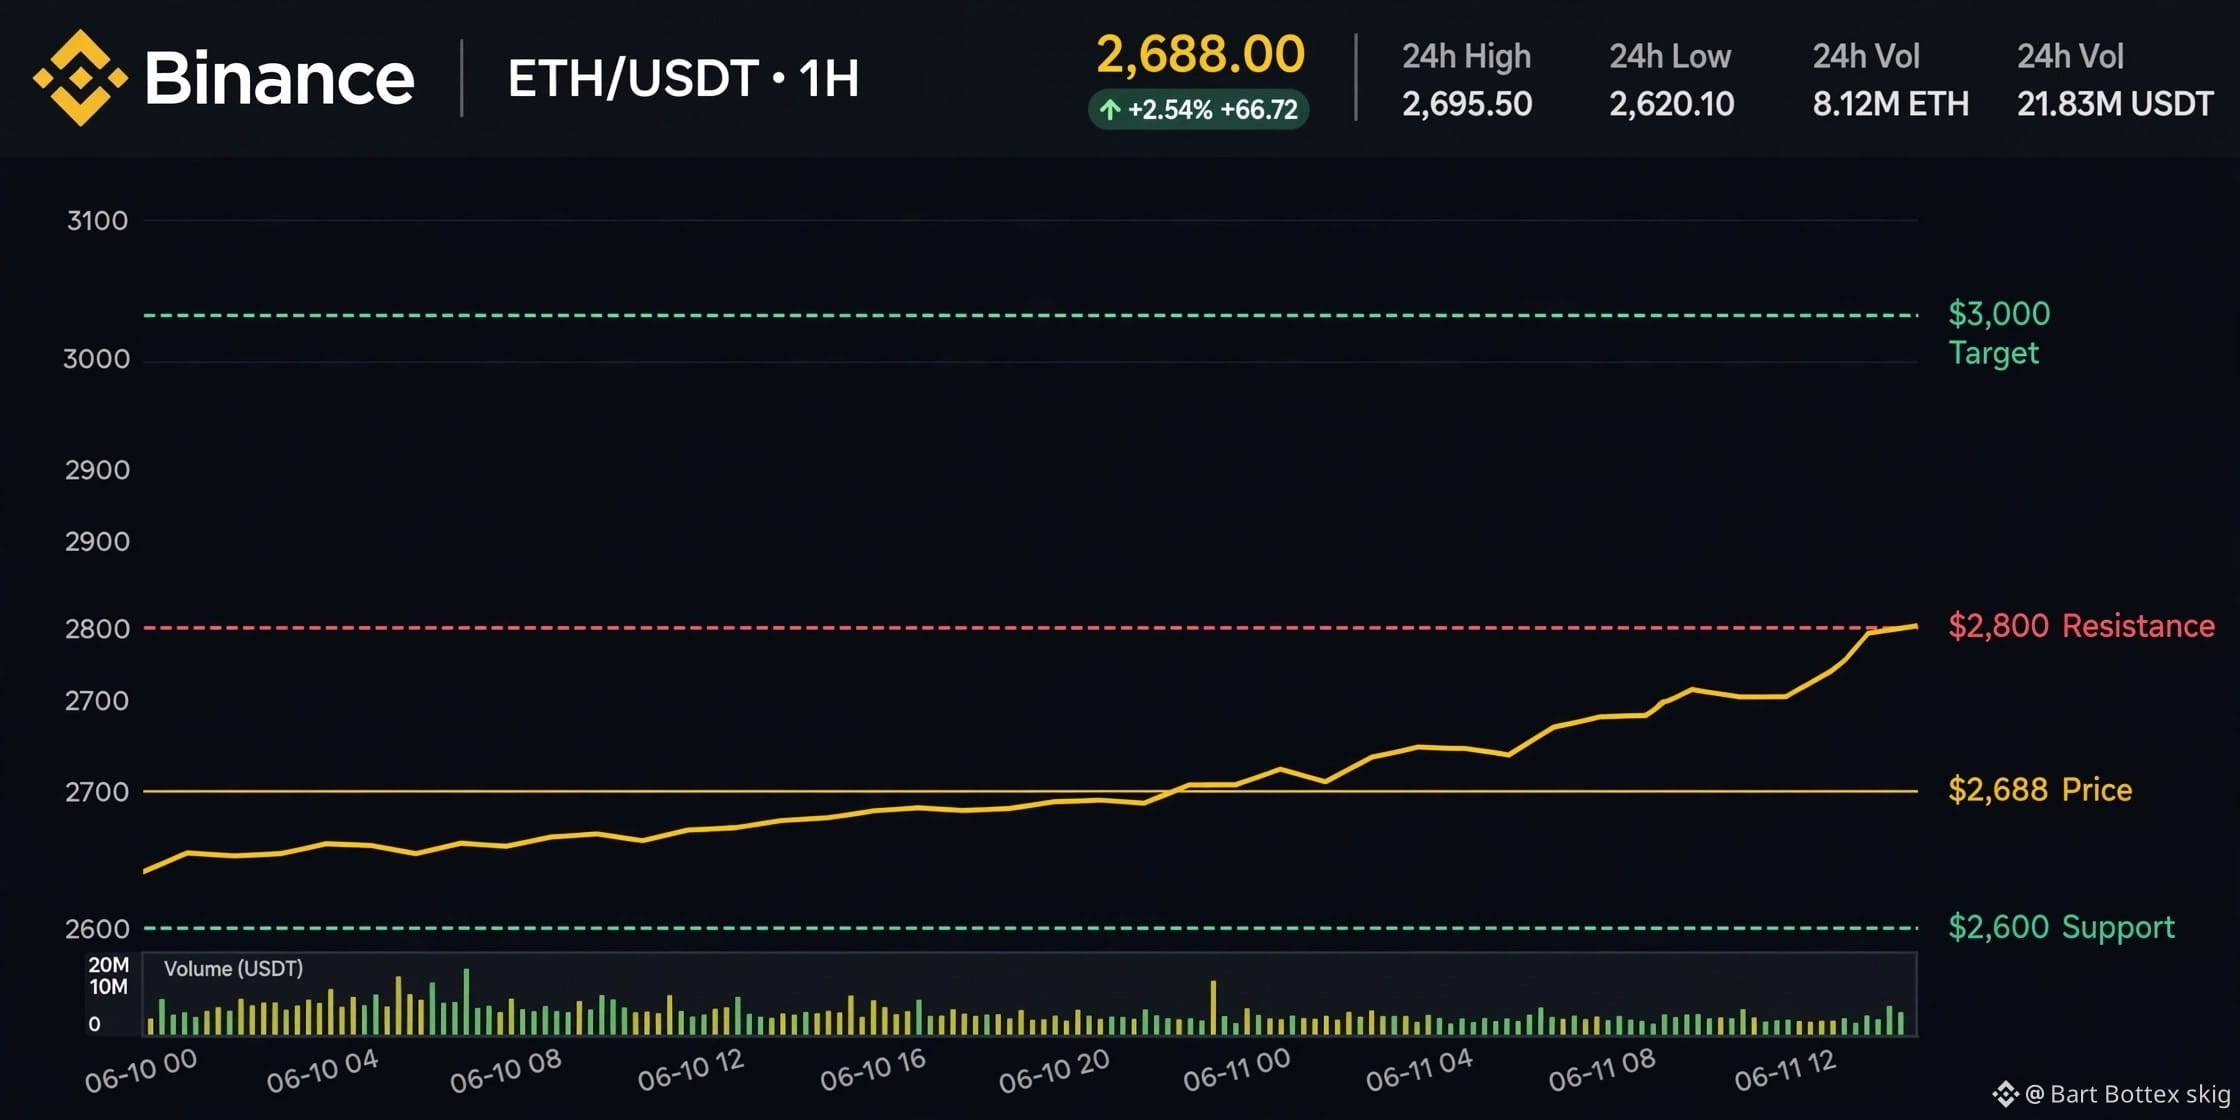
*Date: 26 September 2026 | Price: $2,688.42*
*Market Overview:*
Ethereum is trading at $2,688.42, up +0.25% for the day. After hitting $2,787 on September 23rd (highest since January), ETH is consolidating between $2,600 and $2,800. The coin has recovered 78% from its June low of $1,508.
*Key Levels:*
Support 1: $2,600 - Strong immediate support
Support 2: $2,561 - 20-Day EMA
Breakout Level: $2,540 - Must hold to keep bullish structure
Resistance 1: $2,800 - Recent rejection point
Resistance 2: $2,950
Main Target: $3,000
*Technical Indicators:*
Weekly RSI is at 64.11, showing bullish momentum but not yet overbought. Price is holding above the 100-week EMA at $2,558 and 200-week EMA at $2,469, which is a bullish sign. The 50-day EMA has crossed above the 100-day and 200-day EMA, indicating long-term trend strength. Weekly RSI is holding above 50 midline.
*On-Chain & Sentiment:*
Exchange netflows are negative, meaning holders are moving ETH to cold storage and staking instead of selling. Stablecoin netflows onto Binance are rising sharply, suggesting traders are keeping dry powder ready to buy. ETF inflows of $746.5M were recorded recently. Fear & Greed Index is at 74 (Greed).
*Trading Plan for Binance Spot:*
Buy Zone: $2,600 - $2,630
Stop Loss: Daily close below $2,540
Target 1: $2,800 (+4.1%)
Target 2: $3,000 (+11.6%)
Invalidation: If ETH closes below $2,540, the breakout fails and $2,458 will be next support.
Bias remains constructive as long as ETH stays above $2,540 - $2,600 zone.
{spot}(ETHUSDT)
#PolymarketBankFailureBetsDrawFDICConcern #BlackRockBuildsTokenizedPortfoliosForOndo #SECSaysBuybacksUpgradesDontMakeTokenSecurity #QNTRises39%
$ETH Binance Analysis*
*Date: 26 September 2026 | Price: $2,688.42*
*Market Overview:*
Ethereum is trading at $2,688.42, up +0.25% for the day. After hitting $2,787 on September 23rd (highest since January), ETH is consolidating between $2,600 and $2,800. The coin has recovered 78% from its June low of $1,508.
*Key Levels:*
Support 1: $2,600 - Strong immediate support
Support 2: $2,561 - 20-Day EMA
Breakout Level: $2,540 - Must hold to keep bullish structure
Resistance 1: $2,800 - Recent rejection point
Resistance 2: $2,950
Main Target: $3,000
*Technical Indicators:*
Weekly RSI is at 64.11, showing bullish momentum but not yet overbought. Price is holding above the 100-week EMA at $2,558 and 200-week EMA at $2,469, which is a bullish sign. The 50-day EMA has crossed above the 100-day and 200-day EMA, indicating long-term trend strength. Weekly RSI is holding above 50 midline.
*On-Chain & Sentiment:*
Exchange netflows are negative, meaning holders are moving ETH to cold storage and staking instead of selling. Stablecoin netflows onto Binance are rising sharply, suggesting traders are keeping dry powder ready to buy. ETF inflows of $746.5M were recorded recently. Fear & Greed Index is at 74 (Greed).
*Trading Plan for Binance Spot:*
Buy Zone: $2,600 - $2,630
Stop Loss: Daily close below $2,540
Target 1: $2,800 (+4.1%)
Target 2: $3,000 (+11.6%)
Invalidation: If ETH closes below $2,540, the breakout fails and $2,458 will be next support.
Bias remains constructive as long as ETH stays above $2,540 - $2,600 zone.
#PolymarketBankFailureBetsDrawFDICConcern #BlackRockBuildsTokenizedPortfoliosForOndo #SECSaysBuybacksUpgradesDontMakeTokenSecurity #QNTRises39%
*Date: 26 September 2026 | Price: $2,688.42*
*Market Overview:*
Ethereum is trading at $2,688.42, up +0.25% for the day. After hitting $2,787 on September 23rd (highest since January), ETH is consolidating between $2,600 and $2,800. The coin has recovered 78% from its June low of $1,508.
*Key Levels:*
Support 1: $2,600 - Strong immediate support
Support 2: $2,561 - 20-Day EMA
Breakout Level: $2,540 - Must hold to keep bullish structure
Resistance 1: $2,800 - Recent rejection point
Resistance 2: $2,950
Main Target: $3,000
*Technical Indicators:*
Weekly RSI is at 64.11, showing bullish momentum but not yet overbought. Price is holding above the 100-week EMA at $2,558 and 200-week EMA at $2,469, which is a bullish sign. The 50-day EMA has crossed above the 100-day and 200-day EMA, indicating long-term trend strength. Weekly RSI is holding above 50 midline.
*On-Chain & Sentiment:*
Exchange netflows are negative, meaning holders are moving ETH to cold storage and staking instead of selling. Stablecoin netflows onto Binance are rising sharply, suggesting traders are keeping dry powder ready to buy. ETF inflows of $746.5M were recorded recently. Fear & Greed Index is at 74 (Greed).
*Trading Plan for Binance Spot:*
Buy Zone: $2,600 - $2,630
Stop Loss: Daily close below $2,540
Target 1: $2,800 (+4.1%)
Target 2: $3,000 (+11.6%)
Invalidation: If ETH closes below $2,540, the breakout fails and $2,458 will be next support.
Bias remains constructive as long as ETH stays above $2,540 - $2,600 zone.
#PolymarketBankFailureBetsDrawFDICConcern #BlackRockBuildsTokenizedPortfoliosForOndo #SECSaysBuybacksUpgradesDontMakeTokenSecurity #QNTRises39%
1
1
90
·
--
Haussier
$BTC
Latest Analysis
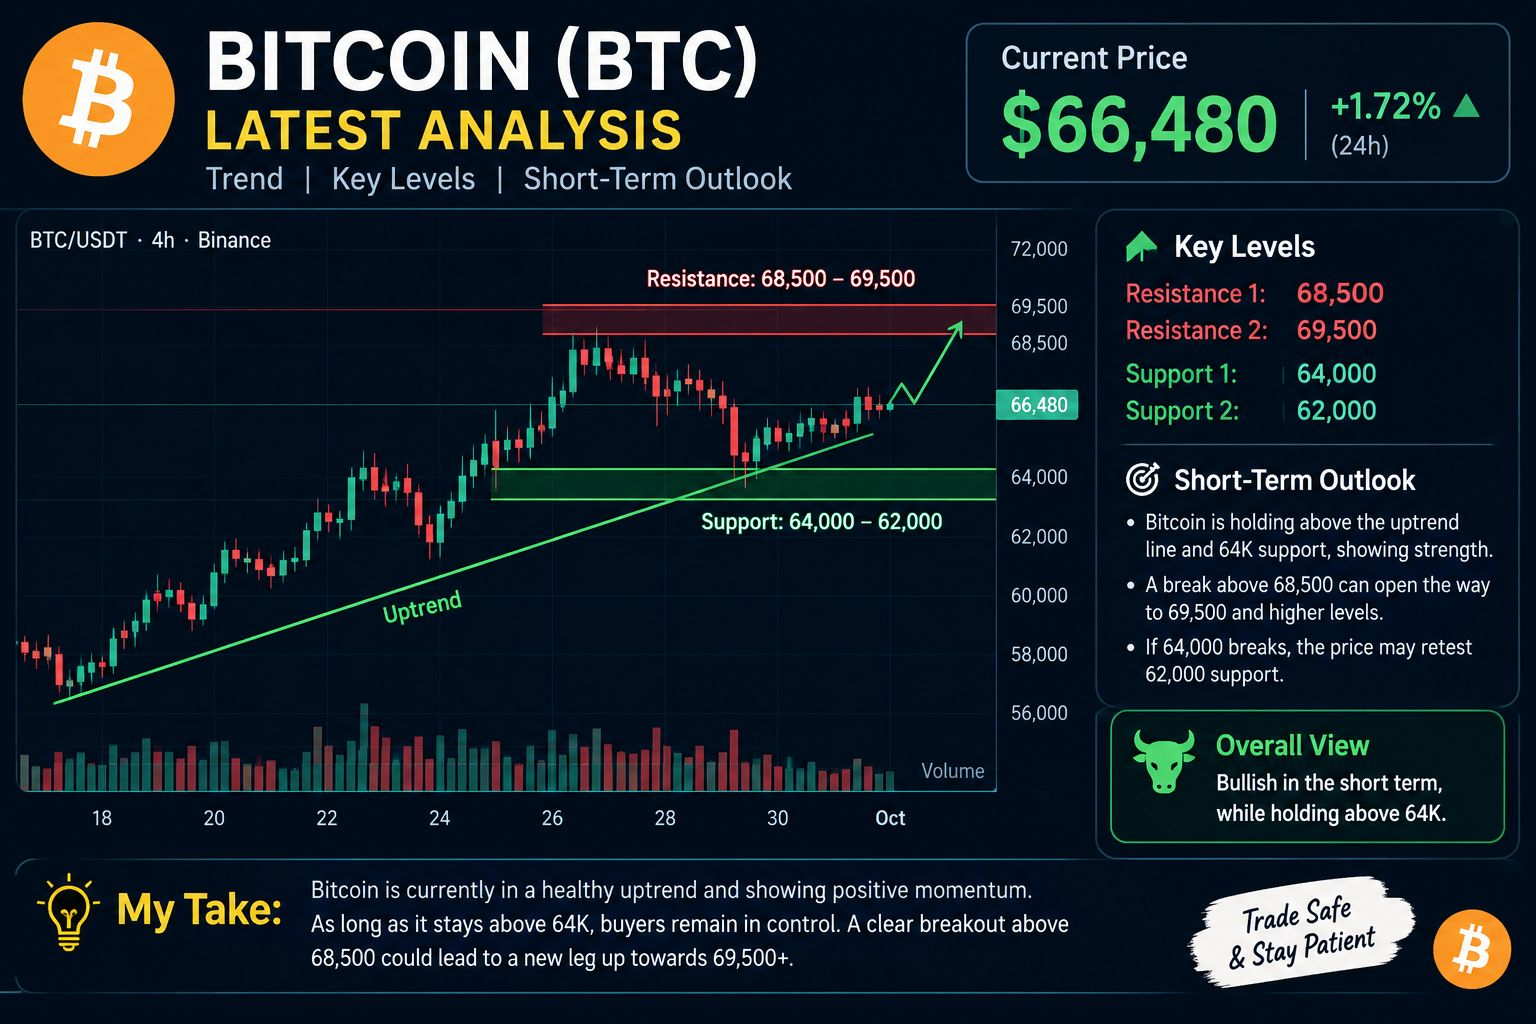
BTC ≈ $83,890
Support: $83,200–$83,300
Resistance: $85,200–$86,100
BTC recently rejected the $87K area and is consolidating around $84K. �
crypto.news +1
Above $86.1K: strength could return toward $87K.
Below $83.2K: downside risk increases toward the $81K–$82K area.
4H MACD has turned bearish, so short-term momentum is currently mixed/weak. �
crypto.news
Key level: Watch $83.2K closely for the next move.
{spot}(BTCUSDT)
#PolymarketBankFailureBetsDrawFDICConcern #BitwiseFilesToListNEARETFOnNYSEArca #SECSaysBuybacksUpgradesDontMakeTokenSecurity #QNTRises39%
$BTC
Latest Analysis
BTC ≈ $83,890
Support: $83,200–$83,300
Resistance: $85,200–$86,100
BTC recently rejected the $87K area and is consolidating around $84K. �
crypto.news +1
Above $86.1K: strength could return toward $87K.
Below $83.2K: downside risk increases toward the $81K–$82K area.
4H MACD has turned bearish, so short-term momentum is currently mixed/weak. �
crypto.news
Key level: Watch $83.2K closely for the next move.
#PolymarketBankFailureBetsDrawFDICConcern #BitwiseFilesToListNEARETFOnNYSEArca #SECSaysBuybacksUpgradesDontMakeTokenSecurity #QNTRises39%
Latest Analysis
BTC ≈ $83,890
Support: $83,200–$83,300
Resistance: $85,200–$86,100
BTC recently rejected the $87K area and is consolidating around $84K. �
crypto.news +1
Above $86.1K: strength could return toward $87K.
Below $83.2K: downside risk increases toward the $81K–$82K area.
4H MACD has turned bearish, so short-term momentum is currently mixed/weak. �
crypto.news
Key level: Watch $83.2K closely for the next move.
#PolymarketBankFailureBetsDrawFDICConcern #BitwiseFilesToListNEARETFOnNYSEArca #SECSaysBuybacksUpgradesDontMakeTokenSecurity #QNTRises39%
1
1
83
Connectez-vous pour découvrir plus de contenu
Rejoignez la communauté mondiale des adeptes de cryptomonnaies sur Binance Square
⚡️ Suviez les dernières informations importantes sur les cryptomonnaies.
💬 Jugé digne de confiance par la plus grande plateforme d’échange de cryptomonnaies au monde.
👍 Découvrez les connaissances que partagent les créateurs vérifiés.
Adresse e-mail/Nº de téléphone
Sujets d’actualité
CircleMints500MUSDCOnSolana
133,514 vues
2,506 mentions
#circlemints500musdconsolana 🚨 $500M USDC PUT SOLANA DEFI UNDER THE MICROSCOPE
Circle has added 500 million Dollar in USDC to Solana. That’s a number.. Here’s what traders really need to pay attention to. 👀
A 500 million Dollar jump in USDC supply doesn’t automatically mean 500 million dollar of buying pressure. That’s not how it works. The real story is what happens next.
🔹 Does the USDC move into lending protocols?
🔹 Does borrowing demand pick up more liquidity comes in?
🔹 Do USDC lending yields drop as supply grows?
🔹 Does all this stablecoin liquidity eventually shift into SOL and other Solana assets?
Circle says the USDC can be minted in advance and held before it hits the circulating supply. That means the headline number is the start. The actual flow after minting matters more than the announcement.
Jupiter is already a player on Solana for USDC lending and borrowing. So the utilization rate and borrowing activity there are metrics to watch.
📊 Here’s my main focus:
inflows → DeFi utilization → rising borrowing demand → SOL liquidity.
Is this 500 million Dollar going to sit idle?. Will it flow into DeFi first?. Then will it eventually move into riskier assets like SOL, JUP, KMNO?
The next few days could tell us a lot, about how Solana DeFi's reacting to this injection.
#solana #crypto #Khan62 #USDC
$KMNO $JUP $ORCA
Khan 62
·6 mentions J’aime
·5k vues
PolymarketBankFailureBetsDrawFDICConcern
120,040 vues
2,078 mentions
BlackRockBuildsTokenizedPortfoliosForOndo
116,194 vues
1,486 mentions