

Satoshi_Nakamoto_0078
16 Publications

Satoshi_Nakamoto_0078
Signaler
Bloquer l’utilisateur
Ouvert au trading
Trade occasionnellement
2.7 an(s)
1 Suivis
0 Abonnés
1 J’aime
Publications
Portefeuille
#ETH #Ethereum #ETHETFsApproved #ETHETFS #Binance ETH is currently trading around the $2.67K area, with the market showing a mixed short-term picture. ETH is holding near key support around $2,650–$2,670, while $2,700–$2,710 is an important nearby resistance zone. Market attention is also on Ethereum’s upcoming Glamsterdam upgrade, with testnet activation scheduled for October 6. Institutional activity remains notable, although recent ETH ETF flows have slowed.
#ETH #Ethereum #ETHETFsApproved #ETHETFS #Binance ETH is currently trading around the $2.67K area, with the market showing a mixed short-term picture. ETH is holding near key support around $2,650–$2,670, while $2,700–$2,710 is an important nearby resistance zone. Market attention is also on Ethereum’s upcoming Glamsterdam upgrade, with testnet activation scheduled for October 6. Institutional activity remains notable, although recent ETH ETF flows have slowed.
28
·
--
Baissier
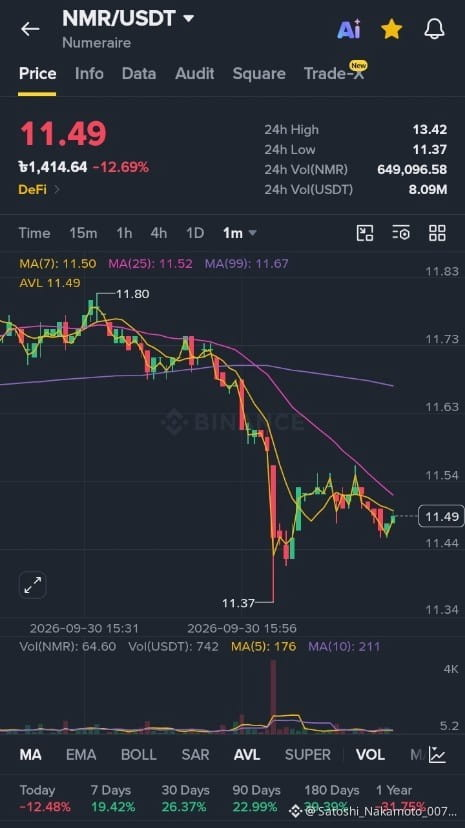
#NMR NMR’s move is a classic high-volatility breakout followed by profit-taking. Yesterday, NMR jumped more than 40%, supported by a major increase in trading volume and a breakout from the previous accumulation range. Today, that momentum reversed sharply as traders locked in profits, pushing price down toward the $11.37–$11.50 area.
#NMR NMR’s move is a classic high-volatility breakout followed by profit-taking. Yesterday, NMR jumped more than 40%, supported by a major increase in trading volume and a breakout from the previous accumulation range. Today, that momentum reversed sharply as traders locked in profits, pushing price down toward the $11.37–$11.50 area.
167
·
--
Haussier
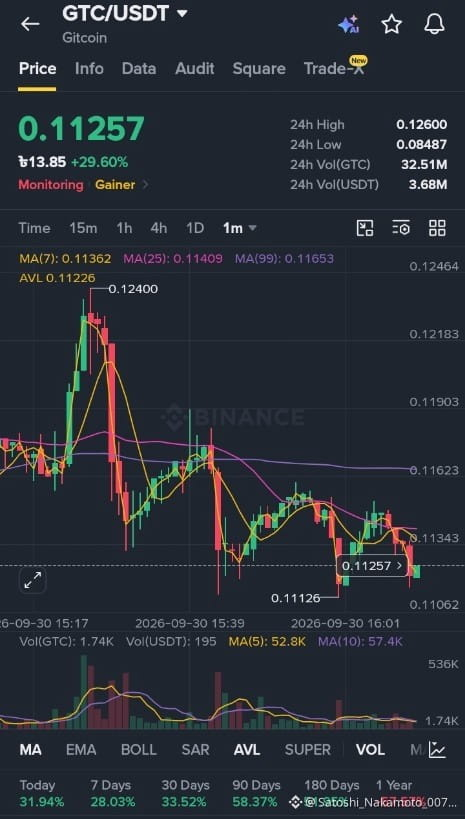
#GTC GTC/USDT is showing strong momentum, up 29.60% in 24H, but the short-term chart is facing selling pressure after reaching 0.12400. Price is now around 0.11257, with 0.1112–0.1106 as an important support zone. A recovery above 0.1140–0.1162 could improve short-term momentum, while losing 0.1106 may indicate further weakness. Volume and price reaction around these levels are worth watching closely. 📊#GTC/USDT #GTC #GTCUSDT #Binance
#GTC GTC/USDT is showing strong momentum, up 29.60% in 24H, but the short-term chart is facing selling pressure after reaching 0.12400. Price is now around 0.11257, with 0.1112–0.1106 as an important support zone. A recovery above 0.1140–0.1162 could improve short-term momentum, while losing 0.1106 may indicate further weakness. Volume and price reaction around these levels are worth watching closely. 📊#GTC/USDT #GTC #GTCUSDT #Binance
167
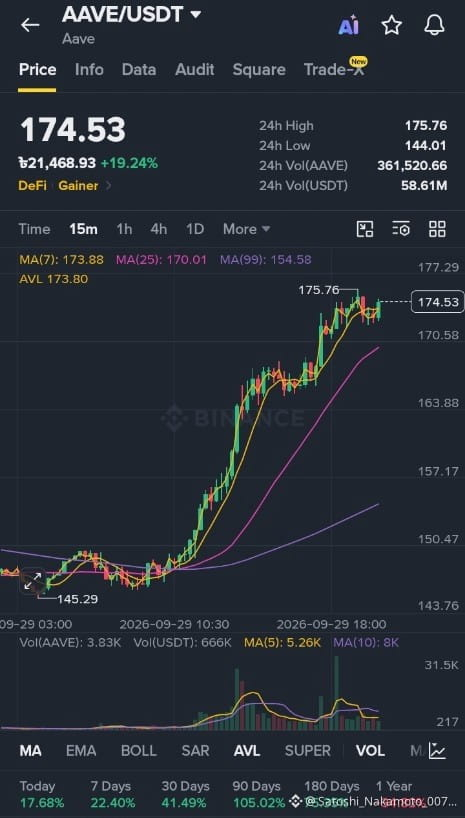
#AAVE AAVE is showing strong momentum, up around 19% in 24H, with price holding above the key moving averages on the 15M chart. The recent high at 175.76 is the main level to watch, while Aave’s V4 expansion across multiple networks adds an important fundamental angle to the move. #AAVE #AAVEUSDT.P #Binance
#AAVE AAVE is showing strong momentum, up around 19% in 24H, with price holding above the key moving averages on the 15M chart. The recent high at 175.76 is the main level to watch, while Aave’s V4 expansion across multiple networks adds an important fundamental angle to the move. #AAVE #AAVEUSDT.P #Binance
57
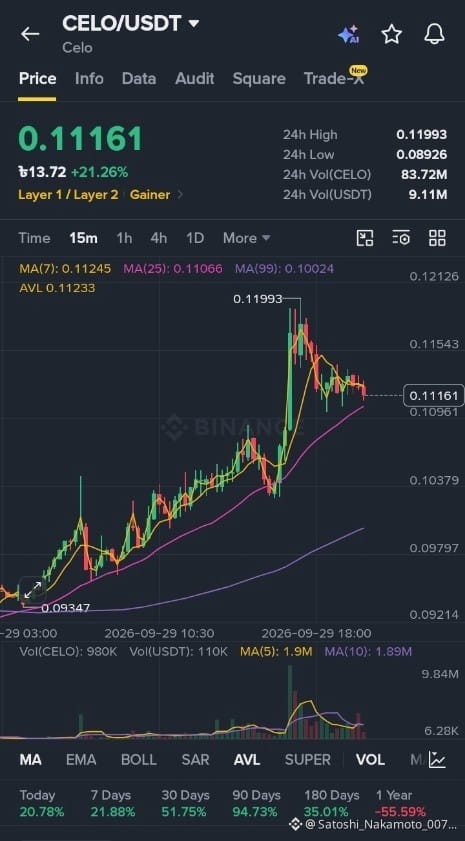
#CELO CELO is showing strong momentum, with the price up around 21% in 24H. The 15M chart is holding above the MA(25), while 0.1199 remains the key recent high to watch. Celo’s ecosystem has also seen continued stablecoin activity and new integrations, adding an interesting fundamental angle to the current price movement. #CELO #CELO/USDT #Binance
#CELO CELO is showing strong momentum, with the price up around 21% in 24H. The 15M chart is holding above the MA(25), while 0.1199 remains the key recent high to watch. Celo’s ecosystem has also seen continued stablecoin activity and new integrations, adding an interesting fundamental angle to the current price movement. #CELO #CELO/USDT #Binance
162
·
--
Haussier
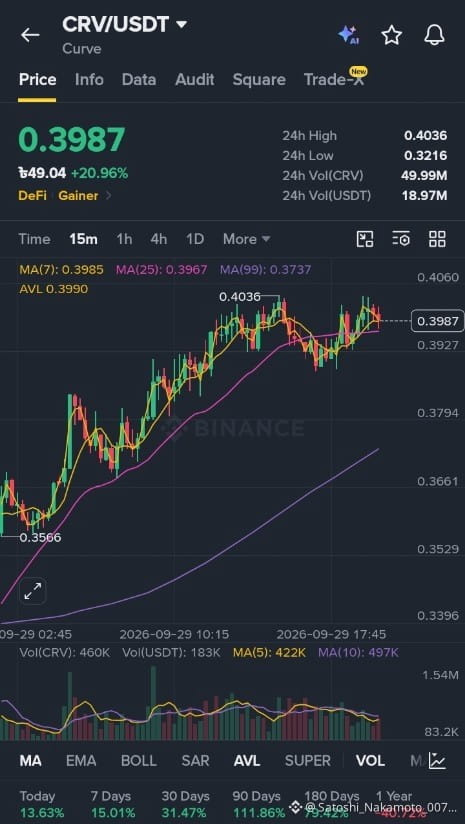
#crv CRV/USDT is showing strong bullish momentum, with price up over 20% in 24H and holding above the key moving averages. The 15M structure remains positive, while 0.4036 is the immediate resistance to watch. A breakout with strong volume could strengthen the continuation, but traders should remain cautious after such a sharp move. 📈 DYOR & manage risk.#crv #CRV/USDT
#crv CRV/USDT is showing strong bullish momentum, with price up over 20% in 24H and holding above the key moving averages. The 15M structure remains positive, while 0.4036 is the immediate resistance to watch. A breakout with strong volume could strengthen the continuation, but traders should remain cautious after such a sharp move. 📈 DYOR & manage risk.#crv #CRV/USDT
161
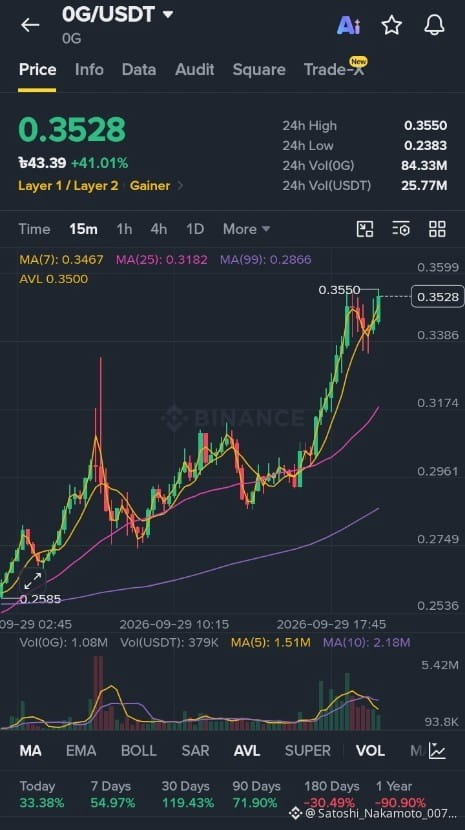
OG/USDT is showing strong bullish momentum, but price is now testing the key 0.3550 resistance. The trend remains positive above the short-term MAs, while 0.346–0.347 is the first important support. A strong breakout above 0.3550 with volume could confirm continuation; rejection there may bring a healthy pullback. Trader focus: don’t chase—wait for confirmation.#og #Binance
OG/USDT is showing strong bullish momentum, but price is now testing the key 0.3550 resistance. The trend remains positive above the short-term MAs, while 0.346–0.347 is the first important support. A strong breakout above 0.3550 with volume could confirm continuation; rejection there may bring a healthy pullback. Trader focus: don’t chase—wait for confirmation.#og #Binance
77
Article
IOTA/USDT — The Quiet Accumulation Is No Longer Quiet. 👀⚡IOTA/USDT — The Quiet Accumulation Is No Longer Quiet. 👀⚡
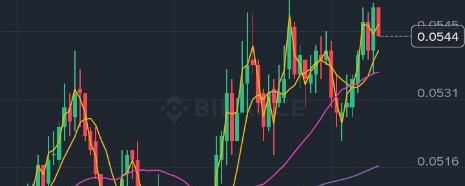
IOTA is showing a very interesting 15-minute structure: after falling to the $0.0491 area, price made a sharp recovery and pushed back toward the $0.0556 session high. At the moment shown in the chart, IOTA is around $0.0544, up 8.58% over 24 hours, with 24-hour volume of roughly 135.42M IOTA. The technical structure is notable because price is holding above MA(7) at $0.0541, MA(25) at $0.0536, and MA(99) at $0.0517 — meaning the short-, medium-, and longer-term averages shown on this timeframe are all sitting below price.
What makes the chart more interesting is the sequence: deep pullback → strong reversal → volume expansion → recovery above the moving averages → repeated tests of the upper range. The $0.0556 area is currently the clearest nearby resistance visible on the chart, while the $0.0541–$0.0536 zone becomes an important reference area if momentum starts cooling. A deeper move toward the $0.0517 region would represent a much larger loss of short-term momentum.
This move also appears consistent with broader technical momentum rather than a single obvious IOTA-specific news catalyst. A current CoinMarketCap analysis similarly attributes recent IOTA strength mainly to technical momentum, increased volume and broader altcoin rotation. �
CoinMarketCap
But here is the part many people miss: a strong green candle does not automatically mean a new trend has been confirmed. The real story is whether price can continue holding the higher structure after the initial surge. If volume fades while price repeatedly fails around the recent high, that can indicate that momentum is losing strength. On the other hand, continued higher highs and higher lows would show that buyers are maintaining control of the short-term structure.
IOTA itself has also undergone substantial technical development in 2026, including the Starfish consensus work and other protocol improvements reported by the IOTA Foundation. �
IOTA Blog
So the chart is not simply “IOTA is up 8.58%.” The more interesting observation is this: IOTA went from a $0.0491 intraday low to a $0.0556 high, while reclaiming multiple moving-average levels and maintaining elevated activity. Now the market is testing whether that recovery can develop into a sustained structure — or whether the recent surge eventually turns into a pullback.
IOTA/USDT — The Quiet Accumulation Is No Longer Quiet. 👀⚡
IOTA/USDT — The Quiet Accumulation Is No Longer Quiet. 👀⚡
IOTA is showing a very interesting 15-minute structure: after falling to the $0.0491 area, price made a sharp recovery and pushed back toward the $0.0556 session high. At the moment shown in the chart, IOTA is around $0.0544, up 8.58% over 24 hours, with 24-hour volume of roughly 135.42M IOTA. The technical structure is notable because price is holding above MA(7) at $0.0541, MA(25) at $0.0536, and MA(99) at $0.0517 — meaning the short-, medium-, and longer-term averages shown on this timeframe are all sitting below price.
What makes the chart more interesting is the sequence: deep pullback → strong reversal → volume expansion → recovery above the moving averages → repeated tests of the upper range. The $0.0556 area is currently the clearest nearby resistance visible on the chart, while the $0.0541–$0.0536 zone becomes an important reference area if momentum starts cooling. A deeper move toward the $0.0517 region would represent a much larger loss of short-term momentum.
This move also appears consistent with broader technical momentum rather than a single obvious IOTA-specific news catalyst. A current CoinMarketCap analysis similarly attributes recent IOTA strength mainly to technical momentum, increased volume and broader altcoin rotation. �
CoinMarketCap
But here is the part many people miss: a strong green candle does not automatically mean a new trend has been confirmed. The real story is whether price can continue holding the higher structure after the initial surge. If volume fades while price repeatedly fails around the recent high, that can indicate that momentum is losing strength. On the other hand, continued higher highs and higher lows would show that buyers are maintaining control of the short-term structure.
IOTA itself has also undergone substantial technical development in 2026, including the Starfish consensus work and other protocol improvements reported by the IOTA Foundation. �
IOTA Blog
So the chart is not simply “IOTA is up 8.58%.” The more interesting observation is this: IOTA went from a $0.0491 intraday low to a $0.0556 high, while reclaiming multiple moving-average levels and maintaining elevated activity. Now the market is testing whether that recovery can develop into a sustained structure — or whether the recent surge eventually turns into a pullback.
IOTA is showing a very interesting 15-minute structure: after falling to the $0.0491 area, price made a sharp recovery and pushed back toward the $0.0556 session high. At the moment shown in the chart, IOTA is around $0.0544, up 8.58% over 24 hours, with 24-hour volume of roughly 135.42M IOTA. The technical structure is notable because price is holding above MA(7) at $0.0541, MA(25) at $0.0536, and MA(99) at $0.0517 — meaning the short-, medium-, and longer-term averages shown on this timeframe are all sitting below price.
What makes the chart more interesting is the sequence: deep pullback → strong reversal → volume expansion → recovery above the moving averages → repeated tests of the upper range. The $0.0556 area is currently the clearest nearby resistance visible on the chart, while the $0.0541–$0.0536 zone becomes an important reference area if momentum starts cooling. A deeper move toward the $0.0517 region would represent a much larger loss of short-term momentum.
This move also appears consistent with broader technical momentum rather than a single obvious IOTA-specific news catalyst. A current CoinMarketCap analysis similarly attributes recent IOTA strength mainly to technical momentum, increased volume and broader altcoin rotation. �
CoinMarketCap
But here is the part many people miss: a strong green candle does not automatically mean a new trend has been confirmed. The real story is whether price can continue holding the higher structure after the initial surge. If volume fades while price repeatedly fails around the recent high, that can indicate that momentum is losing strength. On the other hand, continued higher highs and higher lows would show that buyers are maintaining control of the short-term structure.
IOTA itself has also undergone substantial technical development in 2026, including the Starfish consensus work and other protocol improvements reported by the IOTA Foundation. �
IOTA Blog
So the chart is not simply “IOTA is up 8.58%.” The more interesting observation is this: IOTA went from a $0.0491 intraday low to a $0.0556 high, while reclaiming multiple moving-average levels and maintaining elevated activity. Now the market is testing whether that recovery can develop into a sustained structure — or whether the recent surge eventually turns into a pullback.
114
·
--
Haussier
ALGO/USDT — A Sudden Breakout, But Is This Just the Beginning? 👀⚡
Algorand has suddenly become one of the coins attracting attention. ALGO is trading around $0.1369 on the 15-minute chart, showing a strong move of more than 16% over 24 hours. The interesting part is not simply the percentage gain — it is how quickly ALGO moved from a quiet consolidation zone near $0.115–$0.120 into a sharp breakout toward $0.1376.
The chart shows a clear expansion in both price and trading activity. ALGO is also trading above MA(7) at $0.1337, MA(25) at $0.1318, and MA(99) at $0.1221, which reflects strong short-term momentum. Recent market analysis has also described the move as being driven mainly by technical momentum and renewed market interest, rather than by one clearly identified ALGO-specific announcement. �
CoinMarketCap
But here comes the interesting question: Can a move like this continue, or could the price suddenly pull back?
After a rapid rise, a correction is always possible. The $0.1376 area is the current chart high, while the $0.1337 and $0.1318 areas are important technical reference points if momentum weakens. A pullback by itself would not automatically mean the project is a scam — and there is nothing in this chart alone that proves ALGO is fraudulent. Calling a move a “pump and dump” would require stronger evidence than a sudden price increase.
What makes ALGO interesting right now is the transformation of the chart: long consolidation → breakout → volume expansion → test of the recent high.
The next phase is where the story gets interesting. Will the market maintain the momentum, or will traders start taking profits and push the price back into the previous range?
One thing is certain: ALGO has gone from being relatively quiet to becoming a coin worth watching very closely. 👀 #ALGO #ALGO_USDT #ALGO/USDT #Binance
ALGO/USDT — A Sudden Breakout, But Is This Just the Beginning? 👀⚡
Algorand has suddenly become one of the coins attracting attention. ALGO is trading around $0.1369 on the 15-minute chart, showing a strong move of more than 16% over 24 hours. The interesting part is not simply the percentage gain — it is how quickly ALGO moved from a quiet consolidation zone near $0.115–$0.120 into a sharp breakout toward $0.1376.
The chart shows a clear expansion in both price and trading activity. ALGO is also trading above MA(7) at $0.1337, MA(25) at $0.1318, and MA(99) at $0.1221, which reflects strong short-term momentum. Recent market analysis has also described the move as being driven mainly by technical momentum and renewed market interest, rather than by one clearly identified ALGO-specific announcement. �
CoinMarketCap
But here comes the interesting question: Can a move like this continue, or could the price suddenly pull back?
After a rapid rise, a correction is always possible. The $0.1376 area is the current chart high, while the $0.1337 and $0.1318 areas are important technical reference points if momentum weakens. A pullback by itself would not automatically mean the project is a scam — and there is nothing in this chart alone that proves ALGO is fraudulent. Calling a move a “pump and dump” would require stronger evidence than a sudden price increase.
What makes ALGO interesting right now is the transformation of the chart: long consolidation → breakout → volume expansion → test of the recent high.
The next phase is where the story gets interesting. Will the market maintain the momentum, or will traders start taking profits and push the price back into the previous range?
One thing is certain: ALGO has gone from being relatively quiet to becoming a coin worth watching very closely. 👀 #ALGO #ALGO_USDT #ALGO/USDT #Binance
Algorand has suddenly become one of the coins attracting attention. ALGO is trading around $0.1369 on the 15-minute chart, showing a strong move of more than 16% over 24 hours. The interesting part is not simply the percentage gain — it is how quickly ALGO moved from a quiet consolidation zone near $0.115–$0.120 into a sharp breakout toward $0.1376.
The chart shows a clear expansion in both price and trading activity. ALGO is also trading above MA(7) at $0.1337, MA(25) at $0.1318, and MA(99) at $0.1221, which reflects strong short-term momentum. Recent market analysis has also described the move as being driven mainly by technical momentum and renewed market interest, rather than by one clearly identified ALGO-specific announcement. �
CoinMarketCap
But here comes the interesting question: Can a move like this continue, or could the price suddenly pull back?
After a rapid rise, a correction is always possible. The $0.1376 area is the current chart high, while the $0.1337 and $0.1318 areas are important technical reference points if momentum weakens. A pullback by itself would not automatically mean the project is a scam — and there is nothing in this chart alone that proves ALGO is fraudulent. Calling a move a “pump and dump” would require stronger evidence than a sudden price increase.
What makes ALGO interesting right now is the transformation of the chart: long consolidation → breakout → volume expansion → test of the recent high.
The next phase is where the story gets interesting. Will the market maintain the momentum, or will traders start taking profits and push the price back into the previous range?
One thing is certain: ALGO has gone from being relatively quiet to becoming a coin worth watching very closely. 👀 #ALGO #ALGO_USDT #ALGO/USDT #Binance
71
·
--
Haussier
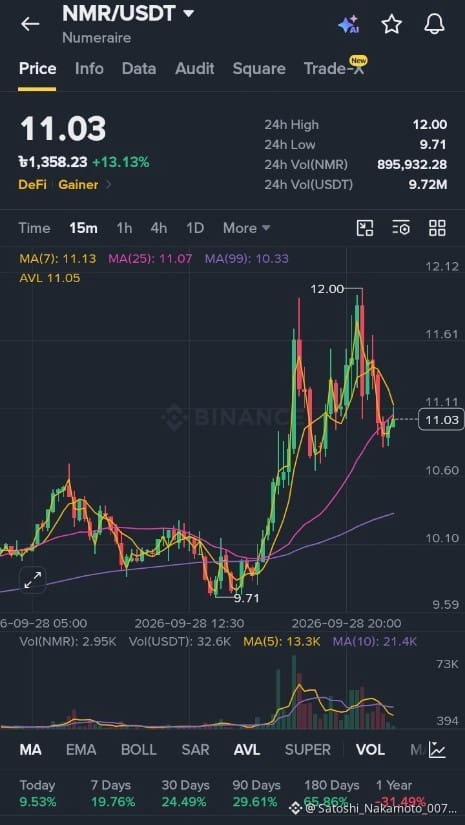
NMR is showing a surprisingly strong comeback on the 15-minute chart. The price is currently around $11.03, up approximately 13.13% over the last 24 hours, after moving from a 24-hour low of $9.71 to a high of $12.00.
What makes this move interesting is the speed of the recovery. From the $9.71 area, NMR pushed sharply higher, broke above the $10–$11 region, and reached the psychological $12 level before pulling back. Trading activity also expanded significantly during the move, showing that the rally came with a noticeable increase in market participation.
The technical structure is also worth watching. MA(99) is around $10.33, while MA(25) is around $11.07 and MA(7) is around $11.13. This means the current price is sitting close to the short-term moving averages after a major upward move. The $12.00 area now stands out as the recent high, while the $11.00–$10.60 zone becomes an important area to monitor if the momentum cools down.
The most surprising part? NMR spent much of the earlier session trading around the $10 area, then suddenly accelerated toward $12. That kind of transition—from quiet consolidation to explosive volatility—is exactly what makes this chart interesting to watch.
NMR is definitely back on the radar. Now the key question is not simply how high it can go, but whether the market can maintain the momentum and volume behind this move.#NMRBullish #NMR #NMR/USDT #Binance
NMR is showing a surprisingly strong comeback on the 15-minute chart. The price is currently around $11.03, up approximately 13.13% over the last 24 hours, after moving from a 24-hour low of $9.71 to a high of $12.00.
What makes this move interesting is the speed of the recovery. From the $9.71 area, NMR pushed sharply higher, broke above the $10–$11 region, and reached the psychological $12 level before pulling back. Trading activity also expanded significantly during the move, showing that the rally came with a noticeable increase in market participation.
The technical structure is also worth watching. MA(99) is around $10.33, while MA(25) is around $11.07 and MA(7) is around $11.13. This means the current price is sitting close to the short-term moving averages after a major upward move. The $12.00 area now stands out as the recent high, while the $11.00–$10.60 zone becomes an important area to monitor if the momentum cools down.
The most surprising part? NMR spent much of the earlier session trading around the $10 area, then suddenly accelerated toward $12. That kind of transition—from quiet consolidation to explosive volatility—is exactly what makes this chart interesting to watch.
NMR is definitely back on the radar. Now the key question is not simply how high it can go, but whether the market can maintain the momentum and volume behind this move.#NMRBullish #NMR #NMR/USDT #Binance
What makes this move interesting is the speed of the recovery. From the $9.71 area, NMR pushed sharply higher, broke above the $10–$11 region, and reached the psychological $12 level before pulling back. Trading activity also expanded significantly during the move, showing that the rally came with a noticeable increase in market participation.
The technical structure is also worth watching. MA(99) is around $10.33, while MA(25) is around $11.07 and MA(7) is around $11.13. This means the current price is sitting close to the short-term moving averages after a major upward move. The $12.00 area now stands out as the recent high, while the $11.00–$10.60 zone becomes an important area to monitor if the momentum cools down.
The most surprising part? NMR spent much of the earlier session trading around the $10 area, then suddenly accelerated toward $12. That kind of transition—from quiet consolidation to explosive volatility—is exactly what makes this chart interesting to watch.
NMR is definitely back on the radar. Now the key question is not simply how high it can go, but whether the market can maintain the momentum and volume behind this move.#NMRBullish #NMR #NMR/USDT #Binance
173
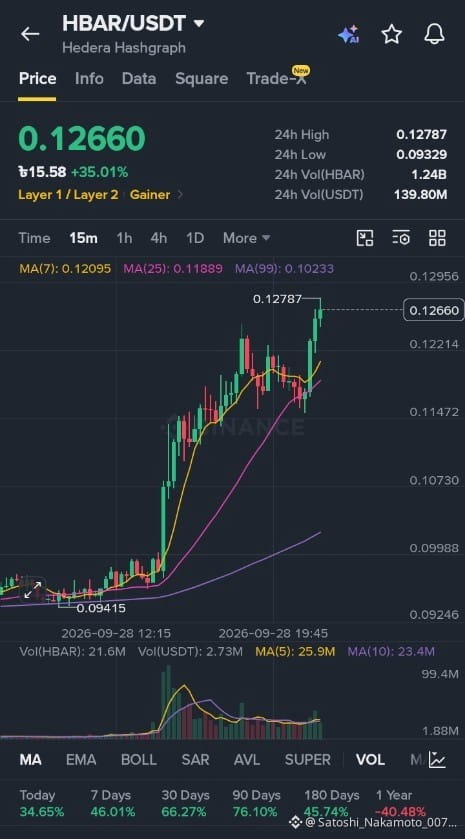
HBAR/USDT has entered a powerful momentum phase. On the 15-minute chart, HBAR is trading around 0.12660 USDT, up approximately 35.01% in 24 hours, while the market has pushed toward a fresh intraday high of 0.12787. The structure is clearly showing strong upward momentum, with price holding well above the MA(7) at 0.12095, MA(25) at 0.11889, and MA(99) at 0.10233. This strong alignment highlights the intensity of the current move. What makes this setup stand out is the combination of a major breakout, sustained price strength, and elevated trading volume. The 0.12787–0.12956 zone is now an important area to watch, while the 0.12214 and 0.11889 regions provide key chart references if momentum cools down. After such a rapid move, volatility can increase sharply, so the next candles and volume confirmation will be critical. This is no longer a quiet chart — HBAR has clearly awakened, and the market is now watching to see whether this momentum can sustain itself.#hbar #HBARUSD #HBARUSDT #HBAR/BTC #Binance
HBAR/USDT has entered a powerful momentum phase. On the 15-minute chart, HBAR is trading around 0.12660 USDT, up approximately 35.01% in 24 hours, while the market has pushed toward a fresh intraday high of 0.12787. The structure is clearly showing strong upward momentum, with price holding well above the MA(7) at 0.12095, MA(25) at 0.11889, and MA(99) at 0.10233. This strong alignment highlights the intensity of the current move. What makes this setup stand out is the combination of a major breakout, sustained price strength, and elevated trading volume. The 0.12787–0.12956 zone is now an important area to watch, while the 0.12214 and 0.11889 regions provide key chart references if momentum cools down. After such a rapid move, volatility can increase sharply, so the next candles and volume confirmation will be critical. This is no longer a quiet chart — HBAR has clearly awakened, and the market is now watching to see whether this momentum can sustain itself.#hbar #HBARUSD #HBARUSDT #HBAR/BTC #Binance
52
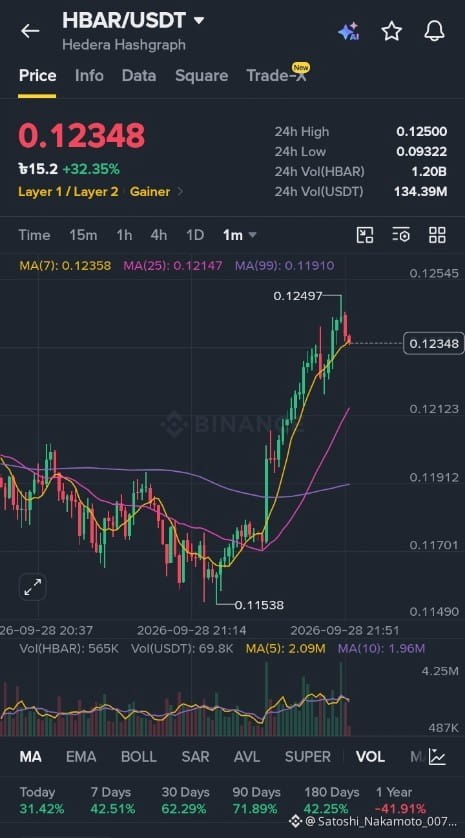
HBAR/USDT is showing a strong short-term bullish movement on the 1-minute chart. The current price is around 0.12348 USDT, with a 24-hour increase of 32.35%, showing strong buying momentum. The price recently reached a high of approximately 0.12497, but then pulled back slightly, which suggests some selling pressure near the 0.12500 resistance area. The moving averages are also positioned positively: MA(7) is 0.12358, MA(25) is 0.12147, and MA(99) is 0.11910. Since the current price is above all three moving averages, the short-term trend remains bullish. However, because this is only a 1-minute chart and the price has already moved up sharply, volatility and quick pullbacks are possible. The 0.121–0.122 area can be watched as a nearby support zone, while 0.12500 is an important resistance area. Overall, the chart shows strong upward momentum, but confirmation from higher timeframes and volume would be useful before making any trading decision.#HBARUSD #HBARPrice #HBARUSDT #hbar #Binance
HBAR/USDT is showing a strong short-term bullish movement on the 1-minute chart. The current price is around 0.12348 USDT, with a 24-hour increase of 32.35%, showing strong buying momentum. The price recently reached a high of approximately 0.12497, but then pulled back slightly, which suggests some selling pressure near the 0.12500 resistance area. The moving averages are also positioned positively: MA(7) is 0.12358, MA(25) is 0.12147, and MA(99) is 0.11910. Since the current price is above all three moving averages, the short-term trend remains bullish. However, because this is only a 1-minute chart and the price has already moved up sharply, volatility and quick pullbacks are possible. The 0.121–0.122 area can be watched as a nearby support zone, while 0.12500 is an important resistance area. Overall, the chart shows strong upward momentum, but confirmation from higher timeframes and volume would be useful before making any trading decision.#HBARUSD #HBARPrice #HBARUSDT #hbar #Binance
69
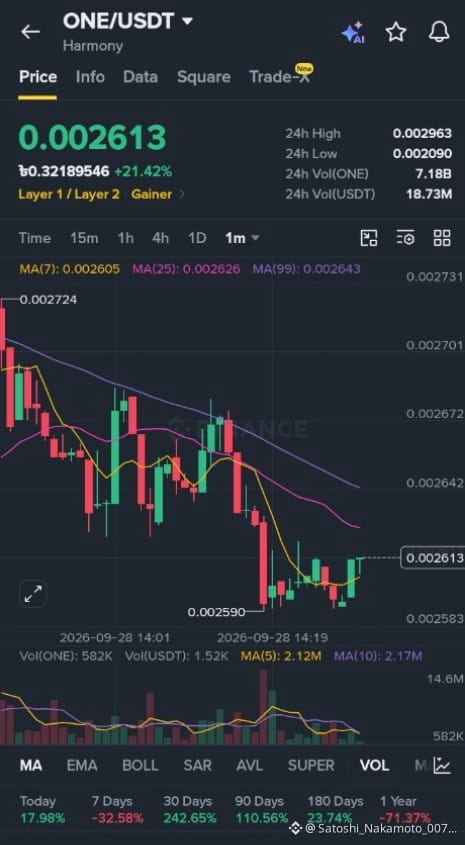
ONE has shown strong short-term recovery, with the price currently around 0.002613 USDT.
The coin is up about 21.42% over the last 24 hours, showing strong recent buying activity.
The price bounced from around 0.002590, which indicates some buying support at the recent low.
The latest candles show a small upward move, suggesting that buyers are trying to regain short-term momentum.The overall short-term trend still looks weak because the price is below the MA(25) at 0.002626 and MA(99) at 0.002643.
The moving averages are generally pointing downward, which indicates that the broader short-term trend remains bearish.
ONE is down around 32.58% over 7 days and about 71.37% over 1 year, showing significant previous weakness.
The current bounce is still relatively small compared with the previous decline, so a reversal has not yet been confirmed.
The price may face resistance around 0.002626–0.002643, followed by the 0.002672 area.#Binance #ONE/USDT #BTC走势分析
ONE has shown strong short-term recovery, with the price currently around 0.002613 USDT.
The coin is up about 21.42% over the last 24 hours, showing strong recent buying activity.
The price bounced from around 0.002590, which indicates some buying support at the recent low.
The latest candles show a small upward move, suggesting that buyers are trying to regain short-term momentum.The overall short-term trend still looks weak because the price is below the MA(25) at 0.002626 and MA(99) at 0.002643.
The moving averages are generally pointing downward, which indicates that the broader short-term trend remains bearish.
ONE is down around 32.58% over 7 days and about 71.37% over 1 year, showing significant previous weakness.
The current bounce is still relatively small compared with the previous decline, so a reversal has not yet been confirmed.
The price may face resistance around 0.002626–0.002643, followed by the 0.002672 area.#Binance #ONE/USDT #BTC走势分析
The coin is up about 21.42% over the last 24 hours, showing strong recent buying activity.
The price bounced from around 0.002590, which indicates some buying support at the recent low.
The latest candles show a small upward move, suggesting that buyers are trying to regain short-term momentum.The overall short-term trend still looks weak because the price is below the MA(25) at 0.002626 and MA(99) at 0.002643.
The moving averages are generally pointing downward, which indicates that the broader short-term trend remains bearish.
ONE is down around 32.58% over 7 days and about 71.37% over 1 year, showing significant previous weakness.
The current bounce is still relatively small compared with the previous decline, so a reversal has not yet been confirmed.
The price may face resistance around 0.002626–0.002643, followed by the 0.002672 area.#Binance #ONE/USDT #BTC走势分析
272
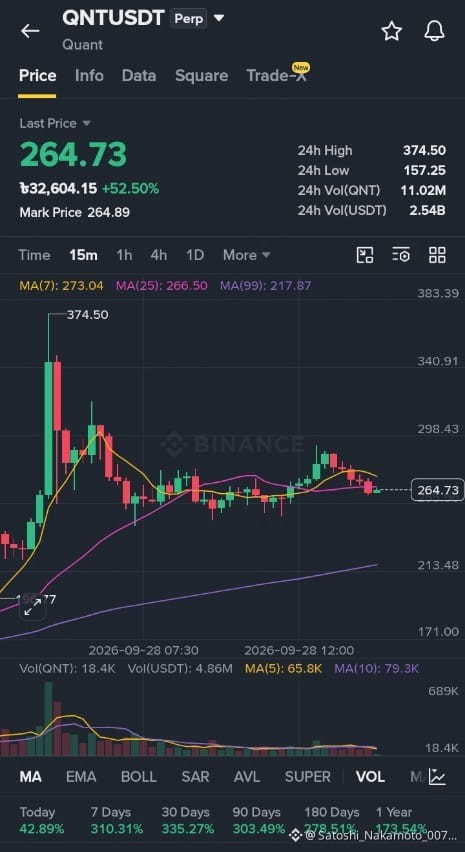
“The QNT/USDT chart shows a strong upward movement in price over the last 24 hours. The current price is around 264.73 USDT, while the 24-hour high is 374.50 USDT and the low is 157.25 USDT. The chart indicates that QNT experienced significant volatility, with a sharp rise followed by a period of consolidation. The 7-period moving average is around 273.04, while the 25-period moving average is around 266.50. Trading volume increased significantly during the major price movement and then gradually decreased. Overall, the chart shows strong recent momentum but also high volatility.”#TrendingTopic #UNI📈
“The QNT/USDT chart shows a strong upward movement in price over the last 24 hours. The current price is around 264.73 USDT, while the 24-hour high is 374.50 USDT and the low is 157.25 USDT. The chart indicates that QNT experienced significant volatility, with a sharp rise followed by a period of consolidation. The 7-period moving average is around 273.04, while the 25-period moving average is around 266.50. Trading volume increased significantly during the major price movement and then gradually decreased. Overall, the chart shows strong recent momentum but also high volatility.”#TrendingTopic #UNI📈
80
“Every trade is a lesson. Stay patient, manage risk, and never let emotions control your decisions. Small losses are part of the journey; what matters is learning, improving, and staying disciplined.”
“Every trade is a lesson. Stay patient, manage risk, and never let emotions control your decisions. Small losses are part of the journey; what matters is learning, improving, and staying disciplined.”
1
202
Connectez-vous pour découvrir plus de contenu
Rejoignez la communauté mondiale des adeptes de cryptomonnaies sur Binance Square
⚡️ Suviez les dernières informations importantes sur les cryptomonnaies.
💬 Jugé digne de confiance par la plus grande plateforme d’échange de cryptomonnaies au monde.
👍 Découvrez les connaissances que partagent les créateurs vérifiés.
Adresse e-mail/Nº de téléphone
Sujets d’actualité
AltcoinSeasonIndexHoldsAbove60For5Days
125 vues
76 mentions
The Altcoin Season Index has impressively held above the 60 mark for five consecutive days. This sustained level is historically a strong indicator that altcoins are outperforming Bitcoin, often heralding a period of significant growth for the broader altcoin market. Investors are closely watching this trend, as it suggests a potential shift in market dynamics favoring alternative cryptocurrencies over the market leader. This sustained bullish sentiment could pave the way for substantial gains across various altcoins, though caution remains paramount in the volatile crypto space.
Disclaimer: This is not investment advice. Always do your own research.
#AltcoinSeasonIndexHoldsAbove60For5Days $BTC
Luong Nguyen Ba
·0 mentions J’aime
·19 vues
BitcoinSlipsBelow$84000
577 vues
51 mentions
KospiPostsWorstQuarterSince2020
83 vues
48 mentions