

nayrbryanGaming
1.2k Publications

nayrbryanGaming
Signaler
Bloquer l’utilisateur
Content Creator | Trader | Web3 & Crypto | Photographer| CEO @NNG_ESPORT | Esports pioneer est. 2010 | IG/Twitch: @nayrbryan_gaming | TikTok:@nayrbryanGaming

Détenteur pour BNB
Trade fréquemment
1.9 an(s)
924 Suivis
419 Abonnés
367 J’aime
Publications
Tous
Citations
·
--
Haussier
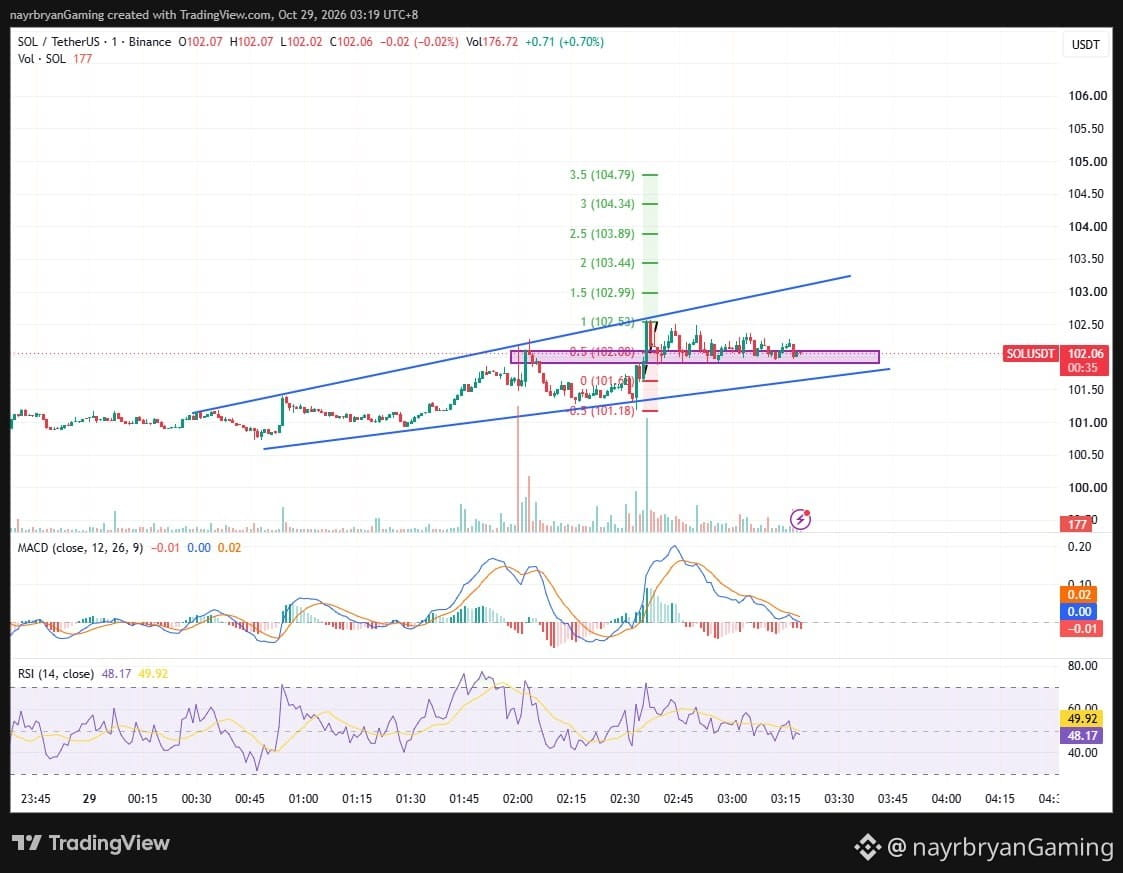
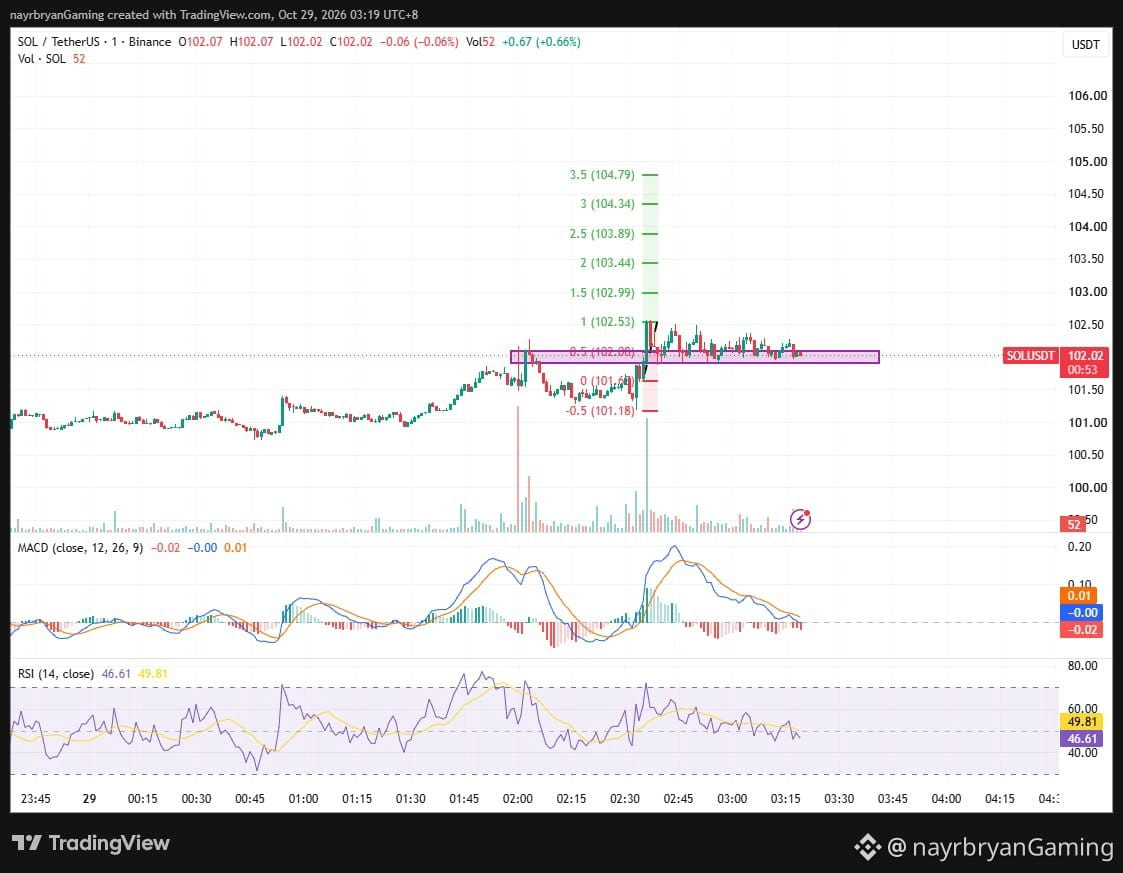
A pause is not a signal. Watch SOL at 101.90–102.08 and 102.53. Wait for confirmation, avoid chasing, and protect capital. #SOL #NoFOMO #DYOR
A pause is not a signal. Watch SOL at 101.90–102.08 and 102.53. Wait for confirmation, avoid chasing, and protect capital. #SOL #NoFOMO #DYOR
1
68
·
--
Haussier
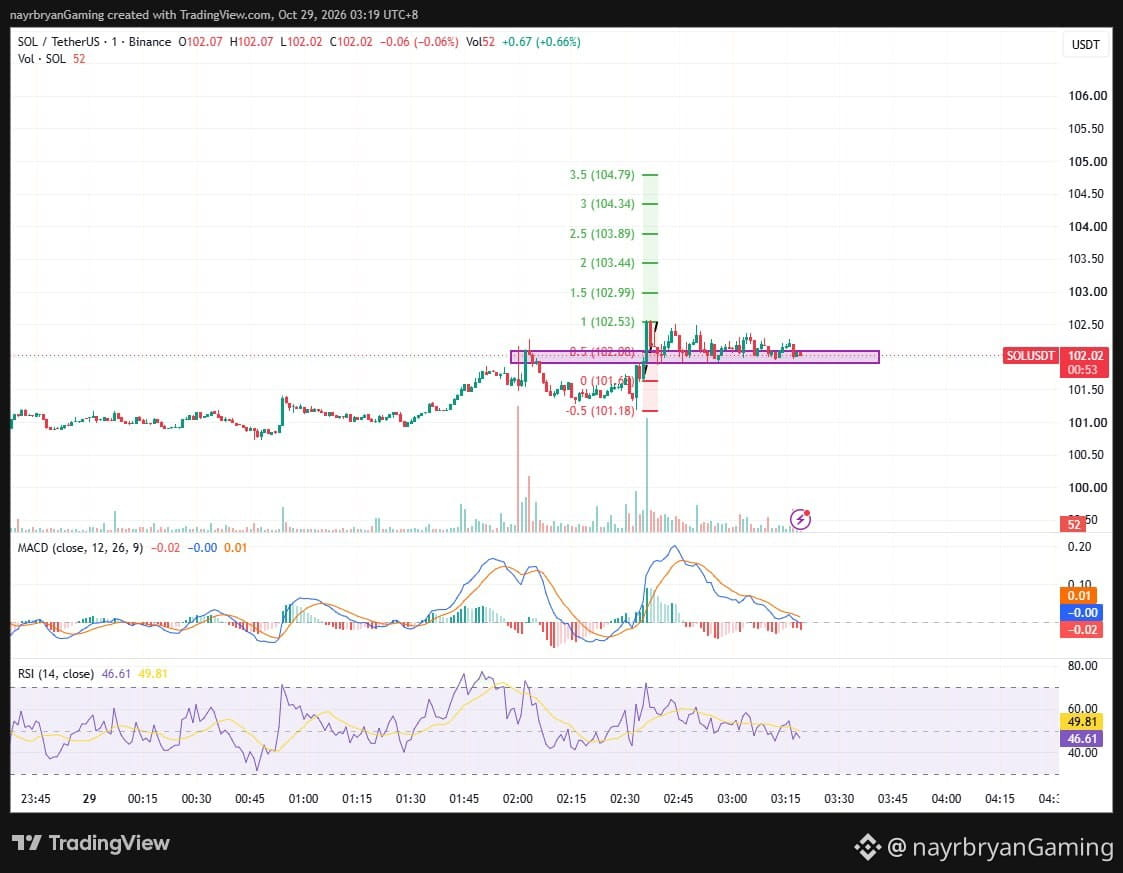
SOL 1m: Hold 101.90–102.08 and reclaim 102.53 for 102.99+. Lose 101.90 and 101.60 comes into focus. Confirm with price action. DYOR/NFA.
SOL 1m: Hold 101.90–102.08 and reclaim 102.53 for 102.99+. Lose 101.90 and 101.60 comes into focus. Confirm with price action. DYOR/NFA.
1
64
·
--
Haussier
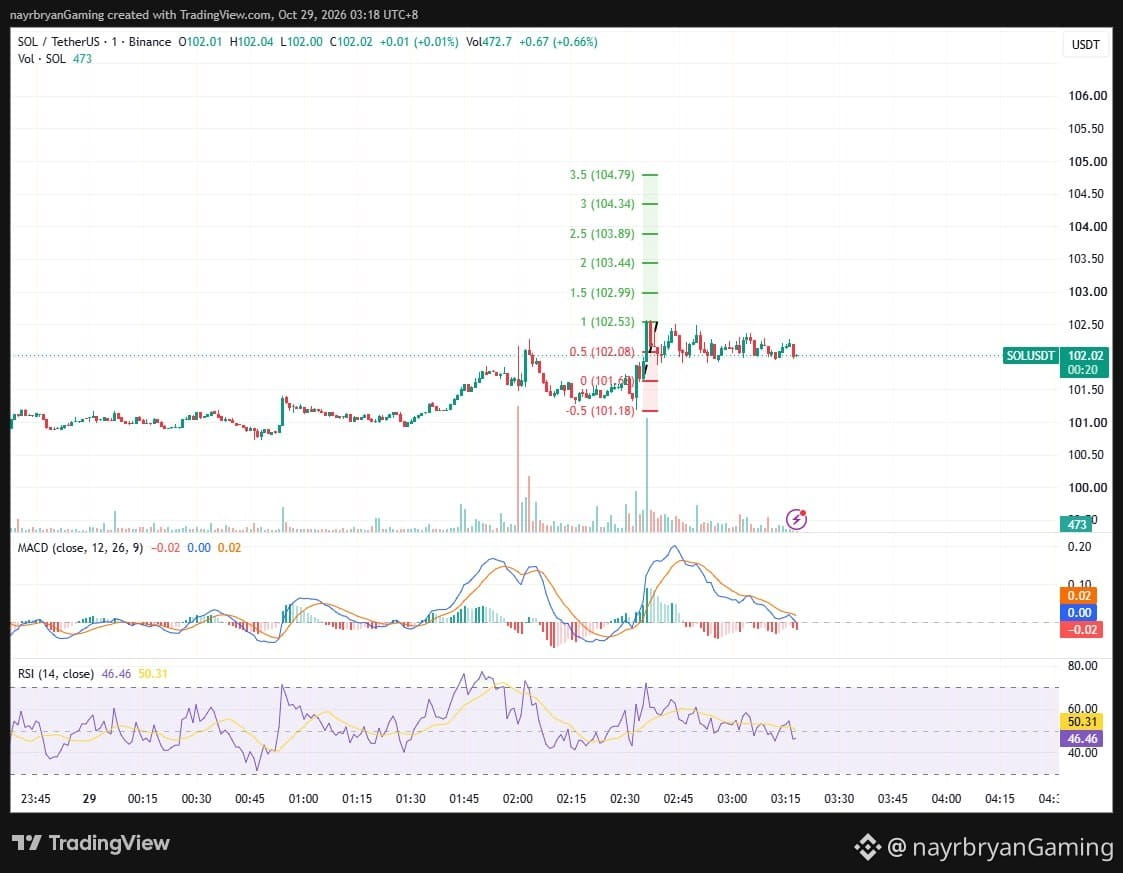
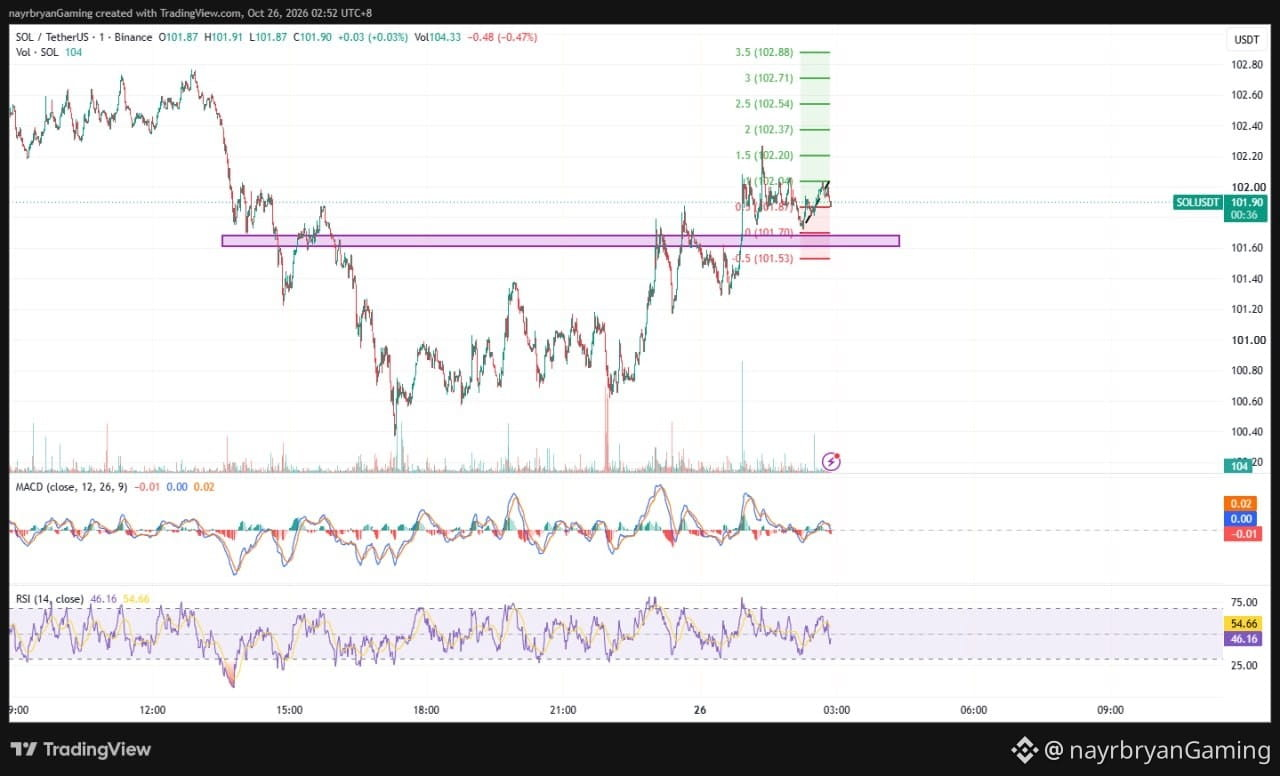
SOL/USDT 1m: Price 102.06. Watch 101.90–102.08 support and 102.53 resistance. Reclaim may open 102.99; breakdown risks 101.60. DYOR/NFA.
SOL/USDT 1m: Price 102.06. Watch 101.90–102.08 support and 102.53 resistance. Reclaim may open 102.99; breakdown risks 101.60. DYOR/NFA.
46
·
--
Haussier
TRADER MOTIVATION / MINI INSIGHT
🧠 INSIGHT OF THE DAY
“Price can pause after a rally. Your job is not to predict every candle, but to recognize when the structure confirms a move.”
📊 WHY THIS MATTERS
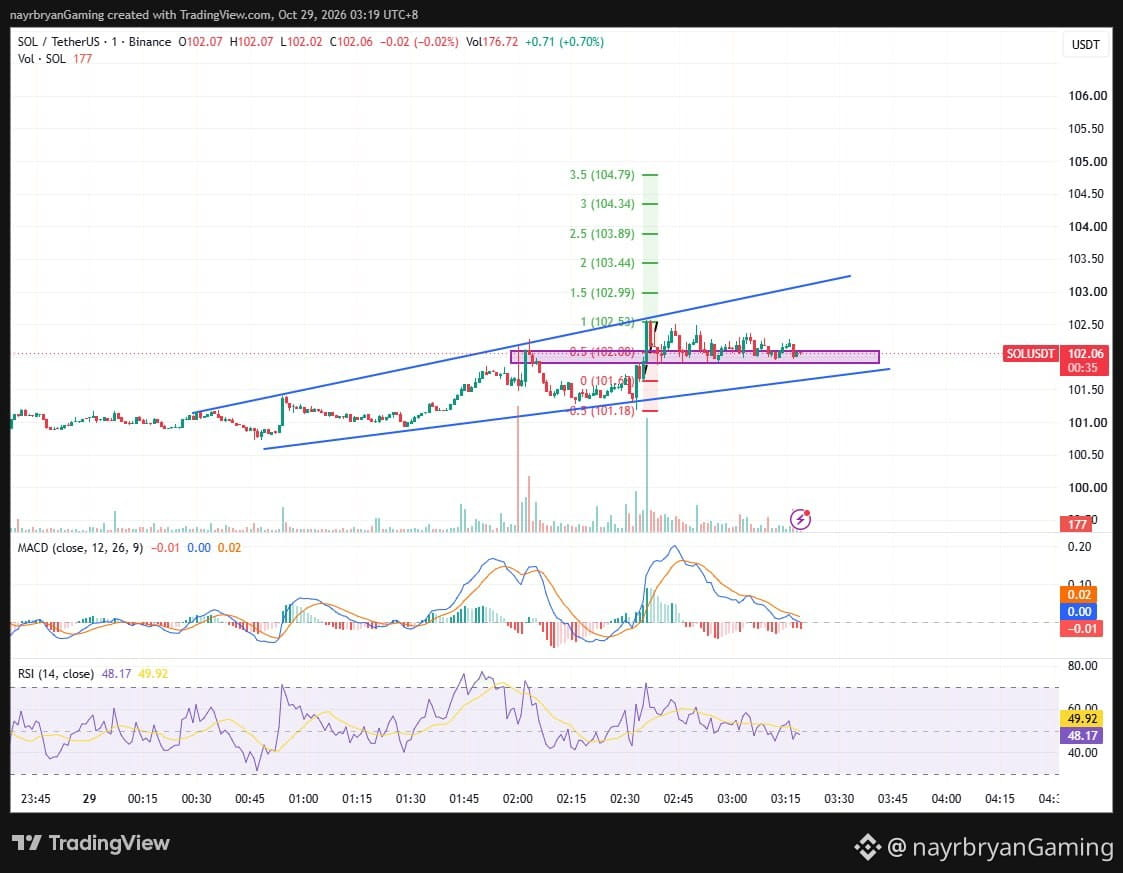
SOL is consolidating near 102.06 after an upward impulse.
The immediate reaction zone is 101.90–102.08, while 102.53 is the important upside reclaim level.
A hold followed by a confirmed breakout could support further upside.
A loss of the reaction zone could instead expose 101.60 and potentially 101.18.
The lesson is simple: a sideways market does not automatically mean accumulation, and a pullback does not automatically mean reversal.
🎯 TRADER CHECKLIST
• Monitor the 101.90–102.08 reaction zone.
• Watch 102.53 for bullish confirmation.
• Respect 101.60 as a major structure level.
• Check volume before trusting a breakout.
• Avoid chasing candles during consolidation.
• Define risk before entering a position.
🧠 MINI CHALLENGE
Before entering a trade, ask:
“Am I responding to confirmed price structure, or am I predicting what I want the market to do?”
Trade the setup, not the emotion.
— @nayrbryanGaming
#TraderMindset #TradingDiscipline #NoFOMO #CryptoMindset #SOLUSDT #DYOR #NFA
🔔 Follow my Binance Square & X (@nayrbryanGaming) for daily chart insights.
62
·
--
Haussier
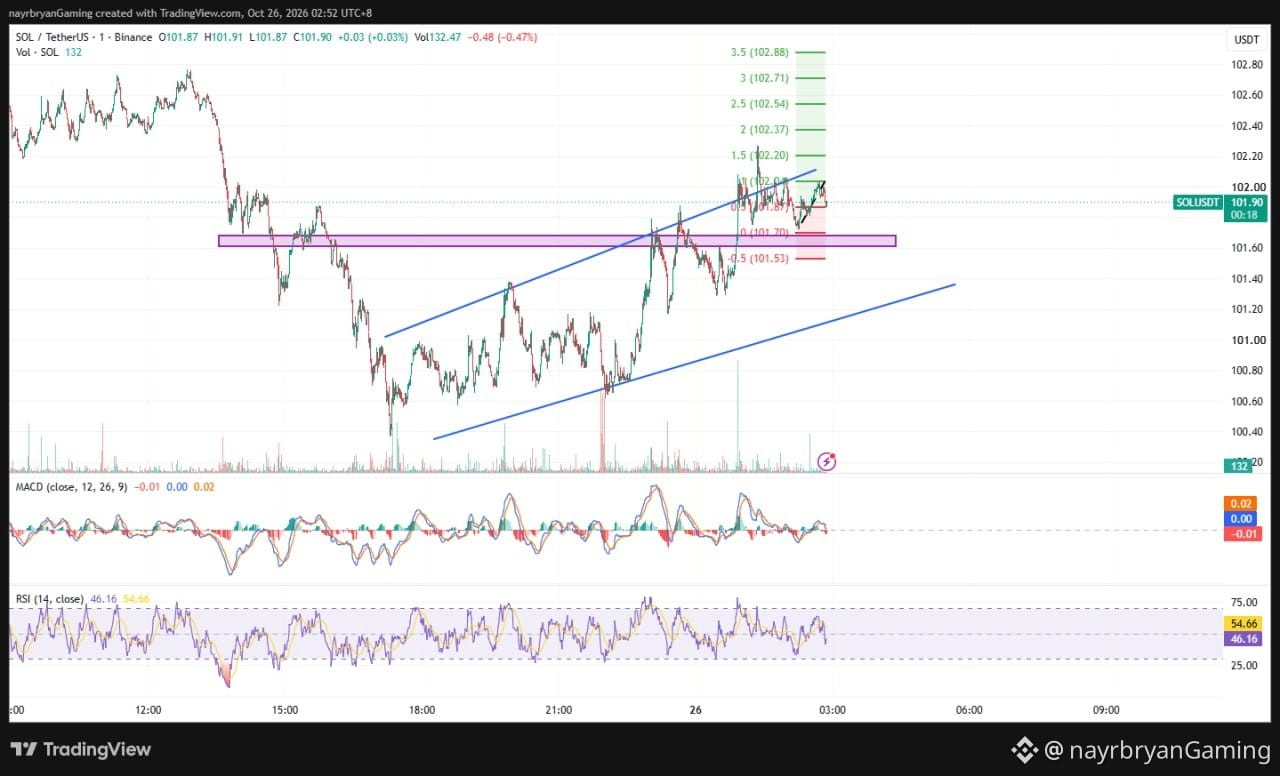
LIGHT ANALYSIS / CHART SETUP — SOL/USDT
📈 STRUCTURE OVERVIEW
Market Phase:
Bullish impulse → pullback → sideways consolidation
Immediate Reaction Zone:
101.90–102.08
Major Support:
101.60
Lower Structure Reference:
101.18
Key Resistance / Reclaim:
102.53
Next Upside Levels:
102.99 → 103.44 → 103.89 → 104.34 → 104.79
📌 WHAT I'M WATCHING
SCENARIO A — BULLISH CONTINUATION
If SOL holds the 101.90–102.08 zone and buyers regain control, a reclaim of 102.53 could open the way toward:
102.99 → 103.44 → 103.89 → 104.34 → 104.79
Confirmation: A sustained move above 102.53, preferably supported by stronger volume and improving momentum.
SCENARIO B — SUPPORT FAILURE
If SOL breaks below 101.90 and fails to reclaim the zone, price may test:
101.60 → 101.18
A breakdown below 101.60 would weaken the current recovery structure.
📊 INDICATOR CHECK
MACD: Slight bearish short-term configuration.
RSI: 48.17, close to neutral.
Price Structure: Consolidating near the purple zone inside the drawn ascending channel.
Bullish Confirmation: Reclaim of 102.53.
Bearish Warning: Breakdown below 101.90, followed by a failure to recover.
📝 CHART NOTE
The ascending channel provides structural context, but it does not guarantee continuation. A confirmed breakout or breakdown is more informative than an isolated candle.
This is an educational chart framework, not a trade recommendation.
— @nayrbryanGaming
#SOLAnalysis #ChartSetup #PriceAction #SmartMoney #Fibonacci #CryptoTrading #Binance #DYOR #NFA
82
·
--
Haussier
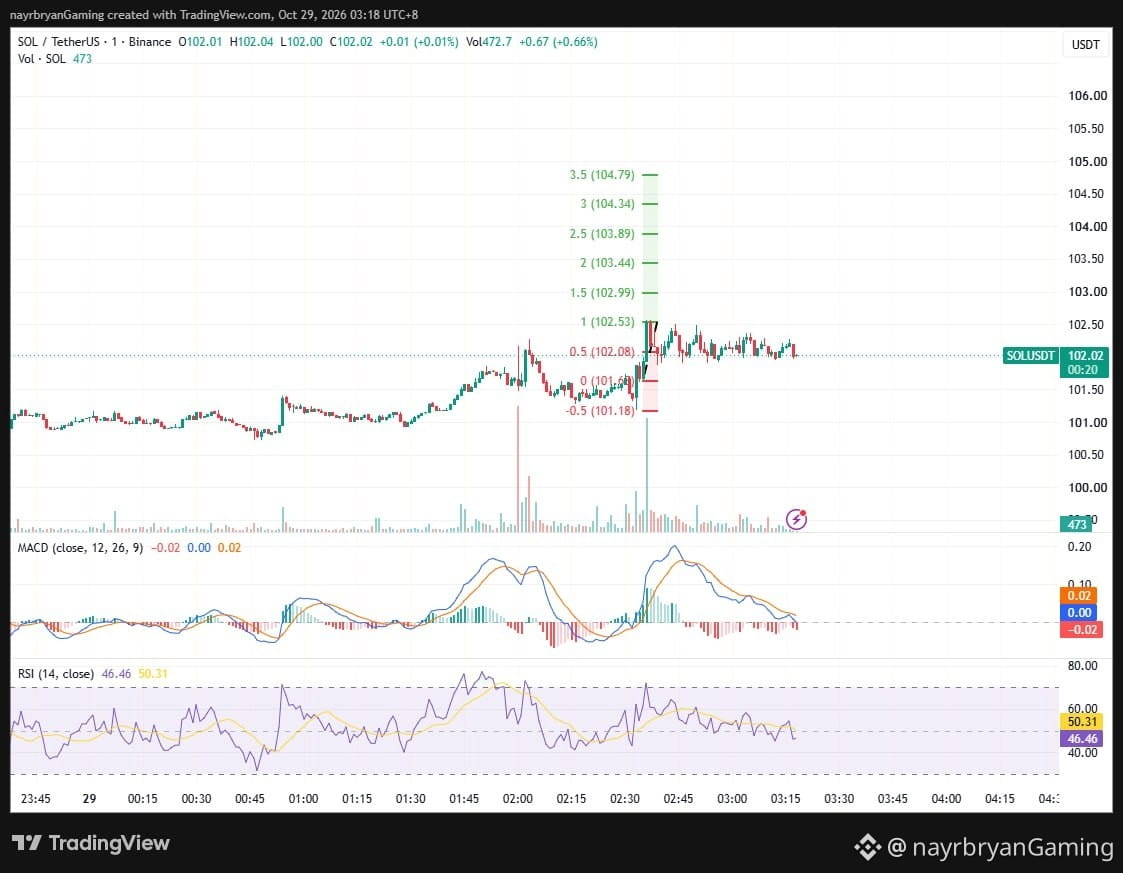
DAILY SIGNAL — SOL/USDT
Date: 29 Oct 2026
Chart Time: 03:19 UTC+8
Timeframe: 1m
Intraday Bias: Consolidation → reaction at support → breakout watch
📊 MARKET BIAS
SOL/USDT is consolidating around 102.06 after a sharp upward impulse toward the 102.50 area.
Price is moving sideways near the purple support/resistance zone while remaining inside the broader ascending channel drawn on the chart.
However, momentum has cooled after the initial rally. MACD is showing a slightly bearish short-term configuration, while RSI is near 48, indicating neutral momentum with a mild loss of strength.
The next important test is whether SOL can hold the 101.90–102.08 area and reclaim the upper resistance around 102.53.
🔹 KEY LEVELS FROM CHART
Current Price: 102.06
Key Reaction Zone:
101.90–102.08
Major Structure Support:
101.60
Lower Invalidation Reference:
101.18
Key Upside Reclaim:
102.53
📈 FIBONACCI LEVELS
Upside Targets:
TP1 → 102.53 (1.0 Fib)
TP2 → 102.99 (1.5 Fib)
TP3 → 103.44 (2.0 Fib)
TP4 → 103.89 (2.5 Fib)
TP5 → 104.34 (3.0 Fib)
TP6 → 104.79 (3.5 Fib)
Downside Levels:
101.60 → 101.18
📊 TECHNICAL BREAKDOWN
SOL previously advanced from the lower part of its ascending channel and briefly reached the 102.50 region.
🧠 QUICK INSIGHT
“Consolidation after a breakout is a test of strength. The next confirmed move matters more than the previous candle.”
⚠️ DISCLAIMER
This is personal technical analysis for educational purposes only, not financial advice or a guaranteed trading signal.
Always DYOR / DYODD, manage risk carefully, and avoid emotional trading.
— @nayrbryanGaming
#SOL #SOLUSDT #Crypto #Trading #TechnicalAnalysis #PriceAction #Fibonacci #Binance #DYOR #NFA #NoFOMO
106
·
--
Haussier
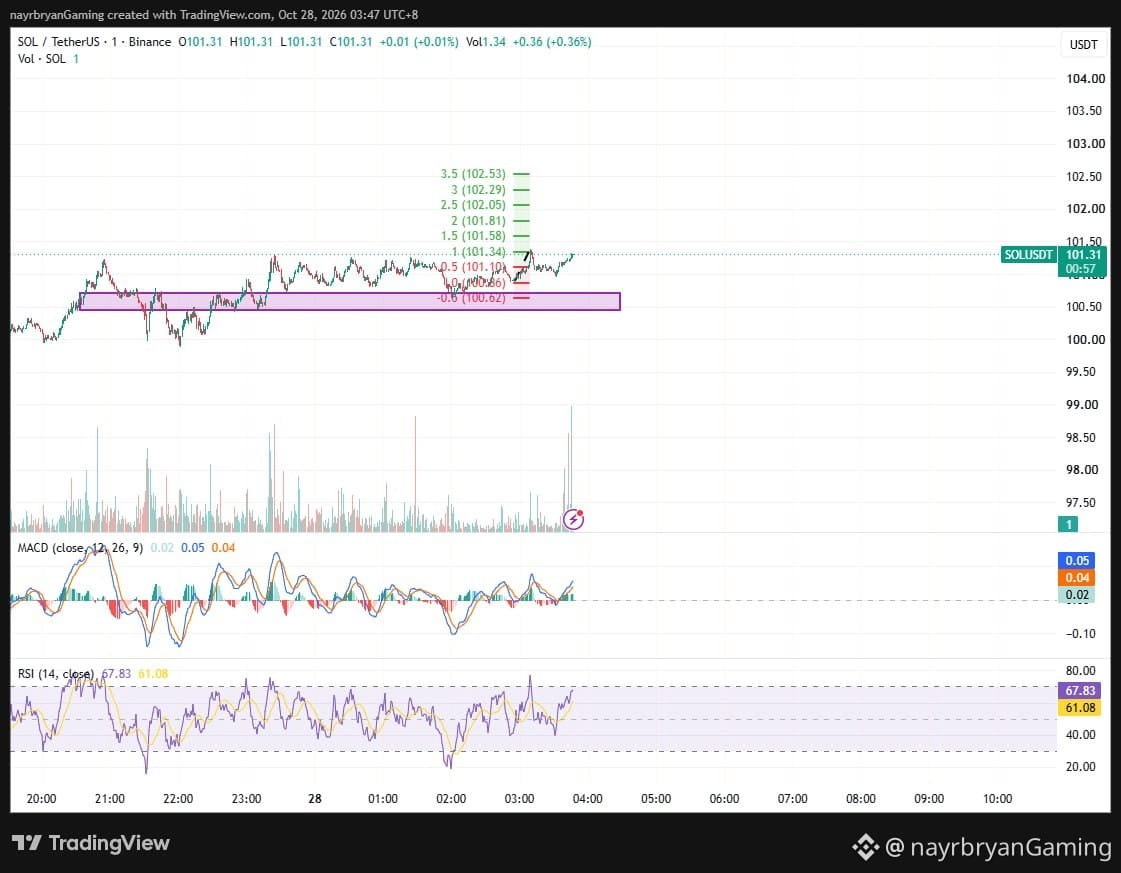
Momentum is not a guarantee. Wait for confirmation at 101.40, respect rising support, avoid FOMO, and protect capital. Trade structure, not emotion. #SOL #NoFOMO
Momentum is not a guarantee. Wait for confirmation at 101.40, respect rising support, avoid FOMO, and protect capital. Trade structure, not emotion. #SOL #NoFOMO
1
27
·
--
Haussier
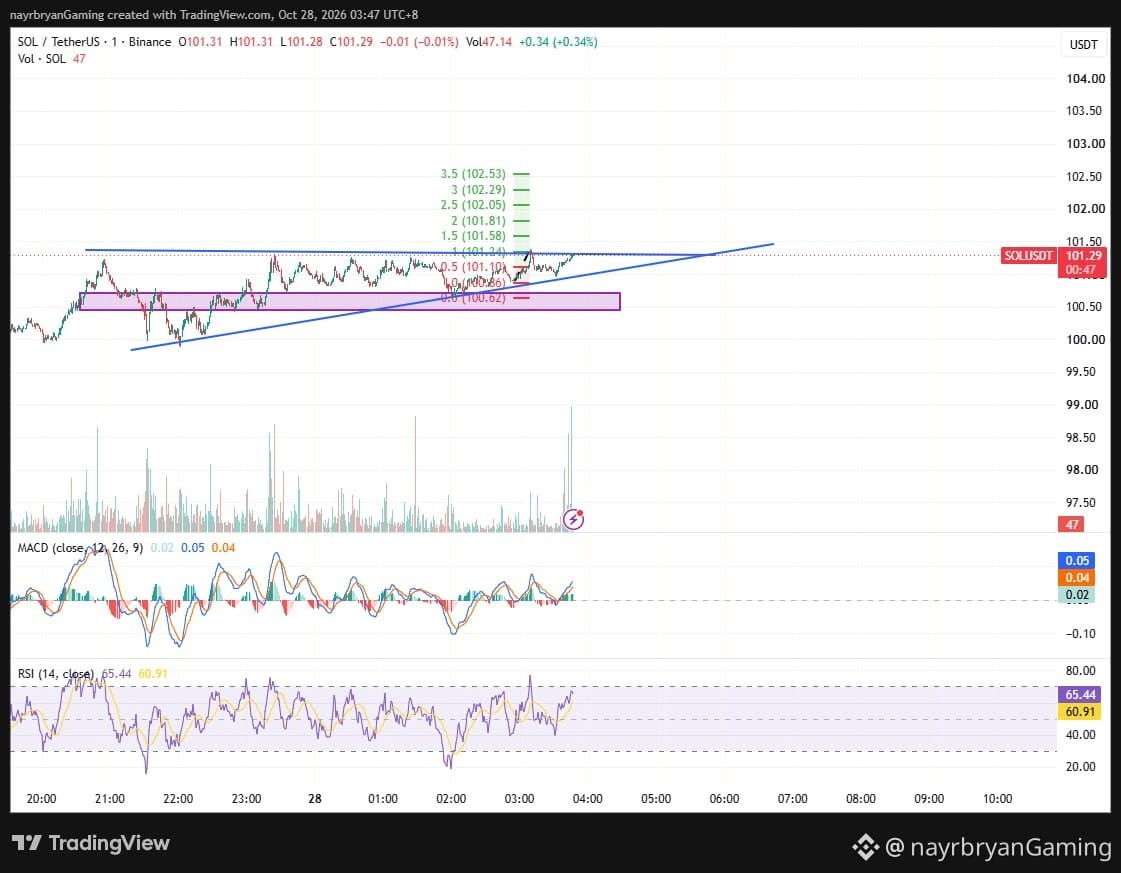
SOL/USDT: Resistance 101.30–101.40. Bullish breakout may target 101.58 → 101.81 → 102.05. Pullback references: 101.10 → 100.86 → 100.62. DYOR/NFA.
SOL/USDT: Resistance 101.30–101.40. Bullish breakout may target 101.58 → 101.81 → 102.05. Pullback references: 101.10 → 100.86 → 100.62. DYOR/NFA.
1
37
·
--
Haussier
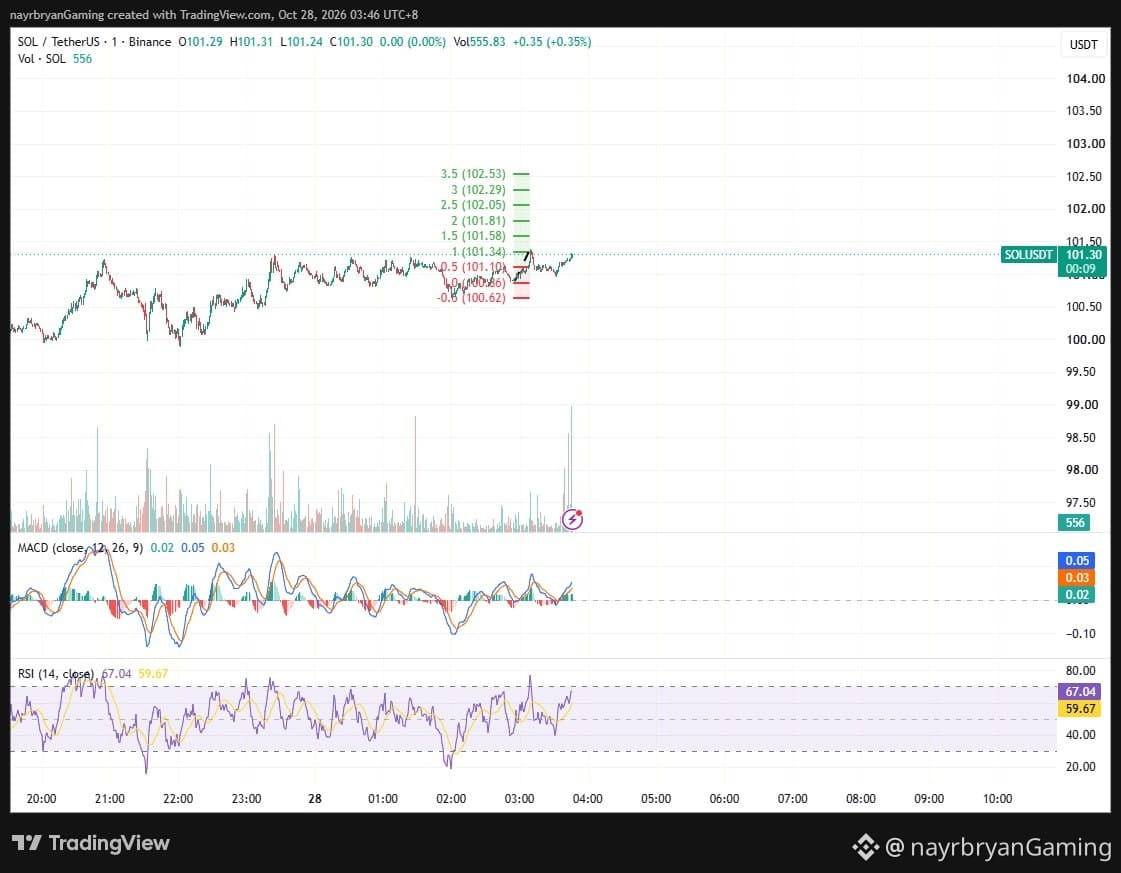
SOL 1m: Price 101.29 tests 101.30–101.40 resistance. Breakout may target 101.58 → 101.81. Lose rising support and 100.62 comes into focus. DYOR/NFA.
SOL 1m: Price 101.29 tests 101.30–101.40 resistance. Breakout may target 101.58 → 101.81. Lose rising support and 100.62 comes into focus. DYOR/NFA.
1
59
·
--
Haussier
TRADER MOTIVATION / MINI INSIGHT
🧠 Insight of the Day
“Momentum can open the door, but discipline determines when to walk through it.”
---
Why This Matters
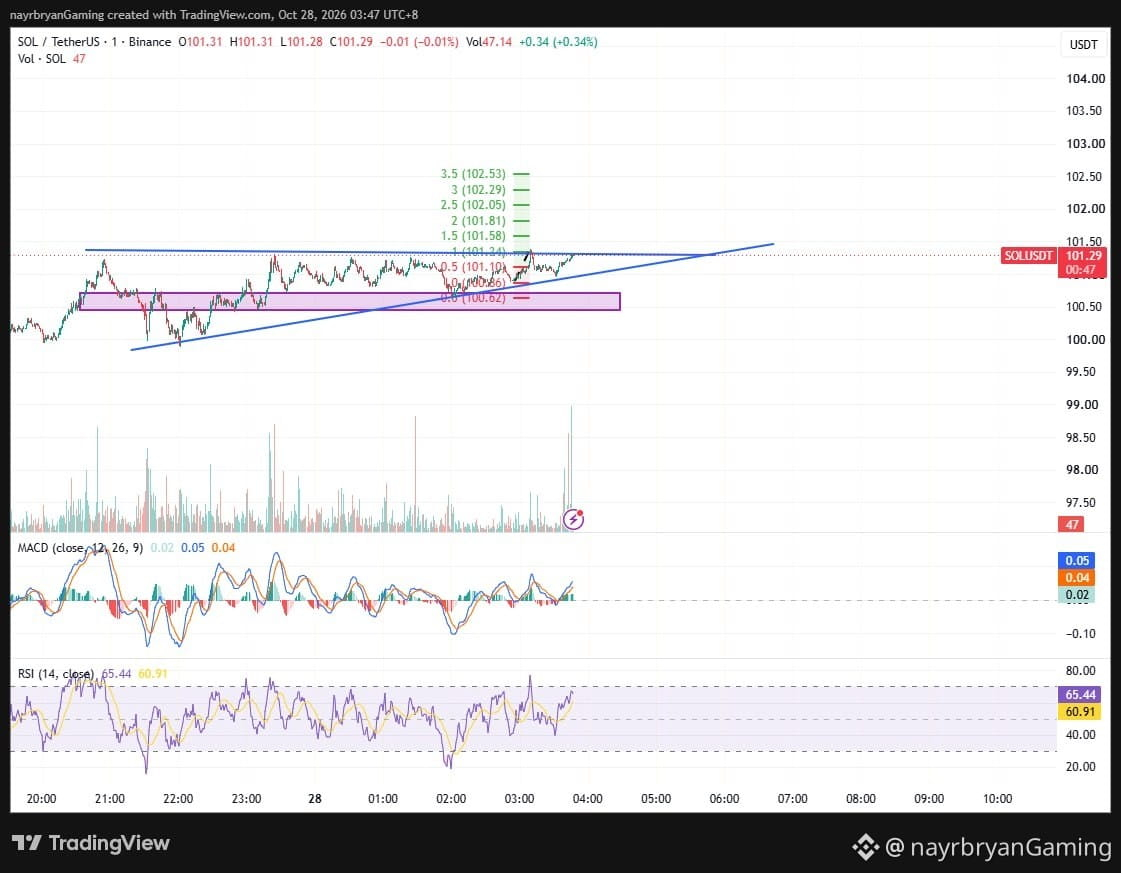
SOL is approaching the 101.30–101.40 resistance area while maintaining an ascending support structure.
MACD is positive and RSI is above its average, suggesting buyers currently have short-term momentum.
But strong momentum does not guarantee an immediate breakout. Price can still reject resistance and return to support.
The difference between preparation and impulsive trading is having a plan for both outcomes.
---
🎯 Trader Checklist
Watch the 101.30–101.40 resistance zone.
Monitor the ascending support trendline.
Confirm any breakout before assuming continuation.
Track 101.10, 100.86 and 100.62 on a pullback.
Respect the 100.45–100.70 demand zone.
Avoid chasing sudden green candles.
Protect capital and manage risk.
---
🧠 Mini Challenge
Before entering, ask:
“Am I responding to a confirmed breakout, or am I buying because I fear missing the move?”
Let structure guide the decision. Never let FOMO dictate it.
— @nayrbryanGaming
#TraderMindset #TradingDiscipline #NoFOMO #CryptoMindset #SOLUSDT #DYOR
🔔 Follow my Binance Square & X (@nayrbryanGaming) for daily chart insights.
63
·
--
Haussier
LIGHT ANALYSIS / CHART SETUP — SOL/USDT
📈 Structure Overview
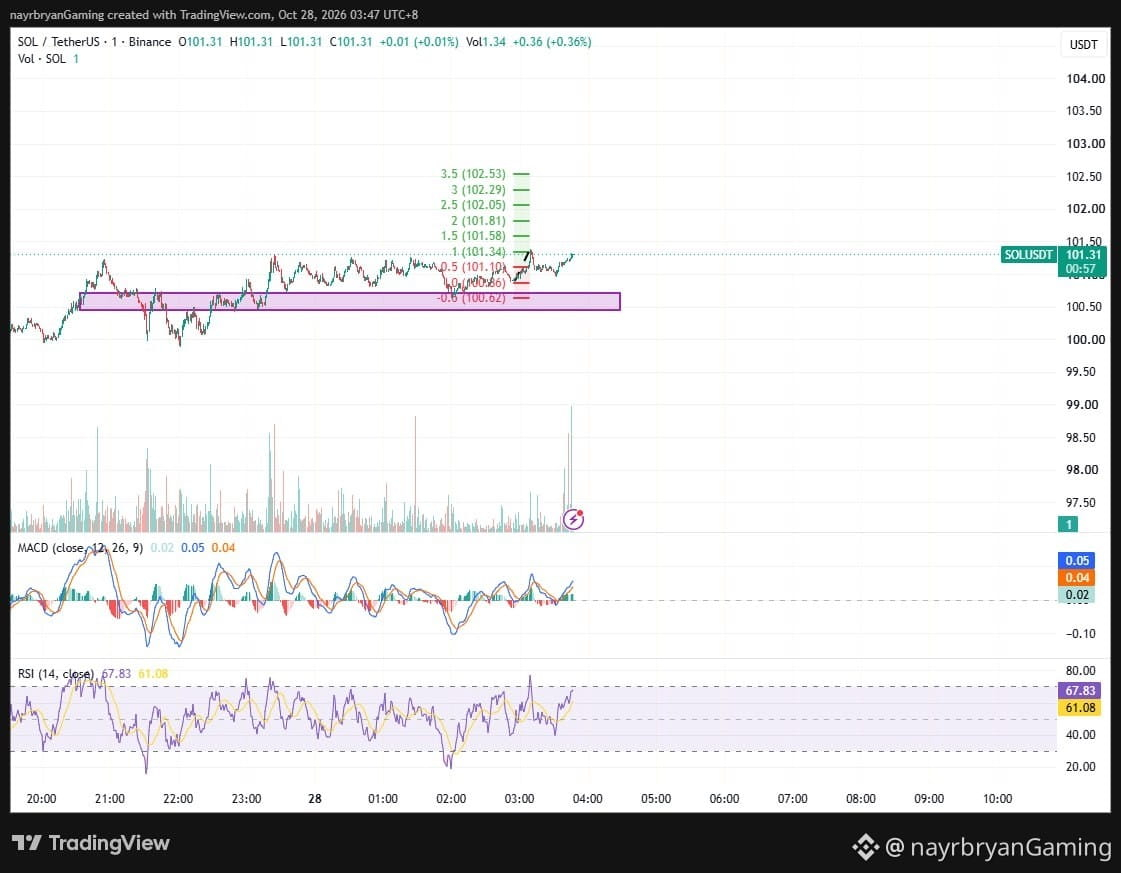
Market phase:
Recovery → Ascending consolidation → Resistance test
Current Price:
101.29
Immediate Resistance:
101.30–101.40
Key Fibonacci Reference:
101.34
Major Demand Zone:
100.45–100.70
Structural Support Reference:
100.62
Upside Fibonacci Levels:
101.58 → 101.81 → 102.05 → 102.29 → 102.53
---
📌 What I'm Watching
Scenario A — Bullish Continuation
If SOL breaks and sustains above 101.40, the next potential upside levels are:
101.58 → 101.81 → 102.05 → 102.29 → 102.53
A successful breakout and retest would provide stronger evidence of continuation.
Scenario B — Resistance Rejection
If SOL fails to clear 101.30–101.40 and breaks below the rising support trendline, a pullback toward these references becomes possible:
101.10 → 100.86 → 100.62
The 100.45–100.70 demand zone remains the broader structural area to monitor.
---
📊 Indicator Check
MACD:
Positive; MACD line above signal line.
Histogram:
Approximately +0.02.
RSI:
65.44, above its average of 60.91.
Price Structure:
Ascending support pressing against horizontal resistance.
Confirmation:
Breakout above 101.40 / loss of ascending support.
---
Note:
This is a chart framework, not a trade recommendation.
Use it to support your own DYOR-based execution plan.
— @nayrbryanGaming
#SOLAnalysis #ChartSetup #PriceAction #SmartMoney #Fibonacci #CryptoTrading #TradingView #DYOR #NFA
53
·
--
Haussier
DAILY SIGNAL — SOL/USDT
Date: 28 Oct 2026
Timeframe: 1m
Intraday Bias: Ascending support → resistance test → potential bullish breakout
---
📊 Market Bias
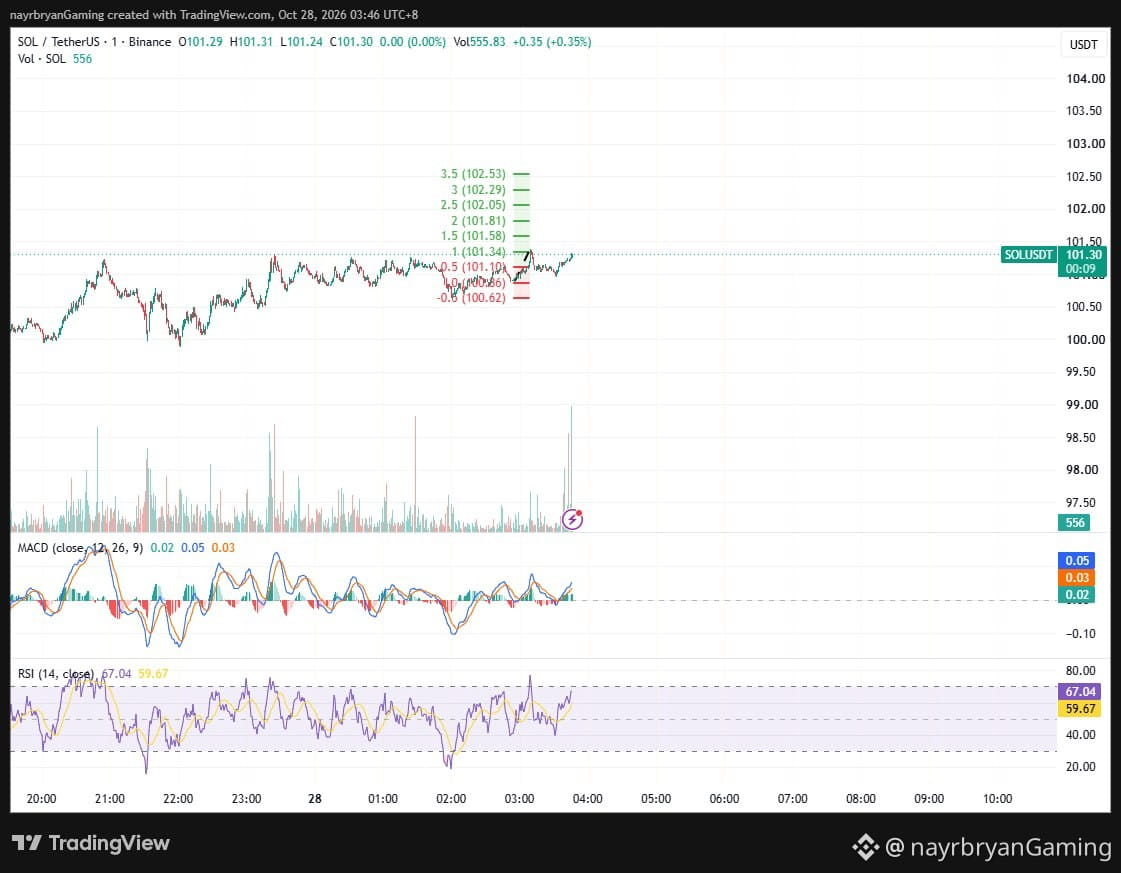
SOL is consolidating near 101.29 after recovering from the lower structure around 99.90–100.00.
Price has formed an ascending support trendline while repeatedly testing horizontal resistance around 101.30–101.40.
The purple demand zone around 100.45–100.70 remains an important structural reference. Buyers have defended higher levels, but the market still needs a confirmed breakout above resistance to establish stronger bullish continuation.
MACD is positive, with readings near 0.05 and 0.04, while the histogram is approximately 0.02. RSI is around 65.44, above its average of 60.91, indicating improving bullish momentum.
However, price is approaching resistance, so a breakout should not be assumed before confirmation.
---
🔹 Key Levels From Chart
Current Price:
101.29
Immediate Resistance:
101.30–101.40
Ascending Support:
Rising blue trendline beneath price
Key Support Reference:
100.62
Major Demand Zone:
100.45–100.70
Lower Structural Reference:
99.90–100.00
---
🎯 Fibonacci Levels
Upside Targets:
TP1 → 101.34 (1.0 Fib)
TP2 → 101.58 (1.5 Fib)
TP3 → 101.81 (2.0 Fib)
TP4 → 102.05 (2.5 Fib)
TP5 → 102.29 (3.0 Fib)
TP6 → 102.53 (3.5 Fib)
Downside References:
101.10 → 100.86 → 100.62
---
📈 Technical Breakdown
SOL is trading within a tightening structure defined by horizontal resistance and rising support.
Repeated tests of the upper boundary suggest that buyers are challenging the 101.30–101.40 resistance area.
---
🧠 Quick Insight
“Pressure builds at resistance, but confirmation comes from the breakout, not the number of tests.”
---
⚠️ Disclaimer
This is personal market analysis, not financial advice.
This chart framework is for educational purposes only.
Always DYOR / DYODD, manage risk properly, and avoid emotional trading.
— @nayrbryanGaming
#SOL #SOLUSDT #Crypto #Trading #TechnicalAnalysis #PriceAction #Fibonacci #Binance #MACD #RSI #MarketStructure #DYOR
88
·
--
Baissier
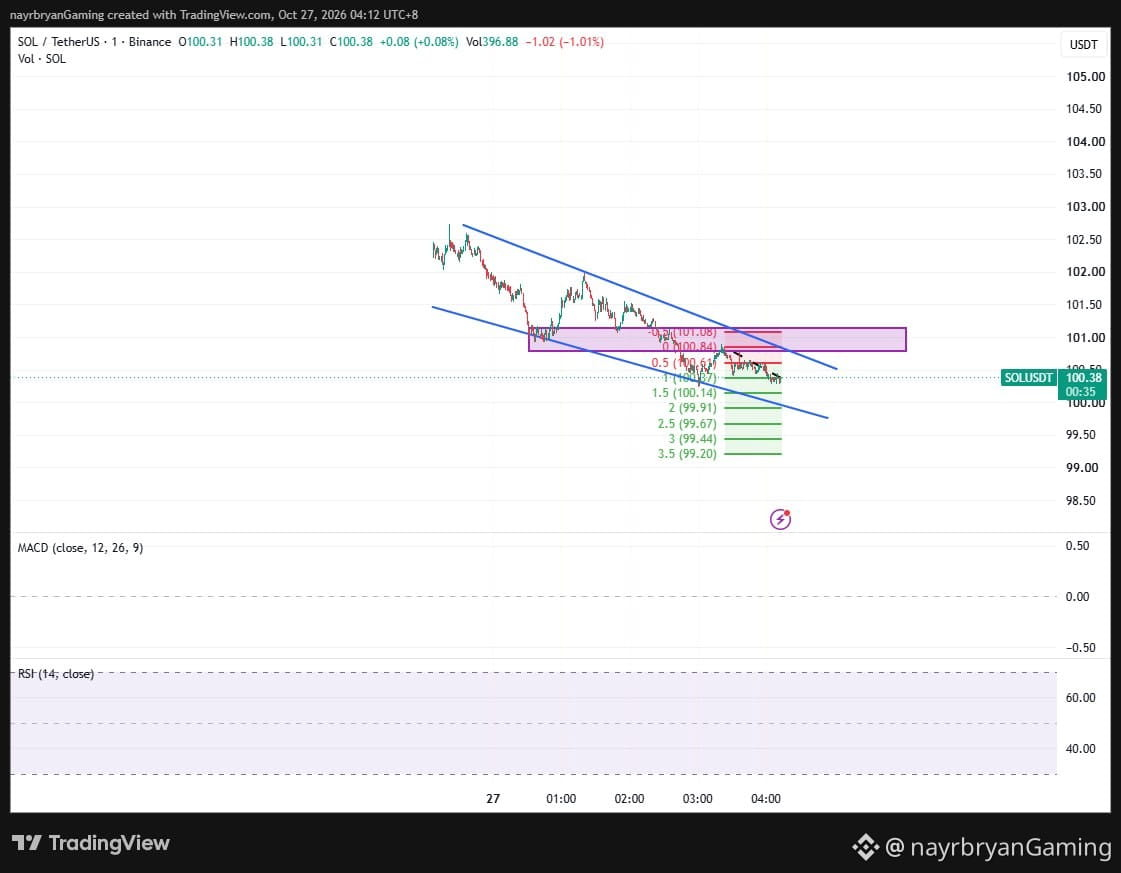
Broken support needs confirmation. Respect the descending channel, wait for price reaction, avoid chasing, and protect capital. #SOL #TradingDiscipline #NoFOMO
Broken support needs confirmation. Respect the descending channel, wait for price reaction, avoid chasing, and protect capital. #SOL #TradingDiscipline #NoFOMO
30
·
--
Baissier
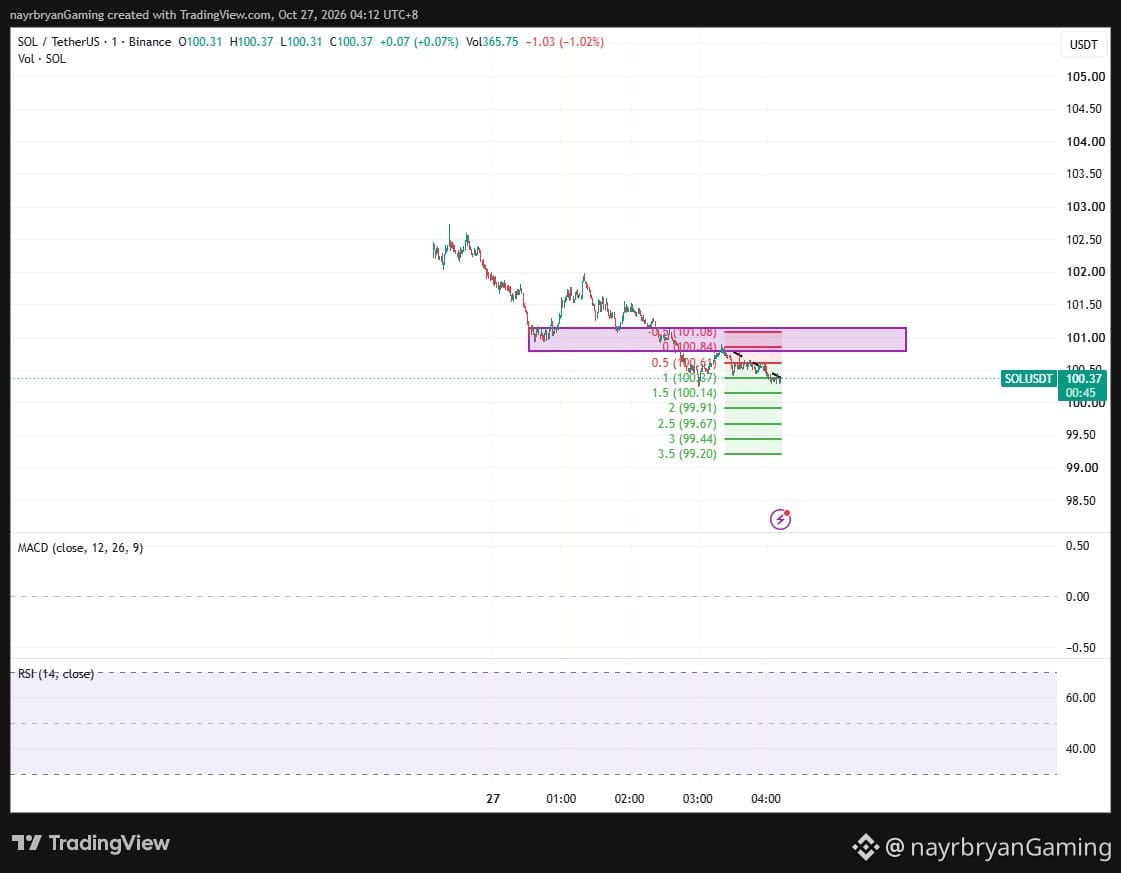
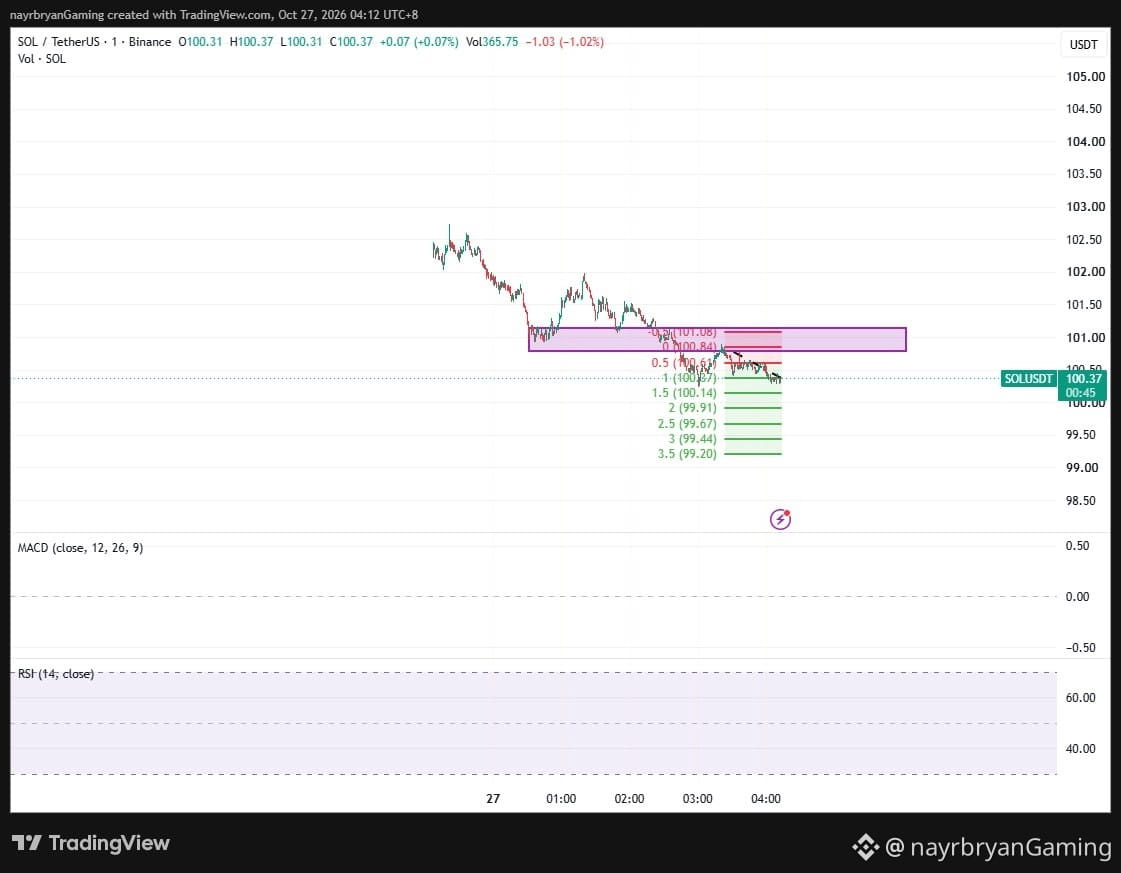
OL/USDT: Resistance 100.80–101.15. Bearish continuation may target 100.14 → 99.91 → 99.67 → 99.44 → 99.20. Reclaiming 101.15 weakens the setup. DYOR/NFA.
OL/USDT: Resistance 100.80–101.15. Bearish continuation may target 100.14 → 99.91 → 99.67 → 99.44 → 99.20. Reclaiming 101.15 weakens the setup. DYOR/NFA.
54
·
--
Baissier
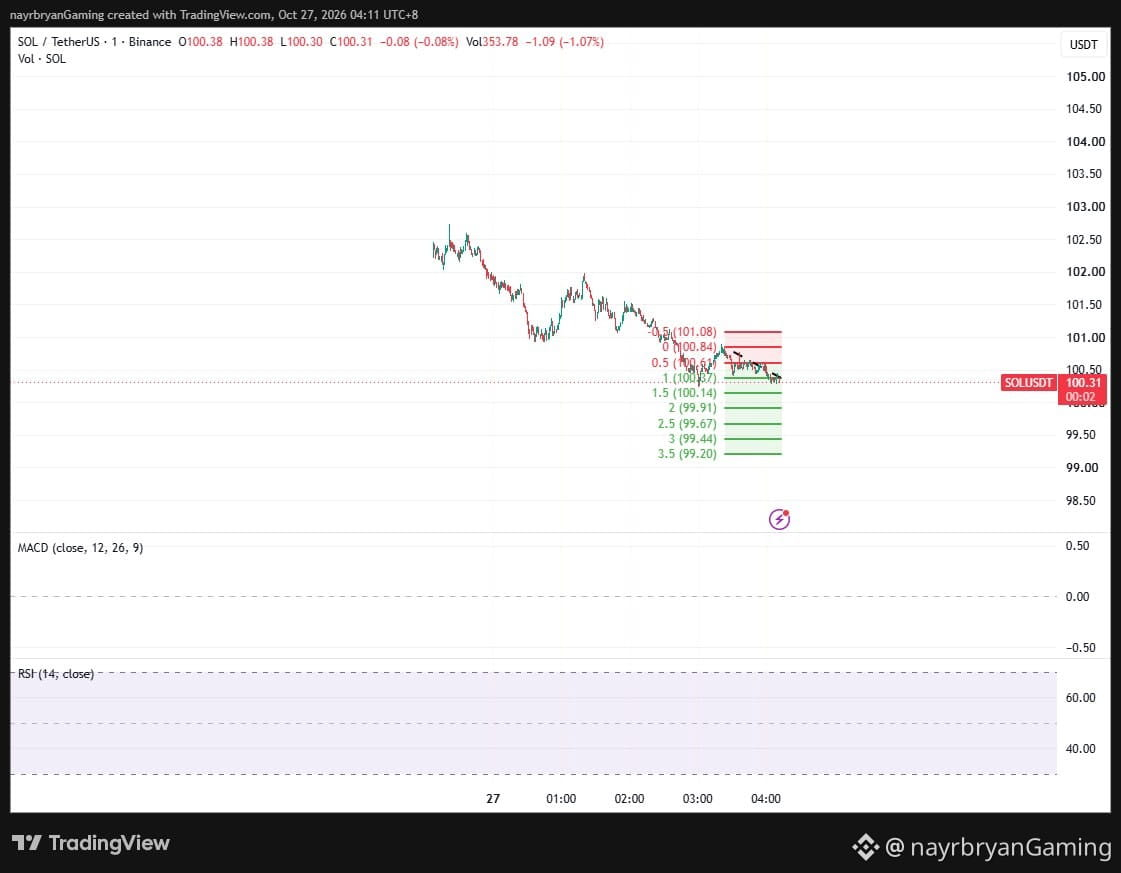
SOL 1m: Bearish channel, price 100.38 below 100.80–101.15 resistance. Downside levels: 100.14 → 99.91 → 99.67. DYOR/NFA.
SOL 1m: Bearish channel, price 100.38 below 100.80–101.15 resistance. Downside levels: 100.14 → 99.91 → 99.67. DYOR/NFA.
46
·
--
Baissier
TRADER MOTIVATION / MINI INSIGHT
🧠 Insight of the Day
“Broken support is not automatically a reversal opportunity. Watch how price reacts when it returns.”
---
Why This Matters
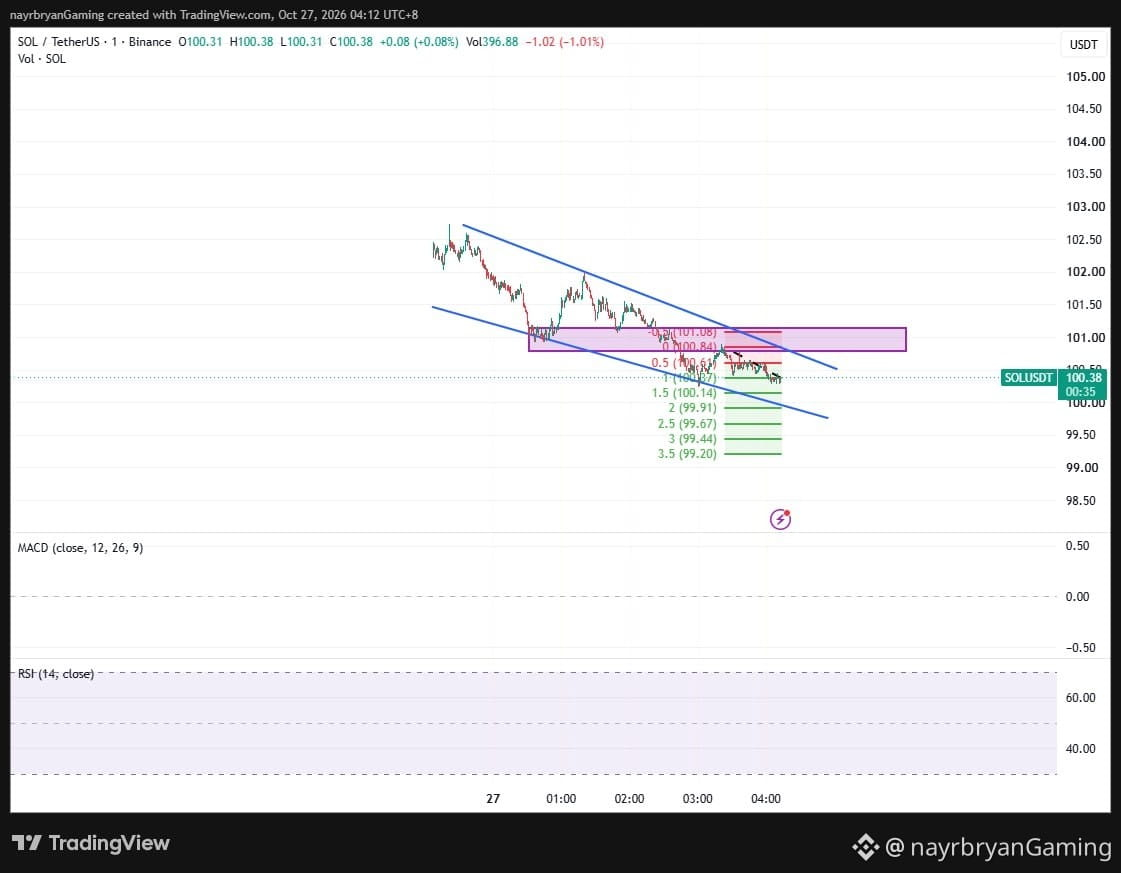
SOL has declined from the 102.50–102.70 region and moved beneath the 100.80–101.15 horizontal zone.
The descending channel suggests sellers have maintained short-term structural control.
The key question is whether the market continues lower or recovers enough to reclaim the broken zone.
---
🎯 Trader Checklist
Respect the descending channel.
Monitor 100.57–100.64 for immediate resistance.
Watch 100.37–100.30 for local support.
Track 100.14 as the next marked downside reference.
Avoid chasing extended candles.
Wait for confirmation before acting.
Protect capital and manage risk.
---
🧠 Mini Challenge
Before entering, ask:
“Am I following confirmed structure, or am I assuming the next candle will continue?”
Discipline comes from following a process, not predicting every move.
— @nayrbryanGaming
#TraderMindset #TradingDiscipline #NoFOMO #CryptoMindset #SOLUSDT #DYOR
🔔 Follow my Binance Square & X (@nayrbryanGaming) for daily chart insights.
56
·
--
Baissier
LIGHT ANALYSIS / CHART SETUP — SOL/USDT
📈 Structure Overview
Market phase:
Selloff → Support breakdown → Bearish consolidation
Current Price:
100.38
Key Resistance Zone:
100.80–101.15
Immediate Resistance:
100.57–100.64
Near-Term Support:
100.37–100.30
Downside Fibonacci Levels:
100.14 → 99.91 → 99.67 → 99.44 → 99.20
---
📌 What I'm Watching
Scenario A — Bearish Continuation
If SOL remains below 100.57–100.64 and breaks beneath the local consolidation, price may rotate toward:
100.37 → 100.14 → 99.91 → 99.67 → 99.44 → 99.20
Watch for price confirmation at each level rather than assuming every target will be reached.
Scenario B — Resistance Reclaim
If SOL recovers above 100.80 and reclaims the purple zone toward 101.15, the immediate bearish structure weakens.
A sustained recovery above the zone would warrant reassessing the descending-channel setup.
---
📊 Technical Check
Price Structure:
Descending channel with lower highs and lower lows.
Resistance:
100.80–101.15.
Downside Reference:
100.14.
Confirmation:
Breakdown below local support / reclaim of the purple resistance zone.
MACD & RSI:
Current readings are not legible in the screenshot; avoid assigning unverified momentum values.
---
Note:
This is a chart framework, not a trade recommendation.
Use it to support your own DYOR-based execution plan.
— @nayrbryanGaming
#SOLAnalysis #ChartSetup #PriceAction #SmartMoney #Fibonacci #CryptoTrading #TradingView #DYOR #NFA
65
·
--
Baissier
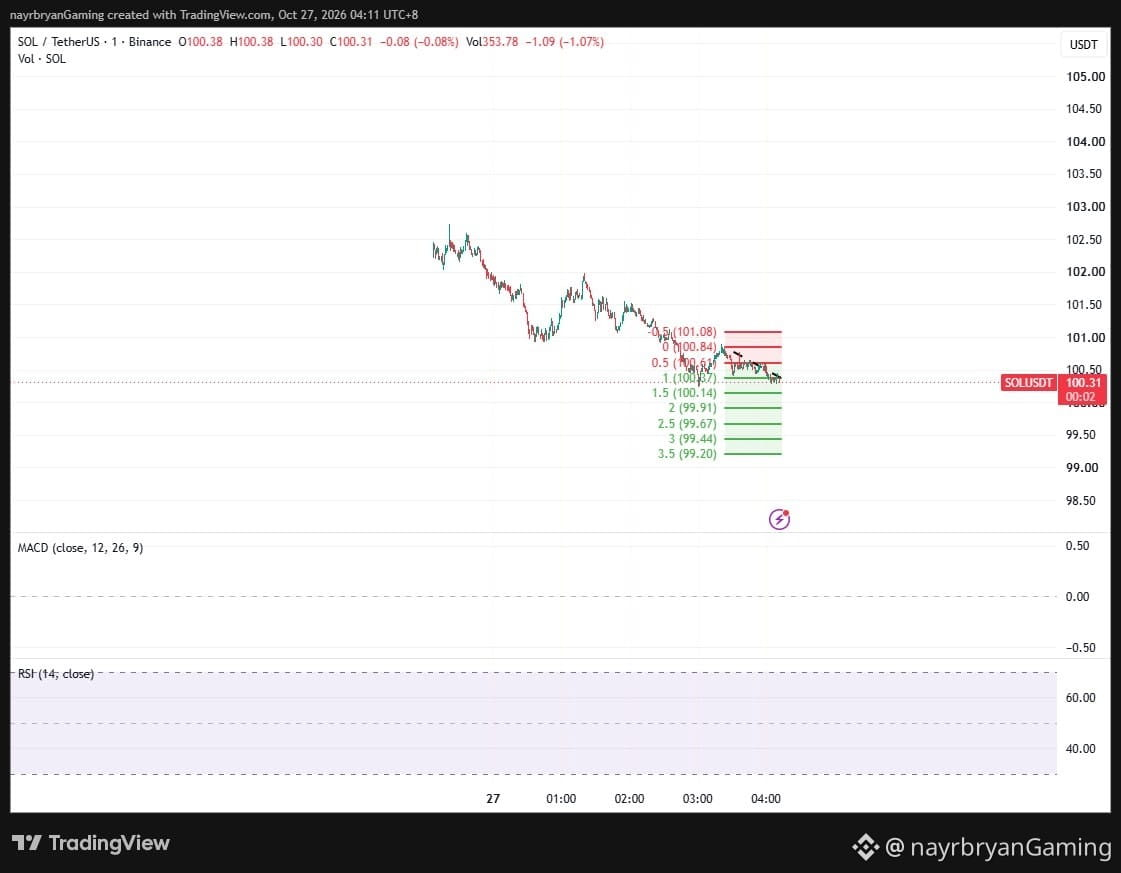
DAILY SIGNAL — SOL/USDT
Date: 27 Oct 2026
Timeframe: 1m
Intraday Bias: Bearish continuation → downside Fibonacci targets
---
📊 Market Bias
SOL is trading around 100.38 after declining from the 102.50–102.70 region and forming a clear descending channel.
Price has broken below the purple resistance zone around 100.80–101.15 and is consolidating beneath it.
The former support area has become a potential resistance zone. Unless SOL reclaims this structure, downside continuation remains the primary scenario to monitor.
---
🔹 Key Levels From Chart
Current Price:
100.38
Key Resistance Zone:
100.80–101.15
Immediate Resistance:
100.57–100.64
Channel Resistance:
Descending trendline above current price
Near-Term Support:
100.37–100.30
Major Downside Reference:
100.14
---
🎯 Fibonacci Levels
Downside Targets:
TP1 → 100.37 (0.5 Fib)
TP2 → 100.14 (1.5 Fib)
TP3 → 99.91 (2.0 Fib)
TP4 → 99.67 (2.5 Fib)
TP5 → 99.44 (3.0 Fib)
TP6 → 99.20 (3.5 Fib)
Invalidation Reference:
A sustained reclaim above 101.15 would weaken the immediate bearish structure.
---
📈 Technical Breakdown
SOL has formed a descending channel with lower highs and lower lows following rejection near 102.70.
Price subsequently lost the horizontal structure around 100.80–101.15 and is now trading below that zone.
The immediate focus is whether sellers can maintain control below 100.57–100.64.
A continued breakdown could expose the Fibonacci extensions at 100.14 → 99.91 → 99.67.
However, the chart's MACD and RSI panels do not display readable current indicator values, so their momentum readings cannot be reliably confirmed from this screenshot.
---
🧠 Quick Insight
“When support breaks, the next test is whether buyers can reclaim it. Until then, resistance deserves respect.”
---
⚠️ Disclaimer
This is personal market analysis, not financial advice.
This chart framework is for educational purposes only.
Always DYOR / DYODD, manage risk properly, and avoid emotional trading.
— @nayrbryanGaming
#SOL #SOLUSDT #Crypto #Trading #TechnicalAnalysis #PriceAction
104
·
--
Haussier
A bounce is not confirmation. Watch 102.08 for a reclaim and 101.60 for support. Wait for structure, avoid chasing, and protect capital. #SOL #NoFOMO
A bounce is not confirmation. Watch 102.08 for a reclaim and 101.60 for support. Wait for structure, avoid chasing, and protect capital. #SOL #NoFOMO
41
·
--
Haussier
SOL/USDT: Support 101.60–101.68. Resistance 102.00–102.08. Breakout may target 102.20 → 102.37. Breakdown risks 101.53. DYOR/NFA.
SOL/USDT: Support 101.60–101.68. Resistance 102.00–102.08. Breakout may target 102.20 → 102.37. Breakdown risks 101.53. DYOR/NFA.
52
Connectez-vous pour découvrir plus de contenu
Rejoignez la communauté mondiale des adeptes de cryptomonnaies sur Binance Square
⚡️ Suviez les dernières informations importantes sur les cryptomonnaies.
💬 Jugé digne de confiance par la plus grande plateforme d’échange de cryptomonnaies au monde.
👍 Découvrez les connaissances que partagent les créateurs vérifiés.
Adresse e-mail/Nº de téléphone