DAILY SIGNAL — SOL/USDT
Date: 29 Oct 2026
Chart Time: 03:19 UTC+8
Timeframe: 1m
Intraday Bias: Consolidation → reaction at support → breakout watch
📊 MARKET BIAS
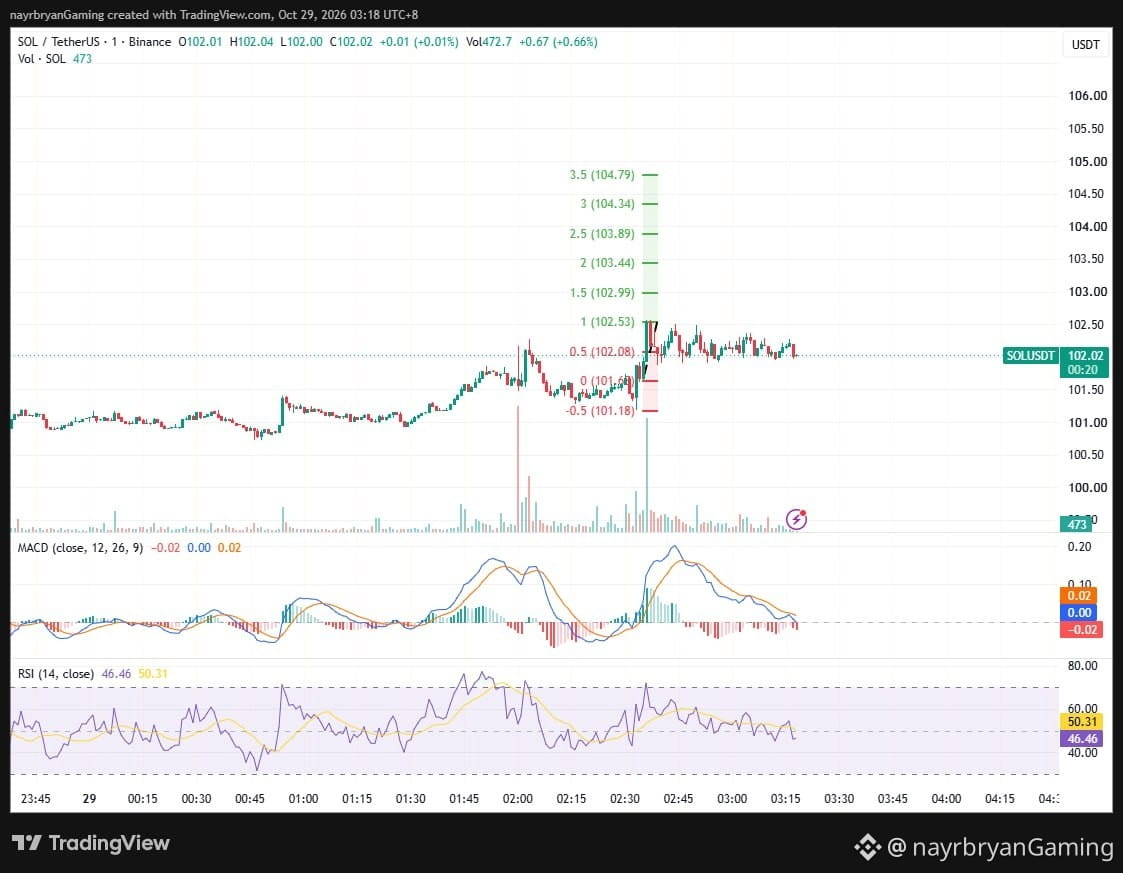
SOL/USDT is consolidating around 102.06 after a sharp upward impulse toward the 102.50 area.
Price is moving sideways near the purple support/resistance zone while remaining inside the broader ascending channel drawn on the chart.
However, momentum has cooled after the initial rally. MACD is showing a slightly bearish short-term configuration, while RSI is near 48, indicating neutral momentum with a mild loss of strength.
The next important test is whether SOL can hold the 101.90–102.08 area and reclaim the upper resistance around 102.53.
🔹 KEY LEVELS FROM CHART
Current Price: 102.06
Key Reaction Zone:
101.90–102.08
Major Structure Support:
101.60
Lower Invalidation Reference:
101.18
Key Upside Reclaim:
102.53
📈 FIBONACCI LEVELS
Upside Targets:
TP1 → 102.53 (1.0 Fib)
TP2 → 102.99 (1.5 Fib)
TP3 → 103.44 (2.0 Fib)
TP4 → 103.89 (2.5 Fib)
TP5 → 104.34 (3.0 Fib)
TP6 → 104.79 (3.5 Fib)
Downside Levels:
101.60 → 101.18
📊 TECHNICAL BREAKDOWN
SOL previously advanced from the lower part of its ascending channel and briefly reached the 102.50 region.
🧠 QUICK INSIGHT
“Consolidation after a breakout is a test of strength. The next confirmed move matters more than the previous candle.”
⚠️ DISCLAIMER
This is personal technical analysis for educational purposes only, not financial advice or a guaranteed trading signal.
Always DYOR / DYODD, manage risk carefully, and avoid emotional trading.
— @nayrbryanGaming
#SOL #SOLUSDT #Crypto #Trading #TechnicalAnalysis #PriceAction #Fibonacci #Binance #DYOR #NFA #NoFOMO