Binance Square
Libra
11.7k Publications

Libra

BNB Holder || Financial Analyst || Providing investors with the latest market news.
Ouvert au trading

Trade régulièrement
5.4 an(s)
70 Suivis
540 Abonnés
1.8K+ J’aime
Publications
Portefeuille
·
--
$UAI Hi UAI holders! It broke and did a MSS at 0.38. I think this coin will moon sooner. Let's see
$UAI

Hi UAI holders! It broke and did a MSS at 0.38.
I think this coin will moon sooner. Let's see
·
--
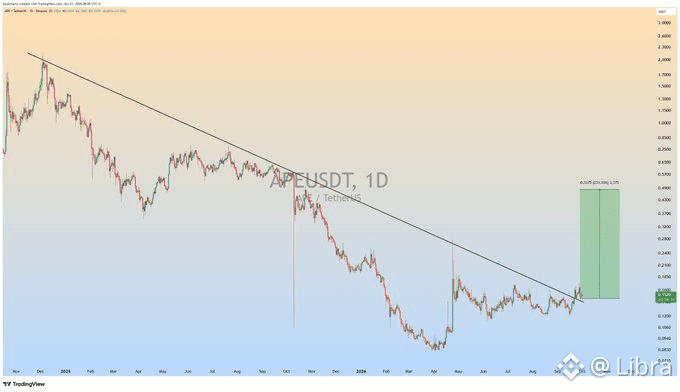
$APE is showing a Bearish Flag after a strong impulse move, but buyers are starting to reclaim key support 👀 Price is consolidating near resistance with momentum gradually improving. If bulls invalidate the bearish flag by breaking above the current range, buying pressure could accelerate quickly. 📈 A confirmed breakout would shift momentum back in favor of the bulls and could trigger a fresh rally toward the next resistance zone. Bulls are slowly reclaiming control. 🔥 Market sentiment is cautiously bullish — APE could be setting up for its next expansion move. 🚀
$APE is showing a Bearish Flag after a strong impulse move, but buyers are starting to reclaim key support
👀

Price is consolidating near resistance with momentum gradually improving. If bulls invalidate the bearish flag by breaking above the current range, buying pressure could accelerate quickly.
📈

A confirmed breakout would shift momentum back in favor of the bulls and could trigger a fresh rally toward the next resistance zone. Bulls are slowly reclaiming control.
🔥

Market sentiment is cautiously bullish — APE could be setting up for its next expansion move.
🚀
·
--
$FIL is showing a potential Double Bottom after an earlier Bearish Flag breakdown 👀 Buyers are defending support aggressively, and the second bounce from the same zone suggests selling pressure is fading. Momentum is building for a reversal if FIL breaks above the local resistance. 📈 A confirmed breakout could trigger a strong relief rally toward the marked upside target, with bulls slowly reclaiming control after the recent selloff. 🔥 Market sentiment is turning cautiously bullish — this could be setting up for a major expansion move. 🚀
$FIL is showing a potential Double Bottom after an earlier Bearish Flag breakdown
👀

Buyers are defending support aggressively, and the second bounce from the same zone suggests selling pressure is fading. Momentum is building for a reversal if FIL breaks above the local resistance.
📈

A confirmed breakout could trigger a strong relief rally toward the marked upside target, with bulls slowly reclaiming control after the recent selloff.
🔥

Market sentiment is turning cautiously bullish — this could be setting up for a major expansion move.
🚀
·
--
$TURBO is printing a Falling Wedge on the 15m chart 👀 Price continues to compress after a sharp pullback, with selling pressure fading inside the wedge. This pattern often signals bearish exhaustion, and buyers could step in if the upper trendline is reclaimed. 📈 A confirmed breakout above wedge resistance may trigger a relief rally toward the highlighted target zone, while holding current support remains key for bullish continuation. 🔥 Market sentiment is turning cautiously bullish — TURBO could be setting up for a breakout expansion move. 🚀
$TURBO is printing a Falling Wedge on the 15m chart
👀

Price continues to compress after a sharp pullback, with selling pressure fading inside the wedge. This pattern often signals bearish exhaustion, and buyers could step in if the upper trendline is reclaimed.
📈

A confirmed breakout above wedge resistance may trigger a relief rally toward the highlighted target zone, while holding current support remains key for bullish continuation.
🔥

Market sentiment is turning cautiously bullish — TURBO could be setting up for a breakout expansion move.
🚀
·
--
$HEI đã bật lên từ mức hỗ trợ. Trông khá mạnh. Mong đợi một đợt tăng giá đẹp. Xem sao.
$HEI
đã bật lên từ mức hỗ trợ. Trông khá mạnh.

Mong đợi một đợt tăng giá đẹp. Xem sao.
·
--
$IO is flashing a potential Double Top on the 5m chart 👀 After a sharp recovery, price has tested the same resistance twice and is struggling to break higher. The repeated rejection hints that bullish momentum is fading, while the earlier Rising Wedge adds to the short-term caution. 📉 A confirmed breakdown below the neckline could accelerate selling toward the highlighted target, while reclaiming the recent highs would invalidate the bearish setup. Watch for volume confirmation. 🔥 Market sentiment is cautiously bearish — IO is at a key inflection point where sellers are trying to regain control. ⚠️
$IO is flashing a potential Double Top on the 5m chart
👀

After a sharp recovery, price has tested the same resistance twice and is struggling to break higher. The repeated rejection hints that bullish momentum is fading, while the earlier Rising Wedge adds to the short-term caution.
📉

A confirmed breakdown below the neckline could accelerate selling toward the highlighted target, while reclaiming the recent highs would invalidate the bearish setup. Watch for volume confirmation.
🔥

Market sentiment is cautiously bearish — IO is at a key inflection point where sellers are trying to regain control.
⚠️
·
--
Mọi người gọi $XLM là nhàm chán. Đó có lẽ là lý do tại sao rất nhiều nhà giao dịch cứ bỏ lỡ nó. Nó thường không di chuyển hàng tuần. Nó dành hàng tháng… đôi khi hàng năm… để hoàn toàn không làm gì cả. Rồi, gần như từ hư không, nó thức giấc. Và khi nó làm vậy, những biến động không hề nhỏ. Chỉ cần nhìn vào hai đợt mở rộng lớn gần đây. Đợt đầu tiên mang về hơn 3.200%. Nhiều năm sau, sau một giai đoạn tích lũy dài khác, nó lại in ra một đợt tăng giá khác vượt quá 700%. Thị trường khác biệt. Chu kỳ khác biệt. Hành vi thì giống nhau. Đó là điều khiến biểu đồ này trở nên thú vị đến vậy. Một lần nữa, $XLM đã dành thời gian dài để nguội lạnh sau đợt chạy trước đó. Tâm lý đã phai nhạt. Khối lượng đã chậm lại. Hầu hết mọi người đã chuyển sang những câu chuyện mới nhất. Nhưng đó thường là lúc những thiết lập mạnh mẽ nhất lặng lẽ bắt đầu hình thành. Thị trường không thưởng cho sự kiên nhẫn ngay lập tức. Chúng thường khiến bạn nghi ngờ vị thế của mình trước. Rồi, khi hầu như không ai còn mong đợi nữa, đà tăng quay trở lại một lúc. Tôi không nói rằng lịch sử phải lặp lại chính xác. Nó không bao giờ lặp lại hoàn hảo. Nhưng nó có thói quen vần điệu. Và nếu $XLM tuân theo nhịp điệu giống như nó đã tôn trọng trong nhiều năm giai đoạn mở rộng tiếp theo có thể khiến rất nhiều người đã ngừng chú ý từ lâu phải bất ngờ.
Mọi người gọi $XLM
là nhàm chán.

Đó có lẽ là lý do tại sao rất nhiều nhà giao dịch cứ bỏ lỡ nó.

Nó thường không di chuyển hàng tuần.

Nó dành hàng tháng… đôi khi hàng năm… để hoàn toàn không làm gì cả.

Rồi, gần như từ hư không, nó thức giấc.

Và khi nó làm vậy, những biến động không hề nhỏ.

Chỉ cần nhìn vào hai đợt mở rộng lớn gần đây.

Đợt đầu tiên mang về hơn 3.200%.

Nhiều năm sau, sau một giai đoạn tích lũy dài khác, nó lại in ra một đợt tăng giá khác vượt quá 700%.

Thị trường khác biệt.

Chu kỳ khác biệt.

Hành vi thì giống nhau.

Đó là điều khiến biểu đồ này trở nên thú vị đến vậy.

Một lần nữa,
$XLM
đã dành thời gian dài để nguội lạnh sau đợt chạy trước đó.

Tâm lý đã phai nhạt.

Khối lượng đã chậm lại.

Hầu hết mọi người đã chuyển sang những câu chuyện mới nhất.

Nhưng đó thường là lúc những thiết lập mạnh mẽ nhất lặng lẽ bắt đầu hình thành.

Thị trường không thưởng cho sự kiên nhẫn ngay lập tức.

Chúng thường khiến bạn nghi ngờ vị thế của mình trước.

Rồi, khi hầu như không ai còn mong đợi nữa, đà tăng quay trở lại một lúc.

Tôi không nói rằng lịch sử phải lặp lại chính xác.

Nó không bao giờ lặp lại hoàn hảo.

Nhưng nó có thói quen vần điệu.

Và nếu
$XLM
tuân theo nhịp điệu giống như nó đã tôn trọng trong nhiều năm

giai đoạn mở rộng tiếp theo có thể khiến rất nhiều người đã ngừng chú ý từ lâu phải bất ngờ.
·
--
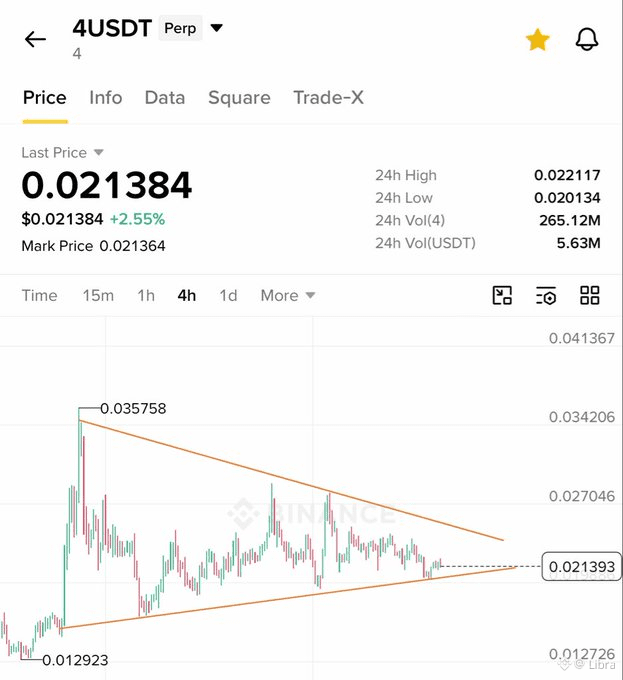
$AI #Aİ Testing crucial resistance from verge of Triangle on 1D Chart. Breakout could trigger a solid recovery move towards $0.0450 and above ✍️
$AI #Aİ

Testing crucial resistance from verge of Triangle on 1D Chart.
Breakout could trigger a solid recovery move towards $0.0450 and above
✍️
·
--
🚨$LUMIA Looks Ready👀 Falling wedge breakout✅ Bullish divergence confirmed📈 Smart money buys near the bottom and stays patient. Accumulation here could pay off big.🚀🔥
🚨$LUMIA Looks Ready👀

Falling wedge breakout✅

Bullish divergence confirmed📈

Smart money buys near the bottom and stays patient.

Accumulation here could pay off big.🚀🔥
·
--
$ZRO is printing a Triple Bottom on the 5m chart 👀 Buyers have defended the same support zone three times, signaling strong demand after the recent decline. While an earlier Rising Wedge saw profit-taking, the triple-bottom structure suggests momentum could be shifting back in favor of the bulls. 📈 A confirmed breakout above the neckline could trigger a sharp recovery toward the highlighted target, while losing the triple-bottom support would invalidate the setup. Watch for volume confirmation. 🔥 Market sentiment is cautiously bullish — ZRO looks like it's building energy for a potential breakout move. 🚀
$ZRO is printing a Triple Bottom on the 5m chart
👀

Buyers have defended the same support zone three times, signaling strong demand after the recent decline. While an earlier Rising Wedge saw profit-taking, the triple-bottom structure suggests momentum could be shifting back in favor of the bulls.
📈

A confirmed breakout above the neckline could trigger a sharp recovery toward the highlighted target, while losing the triple-bottom support would invalidate the setup. Watch for volume confirmation.
🔥

Market sentiment is cautiously bullish — ZRO looks like it's building energy for a potential breakout move.
🚀
·
--
$KMNO /USDT $KMNO is showing rejection near its 24h high of 0.02167. Looking for a short position on this pullback. Entry: 0.02100 - 0.02120 TP1: 0.02010 TP2: 0.01950 SL: 0.02190 Manage your risk. High volatility.
$KMNO
/USDT

$KMNO
is showing rejection near its 24h high of 0.02167. Looking for a short position on this pullback.
Entry: 0.02100 - 0.02120
TP1: 0.02010
TP2: 0.01950
SL: 0.02190
Manage your risk. High volatility.
·
--
🤔 Nếu $LAB đã xong... Thì hãy cho tôi biết: Đồng coin bơm giá tội phạm tiếp theo là gì? $LAB đã tăng từ khoảng $0.20 lên $20+ Bây giờ nó đã quay lại gần $2.5 sau một trong những đợt phân phối lớn nhất mà tôi từng thấy trong năm nay. Mỗi chu kỳ đều có một đồng như vậy. $LAB là một trong số đó. Ai sẽ là người tiếp theo? 👀
🤔
Nếu $LAB
đã xong...

Thì hãy cho tôi biết:
Đồng coin bơm giá tội phạm tiếp theo là gì?

$LAB
đã tăng từ khoảng $0.20 lên $20+

Bây giờ nó đã quay lại gần $2.5 sau một trong những đợt phân phối lớn nhất mà tôi từng thấy trong năm nay.

Mỗi chu kỳ đều có một đồng như vậy.

$LAB
là một trong số đó.

Ai sẽ là người tiếp theo?
👀
·
--
This breakout is not finished yet... smart money still wants higher prices. $AI just exploded from the base with strong momentum and buyers are still holding the move. No panic chase. Wait for the clean retest and take the high-probability entry. Momentum is clearly Bullish. Direction: Bullish Entry Zone: 0.0233 – 0.0237 Stop Loss: 0.0224 TP1: 0.0250 TP2: 0.0262 TP3: 0.0278 This is the kind of setup I like to take with patience, not emotion.
This breakout is not finished yet... smart money still wants higher prices.

$AI
just exploded from the base with strong momentum and buyers are still holding the move.
No panic chase. Wait for the clean retest and take the high-probability entry.
Momentum is clearly Bullish.

Direction: Bullish

Entry Zone: 0.0233 – 0.0237
Stop Loss: 0.0224

TP1: 0.0250
TP2: 0.0262
TP3: 0.0278

This is the kind of setup I like to take with patience, not emotion.
·
--
$NEAR has already proven it can create life-changing moves. Not once. But twice. The first cycle took it from obscurity to over $20. Most people thought that was the peak. Then, after a brutal bear market it came back and printed a brand-new all-time high above $70. That’s something very few altcoins manage to do. Now look at where the chart sits today. After years of cooling off price is once again building from the same type of base that preceded previous expansions. But what really stands out to me isn’t just the accumulation. It’s the long-term trendline. Every major cycle has respected it. The previous all-time high formed almost perfectly around that level. If history continues to rhyme the next expansion could once again push price into that same region. Markets love symmetry. They rarely move in straight lines but they often revisit the same structures over multiple cycles. That’s why I think this chart deserves attention. Not because another 4,000%+ rally is guaranteed… But because the setup looks remarkably similar to the ones that came before. The funny thing about crypto is that everyone wants to buy strength… Yet the biggest opportunities usually appear when a chart has spent months doing absolutely nothing. If $NEAR starts reclaiming momentum don’t be surprised if people suddenly remember why it became one of the strongest performers of previous cycles.
$NEAR
has already proven it can create life-changing moves.

Not once.

But twice.

The first cycle took it from obscurity to over $20.

Most people thought that was the peak.

Then, after a brutal bear market

it came back and printed a brand-new all-time high above $70.

That’s something very few altcoins manage to do.

Now look at where the chart sits today.

After years of cooling off

price is once again building from the same type of base that preceded previous expansions.

But what really stands out to me isn’t just the accumulation.

It’s the long-term trendline.

Every major cycle has respected it.

The previous all-time high formed almost perfectly around that level.

If history continues to rhyme

the next expansion could once again push price into that same region.

Markets love symmetry.

They rarely move in straight lines

but they often revisit the same structures over multiple cycles.

That’s why I think this chart deserves attention.

Not because another 4,000%+ rally is guaranteed…

But because the setup looks remarkably similar to the ones that came before.

The funny thing about crypto is that everyone wants to buy strength…

Yet the biggest opportunities usually appear when a chart has spent months doing absolutely nothing.

If
$NEAR
starts reclaiming momentum

don’t be surprised if people suddenly remember why it became one of the strongest performers of previous cycles.
·
--
$JTO đang cho thấy một mô hình Đáy Đôi tiềm năng sau một đợt bán tháo mạnh, theo sau sự phá vỡ từ mô hình Nêm Tăng 👀 Người mua đang tham gia quanh vùng hỗ trợ, cho thấy áp lực bán đang giảm dần. Nếu vùng đáy này được giữ vững, đà tăng có thể bắt đầu chuyển dịch trở lại có lợi cho phe bò. 📈 Việc lấy lại mạnh mẽ trên vùng kháng cự swing gần đây sẽ xác nhận sự phục hồi và có thể khơi dậy một đợt tăng giá cứu trợ hướng tới mục tiêu tăng giá đã đánh dấu. Phe bò đang tìm cách lấy lại quyền kiểm soát. 🔥 Tâm lý thị trường đang thận trọng tăng giá — hãy theo dõi sự xác nhận vì JTO có thể đang chuẩn bị cho động thái mở rộng tiếp theo. 🚀
$JTO đang cho thấy một mô hình Đáy Đôi tiềm năng sau một đợt bán tháo mạnh, theo sau sự phá vỡ từ mô hình Nêm Tăng
👀

Người mua đang tham gia quanh vùng hỗ trợ, cho thấy áp lực bán đang giảm dần. Nếu vùng đáy này được giữ vững, đà tăng có thể bắt đầu chuyển dịch trở lại có lợi cho phe bò.
📈

Việc lấy lại mạnh mẽ trên vùng kháng cự swing gần đây sẽ xác nhận sự phục hồi và có thể khơi dậy một đợt tăng giá cứu trợ hướng tới mục tiêu tăng giá đã đánh dấu. Phe bò đang tìm cách lấy lại quyền kiểm soát.
🔥

Tâm lý thị trường đang thận trọng tăng giá — hãy theo dõi sự xác nhận vì JTO có thể đang chuẩn bị cho động thái mở rộng tiếp theo.
🚀
·
--
Không phải mọi động thái đều bắt đầu bằng một cây nến đột phá. Đôi khi cấu trúc được xây dựng một cách lặng lẽ trước 👀 $CLO đã được củng cố sau động thái trước đó, tạo ra một cấu trúc đáng theo dõi. Các mức thấp cao hơn đang hình thành, áp lực đang tích tụ, và phản ứng tiếp theo quanh mức kháng cự sẽ rất quan trọng. Đừng vội. Đừng đuổi theo. Chỉ theo dõi cách giá phản ứng. 📈 DYOR | NFA
Không phải mọi động thái đều bắt đầu bằng một cây nến đột phá. Đôi khi cấu trúc được xây dựng một cách lặng lẽ trước
👀

$CLO
đã được củng cố sau động thái trước đó, tạo ra một cấu trúc đáng theo dõi.

Các mức thấp cao hơn đang hình thành, áp lực đang tích tụ, và phản ứng tiếp theo quanh mức kháng cự sẽ rất quan trọng.

Đừng vội. Đừng đuổi theo. Chỉ theo dõi cách giá phản ứng.
📈

DYOR | NFA
·
--
Liquidity just got swept... now the real move begins. $UNI is holding strong after a sharp breakout and buyers are defending the pullback. If this support stays intact, another push higher looks very possible. Bullish Entry Zone: 3.31 – 3.33 SL: 3.25 TP1: 3.39 TP2: 3.46 TP3: 3.55 Stay disciplined, manage your risk, and let the market do the work.
Liquidity just got swept... now the real move begins.

$UNI
is holding strong after a sharp breakout and buyers are defending the pullback. If this support stays intact, another push higher looks very possible.

Bullish
Entry Zone: 3.31 – 3.33
SL: 3.25
TP1: 3.39
TP2: 3.46
TP3: 3.55

Stay disciplined, manage your risk, and let the market do the work.
·
--
Everyone remembers $DASH at $400 Almost nobody remembers what the chart looked like before that move. That’s usually how markets work. The exciting part only becomes obvious after it’s already over. Right now, $DASH is sitting in the same area where previous major rallies were born. More importantly, it’s pressing against a multi-year descending trendline that’s been acting as resistance ever since the all-time high. If that level finally gives way, the technical picture changes completely. A breakout from a trendline that has held for years isn’t just another green candle. It’s often the signal that long-term seller pressure has finally been absorbed. That’s when trend reversals tend to accelerate. The chart is also interesting from a risk/reward perspective. After years of bleeding, most weak hands have already disappeared. Expectations are low. Liquidity is thin. Almost nobody is paying attention anymore. Ironically, that’s the exact environment where some of crypto’s biggest moves have started in previous cycles. Could $DASH really revisit the old highs? Maybe. Maybe not. But if this breakout confirms, the upside from current levels is dramatically larger than the downside many traders are focusing on. Sometimes the hardest trades are simply buying something the market has spent years convincing everyone to ignore.
Everyone remembers $DASH at $400

Almost nobody remembers what the chart looked like before that move.

That’s usually how markets work.

The exciting part only becomes obvious after it’s already over.

Right now, $DASH is sitting in the same area where previous major rallies were born.

More importantly, it’s pressing against a multi-year descending trendline that’s been acting as resistance ever since the all-time high.

If that level finally gives way, the technical picture changes completely.

A breakout from a trendline that has held for years isn’t just another green candle.

It’s often the signal that long-term seller pressure has finally been absorbed.

That’s when trend reversals tend to accelerate.

The chart is also interesting from a risk/reward perspective.

After years of bleeding, most weak hands have already disappeared.

Expectations are low.

Liquidity is thin.

Almost nobody is paying attention anymore.

Ironically, that’s the exact environment where some of crypto’s biggest moves have started in previous cycles.

Could $DASH really revisit the old highs?

Maybe.

Maybe not.

But if this breakout confirms, the upside from current levels is dramatically larger than the downside many traders are focusing on.

Sometimes the hardest trades are simply buying something the market has spent years convincing everyone to ignore.
·
--
Remember when $CHZ was everywhere? Every football partnership. Every exchange campaign. Every influencer was calling it the future of fan engagement. Today? Almost complete silence. And that’s exactly what caught my attention. The chart has spent nearly four years bleeding lower. Not because it kept making new fundamental mistakes every month. But because every rally was met by the same thing: relentless seller pressure. You can literally see it on the chart. One long, persistent downtrend that refused to break. Eventually, though, every trend reaches a point where there’s simply nobody left to sell. That’s where things start getting interesting. $CHZ is now trading around the exact area where that multi-year decline appears to be exhausting itself. If buyers manage to reclaim control, this won’t just be another bounce. It would mark the beginning of an entirely new phase for the chart. And that’s an important distinction. Markets rarely go from “dead” to making new highs overnight. They first transition from distribution… …to accumulation… …and only then into expansion. That’s the phase I’m watching. Does this mean a 3,000%+ rally is guaranteed? Of course not. Crypto doesn’t hand out guarantees. But some of the biggest winners of every cycle start from charts that look exactly like this: Forgotten. Ignored. Left for dead. By the time everyone starts talking about them again, the easy part of the move is usually already over.
Remember when $CHZ
was everywhere?

Every football partnership.

Every exchange campaign.

Every influencer was calling it the future of fan engagement.

Today?

Almost complete silence.

And that’s exactly what caught my attention.

The chart has spent nearly four years bleeding lower.

Not because it kept making new fundamental mistakes every month.

But because every rally was met by the same thing: relentless seller pressure.

You can literally see it on the chart.

One long, persistent downtrend that refused to break.

Eventually, though, every trend reaches a point where there’s simply nobody left to sell.

That’s where things start getting interesting.

$CHZ
is now trading around the exact area where that multi-year decline appears to be exhausting itself.

If buyers manage to reclaim control, this won’t just be another bounce.

It would mark the beginning of an entirely new phase for the chart.

And that’s an important distinction.

Markets rarely go from “dead” to making new highs overnight.

They first transition from distribution…

…to accumulation…

…and only then into expansion.

That’s the phase I’m watching.

Does this mean a 3,000%+ rally is guaranteed?

Of course not.

Crypto doesn’t hand out guarantees.

But some of the biggest winners of every cycle start from charts that look exactly like this:

Forgotten.

Ignored.

Left for dead.

By the time everyone starts talking about them again, the easy part of the move is usually already over.
·
--
$BANANA #BANANA Broken Falling Wedge and now retesting on 1D Chart. Positive retest could send it towards $6 and above during coming sessions ✍️
$BANANA #BANANA

Broken Falling Wedge and now retesting on 1D Chart.
Positive retest could send it towards $6 and above during coming sessions
✍️
Connectez-vous pour découvrir plus de contenu
Rejoignez la communauté mondiale des adeptes de cryptomonnaies sur Binance Square
⚡️ Suviez les dernières informations importantes sur les cryptomonnaies.
💬 Jugé digne de confiance par la plus grande plateforme d’échange de cryptomonnaies au monde.
👍 Découvrez les connaissances que partagent les créateurs vérifiés.
Adresse e-mail/Nº de téléphone
Plan du site
Préférences de cookies
CGU de la plateforme