

حسينہ
23 Publications

حسينہ
Signaler
Bloquer l’utilisateur
No Enjoyment Like Reading 📚
Ouvert au trading
Trade régulièrement
1.1 an(s)
3 Suivis
52 Abonnés
109 J’aime
Publications
Portefeuille
·
--
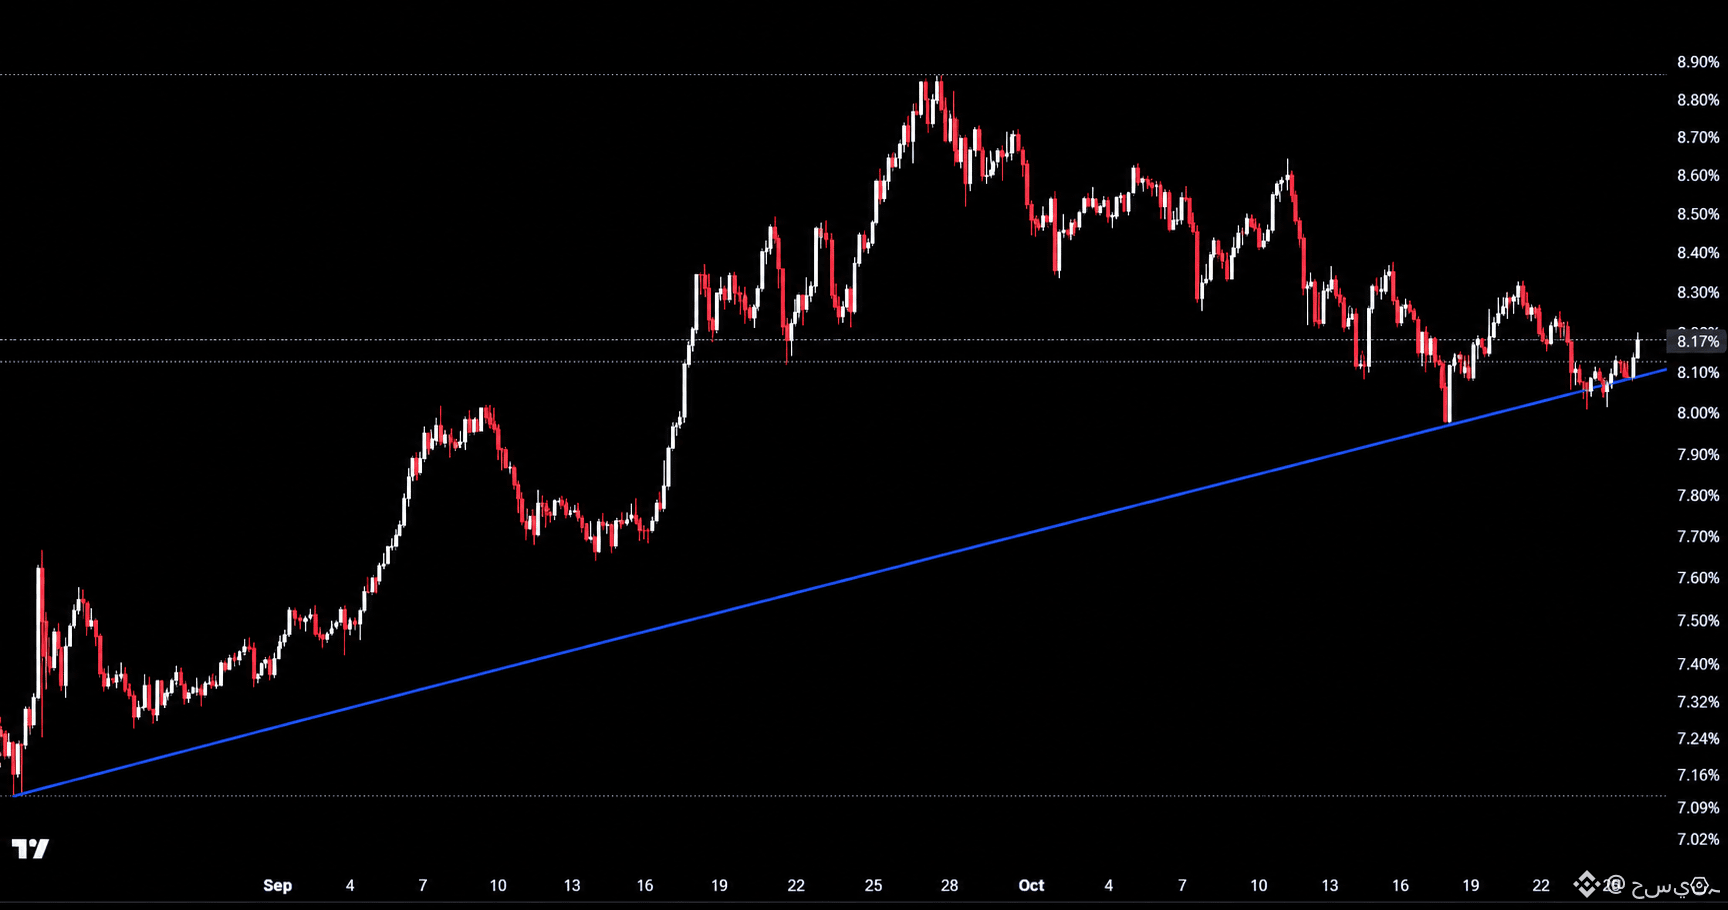
$Altcoin dominance (excluding the top 10) is at 8.17%, retesting the rising trendline from August near 8.08% once again and bouncing from it, a structure that keeps favoring altcoins as long as it holds.
Hold this trendline and dominance pushes back toward 8.30% to 8.60%, with altcoins gaining ground on Bitcoin. Lose it and this drops toward 7.80% to 7.70%, and the altcoin rotation stalls. #Altcoins
Hold this trendline and dominance pushes back toward 8.30% to 8.60%, with altcoins gaining ground on Bitcoin. Lose it and this drops toward 7.80% to 7.70%, and the altcoin rotation stalls. #Altcoins
2
44
·
--
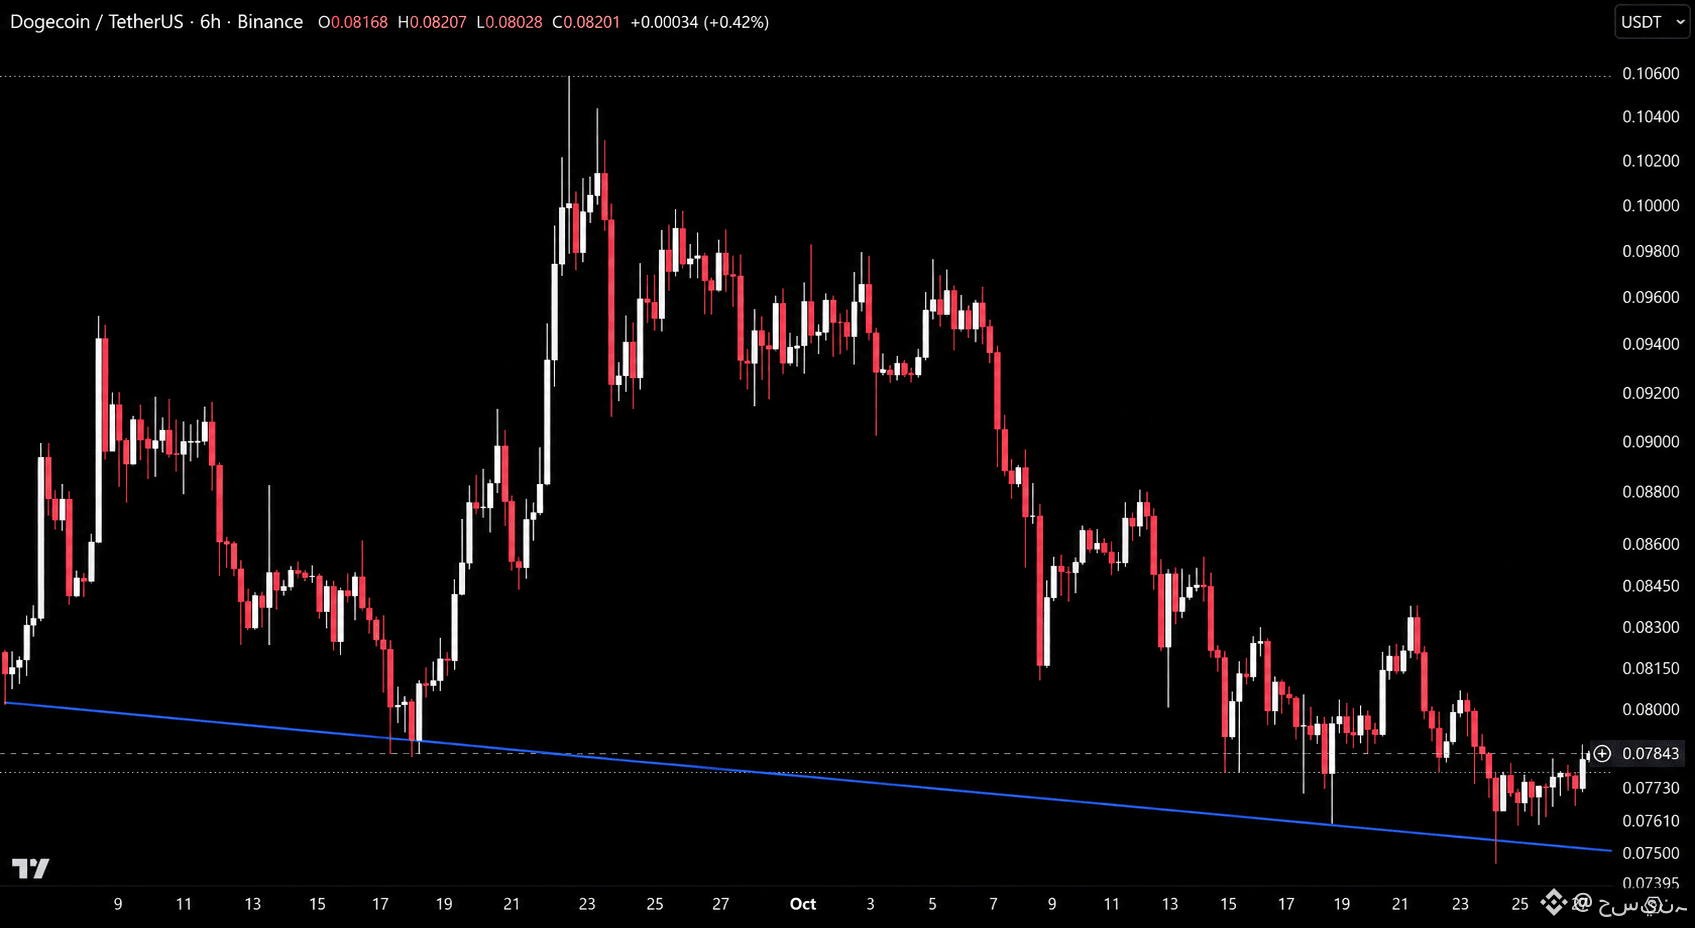
$DOGE is trading at 0.07943, bouncing off the descending support line from early September near 0.07520 after a wick low and a slide from highs near 0.10600.
Hold this support and this pushes back toward 0.08000 to 0.08300. Lose it and the line breaks, opening the door toward 0.07400. #DOGE
{future}(DOGEUSDT)
$DOGE is trading at 0.07943, bouncing off the descending support line from early September near 0.07520 after a wick low and a slide from highs near 0.10600.
Hold this support and this pushes back toward 0.08000 to 0.08300. Lose it and the line breaks, opening the door toward 0.07400. #DOGE
Hold this support and this pushes back toward 0.08000 to 0.08300. Lose it and the line breaks, opening the door toward 0.07400. #DOGE
2
209
·
--
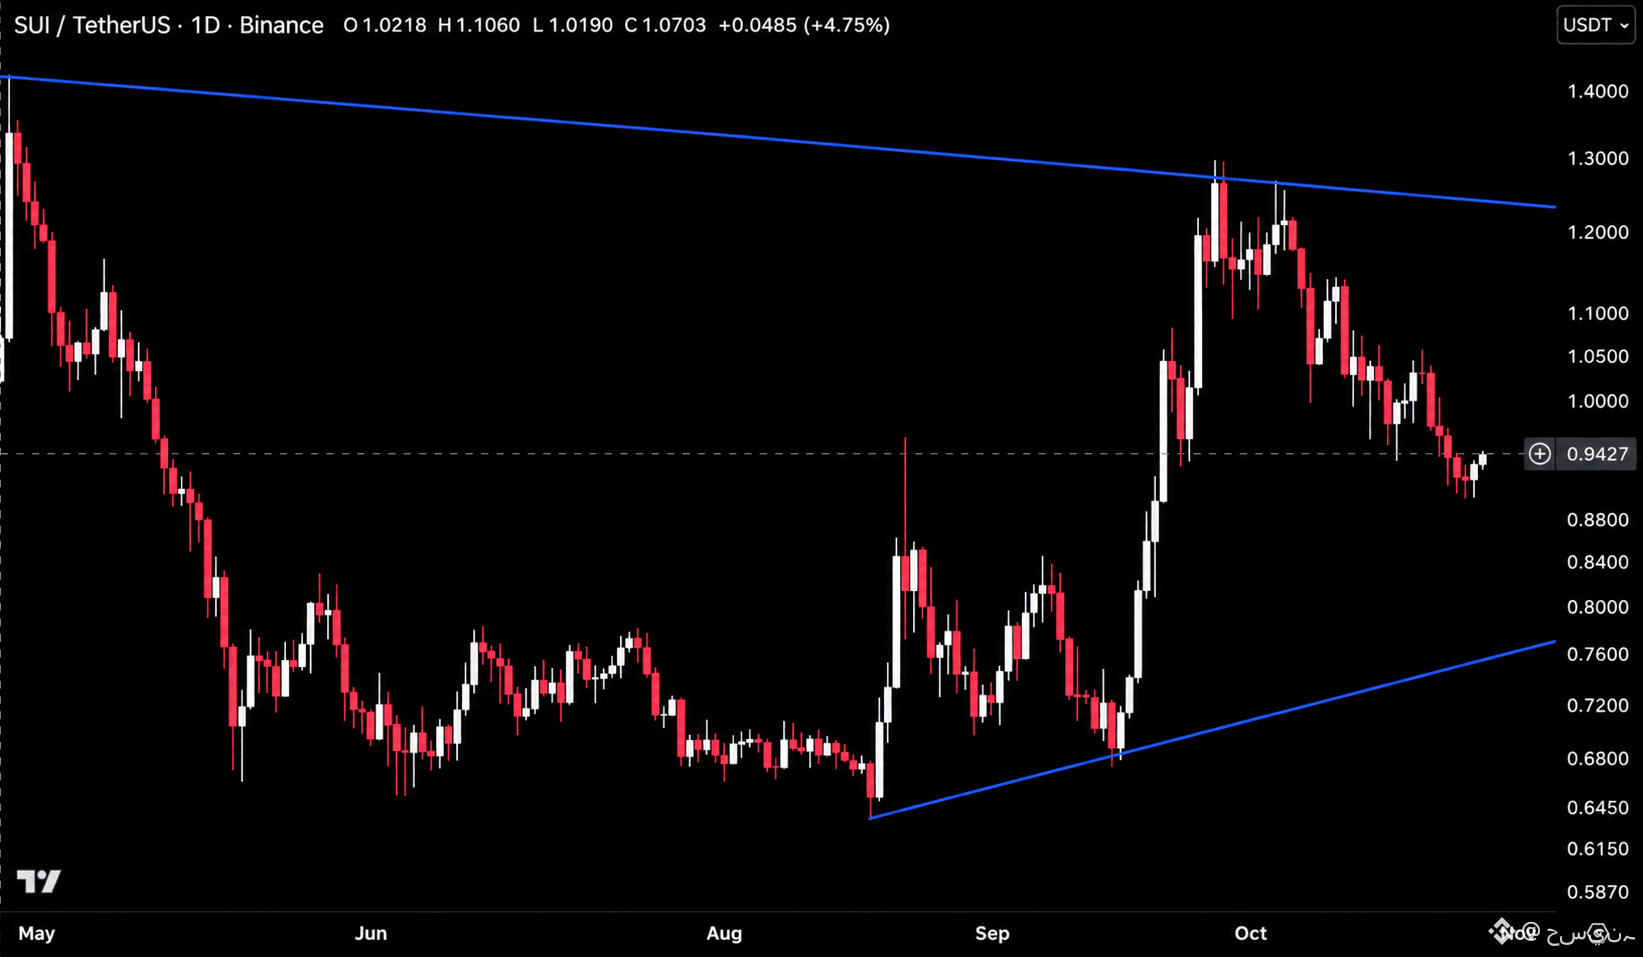
$SUI
is trading at 0.9427, bouncing from the 0.9000 zone inside a symmetrical triangle on the daily after a slide from highs near 1.3000, with descending resistance near 1.2300 and rising support near 0.7700.
Hold 0.9000 and this pushes back toward 1.0000 to 1.0500. Lose it and this drops toward the rising trendline near 0.7700, with 0.8800 to 0.8400 as the first support. #SUI
{future}(SUIUSDT)
$SUI
is trading at 0.9427, bouncing from the 0.9000 zone inside a symmetrical triangle on the daily after a slide from highs near 1.3000, with descending resistance near 1.2300 and rising support near 0.7700.
Hold 0.9000 and this pushes back toward 1.0000 to 1.0500. Lose it and this drops toward the rising trendline near 0.7700, with 0.8800 to 0.8400 as the first support. #SUI
2
360
·
--
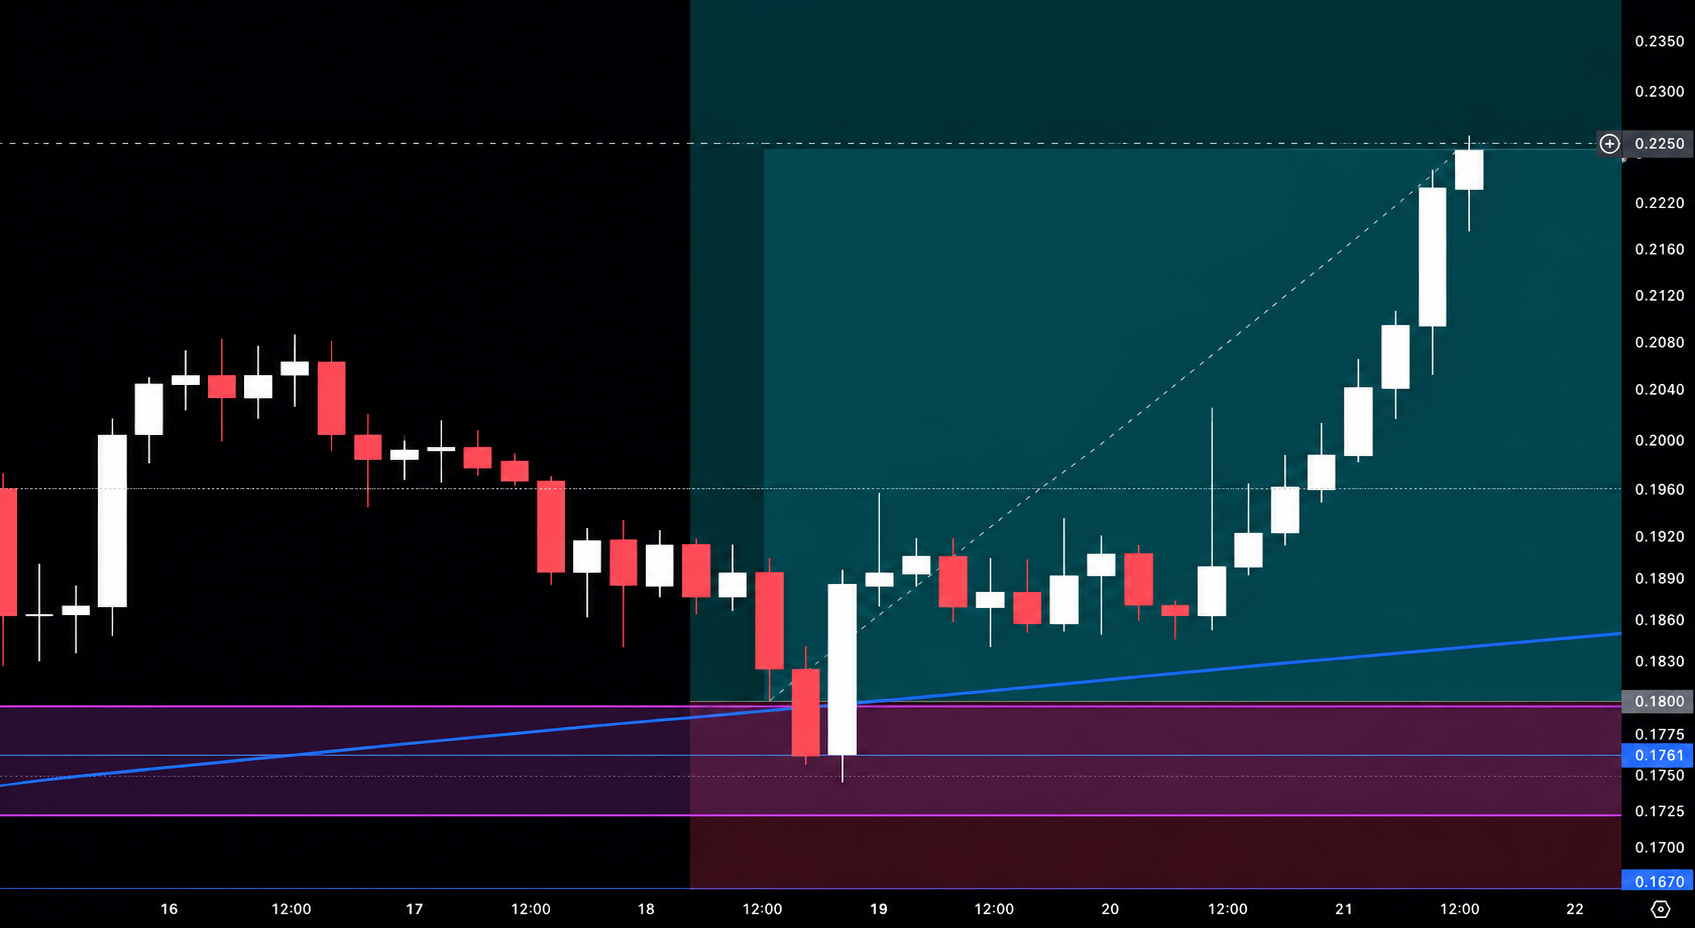
$ENA /USDT (2–5x)
Direction: LONG
ENTRY: 0.1780 – 0.1800
TARGETS:
0.1890 – 0.2000 – 0.2120 – 0.2250 – 0.2400 – 0.2550 – 0.2750 – 0.3000
STOP LOSS: 0.1620
8H FVG confluent with ascending trendline support and a horizontal level at entry. #ENA
{future}(ENAUSDT)
$ENA /USDT (2–5x)
Direction: LONG
ENTRY: 0.1780 – 0.1800
TARGETS:
0.1890 – 0.2000 – 0.2120 – 0.2250 – 0.2400 – 0.2550 – 0.2750 – 0.3000
STOP LOSS: 0.1620
8H FVG confluent with ascending trendline support and a horizontal level at entry. #ENA
Direction: LONG
ENTRY: 0.1780 – 0.1800
TARGETS:
0.1890 – 0.2000 – 0.2120 – 0.2250 – 0.2400 – 0.2550 – 0.2750 – 0.3000
STOP LOSS: 0.1620
8H FVG confluent with ascending trendline support and a horizontal level at entry. #ENA
2
250
·
--
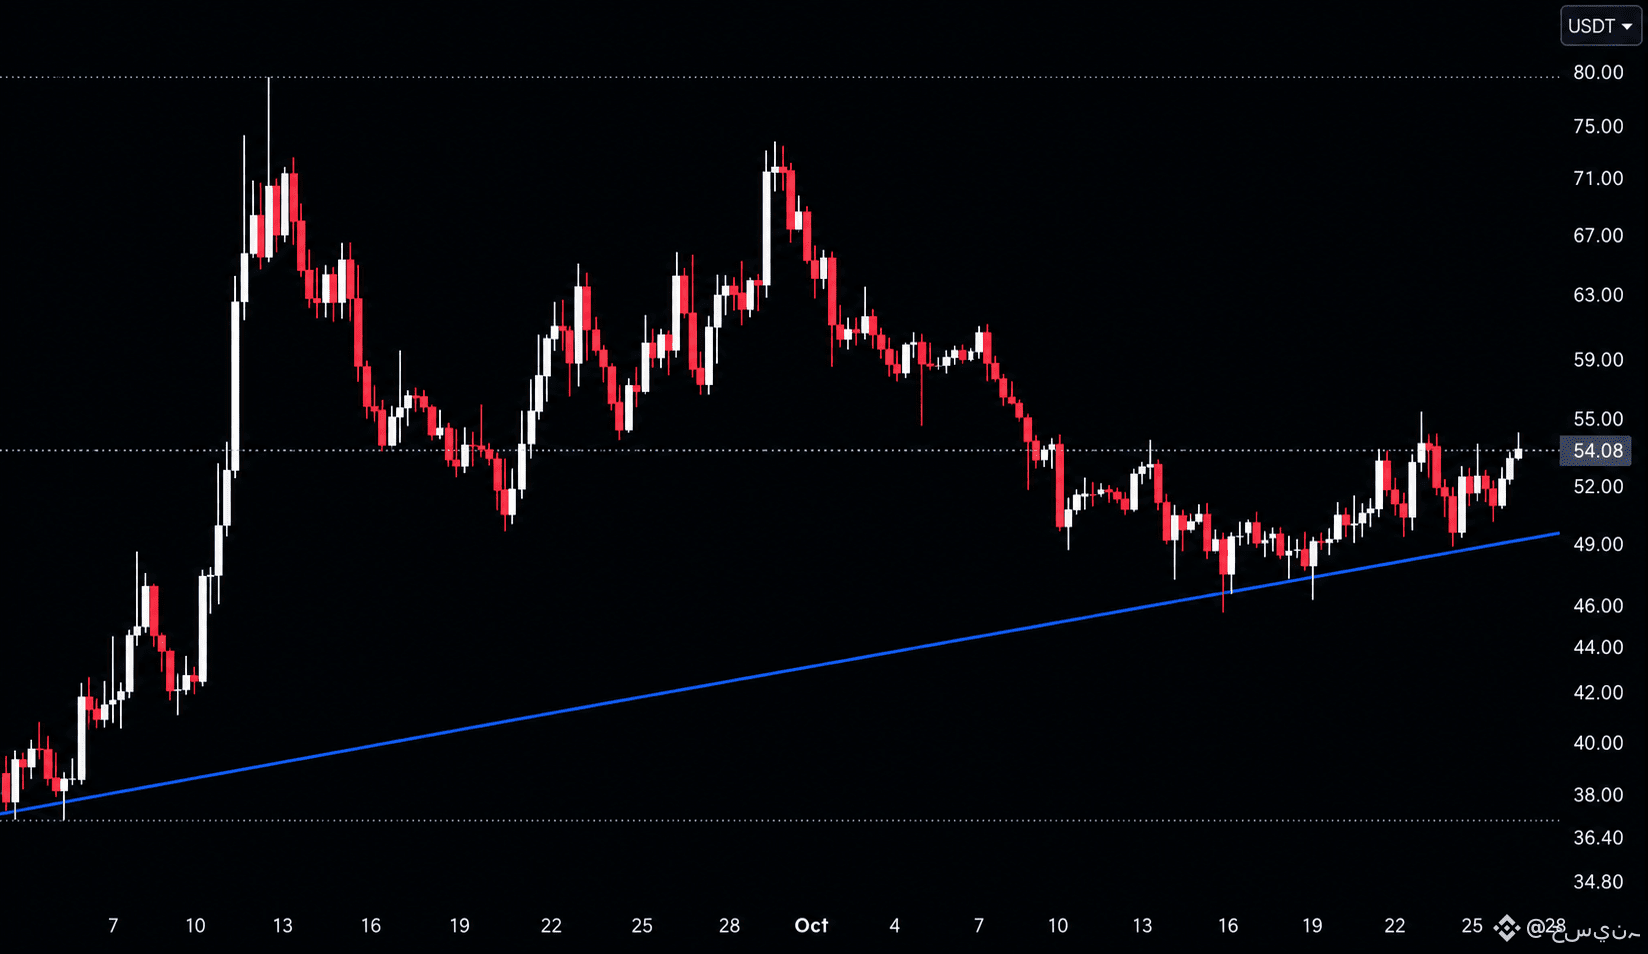
$DASH is trading at 55, bouncing off the rising trendline from late August near 49.00 and pressing into the 55.00 resistance after a slide from highs near 79.00.
A break above 55.00 pushes this toward 59.00 to 63.00. A rejection here sends this back toward the trendline near 49.00, and losing it opens the door toward 46.00 to 44.00. #DASH
{future}(DASHUSDT)
$DASH is trading at 55, bouncing off the rising trendline from late August near 49.00 and pressing into the 55.00 resistance after a slide from highs near 79.00.
A break above 55.00 pushes this toward 59.00 to 63.00. A rejection here sends this back toward the trendline near 49.00, and losing it opens the door toward 46.00 to 44.00. #DASH
A break above 55.00 pushes this toward 59.00 to 63.00. A rejection here sends this back toward the trendline near 49.00, and losing it opens the door toward 46.00 to 44.00. #DASH
2
7
·
--
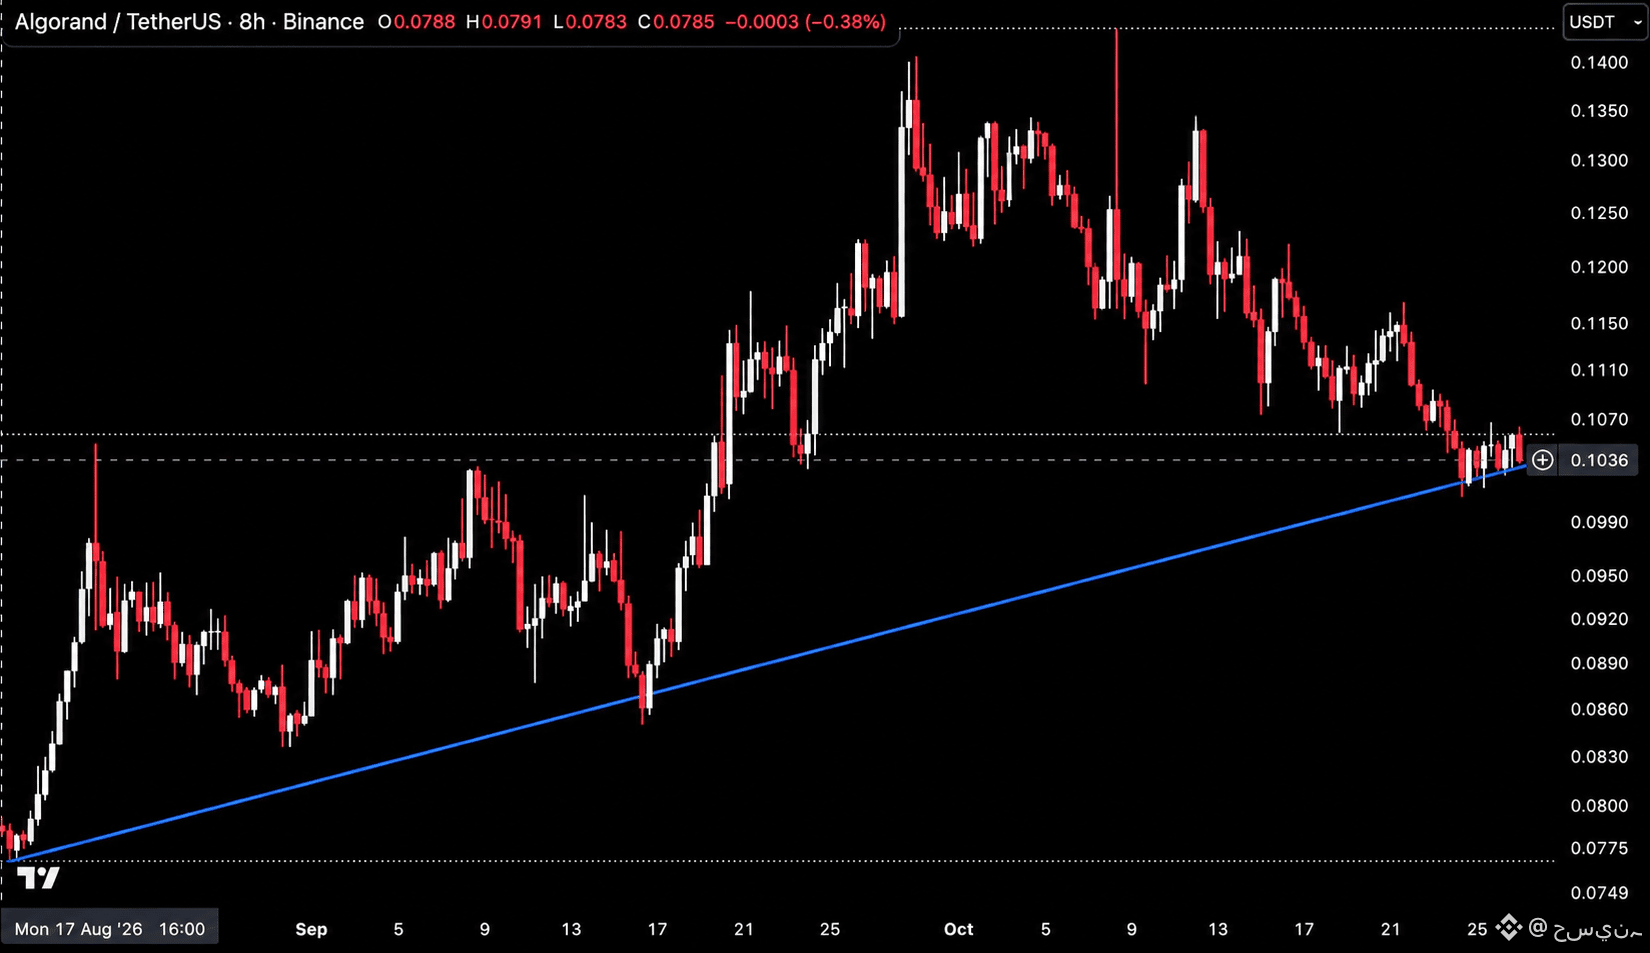
$ALGO is trading at 0.1033, testing the rising trendline from August near 0.1030 after a slide from highs near 0.1400, with price compressing just above it.
Hold this trendline and this pushes back toward 0.1070 to 0.1150. Lose it and the trendline breaks, opening the door toward 0.0990 to 0.0920. #ALGO
{future}(ALGOUSDT)
$ALGO is trading at 0.1033, testing the rising trendline from August near 0.1030 after a slide from highs near 0.1400, with price compressing just above it.
Hold this trendline and this pushes back toward 0.1070 to 0.1150. Lose it and the trendline breaks, opening the door toward 0.0990 to 0.0920. #ALGO
Hold this trendline and this pushes back toward 0.1070 to 0.1150. Lose it and the trendline breaks, opening the door toward 0.0990 to 0.0920. #ALGO
2
8
·
--
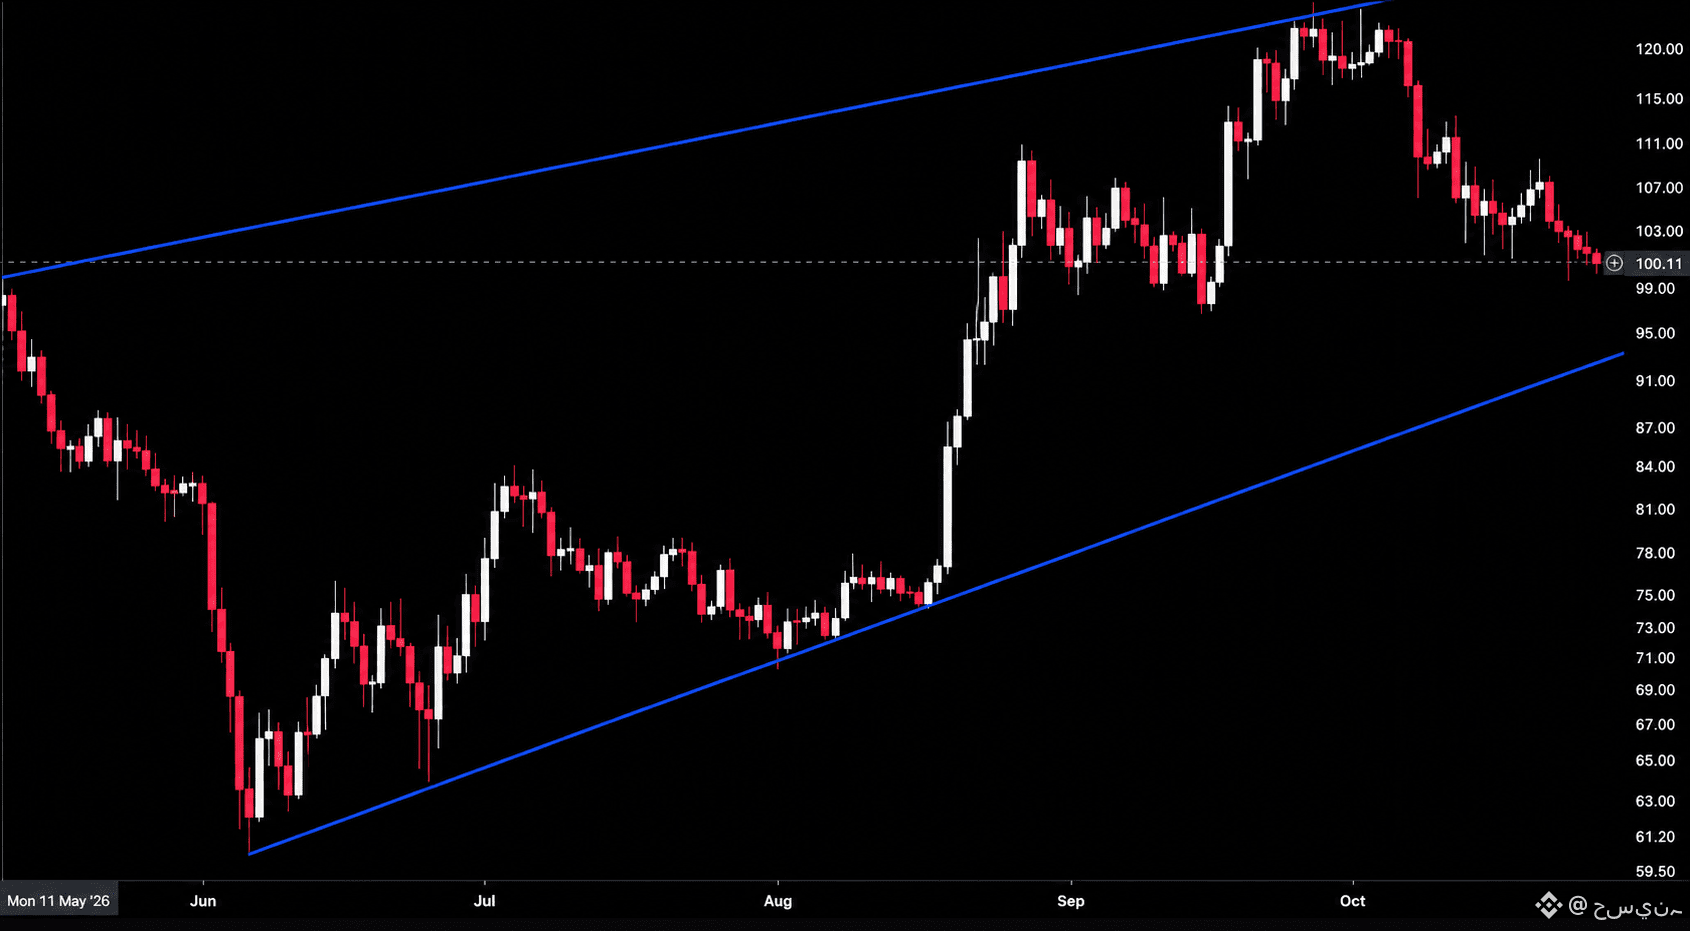
$SOL is trading at 101, sliding inside the rising channel from June after rejecting from the upper trendline near 122.00, with price now approaching the 99.00 to 95.00 support area and the channel’s lower trendline near 92.00 below.
Hold the 99.00 to 95.00 area and this bounces back toward 103.00 to 107.00. Lose it and this drops toward the channel support near 92.00 to 87.00. #SOL
{future}(SOLUSDT)
$SOL is trading at 101, sliding inside the rising channel from June after rejecting from the upper trendline near 122.00, with price now approaching the 99.00 to 95.00 support area and the channel’s lower trendline near 92.00 below.
Hold the 99.00 to 95.00 area and this bounces back toward 103.00 to 107.00. Lose it and this drops toward the channel support near 92.00 to 87.00. #SOL
Hold the 99.00 to 95.00 area and this bounces back toward 103.00 to 107.00. Lose it and this drops toward the channel support near 92.00 to 87.00. #SOL
2
326
·
--
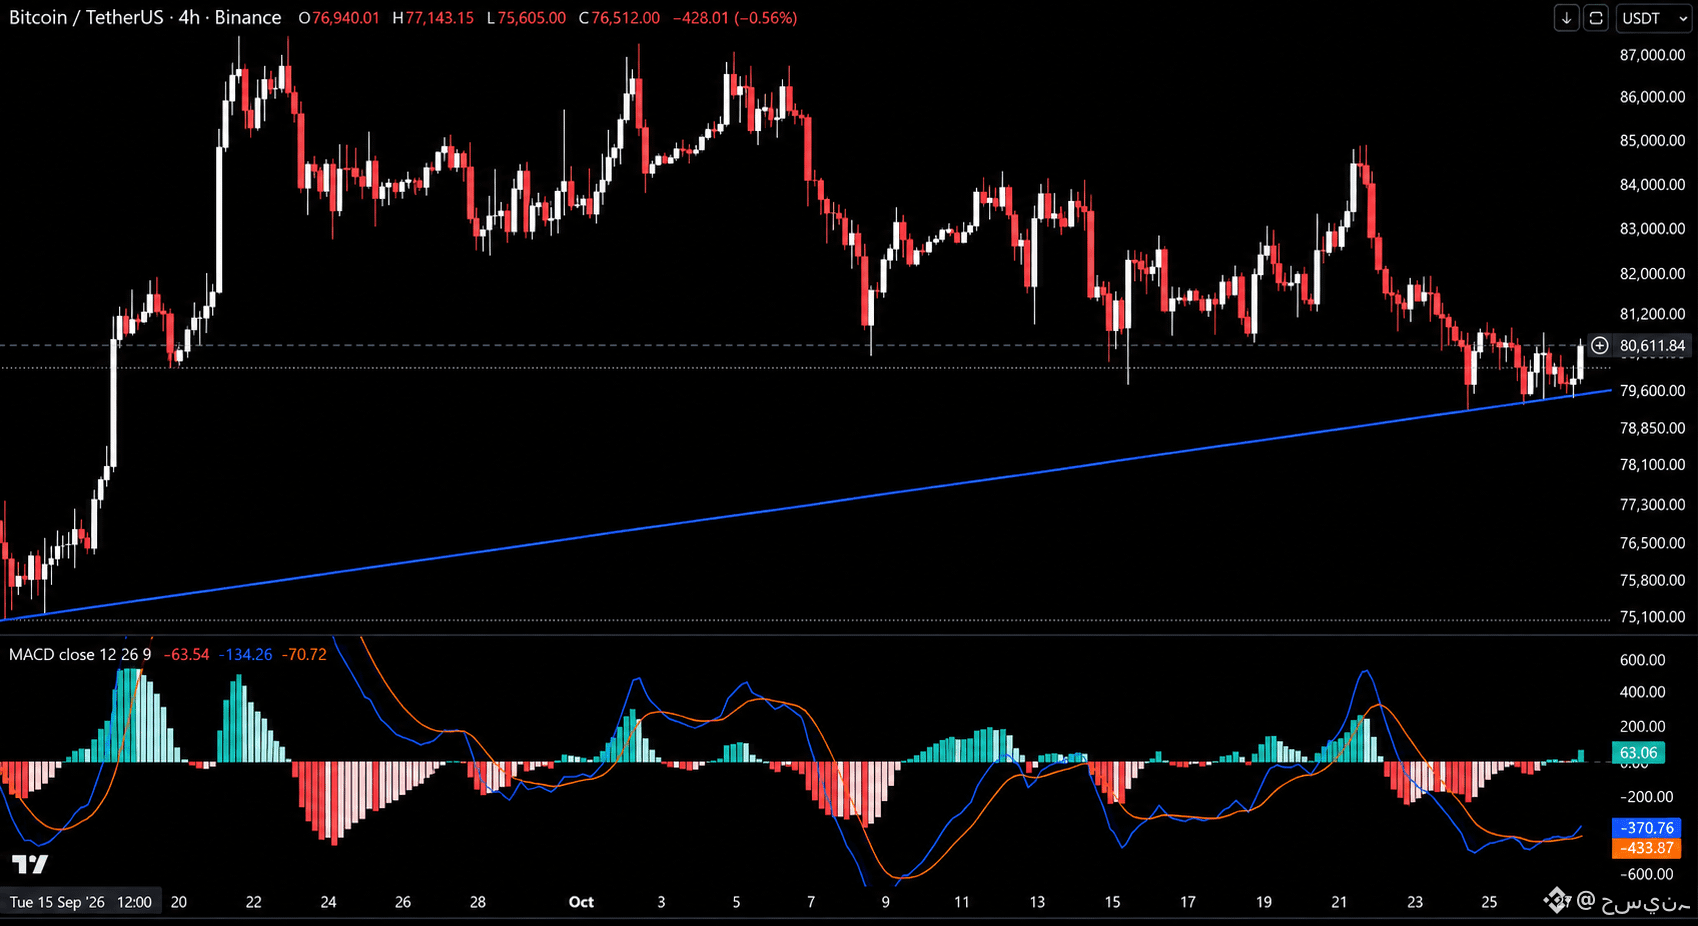
$BTC is trading at 80,611.84, bouncing off the rising trendline from September near 79,600, with the 4h MACD turning bullish as the MACD line pulls further above its signal line.
Hold this trendline and the MACD cross keeps building toward 82,000 to 84,000. Lose it and the cross fails, with 78,850 to 78,100 in play. #Btc
{future}(BTCUSDT)
$BTC is trading at 80,611.84, bouncing off the rising trendline from September near 79,600, with the 4h MACD turning bullish as the MACD line pulls further above its signal line.
Hold this trendline and the MACD cross keeps building toward 82,000 to 84,000. Lose it and the cross fails, with 78,850 to 78,100 in play. #Btc
Hold this trendline and the MACD cross keeps building toward 82,000 to 84,000. Lose it and the cross fails, with 78,850 to 78,100 in play. #Btc
2
40
·
--
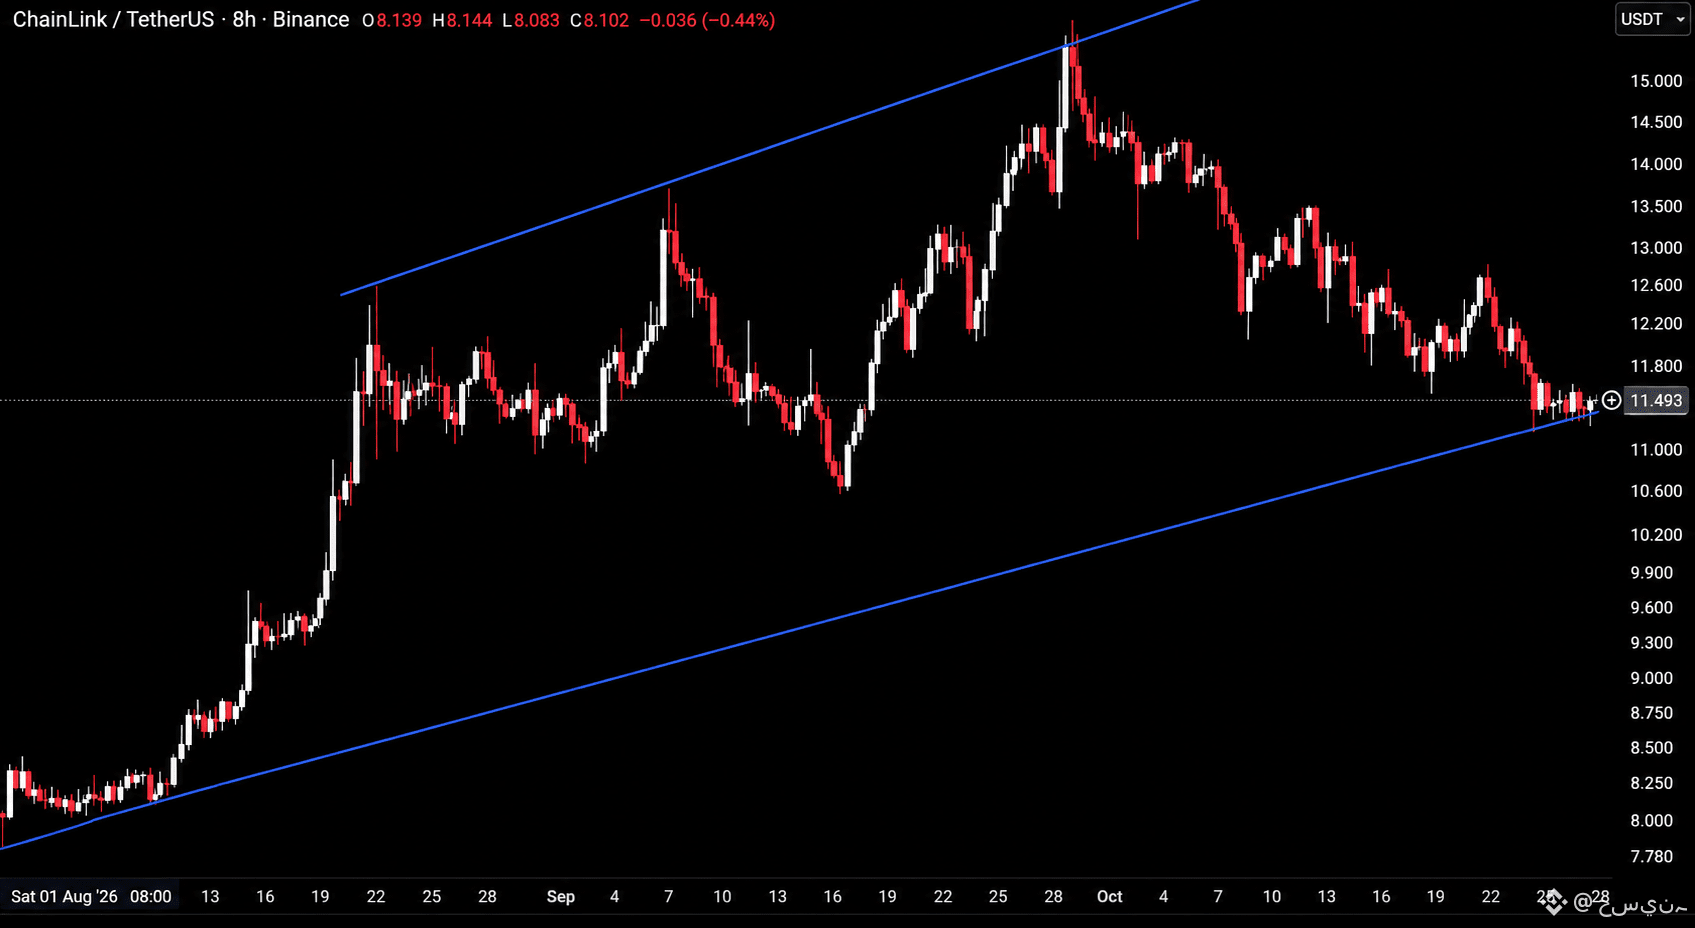
$LINK is trading at 11.55, testing the rising trendline from August near 11.300, which also acts as the lower boundary of the rising channel, after a steady slide from highs near 15.500.
Hold this trendline and this bounces back toward 12.200 to 12.600. Lose it and the channel breaks, opening the door toward 10.600 to 10.200. #LINK
{future}(LINKUSDT)
$LINK is trading at 11.55, testing the rising trendline from August near 11.300, which also acts as the lower boundary of the rising channel, after a steady slide from highs near 15.500.
Hold this trendline and this bounces back toward 12.200 to 12.600. Lose it and the channel breaks, opening the door toward 10.600 to 10.200. #LINK
Hold this trendline and this bounces back toward 12.200 to 12.600. Lose it and the channel breaks, opening the door toward 10.600 to 10.200. #LINK
2
108
·
--
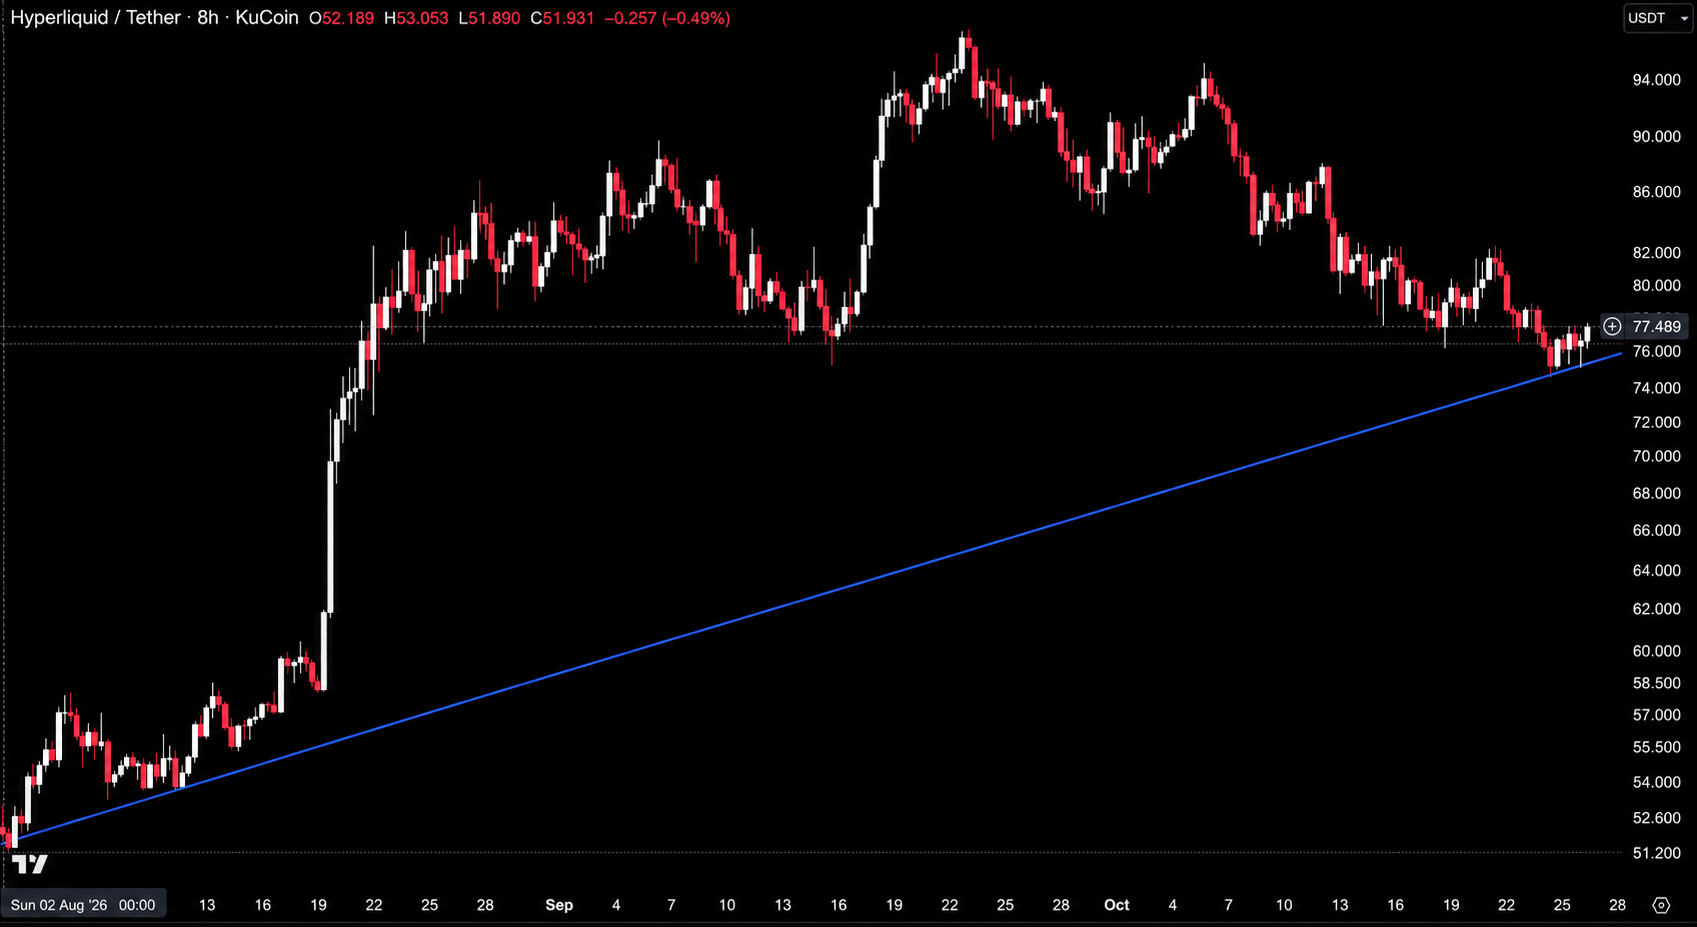
$HYPE is trading at 78, bouncing off the rising trendline from August near 75.500 after a slide from highs near 97.000, with price holding the 76.000 level on the latest retest.
Hold this trendline and this pushes back toward 80.000 to 82.000. Lo
se it and this drops back toward 72.000 to 70.000. #HYPE
{future}(HYPEUSDT)
$HYPE is trading at 78, bouncing off the rising trendline from August near 75.500 after a slide from highs near 97.000, with price holding the 76.000 level on the latest retest.
Hold this trendline and this pushes back toward 80.000 to 82.000. Lo
se it and this drops back toward 72.000 to 70.000. #HYPE
Hold this trendline and this pushes back toward 80.000 to 82.000. Lo
se it and this drops back toward 72.000 to 70.000. #HYPE
2
186
·
--
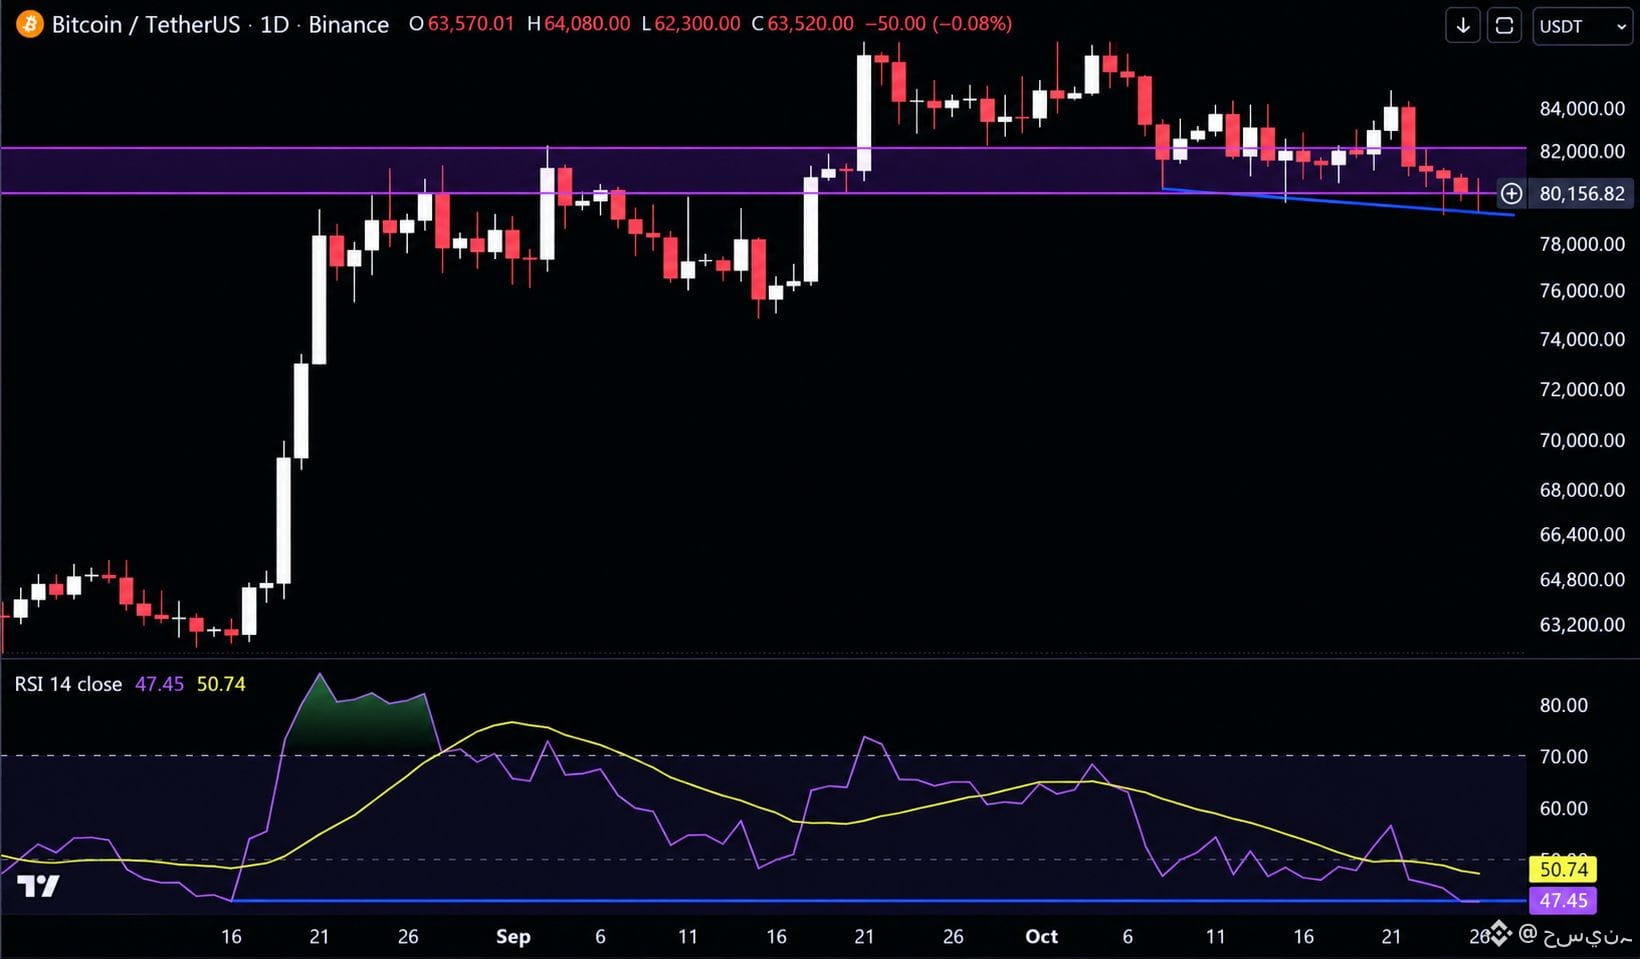
$BTC is trading at 80,050, with the daily RSI back at 41.6, the same level it was at when the August pump started, while price is still up about 25% from that point.
A full RSI reset without price giving back the move is what a healthy bull run looks like. Hold the bottom of the 80,000 to 82,100 zone and this pushes toward 84,000 to 86,000. Lose 79,400 and the structure weakens, with 76,000 to 75,000 in play. #Btc
{future}(BTCUSDT)
$BTC is trading at 80,050, with the daily RSI back at 41.6, the same level it was at when the August pump started, while price is still up about 25% from that point.
A full RSI reset without price giving back the move is what a healthy bull run looks like. Hold the bottom of the 80,000 to 82,100 zone and this pushes toward 84,000 to 86,000. Lose 79,400 and the structure weakens, with 76,000 to 75,000 in play. #Btc
A full RSI reset without price giving back the move is what a healthy bull run looks like. Hold the bottom of the 80,000 to 82,100 zone and this pushes toward 84,000 to 86,000. Lose 79,400 and the structure weakens, with 76,000 to 75,000 in play. #Btc
2
94
·
--
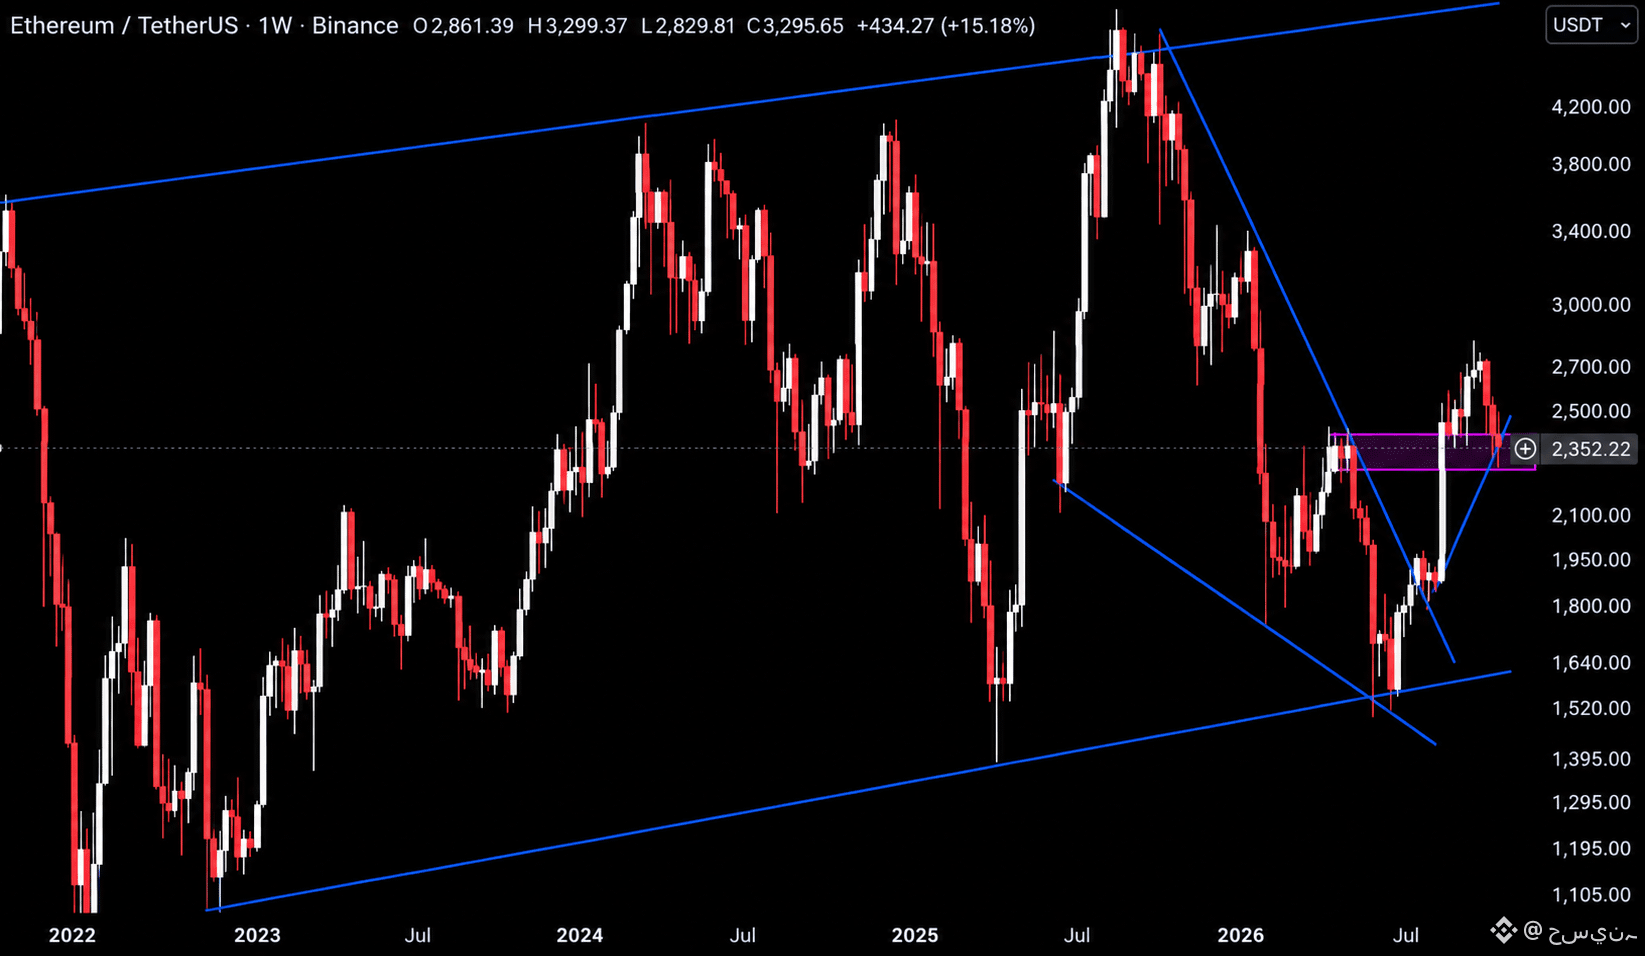
$ETH is trading at 2,320, sitting inside the 2,280 to 2,410 support zone, right on the small rising trendline from the July low, after breaking out of the falling wedge.
A weekly close above this zone confirms the retest and opens the door toward 2,700 to 2,800. A weekly close below it sends this back toward 2,100 to 1,950, with price falling back toward the wedge. #Eth
{future}(ETHUSDT)
$ETH is trading at 2,320, sitting inside the 2,280 to 2,410 support zone, right on the small rising trendline from the July low, after breaking out of the falling wedge.
A weekly close above this zone confirms the retest and opens the door toward 2,700 to 2,800. A weekly close below it sends this back toward 2,100 to 1,950, with price falling back toward the wedge. #Eth
A weekly close above this zone confirms the retest and opens the door toward 2,700 to 2,800. A weekly close below it sends this back toward 2,100 to 1,950, with price falling back toward the wedge. #Eth
2
71
·
--
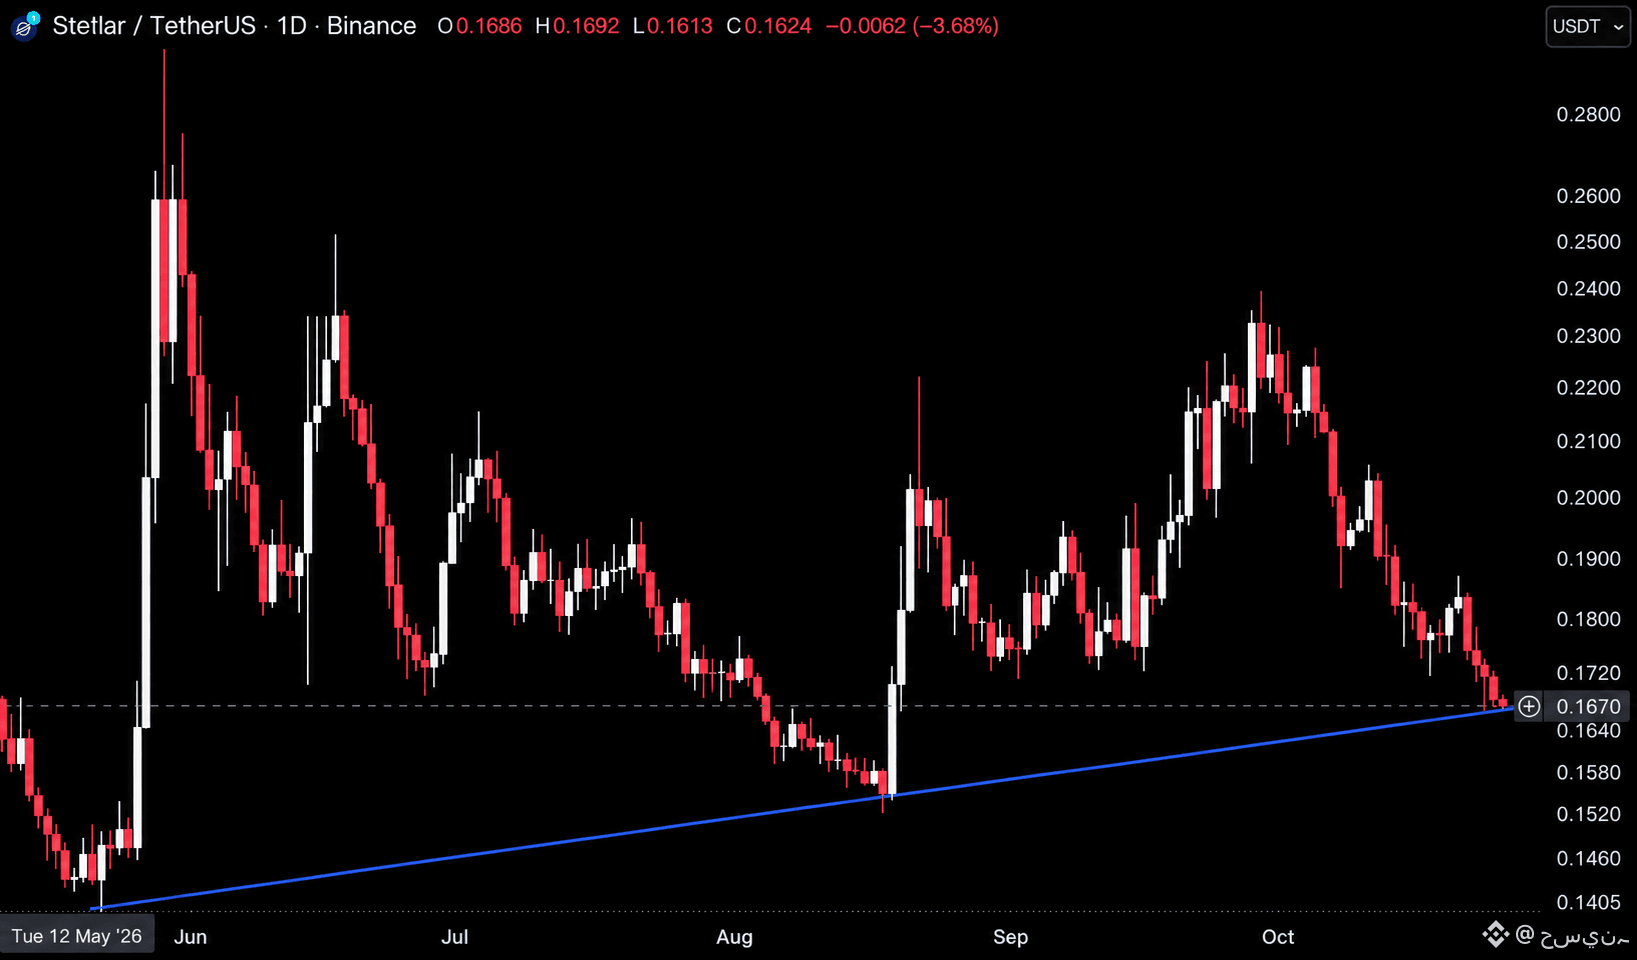
$XLM is trading at 0.1675, testing the rising trendline from May near 0.1650 after a steady slide from highs near 0.2400.
Hold this trendline and this pushes back toward 0.1800 to 0.1900. Lose it and this drops back toward 0.1580 to 0.1520. #XLM
{future}(XLMUSDT)
$XLM is trading at 0.1675, testing the rising trendline from May near 0.1650 after a steady slide from highs near 0.2400.
Hold this trendline and this pushes back toward 0.1800 to 0.1900. Lose it and this drops back toward 0.1580 to 0.1520. #XLM
Hold this trendline and this pushes back toward 0.1800 to 0.1900. Lose it and this drops back toward 0.1580 to 0.1520. #XLM
2
177
·
--
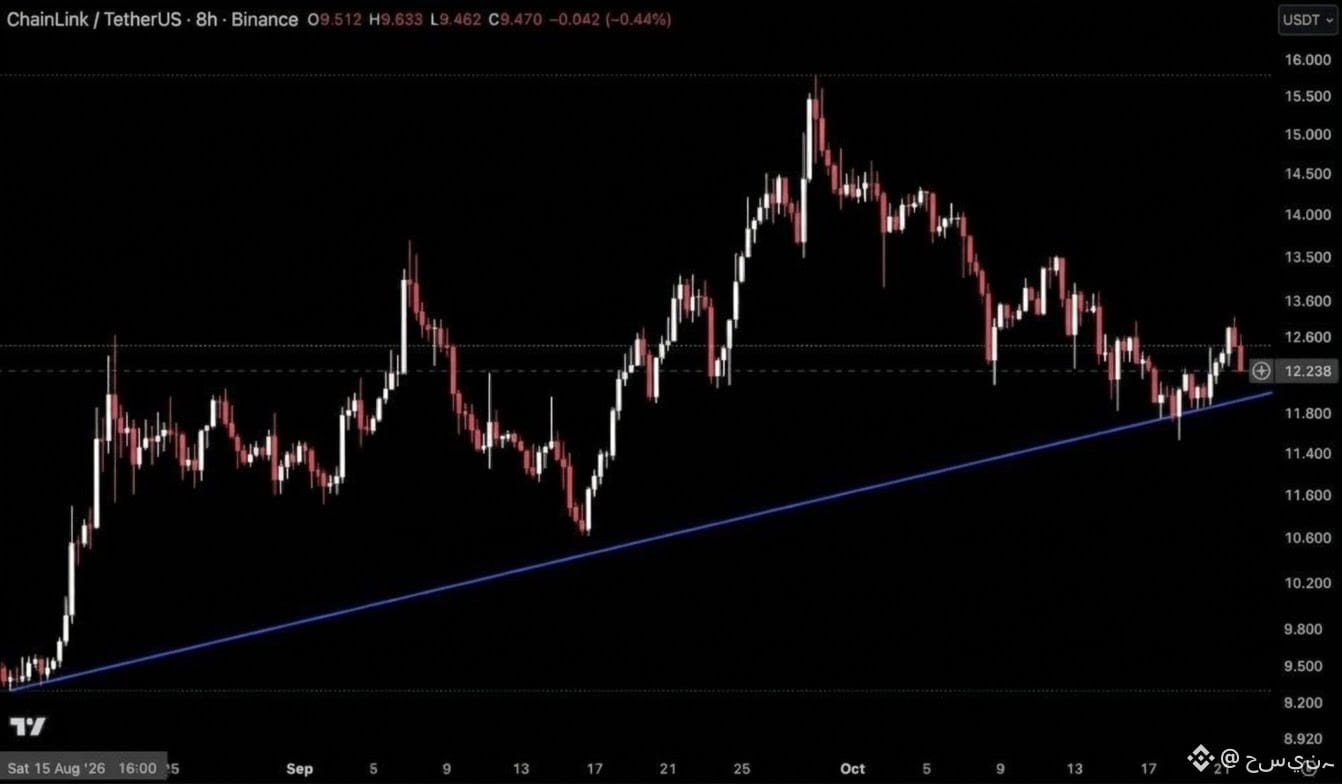
$LINK is trading at 11.5, near rising trendline from August near 11.800 after a slide from highs near 15.700.
Hold this trendline and this pushes back toward 12.600 to 13.500. Lose it and this drops back toward 11.400 to 11.000. #LINK
{future}(LINKUSDT)
$LINK is trading at 11.5, near rising trendline from August near 11.800 after a slide from highs near 15.700.
Hold this trendline and this pushes back toward 12.600 to 13.500. Lose it and this drops back toward 11.400 to 11.000. #LINK
Hold this trendline and this pushes back toward 12.600 to 13.500. Lose it and this drops back toward 11.400 to 11.000. #LINK
2
48
·
--
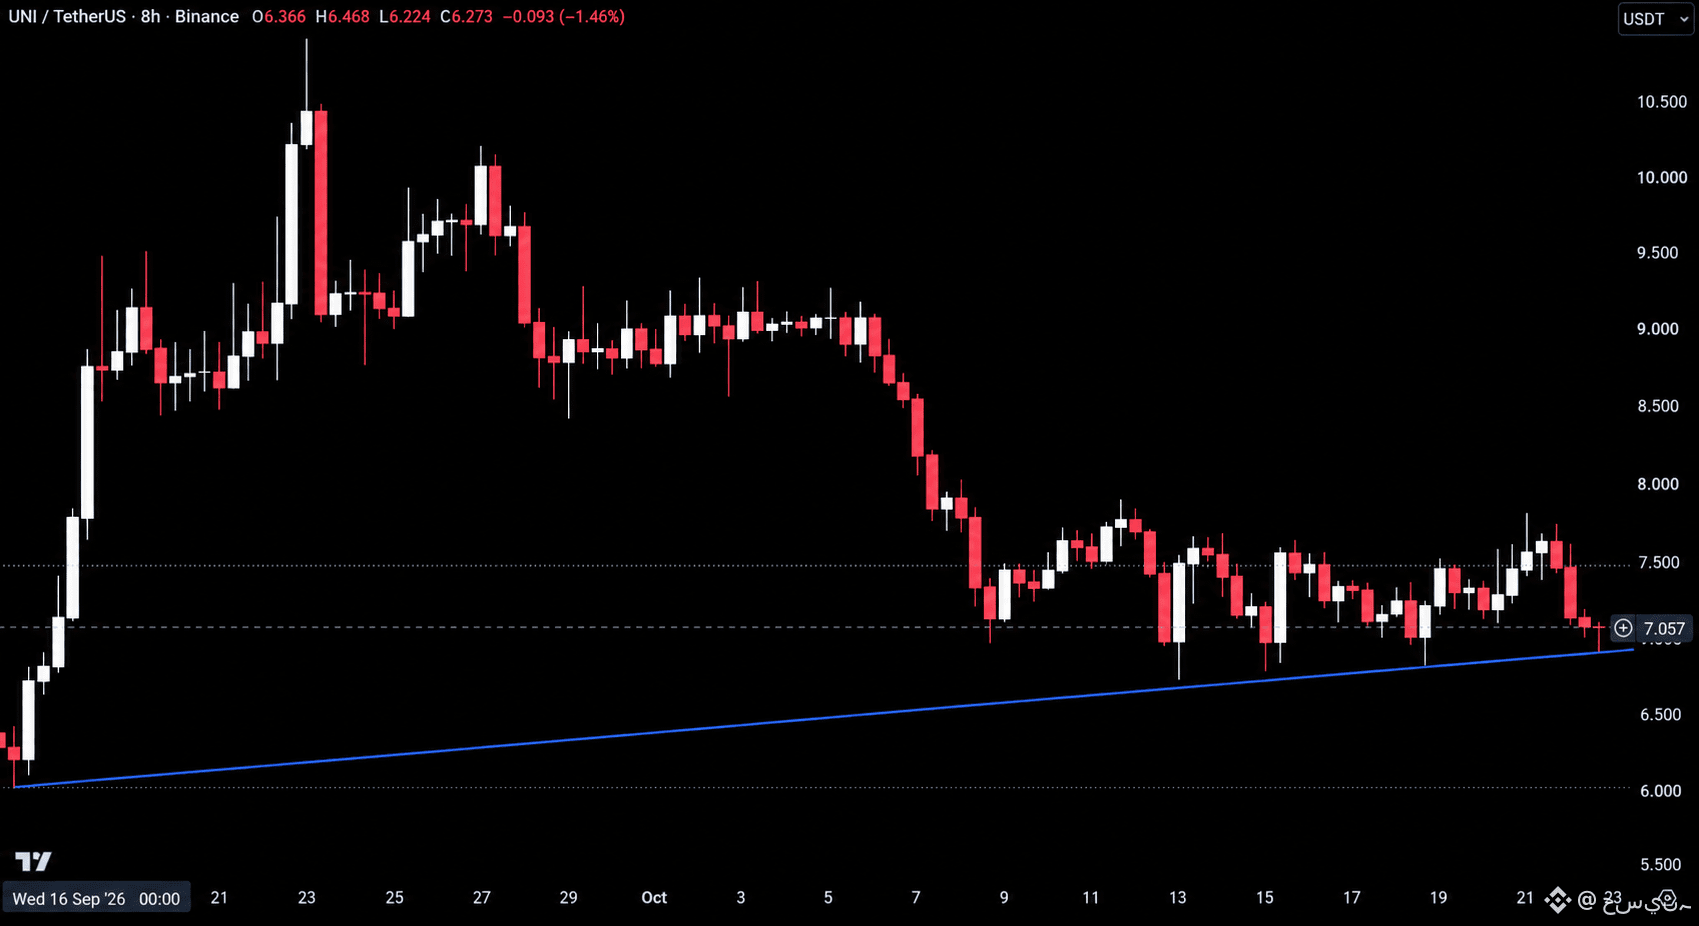
$UNI is trading at 6.97, testing the rising trendline from mid September near 6.900 for the fourth time after a slide from highs near 10.800, with price compressing into a tight range just above it.
Hold this trendline and this pushes back toward 7.500 to 8.000. Lose it and the support breaks, opening the door toward 6.500 to 6.000. #UNI
{future}(UNIUSDT)
$UNI is trading at 6.97, testing the rising trendline from mid September near 6.900 for the fourth time after a slide from highs near 10.800, with price compressing into a tight range just above it.
Hold this trendline and this pushes back toward 7.500 to 8.000. Lose it and the support breaks, opening the door toward 6.500 to 6.000. #UNI
Hold this trendline and this pushes back toward 7.500 to 8.000. Lose it and the support breaks, opening the door toward 6.500 to 6.000. #UNI
2
2
·
--
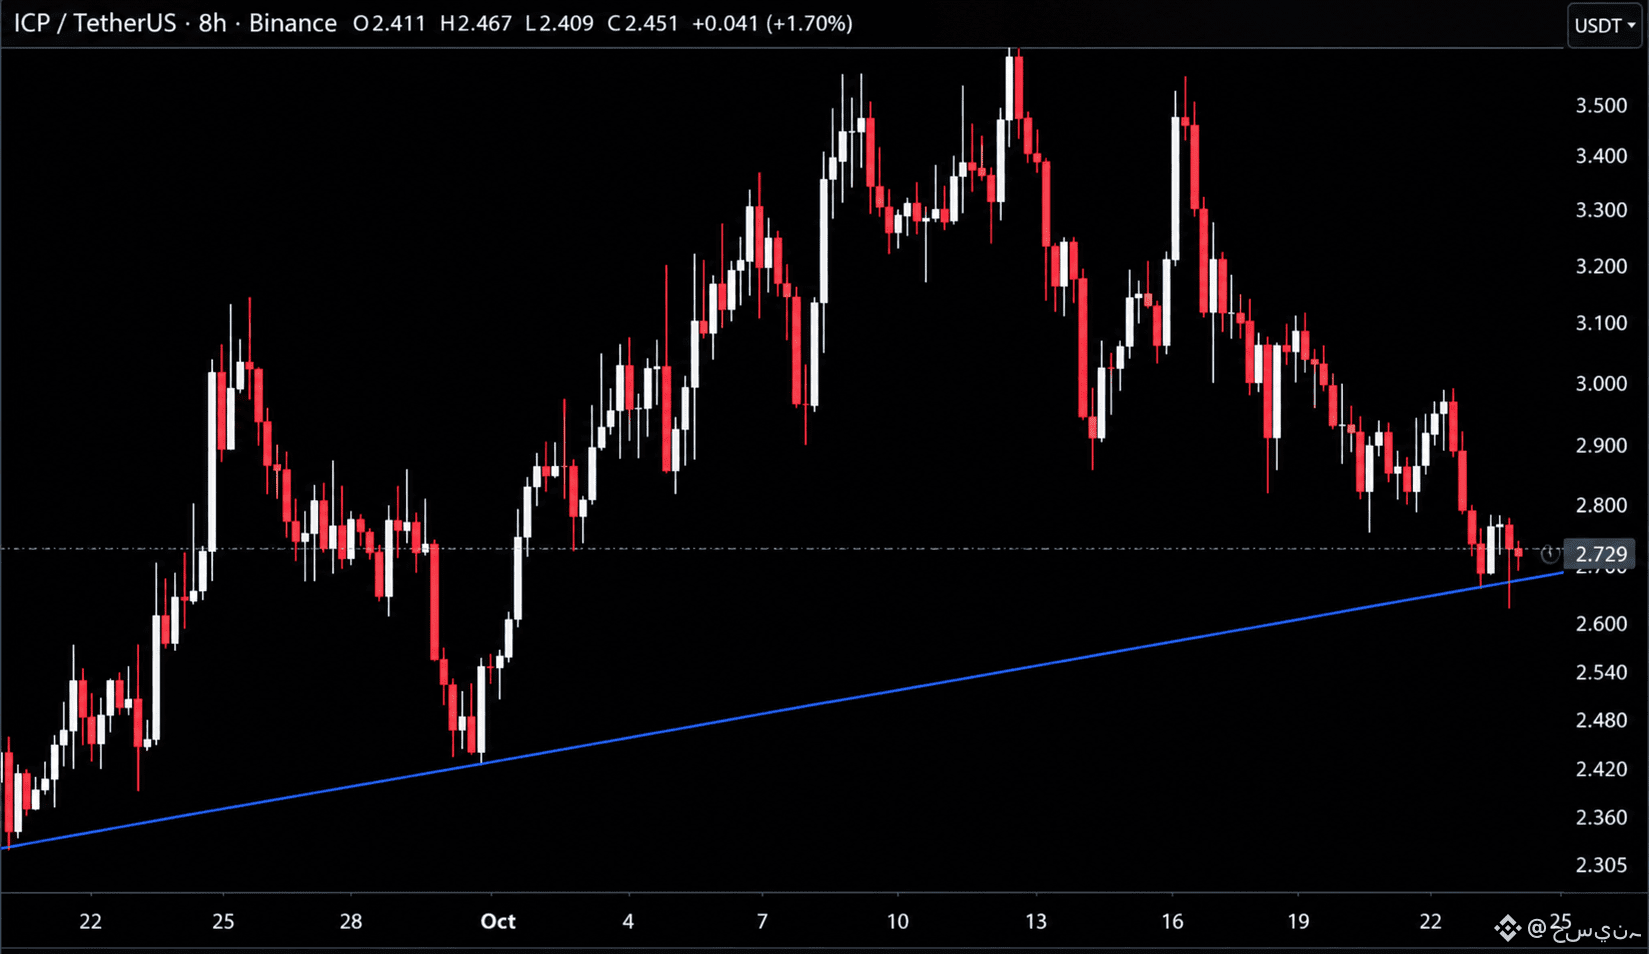
$ICP is trading at 2.65, near rising trendline from late August near 2.680 after a steady slide from highs near 3.600.
Hold this trendline and this pushes back toward 2.900 to 3.100. Lose it and this drops back toward 2.480 to 2.420. #ICP
{future}(ICPUSDT)
$ICP is trading at 2.65, near rising trendline from late August near 2.680 after a steady slide from highs near 3.600.
Hold this trendline and this pushes back toward 2.900 to 3.100. Lose it and this drops back toward 2.480 to 2.420. #ICP
Hold this trendline and this pushes back toward 2.900 to 3.100. Lose it and this drops back toward 2.480 to 2.420. #ICP
2
8
·
--
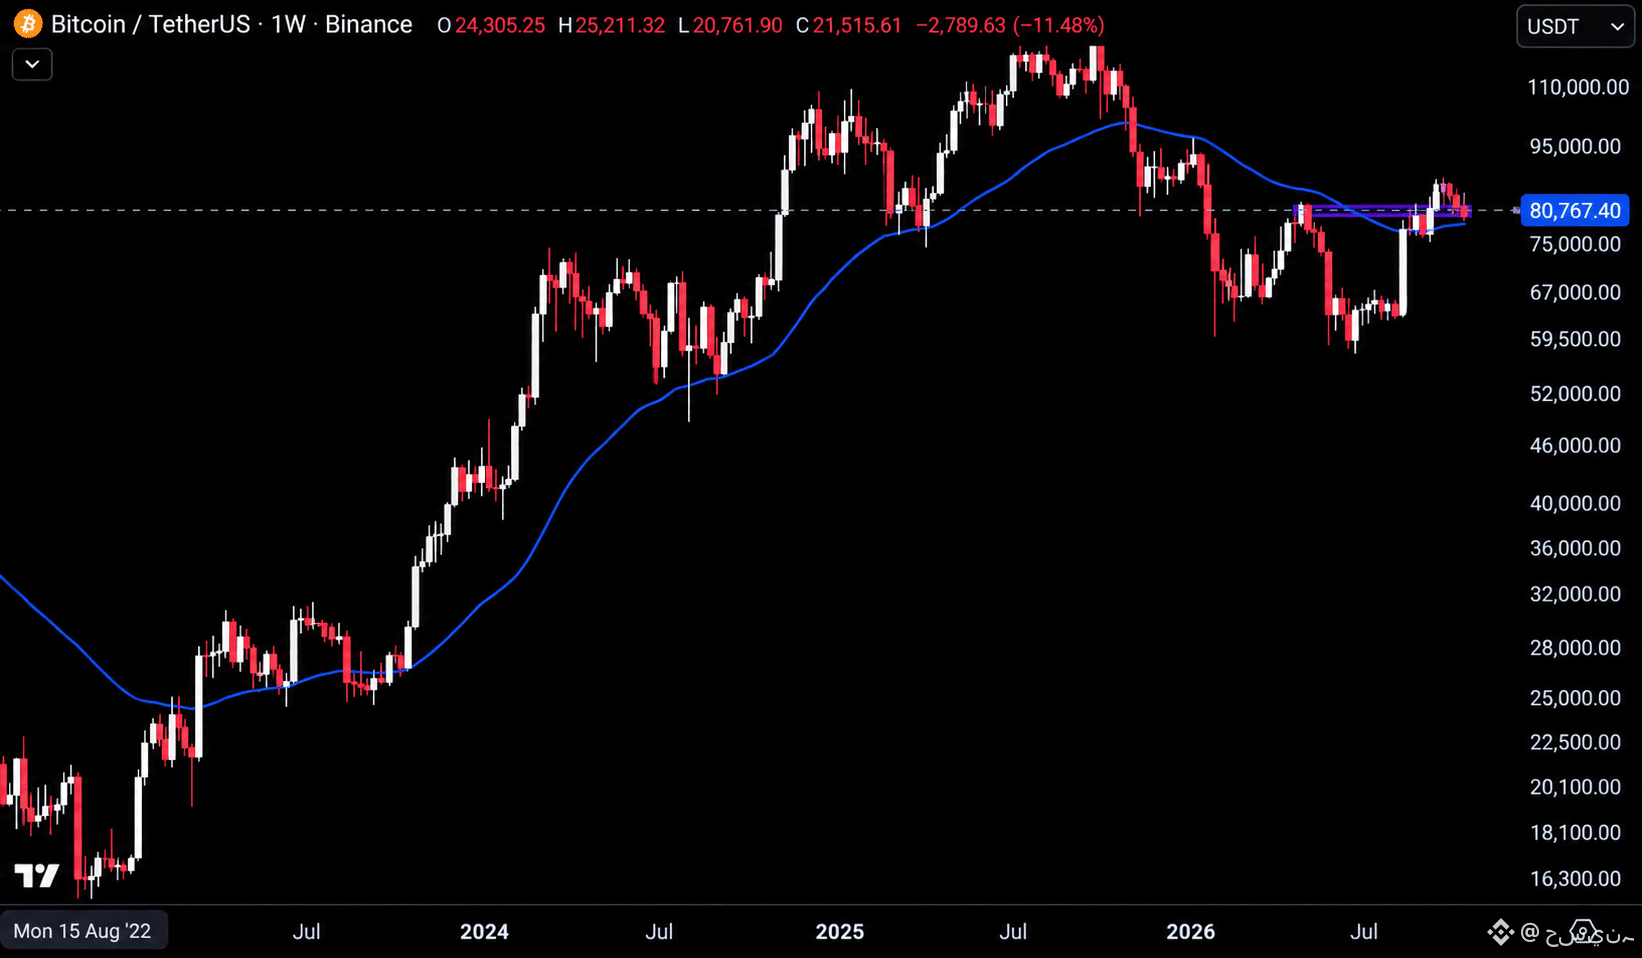
$BTC is trading at 80,767.40, a few hours from the weekly close and holding above the 50 week moving average near 77,000, with price sitting inside the 80,000 to 82,000 support zone.
A weekly close above the 50 week MA keeps the bullish structure intact and opens the door toward 84,000 to 89,000. A weekly close below it sends this back toward 75,000 to 67,000. #BTC
{future}(BTCUSDT)
$BTC is trading at 80,767.40, a few hours from the weekly close and holding above the 50 week moving average near 77,000, with price sitting inside the 80,000 to 82,000 support zone.
A weekly close above the 50 week MA keeps the bullish structure intact and opens the door toward 84,000 to 89,000. A weekly close below it sends this back toward 75,000 to 67,000. #BTC
A weekly close above the 50 week MA keeps the bullish structure intact and opens the door toward 84,000 to 89,000. A weekly close below it sends this back toward 75,000 to 67,000. #BTC
2
26
·
--
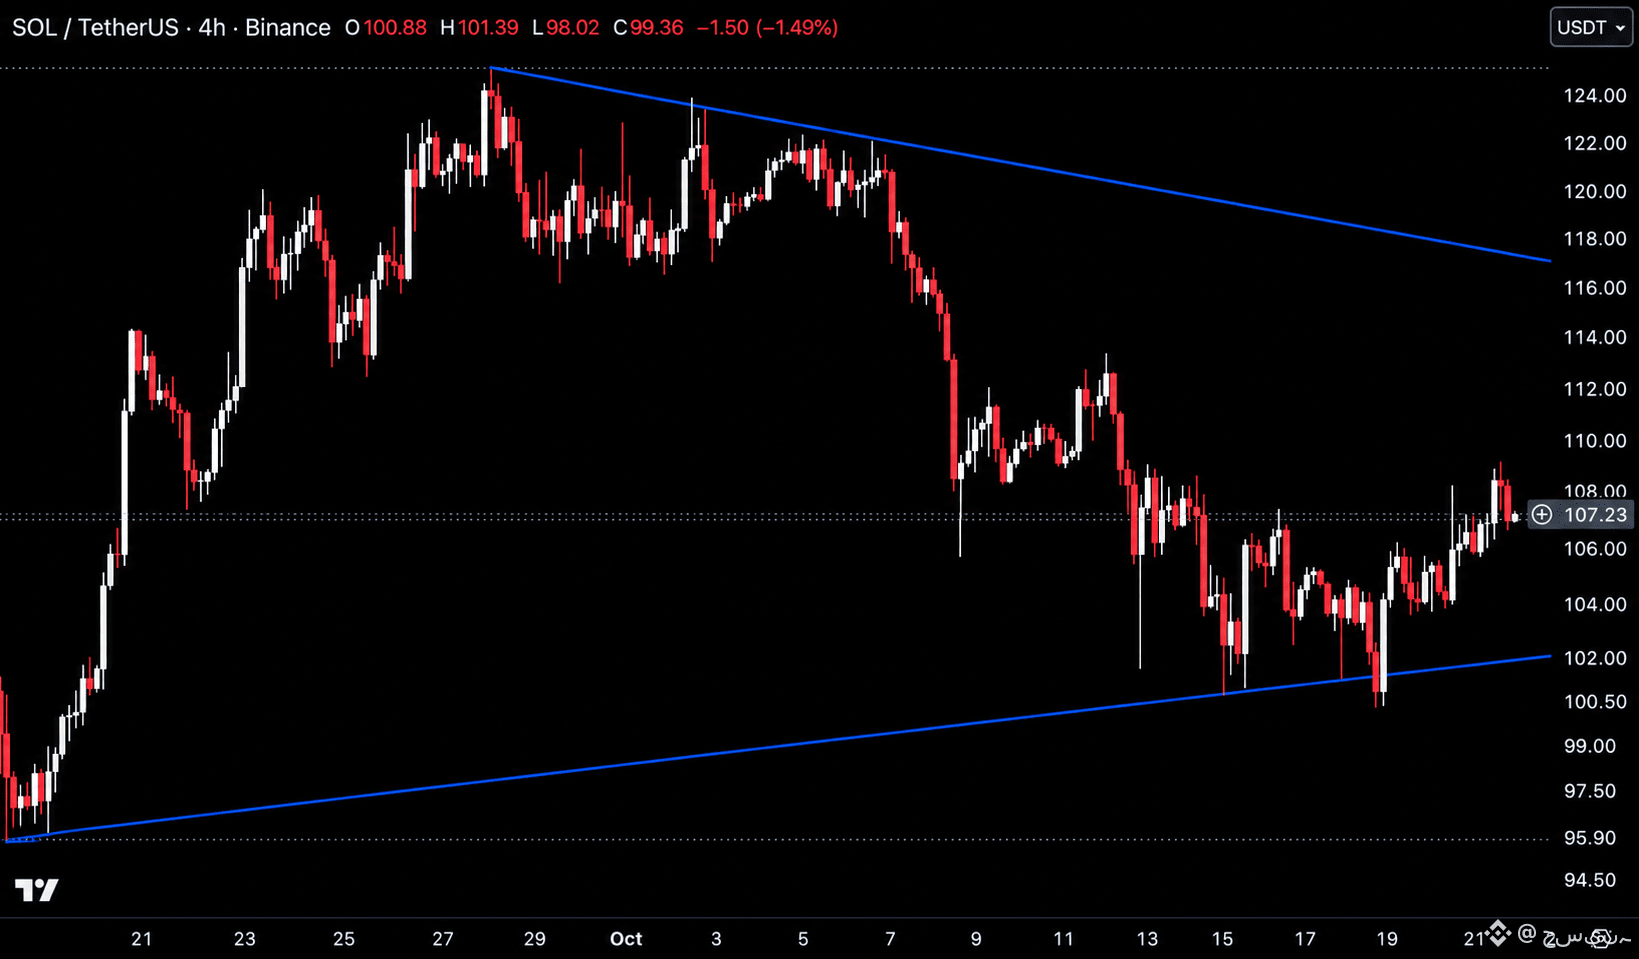
$SOL is trading at 101, rising trendline from September near 101.00 inside a symmetrical triangle, with descending resistance from the 125.00 high sitting near 117.00.
Hold this trendline and this pushes back toward 110.00 to 114.00. Lose it and this drops back toward 99.00 to 97.50. #SOL
{future}(SOLUSDT)
$SOL is trading at 101, rising trendline from September near 101.00 inside a symmetrical triangle, with descending resistance from the 125.00 high sitting near 117.00.
Hold this trendline and this pushes back toward 110.00 to 114.00. Lose it and this drops back toward 99.00 to 97.50. #SOL
Hold this trendline and this pushes back toward 110.00 to 114.00. Lose it and this drops back toward 99.00 to 97.50. #SOL
2
46
·
--
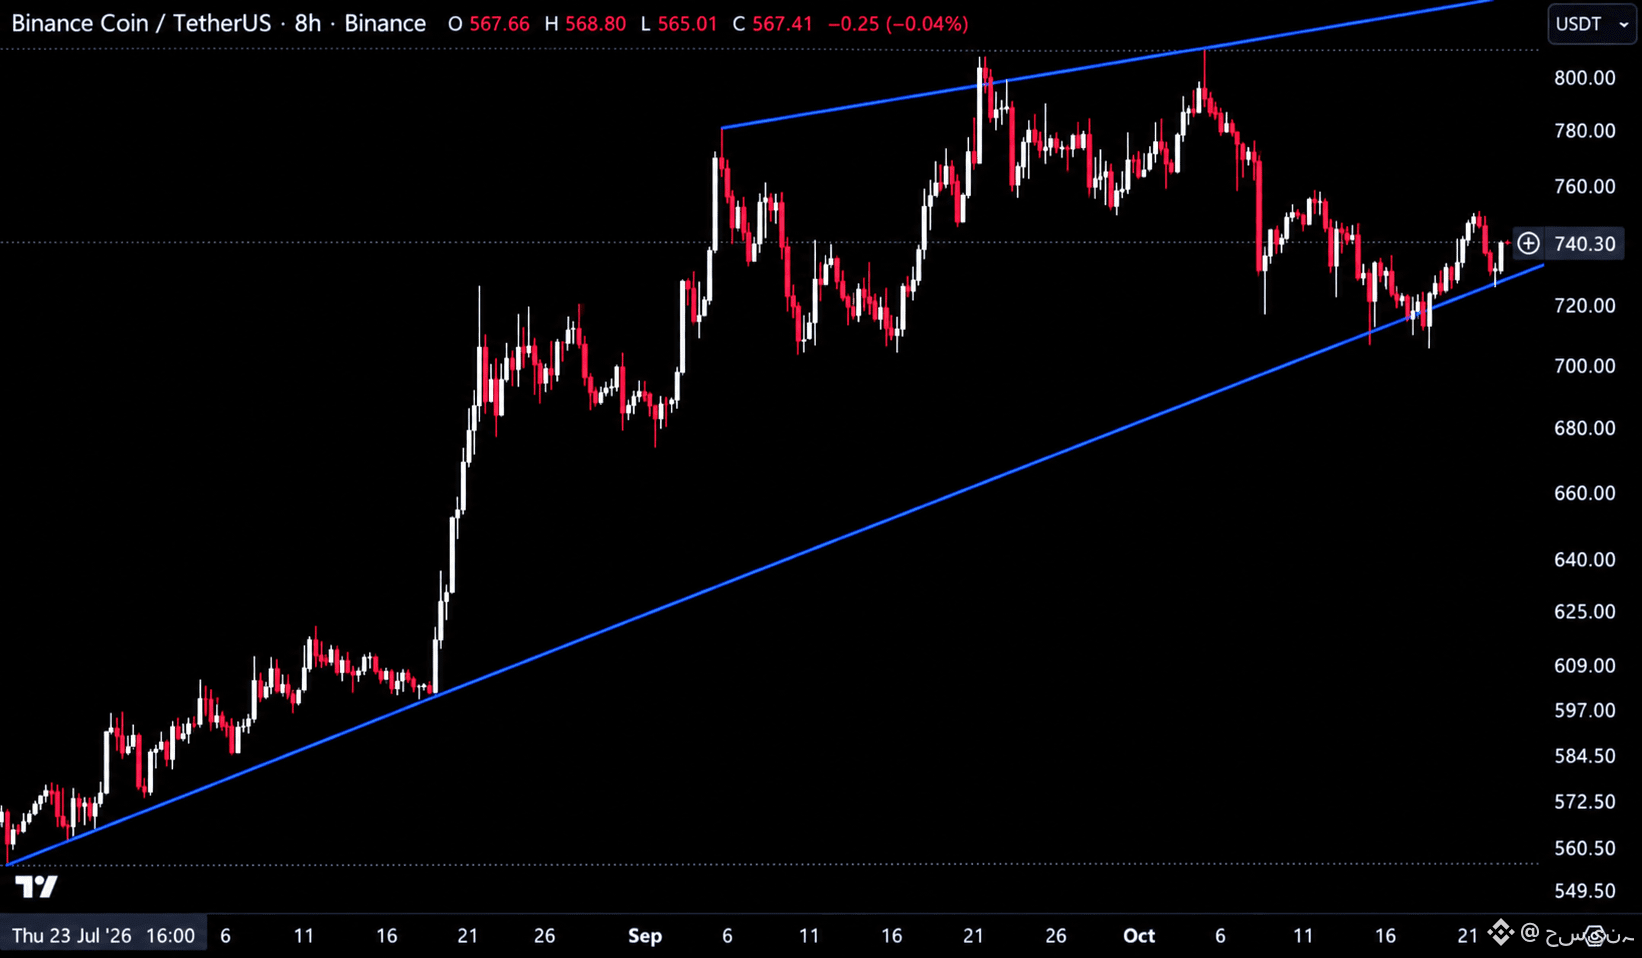
$BNB is trading at 744, bouncing off the rising trendline from July near 730.00 after a pullback from highs near 810.00.
Hold this trendline and this pushes back toward 760.00 to 780.00. Lose it and this drops back toward 700.00 to 680.00. #BNB
{future}(BNBUSDT)
$BNB is trading at 744, bouncing off the rising trendline from July near 730.00 after a pullback from highs near 810.00.
Hold this trendline and this pushes back toward 760.00 to 780.00. Lose it and this drops back toward 700.00 to 680.00. #BNB
Hold this trendline and this pushes back toward 760.00 to 780.00. Lose it and this drops back toward 700.00 to 680.00. #BNB
2
29
·
--
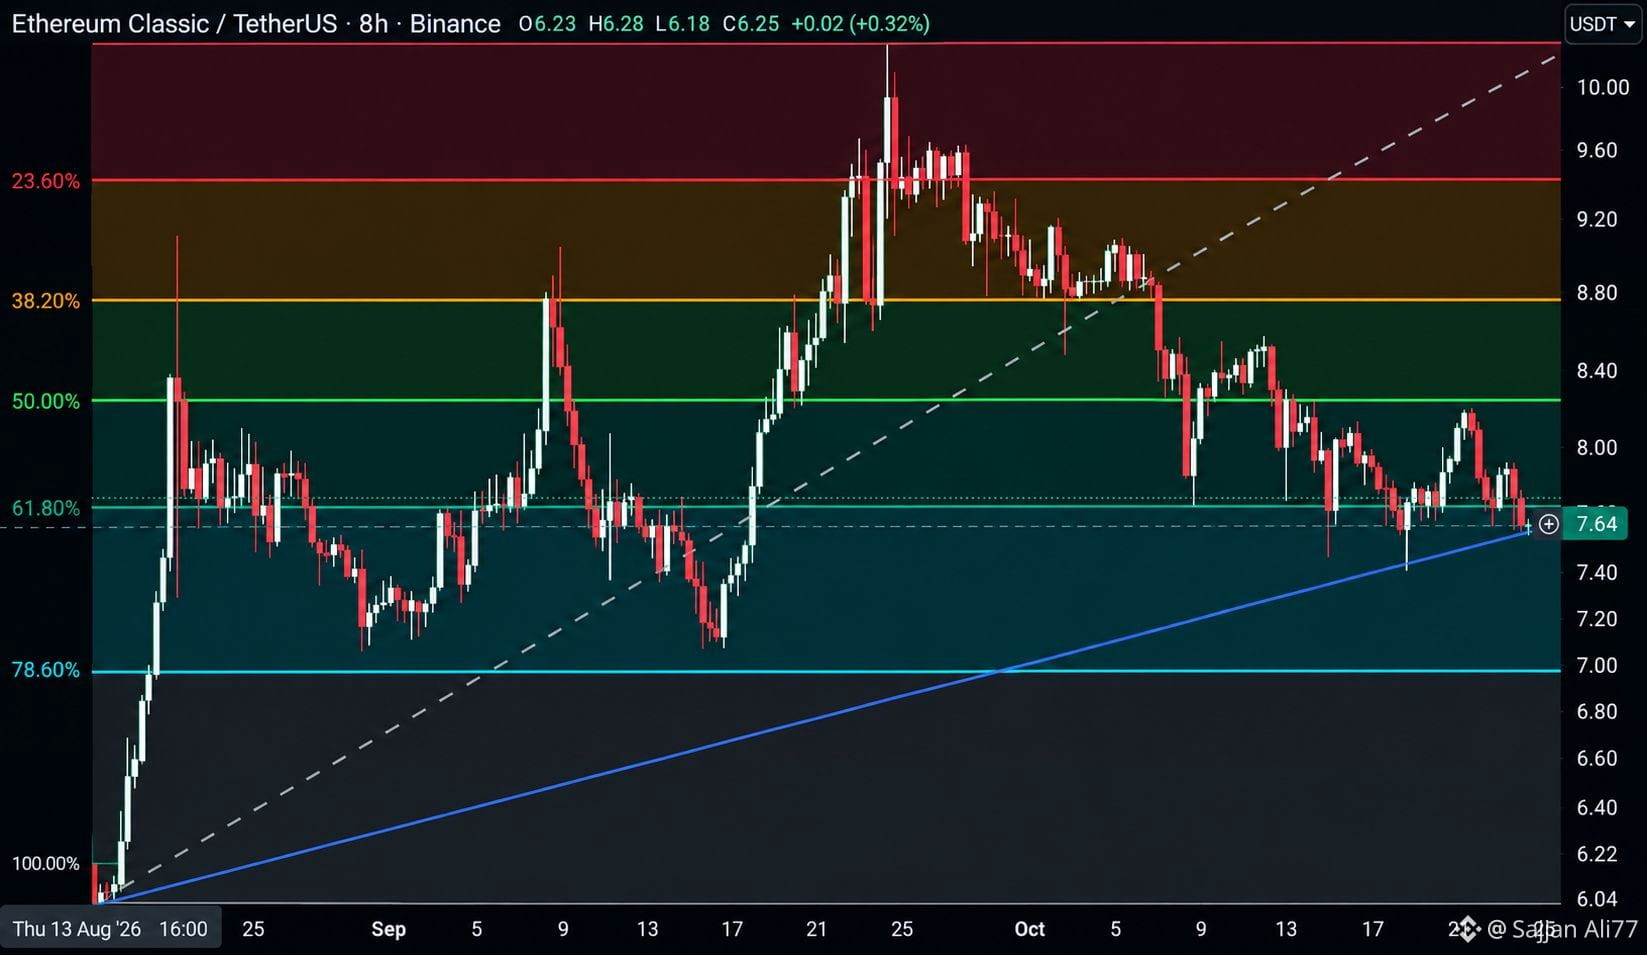
$ETC is trading at 7.64, reacting once again at the 61.8% Fibonacci level near 7.73, which has held as support alongside the rising trendline from August near 7.60 after the pullback from highs near 10.40.
Hold the 61.8% level and this pushes back toward the 50% level near 8.22 and the 38.2% level near 8.76. Lose it and this drops toward the 78.6% level near 6.97. #ETC
{future}(ETCUSDT)
$ETC is trading at 7.64, reacting once again at the 61.8% Fibonacci level near 7.73, which has held as support alongside the rising trendline from August near 7.60 after the pullback from highs near 10.40.
Hold the 61.8% level and this pushes back toward the 50% level near 8.22 and the 38.2% level near 8.76. Lose it and this drops toward the 78.6% level near 6.97. #ETC
Hold the 61.8% level and this pushes back toward the 50% level near 8.22 and the 38.2% level near 8.76. Lose it and this drops toward the 78.6% level near 6.97. #ETC
2
65
Connectez-vous pour découvrir plus de contenu
Rejoignez la communauté mondiale des adeptes de cryptomonnaies sur Binance Square
⚡️ Suviez les dernières informations importantes sur les cryptomonnaies.
💬 Jugé digne de confiance par la plus grande plateforme d’échange de cryptomonnaies au monde.
👍 Découvrez les connaissances que partagent les créateurs vérifiés.
Adresse e-mail/Nº de téléphone