
Crypto_Paykash
2.3k Publications

Crypto_Paykash
Signaler
Bloquer l’utilisateur
Crypto enthusiast | Exploring blockchain and digital assets | Content creator | Writer | CMC KOL.
Ouvert au trading
Trade occasionnellement
4.3 an(s)
15 Suivis
1.7K+ Abonnés
3.2K+ J’aime
Publications
Portefeuille
Tous
Citations
PINNED
Pour de nombreux traders qui ne savent pas comment SpaceX $SPCX fonctionne, c’est bien plus grand que ce que beaucoup de traders ne lui créditent.
De mon point de vue, toute personne qui achète maintenant devrait penser sur le long terme plutôt que de courir après l’évolution du prix à court terme. Le potentiel de revenus futurs de l’entreprise est énorme, donc ne soyez pas surpris si le cours évolue en dessous de 100 $ à un moment donné. C’est tout à fait normal sur le marché boursier.
Si vous croyez à l’histoire sur le long terme, la volatilité à court terme n’est qu’une partie du parcours.
Pour de nombreux traders qui ne savent pas comment SpaceX $SPCX fonctionne, c’est bien plus grand que ce que beaucoup de traders ne lui créditent.
De mon point de vue, toute personne qui achète maintenant devrait penser sur le long terme plutôt que de courir après l’évolution du prix à court terme. Le potentiel de revenus futurs de l’entreprise est énorme, donc ne soyez pas surpris si le cours évolue en dessous de 100 $ à un moment donné. C’est tout à fait normal sur le marché boursier.
Si vous croyez à l’histoire sur le long terme, la volatilité à court terme n’est qu’une partie du parcours.
De mon point de vue, toute personne qui achète maintenant devrait penser sur le long terme plutôt que de courir après l’évolution du prix à court terme. Le potentiel de revenus futurs de l’entreprise est énorme, donc ne soyez pas surpris si le cours évolue en dessous de 100 $ à un moment donné. C’est tout à fait normal sur le marché boursier.
Si vous croyez à l’histoire sur le long terme, la volatilité à court terme n’est qu’une partie du parcours.
17
3
122
396.9k
PINNED
Article
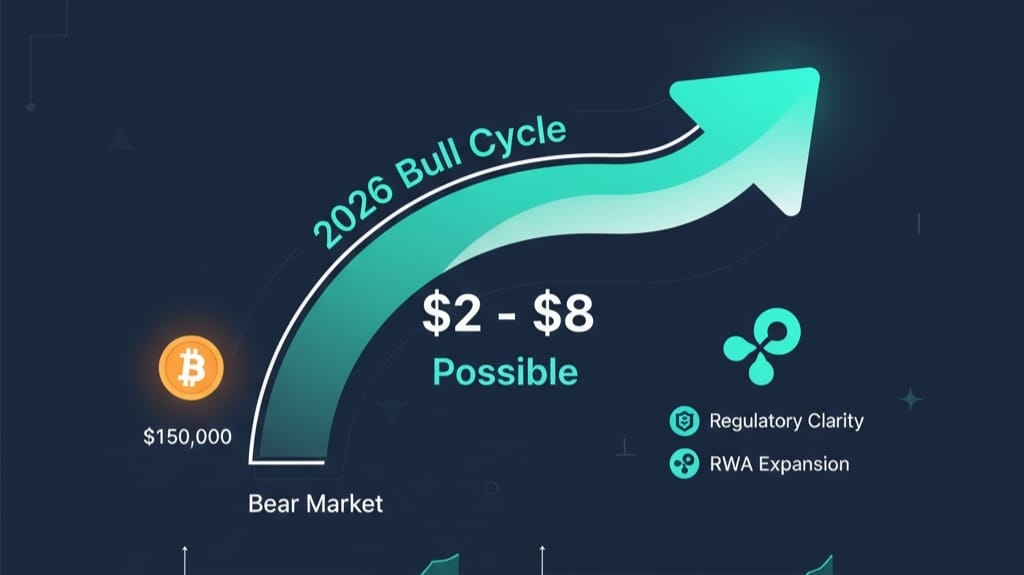
Comprendre le potentiel de retournement de cycle de XRP en 2026Les marchés de la cryptographie évoluent en cycles, périodes de croissance rapide suivies de corrections profondes. Début 2026, le sentiment est baissier : le Bitcoin se situe près de 69K$ après avoir reculé par rapport aux sommets de 2025, tandis que des altcoins majeurs comme Solana (SOL) et
ont chuté d'environ 40–45 % depuis le début de l'année. Historiquement, cependant, ces phases pessimistes préparent souvent le terrain pour le prochain grand rallye.
XRP est particulièrement intéressant en ce moment. Échangeant autour de 1,40 $–1,60 $, il reste en dessous de son ATH de 2018 de 3,65 $, mais bien au-dessus des creux de 0,20 $ observés lors des précédentes baisses. La grande question : 2026 pourrait-elle marquer un retournement de cycle de baissier à haussier ?
Comprendre le potentiel de retournement de cycle de XRP en 2026
Les marchés de la cryptographie évoluent en cycles, périodes de croissance rapide suivies de corrections profondes. Début 2026, le sentiment est baissier : le Bitcoin se situe près de 69K$ après avoir reculé par rapport aux sommets de 2025, tandis que des altcoins majeurs comme Solana (SOL) et
ont chuté d'environ 40–45 % depuis le début de l'année. Historiquement, cependant, ces phases pessimistes préparent souvent le terrain pour le prochain grand rallye.
XRP est particulièrement intéressant en ce moment. Échangeant autour de 1,40 $–1,60 $, il reste en dessous de son ATH de 2018 de 3,65 $, mais bien au-dessus des creux de 0,20 $ observés lors des précédentes baisses. La grande question : 2026 pourrait-elle marquer un retournement de cycle de baissier à haussier ?
ont chuté d'environ 40–45 % depuis le début de l'année. Historiquement, cependant, ces phases pessimistes préparent souvent le terrain pour le prochain grand rallye.
XRP est particulièrement intéressant en ce moment. Échangeant autour de 1,40 $–1,60 $, il reste en dessous de son ATH de 2018 de 3,65 $, mais bien au-dessus des creux de 0,20 $ observés lors des précédentes baisses. La grande question : 2026 pourrait-elle marquer un retournement de cycle de baissier à haussier ?
8
5
71
55.5k
Voir la traduction
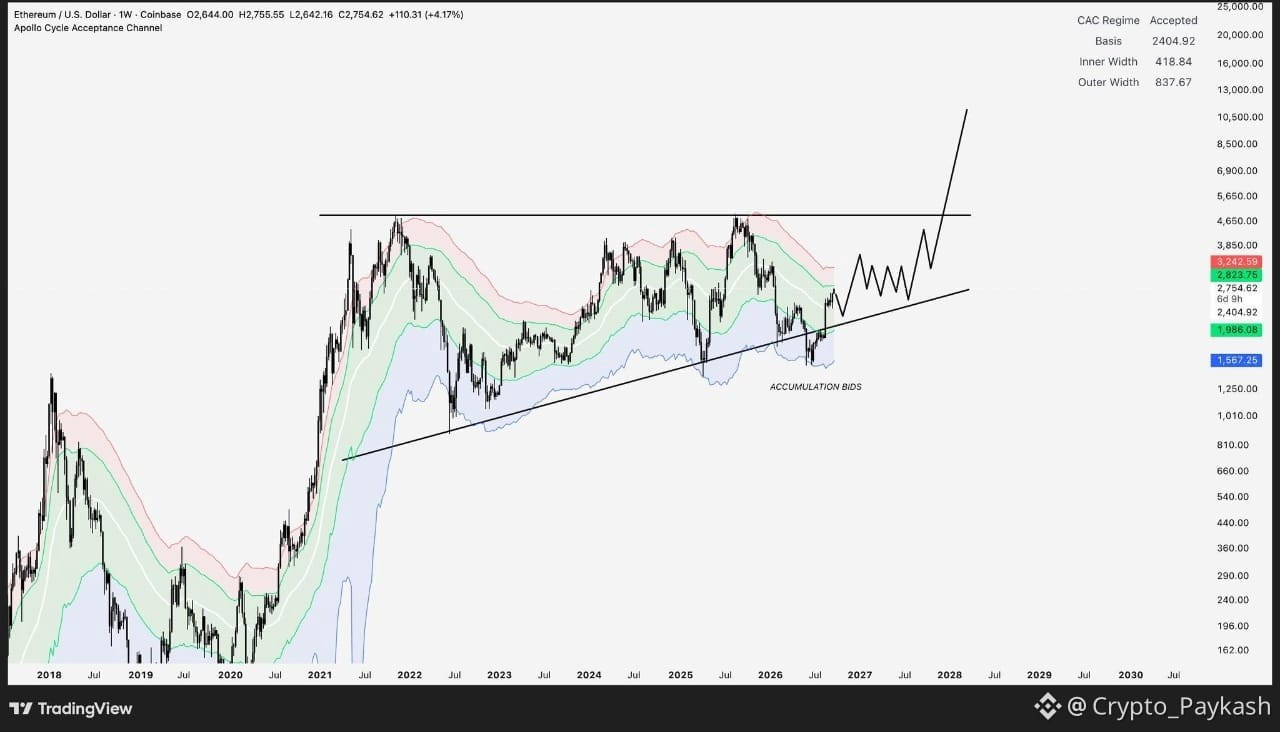
$ETH still has one of the cleanest macro setups among the major assets.
Back in April, I mapped out the structure I wanted to see: a return to the cycle acceptance zone, accumulation around the multi-year trendline, and eventually a move back above $2,500.
Six months later, Ethereum has followed that path pretty closely.
It may take some patience, but the next bigger expansion could eventually take ETH toward the $5,000 area.
For the second-largest asset in crypto, I still think sub-$3K levels deserve attention.
$ETH still has one of the cleanest macro setups among the major assets.
Back in April, I mapped out the structure I wanted to see: a return to the cycle acceptance zone, accumulation around the multi-year trendline, and eventually a move back above $2,500.
Six months later, Ethereum has followed that path pretty closely.
It may take some patience, but the next bigger expansion could eventually take ETH toward the $5,000 area.
For the second-largest asset in crypto, I still think sub-$3K levels deserve attention.
Back in April, I mapped out the structure I wanted to see: a return to the cycle acceptance zone, accumulation around the multi-year trendline, and eventually a move back above $2,500.
Six months later, Ethereum has followed that path pretty closely.
It may take some patience, but the next bigger expansion could eventually take ETH toward the $5,000 area.
For the second-largest asset in crypto, I still think sub-$3K levels deserve attention.
70
Voir la traduction
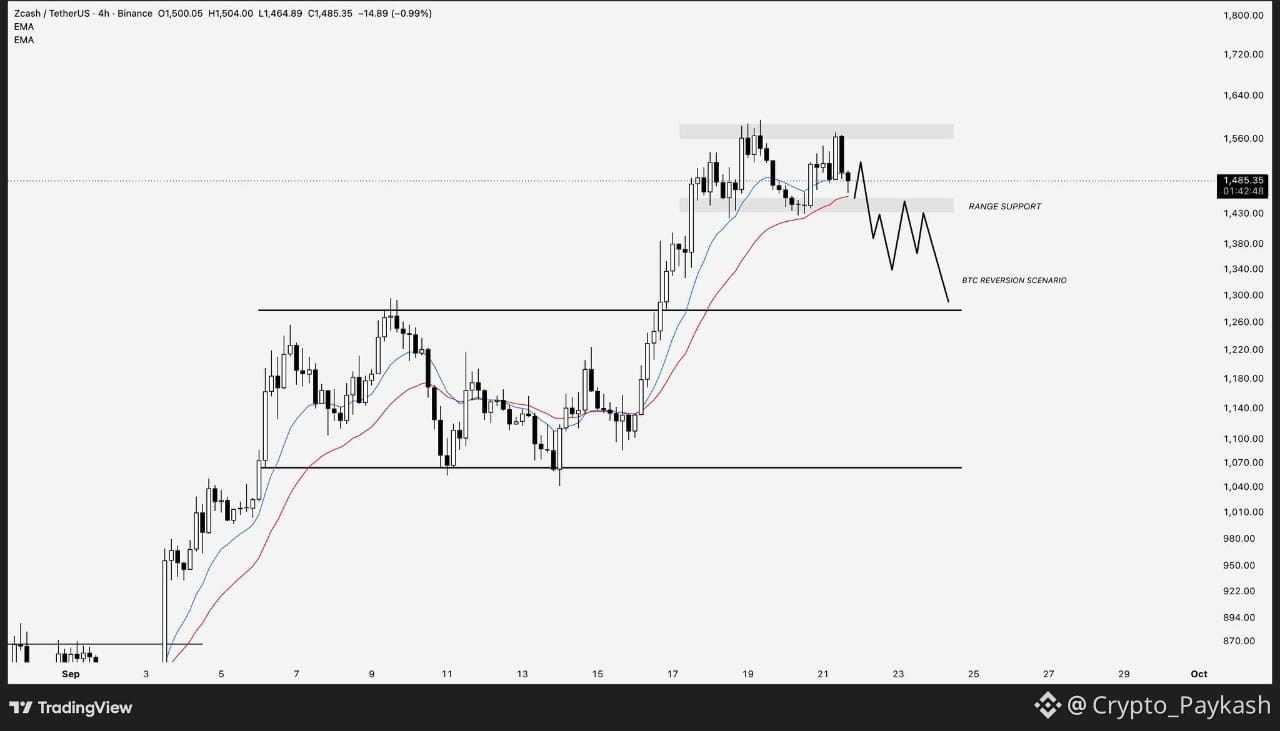
Funny how quickly the $ZEC narrative changes just because it didn’t follow $BTC higher for one day.
One day of underperformance shouldn’t erase how strong ZEC has been over the past six weeks. Over the last month alone, holding Zcash has outperformed Bitcoin by roughly 160%.
But no asset stays ahead forever. If the broader market pulls back and ZEC loses the $1,430 support, I’d be watching the $1,250 area as a potential liquidity zone.
After six weeks of expansion, a pullback could simply be the market giving buyers another chance to reload.
#CircleLaunchesInstitutionalBTCBackedBorrowing
Funny how quickly the $ZEC narrative changes just because it didn’t follow $BTC higher for one day.
One day of underperformance shouldn’t erase how strong ZEC has been over the past six weeks. Over the last month alone, holding Zcash has outperformed Bitcoin by roughly 160%.
But no asset stays ahead forever. If the broader market pulls back and ZEC loses the $1,430 support, I’d be watching the $1,250 area as a potential liquidity zone.
After six weeks of expansion, a pullback could simply be the market giving buyers another chance to reload.
#CircleLaunchesInstitutionalBTCBackedBorrowing
One day of underperformance shouldn’t erase how strong ZEC has been over the past six weeks. Over the last month alone, holding Zcash has outperformed Bitcoin by roughly 160%.
But no asset stays ahead forever. If the broader market pulls back and ZEC loses the $1,430 support, I’d be watching the $1,250 area as a potential liquidity zone.
After six weeks of expansion, a pullback could simply be the market giving buyers another chance to reload.
#CircleLaunchesInstitutionalBTCBackedBorrowing
78
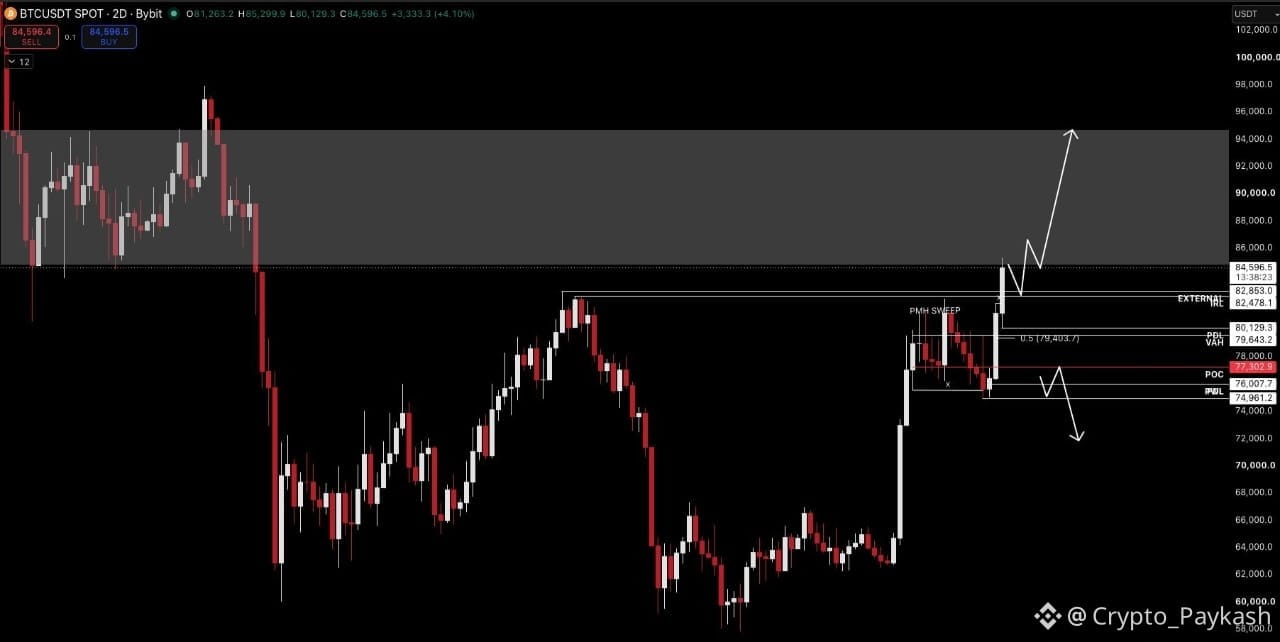
$BTC a fait preuve d’une agressivité marquée lors de la séance à Londres et a foncé directement vers 85K$.
Les niveaux de liquidité que j’ai marqués ce matin ont déjà été touchés. Ça a bougé vite.
Si vous êtes déjà long, je considérerais de prendre certains profits ici tout en surveillant de près le PA local.
Le BTC teste désormais la zone des 85K$, le bas de la consolidation précédente, avec des milliards de positions short déjà liquidées.
La dynamique est forte. Idéalement, j’aimerais voir le BTC se maintenir au-dessus de 83K$, consolider, puis nous offrir un retest propre pour un nouvel setup long.
S’il continue de monter en flèche, je scalp dans le mouvement, mais je préfère quand même des retests propres en intraday.
Pas de raison de lutter contre cette dynamique avec des shorts tant qu’une faiblesse sur le HTF ne se manifeste pas. Pour l’instant, on attend le prochain setup propre.
#SaylorHintsStrategyBitcoinBuy
$BTC a fait preuve d’une agressivité marquée lors de la séance à Londres et a foncé directement vers 85K$.
Les niveaux de liquidité que j’ai marqués ce matin ont déjà été touchés. Ça a bougé vite.
Si vous êtes déjà long, je considérerais de prendre certains profits ici tout en surveillant de près le PA local.
Le BTC teste désormais la zone des 85K$, le bas de la consolidation précédente, avec des milliards de positions short déjà liquidées.
La dynamique est forte. Idéalement, j’aimerais voir le BTC se maintenir au-dessus de 83K$, consolider, puis nous offrir un retest propre pour un nouvel setup long.
S’il continue de monter en flèche, je scalp dans le mouvement, mais je préfère quand même des retests propres en intraday.
Pas de raison de lutter contre cette dynamique avec des shorts tant qu’une faiblesse sur le HTF ne se manifeste pas. Pour l’instant, on attend le prochain setup propre.
#SaylorHintsStrategyBitcoinBuy
Les niveaux de liquidité que j’ai marqués ce matin ont déjà été touchés. Ça a bougé vite.
Si vous êtes déjà long, je considérerais de prendre certains profits ici tout en surveillant de près le PA local.
Le BTC teste désormais la zone des 85K$, le bas de la consolidation précédente, avec des milliards de positions short déjà liquidées.
La dynamique est forte. Idéalement, j’aimerais voir le BTC se maintenir au-dessus de 83K$, consolider, puis nous offrir un retest propre pour un nouvel setup long.
S’il continue de monter en flèche, je scalp dans le mouvement, mais je préfère quand même des retests propres en intraday.
Pas de raison de lutter contre cette dynamique avec des shorts tant qu’une faiblesse sur le HTF ne se manifeste pas. Pour l’instant, on attend le prochain setup propre.
#SaylorHintsStrategyBitcoinBuy
1
152
Voir la traduction
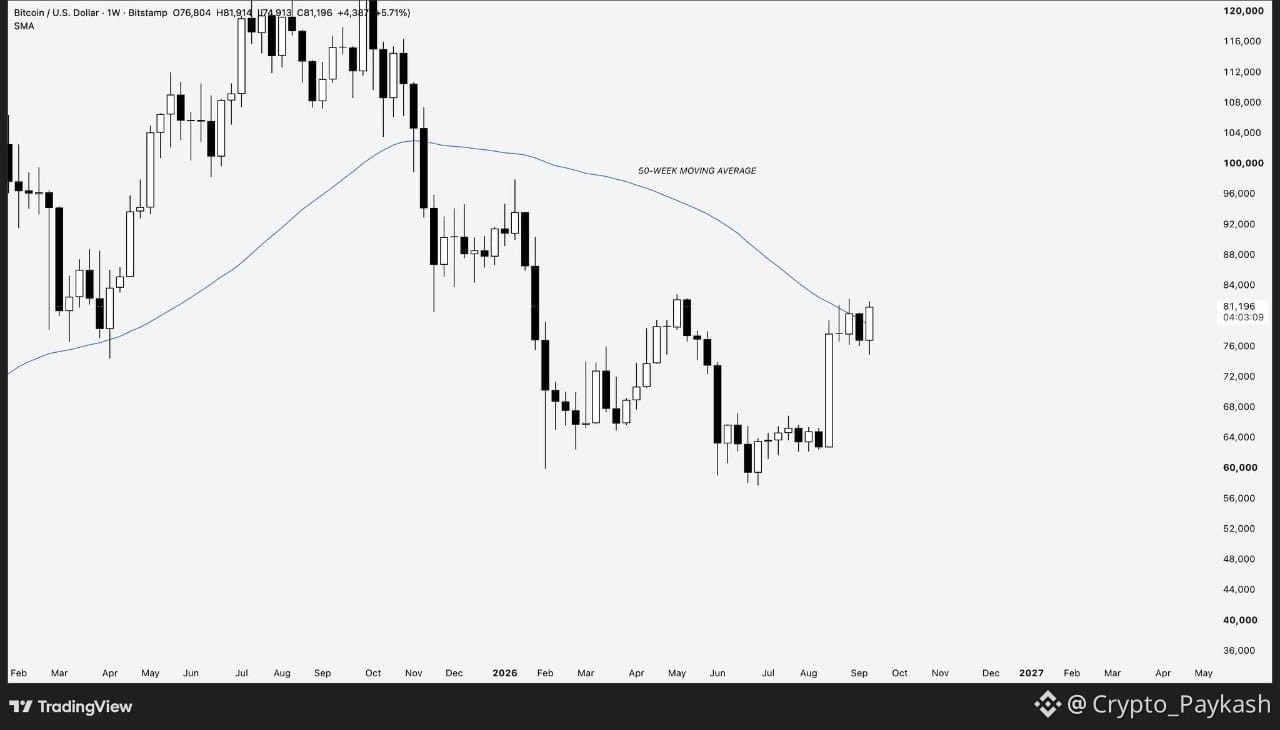
$BTC is on track for its first weekly close above the 50WMA since losing it around $103K.
The first reclaim attempt was rejected a few weeks ago, which isn’t unusual. Historically, Bitcoin has often struggled on the first 50WMA retest during bear markets before eventually reclaiming it on the second attempt.
Interestingly, those successful second reclaims have historically aligned with major market regime shifts.
Now we’re seeing the second attempt. Watching how this weekly close plays out.
#BTCBreaks80K
$BTC is on track for its first weekly close above the 50WMA since losing it around $103K.
The first reclaim attempt was rejected a few weeks ago, which isn’t unusual. Historically, Bitcoin has often struggled on the first 50WMA retest during bear markets before eventually reclaiming it on the second attempt.
Interestingly, those successful second reclaims have historically aligned with major market regime shifts.
Now we’re seeing the second attempt. Watching how this weekly close plays out.
#BTCBreaks80K
The first reclaim attempt was rejected a few weeks ago, which isn’t unusual. Historically, Bitcoin has often struggled on the first 50WMA retest during bear markets before eventually reclaiming it on the second attempt.
Interestingly, those successful second reclaims have historically aligned with major market regime shifts.
Now we’re seeing the second attempt. Watching how this weekly close plays out.
#BTCBreaks80K
59
Voir la traduction
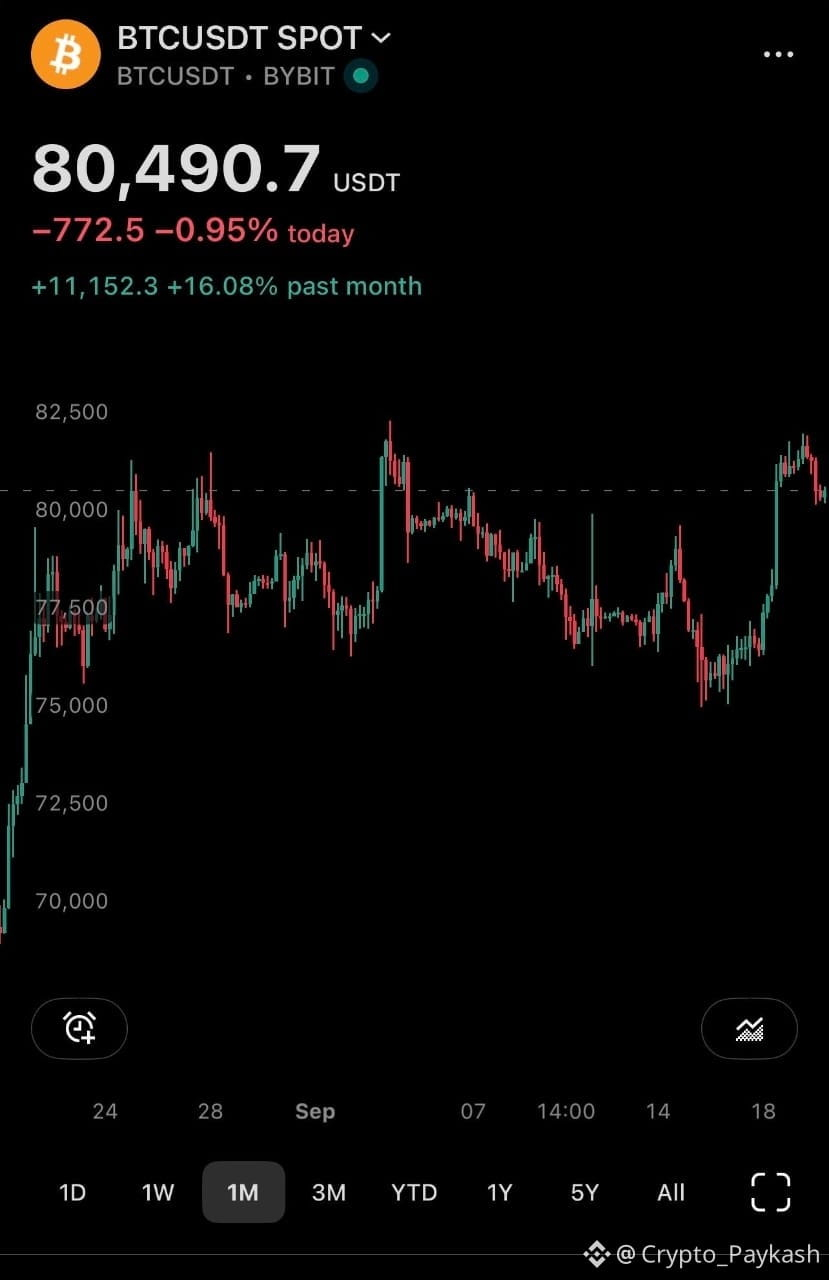
$BTC is still moving in that typical weekend consolidation range.
Bitcoin showed some strength and pushed into the $81K local range high. I stayed out of positions over the weekend, but this week could be important.
Now it’s about seeing whether BTC can hold this momentum and break the range high for the next leg up, or if we get another rejection.
If it does reject here, I’d prefer to see a shallow pullback rather than a deeper move.
For now, it’s still range-bound until we get a clear breakout.
#SaylorHintsStrategyBitcoinBuy
$BTC is still moving in that typical weekend consolidation range.
Bitcoin showed some strength and pushed into the $81K local range high. I stayed out of positions over the weekend, but this week could be important.
Now it’s about seeing whether BTC can hold this momentum and break the range high for the next leg up, or if we get another rejection.
If it does reject here, I’d prefer to see a shallow pullback rather than a deeper move.
For now, it’s still range-bound until we get a clear breakout.
#SaylorHintsStrategyBitcoinBuy
Bitcoin showed some strength and pushed into the $81K local range high. I stayed out of positions over the weekend, but this week could be important.
Now it’s about seeing whether BTC can hold this momentum and break the range high for the next leg up, or if we get another rejection.
If it does reject here, I’d prefer to see a shallow pullback rather than a deeper move.
For now, it’s still range-bound until we get a clear breakout.
#SaylorHintsStrategyBitcoinBuy
69
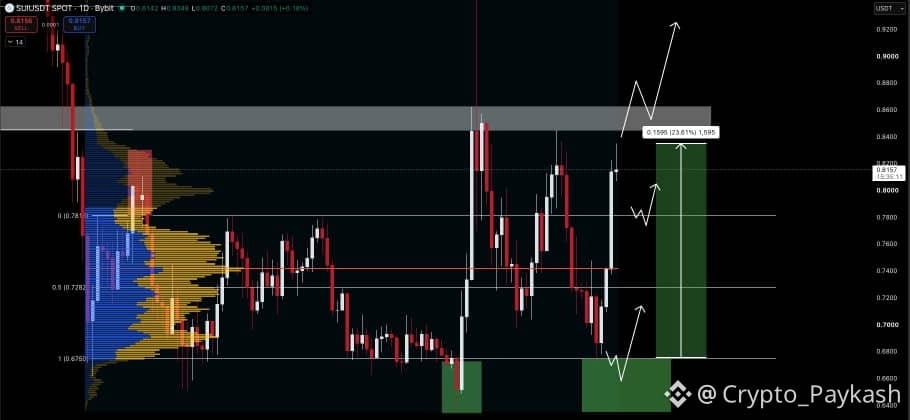
$SUI n’a jamais été aussi propre.
Il y a 4 jours, j’ai partagé le POI long de 0,67, qui correspondait à la borne basse de la HTF et à la borne basse de la zone de valeur.
Le scénario idéal était que le BTC baisse pour faire une chasse, puis remonte et permette à SUI de retester cette zone.
Et c’est exactement ce qui s’est passé.
SUI a touché les plus bas, le BTC a rebondi, et SUI a rapidement repris vers les sommets de 0,83, offrant un mouvement propre de 23,6% depuis l’entrée.
À présent, je surveille pour voir si le BTC peut continuer plus haut et donner à SUI assez d’élan pour enfin casser la résistance de 0,86.
Si on a un repli, 0,778 est le premier niveau que je surveillerais. Cela correspond au haut de la fourchette / VAH et au niveau de 50% de la bougie quotidienne.
Ces derniers temps, les alts montrent une PA vraiment très propre. Voyons si ça continue.
#BOJRaisesRatesTo31YearHigh
$SUI n’a jamais été aussi propre.
Il y a 4 jours, j’ai partagé le POI long de 0,67, qui correspondait à la borne basse de la HTF et à la borne basse de la zone de valeur.
Le scénario idéal était que le BTC baisse pour faire une chasse, puis remonte et permette à SUI de retester cette zone.
Et c’est exactement ce qui s’est passé.
SUI a touché les plus bas, le BTC a rebondi, et SUI a rapidement repris vers les sommets de 0,83, offrant un mouvement propre de 23,6% depuis l’entrée.
À présent, je surveille pour voir si le BTC peut continuer plus haut et donner à SUI assez d’élan pour enfin casser la résistance de 0,86.
Si on a un repli, 0,778 est le premier niveau que je surveillerais. Cela correspond au haut de la fourchette / VAH et au niveau de 50% de la bougie quotidienne.
Ces derniers temps, les alts montrent une PA vraiment très propre. Voyons si ça continue.
#BOJRaisesRatesTo31YearHigh
Il y a 4 jours, j’ai partagé le POI long de 0,67, qui correspondait à la borne basse de la HTF et à la borne basse de la zone de valeur.
Le scénario idéal était que le BTC baisse pour faire une chasse, puis remonte et permette à SUI de retester cette zone.
Et c’est exactement ce qui s’est passé.
SUI a touché les plus bas, le BTC a rebondi, et SUI a rapidement repris vers les sommets de 0,83, offrant un mouvement propre de 23,6% depuis l’entrée.
À présent, je surveille pour voir si le BTC peut continuer plus haut et donner à SUI assez d’élan pour enfin casser la résistance de 0,86.
Si on a un repli, 0,778 est le premier niveau que je surveillerais. Cela correspond au haut de la fourchette / VAH et au niveau de 50% de la bougie quotidienne.
Ces derniers temps, les alts montrent une PA vraiment très propre. Voyons si ça continue.
#BOJRaisesRatesTo31YearHigh
49
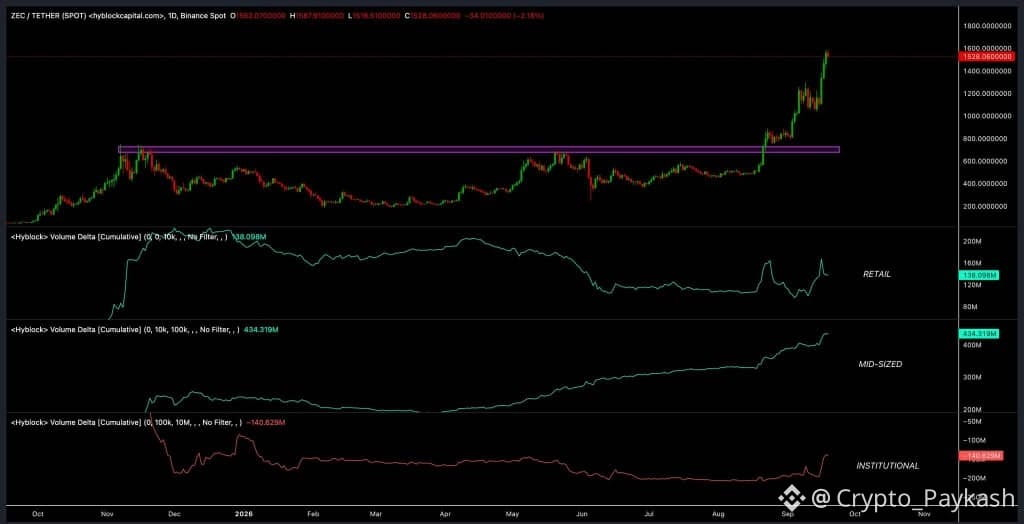
$ZEC continue de grimper après chaque repli, et les dernières données concernant les participants donnent quelques explications à ce sujet.
La CVD de taille moyenne, qui couvre des transactions de $10K à $100K, atteint encore de nouveaux plus hauts. Ce qui est encore plus intéressant, c’est que les transactions de détail inférieures à $10K et les transactions plus importantes, de $100K à $10M, montent désormais elles aussi en même temps.
Plus tôt dans la hausse, ce sont surtout les participants de taille moyenne qui effectuaient la majorité des achats, tandis que les autres restaient à l’écart.
Désormais, les trois groupes interviennent ensemble.
Beaucoup des participants qui ont manqué le mouvement depuis $400 achètent maintenant du ZEC au-dessus de $1 500. Le changement dans la participation mérite clairement d’être surveillé.
#BTCBreaks80K
$ZEC continue de grimper après chaque repli, et les dernières données concernant les participants donnent quelques explications à ce sujet.
La CVD de taille moyenne, qui couvre des transactions de $10K à $100K, atteint encore de nouveaux plus hauts. Ce qui est encore plus intéressant, c’est que les transactions de détail inférieures à $10K et les transactions plus importantes, de $100K à $10M, montent désormais elles aussi en même temps.
Plus tôt dans la hausse, ce sont surtout les participants de taille moyenne qui effectuaient la majorité des achats, tandis que les autres restaient à l’écart.
Désormais, les trois groupes interviennent ensemble.
Beaucoup des participants qui ont manqué le mouvement depuis $400 achètent maintenant du ZEC au-dessus de $1 500. Le changement dans la participation mérite clairement d’être surveillé.
#BTCBreaks80K
La CVD de taille moyenne, qui couvre des transactions de $10K à $100K, atteint encore de nouveaux plus hauts. Ce qui est encore plus intéressant, c’est que les transactions de détail inférieures à $10K et les transactions plus importantes, de $100K à $10M, montent désormais elles aussi en même temps.
Plus tôt dans la hausse, ce sont surtout les participants de taille moyenne qui effectuaient la majorité des achats, tandis que les autres restaient à l’écart.
Désormais, les trois groupes interviennent ensemble.
Beaucoup des participants qui ont manqué le mouvement depuis $400 achètent maintenant du ZEC au-dessus de $1 500. Le changement dans la participation mérite clairement d’être surveillé.
#BTCBreaks80K
93
🇺🇸 Les flux d’ETF semblent solides aujourd’hui.
Le BTC a mené les entrées avec 433 M$, suivi par l’ETH à 143 M$. Le SOL est resté stable, tandis que le XRP a enregistré une faible sortie de 43 K$.
Dans l’ensemble, les fortes entrées en BTC et en ETH valent clairement la peine d’être surveillées, alors que l’élan du marché continue de se renforcer.
#SOLJumpsAbout10%
🇺🇸 Les flux d’ETF semblent solides aujourd’hui.
Le BTC a mené les entrées avec 433 M$, suivi par l’ETH à 143 M$. Le SOL est resté stable, tandis que le XRP a enregistré une faible sortie de 43 K$.
Dans l’ensemble, les fortes entrées en BTC et en ETH valent clairement la peine d’être surveillées, alors que l’élan du marché continue de se renforcer.
#SOLJumpsAbout10%
Le BTC a mené les entrées avec 433 M$, suivi par l’ETH à 143 M$. Le SOL est resté stable, tandis que le XRP a enregistré une faible sortie de 43 K$.
Dans l’ensemble, les fortes entrées en BTC et en ETH valent clairement la peine d’être surveillées, alors que l’élan du marché continue de se renforcer.
#SOLJumpsAbout10%
52
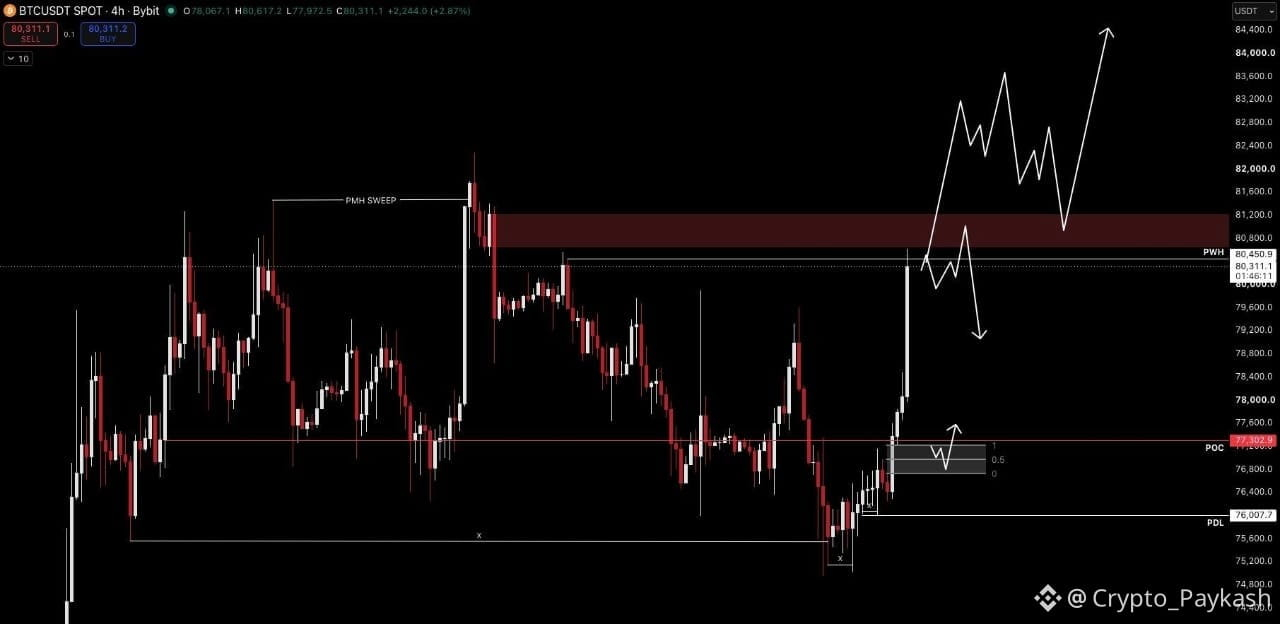
$BTC affiche une force sérieuse pendant la séance de New York.
Le Bitcoin pousse à la hausse tandis que le DXY monte aussi, ce qui rend cette force encore plus remarquable. Le BTC absorbe bien la force du dollar, et j’aime voir ce type de PA (Price Action) agressive.
Le prix a pénétré mon POI (zone d’intérêt) court, mais il n’y a pas eu de déclencheur, donc pas de trade pour moi.
Je comprends la thèse de short sur le plus haut de range, mais je la traiterais plutôt comme un setup d’épuisement à court terme et j’attendrais une confirmation baissière claire.
Depuis le mouvement de 82K il y a deux semaines, je me suis principalement concentré sur des longs de qualité. Cette semaine nous a déjà donné deux entrées solides : si vous êtes entré avec un bon point, laisser une partie courir peut avoir du sens, tout en gérant le risque.
Dans le meilleur des cas, le BTC casse le plus haut du range, consolide, et nous offre une autre opportunité de long plus haut.
Restez réactif et gérez le risque. Bon week-end.
#BTCBreaks80K
$BTC affiche une force sérieuse pendant la séance de New York.
Le Bitcoin pousse à la hausse tandis que le DXY monte aussi, ce qui rend cette force encore plus remarquable. Le BTC absorbe bien la force du dollar, et j’aime voir ce type de PA (Price Action) agressive.
Le prix a pénétré mon POI (zone d’intérêt) court, mais il n’y a pas eu de déclencheur, donc pas de trade pour moi.
Je comprends la thèse de short sur le plus haut de range, mais je la traiterais plutôt comme un setup d’épuisement à court terme et j’attendrais une confirmation baissière claire.
Depuis le mouvement de 82K il y a deux semaines, je me suis principalement concentré sur des longs de qualité. Cette semaine nous a déjà donné deux entrées solides : si vous êtes entré avec un bon point, laisser une partie courir peut avoir du sens, tout en gérant le risque.
Dans le meilleur des cas, le BTC casse le plus haut du range, consolide, et nous offre une autre opportunité de long plus haut.
Restez réactif et gérez le risque. Bon week-end.
#BTCBreaks80K
Le Bitcoin pousse à la hausse tandis que le DXY monte aussi, ce qui rend cette force encore plus remarquable. Le BTC absorbe bien la force du dollar, et j’aime voir ce type de PA (Price Action) agressive.
Le prix a pénétré mon POI (zone d’intérêt) court, mais il n’y a pas eu de déclencheur, donc pas de trade pour moi.
Je comprends la thèse de short sur le plus haut de range, mais je la traiterais plutôt comme un setup d’épuisement à court terme et j’attendrais une confirmation baissière claire.
Depuis le mouvement de 82K il y a deux semaines, je me suis principalement concentré sur des longs de qualité. Cette semaine nous a déjà donné deux entrées solides : si vous êtes entré avec un bon point, laisser une partie courir peut avoir du sens, tout en gérant le risque.
Dans le meilleur des cas, le BTC casse le plus haut du range, consolide, et nous offre une autre opportunité de long plus haut.
Restez réactif et gérez le risque. Bon week-end.
#BTCBreaks80K
84
Vérifié
🔥 Dernière minute : Evernorth a obtenu un engagement de 30 M$ de la part de NH Investment & Securities, en Corée du Sud, afin de financer des achats supplémentaires de $XRP.
Une autre évolution notable alors qu’Evernorth poursuit l’expansion de sa stratégie axée sur XRP.
🔥 Dernière minute : Evernorth a obtenu un engagement de 30 M$ de la part de NH Investment & Securities, en Corée du Sud, afin de financer des achats supplémentaires de $XRP.
Une autre évolution notable alors qu’Evernorth poursuit l’expansion de sa stratégie axée sur XRP.
Une autre évolution notable alors qu’Evernorth poursuit l’expansion de sa stratégie axée sur XRP.
2
3
3k
$BTC a franchi les 78K et a atteint notre objectif de long final.
Action des prix vraiment propre. Les demandes d’emploi (jobless claims) sont tombées de manière baissière, mais le Bitcoin a d’abord poussé plus haut, a balayé la liquidité, a piégé les acheteurs précoces et a forcé des vendeurs avant le vrai mouvement à la hausse.
Si vous n’êtes pas familier avec ce type d’incitation, il est facile de se faire découper. Parfois, attendre une confirmation est le meilleur choix.
Nous avons eu deux configurations de long claires cette semaine qui se sont bien déroulées. Le short de couverture a été stoppé, mais le long a largement compensé.
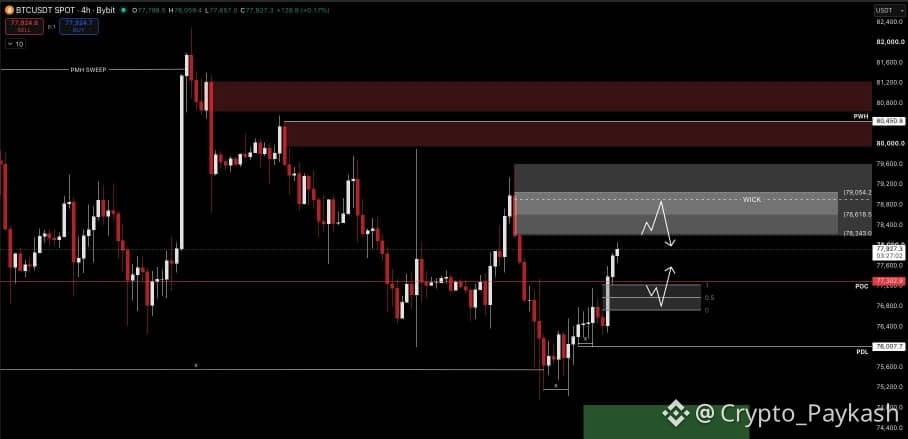
Pour aujourd’hui, je ne poursuis pas de longs après ce pump. Le BTC reteste une zone POI de short sur un timeframe plus élevé, avec 78,6K–78,8K comme zone principale que je surveille pour un déclencheur.
Pour les longs, je serais davantage intéressé par un retest du gap autour de 76,9K.
Dans l’ensemble, une semaine solide.
#BOJHikesRatesTo31YearHigh
$BTC a franchi les 78K et a atteint notre objectif de long final.
Action des prix vraiment propre. Les demandes d’emploi (jobless claims) sont tombées de manière baissière, mais le Bitcoin a d’abord poussé plus haut, a balayé la liquidité, a piégé les acheteurs précoces et a forcé des vendeurs avant le vrai mouvement à la hausse.
Si vous n’êtes pas familier avec ce type d’incitation, il est facile de se faire découper. Parfois, attendre une confirmation est le meilleur choix.
Nous avons eu deux configurations de long claires cette semaine qui se sont bien déroulées. Le short de couverture a été stoppé, mais le long a largement compensé.
Pour aujourd’hui, je ne poursuis pas de longs après ce pump. Le BTC reteste une zone POI de short sur un timeframe plus élevé, avec 78,6K–78,8K comme zone principale que je surveille pour un déclencheur.
Pour les longs, je serais davantage intéressé par un retest du gap autour de 76,9K.
Dans l’ensemble, une semaine solide.
#BOJHikesRatesTo31YearHigh
Action des prix vraiment propre. Les demandes d’emploi (jobless claims) sont tombées de manière baissière, mais le Bitcoin a d’abord poussé plus haut, a balayé la liquidité, a piégé les acheteurs précoces et a forcé des vendeurs avant le vrai mouvement à la hausse.
Si vous n’êtes pas familier avec ce type d’incitation, il est facile de se faire découper. Parfois, attendre une confirmation est le meilleur choix.
Nous avons eu deux configurations de long claires cette semaine qui se sont bien déroulées. Le short de couverture a été stoppé, mais le long a largement compensé.
Pour aujourd’hui, je ne poursuis pas de longs après ce pump. Le BTC reteste une zone POI de short sur un timeframe plus élevé, avec 78,6K–78,8K comme zone principale que je surveille pour un déclencheur.
Pour les longs, je serais davantage intéressé par un retest du gap autour de 76,9K.
Dans l’ensemble, une semaine solide.
#BOJHikesRatesTo31YearHigh
1
124
$ZEC progresse à la hausse avec une dynamique solide.
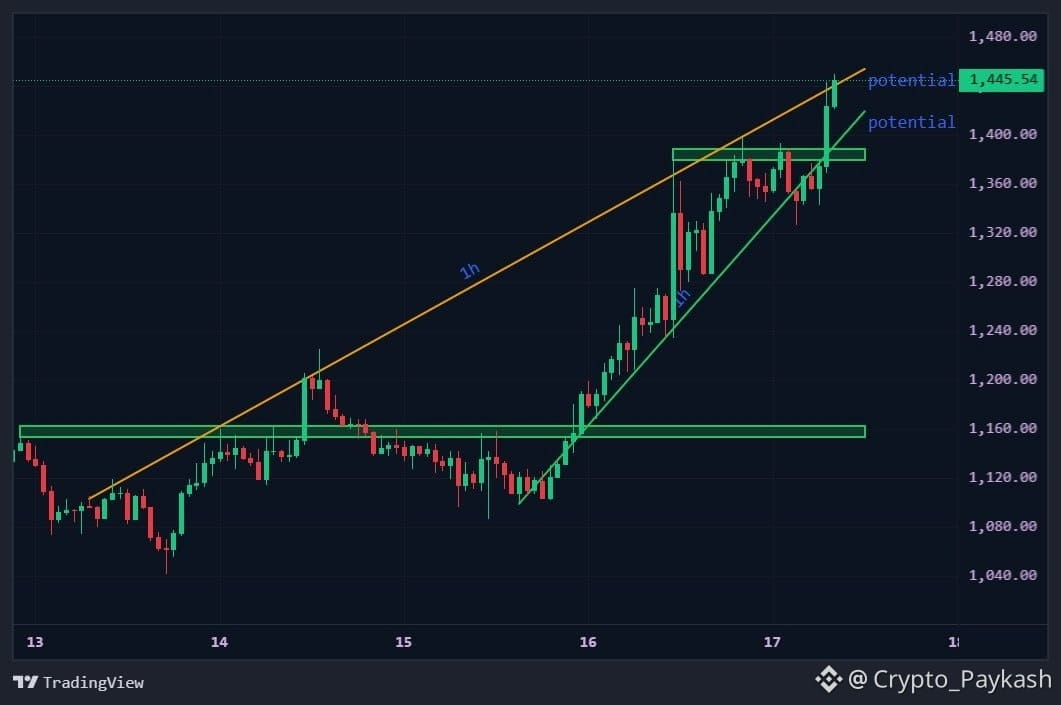
Le graphique 1H affiche des prix plus élevés depuis le 15 septembre, et le prix se situe désormais autour de 1 445,87 $ après avoir touché 1 450 plus tôt aujourd’hui.
Le point principal que je surveille ici, c’est la résistance. Le prix s’approche de la borne supérieure du canal autour de 1 454 $, tandis que le support haussier en hausse se situe près de 1 420 $.
Tant que ZEC maintient ce support en hausse, la structure haussière reste intacte. S’il le casse, je regarderai la zone de 1 380–1 389 $ pour le prochain support potentiel.
Pour l’instant, la tendance reste haussière, mais 1 450–1 454 $ est la zone qui doit être franchie. La bougie actuelle est encore en formation, donc je considère 1 445,87 $ comme un prix “en cours” plutôt qu’une clôture confirmée.
#ElSalvadorBTCHoldingsRiseTo7777
$ZEC progresse à la hausse avec une dynamique solide.
Le graphique 1H affiche des prix plus élevés depuis le 15 septembre, et le prix se situe désormais autour de 1 445,87 $ après avoir touché 1 450 plus tôt aujourd’hui.
Le point principal que je surveille ici, c’est la résistance. Le prix s’approche de la borne supérieure du canal autour de 1 454 $, tandis que le support haussier en hausse se situe près de 1 420 $.
Tant que ZEC maintient ce support en hausse, la structure haussière reste intacte. S’il le casse, je regarderai la zone de 1 380–1 389 $ pour le prochain support potentiel.
Pour l’instant, la tendance reste haussière, mais 1 450–1 454 $ est la zone qui doit être franchie. La bougie actuelle est encore en formation, donc je considère 1 445,87 $ comme un prix “en cours” plutôt qu’une clôture confirmée.
#ElSalvadorBTCHoldingsRiseTo7777
Le graphique 1H affiche des prix plus élevés depuis le 15 septembre, et le prix se situe désormais autour de 1 445,87 $ après avoir touché 1 450 plus tôt aujourd’hui.
Le point principal que je surveille ici, c’est la résistance. Le prix s’approche de la borne supérieure du canal autour de 1 454 $, tandis que le support haussier en hausse se situe près de 1 420 $.
Tant que ZEC maintient ce support en hausse, la structure haussière reste intacte. S’il le casse, je regarderai la zone de 1 380–1 389 $ pour le prochain support potentiel.
Pour l’instant, la tendance reste haussière, mais 1 450–1 454 $ est la zone qui doit être franchie. La bougie actuelle est encore en formation, donc je considère 1 445,87 $ comme un prix “en cours” plutôt qu’une clôture confirmée.
#ElSalvadorBTCHoldingsRiseTo7777
1
1
323
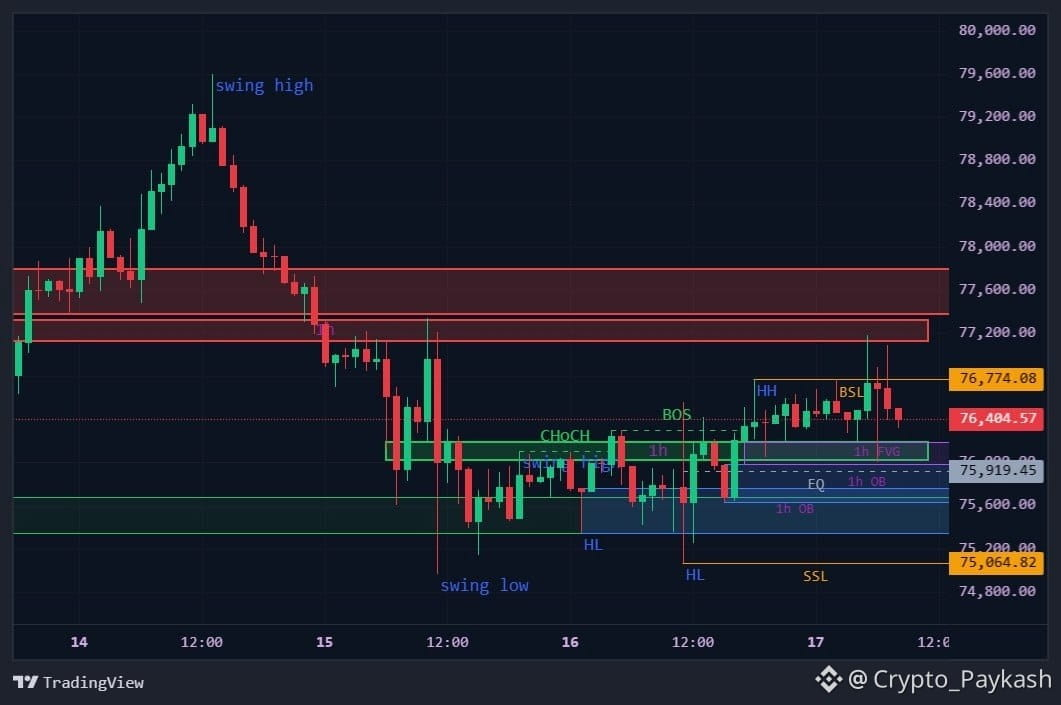
$BTC /USDT effectue un repli dans le rebond à court terme, mais la tendance n’est toujours pas clairement directionnelle.
Le prix se situe actuellement autour de 76 364, la bougie étant toujours en formation. Le BTC est passé au-dessus de 76 774, mais est rapidement retombé en dessous, montrant un rejet au niveau du récent sommet.
La zone clé que je surveille est 76 022–76 194. Tant que le BTC reste au-dessus de cette zone, la structure du rebond demeure intacte.
Si ce support venait à se briser, la prochaine zone à surveiller se situe autour de 75 350–75 986.
À la hausse, 77 125–77 324 reste la principale zone de résistance.
Les acheteurs ont réussi à se redresser depuis la zone des 75K, mais les vendeurs continuent de défendre 76,8K–77,3K. Tant que le BTC ne casse pas et ne clôture pas en dehors de la fourchette 76K–77,3K, je traite cela comme un range plutôt qu’un mouvement directionnel net.
$BTC /USDT effectue un repli dans le rebond à court terme, mais la tendance n’est toujours pas clairement directionnelle.
Le prix se situe actuellement autour de 76 364, la bougie étant toujours en formation. Le BTC est passé au-dessus de 76 774, mais est rapidement retombé en dessous, montrant un rejet au niveau du récent sommet.
La zone clé que je surveille est 76 022–76 194. Tant que le BTC reste au-dessus de cette zone, la structure du rebond demeure intacte.
Si ce support venait à se briser, la prochaine zone à surveiller se situe autour de 75 350–75 986.
À la hausse, 77 125–77 324 reste la principale zone de résistance.
Les acheteurs ont réussi à se redresser depuis la zone des 75K, mais les vendeurs continuent de défendre 76,8K–77,3K. Tant que le BTC ne casse pas et ne clôture pas en dehors de la fourchette 76K–77,3K, je traite cela comme un range plutôt qu’un mouvement directionnel net.
Le prix se situe actuellement autour de 76 364, la bougie étant toujours en formation. Le BTC est passé au-dessus de 76 774, mais est rapidement retombé en dessous, montrant un rejet au niveau du récent sommet.
La zone clé que je surveille est 76 022–76 194. Tant que le BTC reste au-dessus de cette zone, la structure du rebond demeure intacte.
Si ce support venait à se briser, la prochaine zone à surveiller se situe autour de 75 350–75 986.
À la hausse, 77 125–77 324 reste la principale zone de résistance.
Les acheteurs ont réussi à se redresser depuis la zone des 75K, mais les vendeurs continuent de défendre 76,8K–77,3K. Tant que le BTC ne casse pas et ne clôture pas en dehors de la fourchette 76K–77,3K, je traite cela comme un range plutôt qu’un mouvement directionnel net.
1
76
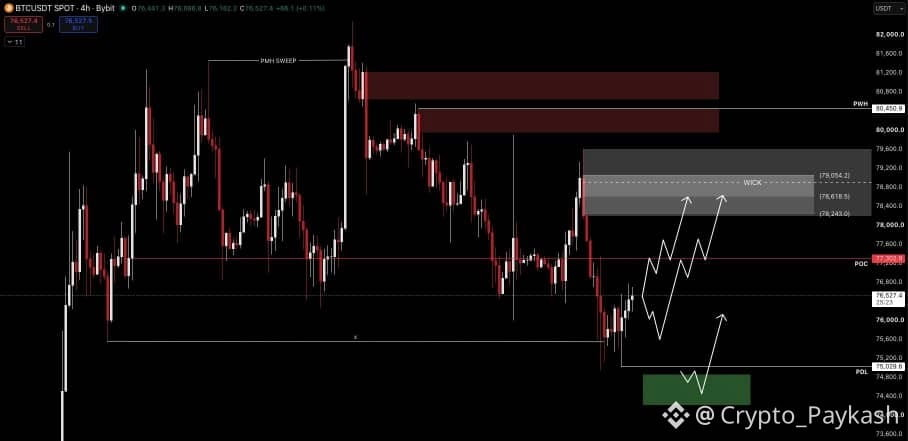
$BTC a tenu la barre des 75 000 $ hier malgré la réunion de la FOMC.
La déclaration et la conférence de presse étaient pour la plupart conformes aux attentes, donc il n’y a pas eu beaucoup de surprises. Cela signifie généralement moins de volatilité, ce que nous avons constaté.
Je voulais un mouvement plus ample, mais ne pas obtenir celui qu’on veut fait partie du trading.
Pour l’instant, je m’intéresse davantage aux positions longues. L’OI montre que les récents replis ont ramené beaucoup de shorts, tandis que la mèche quotidienne non testée me donne une autre confluence pour une configuration long.
Je vise d’abord un scalp vers le POC à 77,3 K $. Le fait de reconquérir ce niveau serait le prochain déclencheur haussier, avec 78,5 K $ comme objectif suivant.
Les premières inscriptions au chômage (Initial Jobless Claims) tombent à 08:30 (ET). Un chiffre légèrement supérieur aux attentes pourrait soutenir une réaction haussière.
Si le BTC balaie ma zone de support à 74,5 K $, je continuerai à surveiller des déclencheurs longs. Dans tous les cas, je resterai prudent autour des données et j’attendrai probablement la séance de New York pour un setup plus propre.
#FedSEPProjects2026RateAt4.1%
$BTC a tenu la barre des 75 000 $ hier malgré la réunion de la FOMC.
La déclaration et la conférence de presse étaient pour la plupart conformes aux attentes, donc il n’y a pas eu beaucoup de surprises. Cela signifie généralement moins de volatilité, ce que nous avons constaté.
Je voulais un mouvement plus ample, mais ne pas obtenir celui qu’on veut fait partie du trading.
Pour l’instant, je m’intéresse davantage aux positions longues. L’OI montre que les récents replis ont ramené beaucoup de shorts, tandis que la mèche quotidienne non testée me donne une autre confluence pour une configuration long.
Je vise d’abord un scalp vers le POC à 77,3 K $. Le fait de reconquérir ce niveau serait le prochain déclencheur haussier, avec 78,5 K $ comme objectif suivant.
Les premières inscriptions au chômage (Initial Jobless Claims) tombent à 08:30 (ET). Un chiffre légèrement supérieur aux attentes pourrait soutenir une réaction haussière.
Si le BTC balaie ma zone de support à 74,5 K $, je continuerai à surveiller des déclencheurs longs. Dans tous les cas, je resterai prudent autour des données et j’attendrai probablement la séance de New York pour un setup plus propre.
#FedSEPProjects2026RateAt4.1%
La déclaration et la conférence de presse étaient pour la plupart conformes aux attentes, donc il n’y a pas eu beaucoup de surprises. Cela signifie généralement moins de volatilité, ce que nous avons constaté.
Je voulais un mouvement plus ample, mais ne pas obtenir celui qu’on veut fait partie du trading.
Pour l’instant, je m’intéresse davantage aux positions longues. L’OI montre que les récents replis ont ramené beaucoup de shorts, tandis que la mèche quotidienne non testée me donne une autre confluence pour une configuration long.
Je vise d’abord un scalp vers le POC à 77,3 K $. Le fait de reconquérir ce niveau serait le prochain déclencheur haussier, avec 78,5 K $ comme objectif suivant.
Les premières inscriptions au chômage (Initial Jobless Claims) tombent à 08:30 (ET). Un chiffre légèrement supérieur aux attentes pourrait soutenir une réaction haussière.
Si le BTC balaie ma zone de support à 74,5 K $, je continuerai à surveiller des déclencheurs longs. Dans tous les cas, je resterai prudent autour des données et j’attendrai probablement la séance de New York pour un setup plus propre.
#FedSEPProjects2026RateAt4.1%
1
67
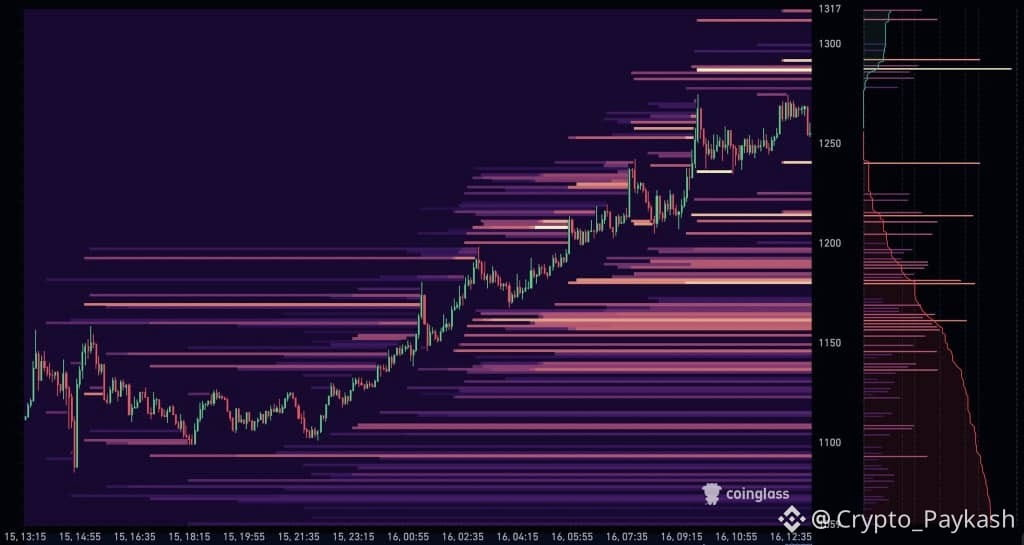
Toujours aussi divertissant de voir des shorts sur $ZEC essayer d’appeler exactement le sommet d’un mouvement de momentum.
Bien souvent, ils finissent par devenir le carburant de la prochaine jambe à la hausse.
Si le $ZEC casse les 1,300 $, je pense que le squeeze redevient assez brutal.
Toujours aussi divertissant de voir des shorts sur $ZEC essayer d’appeler exactement le sommet d’un mouvement de momentum.
Bien souvent, ils finissent par devenir le carburant de la prochaine jambe à la hausse.
Si le $ZEC casse les 1,300 $, je pense que le squeeze redevient assez brutal.
Bien souvent, ils finissent par devenir le carburant de la prochaine jambe à la hausse.
Si le $ZEC casse les 1,300 $, je pense que le squeeze redevient assez brutal.
125
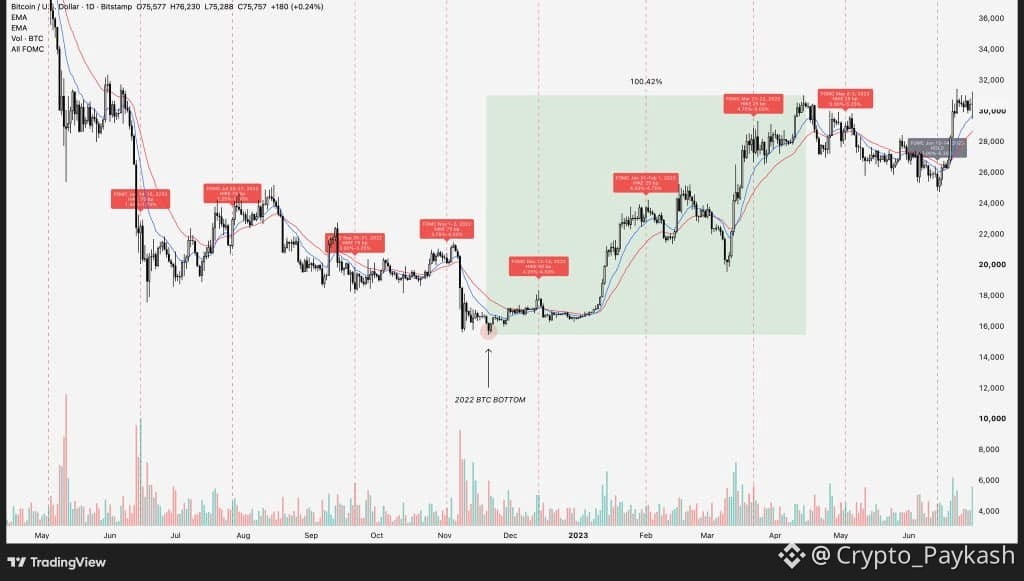
Attendre que le marché vous offre une entrée parfaite en $BTC en raison de possibles hausses de taux peut vouloir dire manquer complètement le mouvement.
Revenez à novembre 2022. Le Bitcoin a formé son point bas, et la Fed a encore délivré une hausse de taux seulement trois semaines plus tard, suivie de trois autres sur les cinq mois suivants.
Le BTC a tenu ce point bas pendant ces hausses et a malgré tout progressé d’environ 100% au cours de cette période.
Nous avons observé quelque chose de similaire en 2018. Le Bitcoin a atteint son point bas à quelques jours d’une nouvelle hausse de taux et a continué à se redresser jusqu’à la fin de l’année.
Les points bas sont généralement liés à l’essoufflement des vendeurs et au retour du capital. L’incertitude macroéconomique n’a pas nécessairement besoin de disparaître avant que le Bitcoin ne commence à se redresser.
Si la volatilité provoque des replis vers la fin de l’année, je préfère les utiliser pour bâtir progressivement une position plutôt que rester sur le côté en attendant le setup parfait.
#BitcoinFalls4%
Attendre que le marché vous offre une entrée parfaite en $BTC en raison de possibles hausses de taux peut vouloir dire manquer complètement le mouvement.
Revenez à novembre 2022. Le Bitcoin a formé son point bas, et la Fed a encore délivré une hausse de taux seulement trois semaines plus tard, suivie de trois autres sur les cinq mois suivants.
Le BTC a tenu ce point bas pendant ces hausses et a malgré tout progressé d’environ 100% au cours de cette période.
Nous avons observé quelque chose de similaire en 2018. Le Bitcoin a atteint son point bas à quelques jours d’une nouvelle hausse de taux et a continué à se redresser jusqu’à la fin de l’année.
Les points bas sont généralement liés à l’essoufflement des vendeurs et au retour du capital. L’incertitude macroéconomique n’a pas nécessairement besoin de disparaître avant que le Bitcoin ne commence à se redresser.
Si la volatilité provoque des replis vers la fin de l’année, je préfère les utiliser pour bâtir progressivement une position plutôt que rester sur le côté en attendant le setup parfait.
#BitcoinFalls4%
Revenez à novembre 2022. Le Bitcoin a formé son point bas, et la Fed a encore délivré une hausse de taux seulement trois semaines plus tard, suivie de trois autres sur les cinq mois suivants.
Le BTC a tenu ce point bas pendant ces hausses et a malgré tout progressé d’environ 100% au cours de cette période.
Nous avons observé quelque chose de similaire en 2018. Le Bitcoin a atteint son point bas à quelques jours d’une nouvelle hausse de taux et a continué à se redresser jusqu’à la fin de l’année.
Les points bas sont généralement liés à l’essoufflement des vendeurs et au retour du capital. L’incertitude macroéconomique n’a pas nécessairement besoin de disparaître avant que le Bitcoin ne commence à se redresser.
Si la volatilité provoque des replis vers la fin de l’année, je préfère les utiliser pour bâtir progressivement une position plutôt que rester sur le côté en attendant le setup parfait.
#BitcoinFalls4%
52
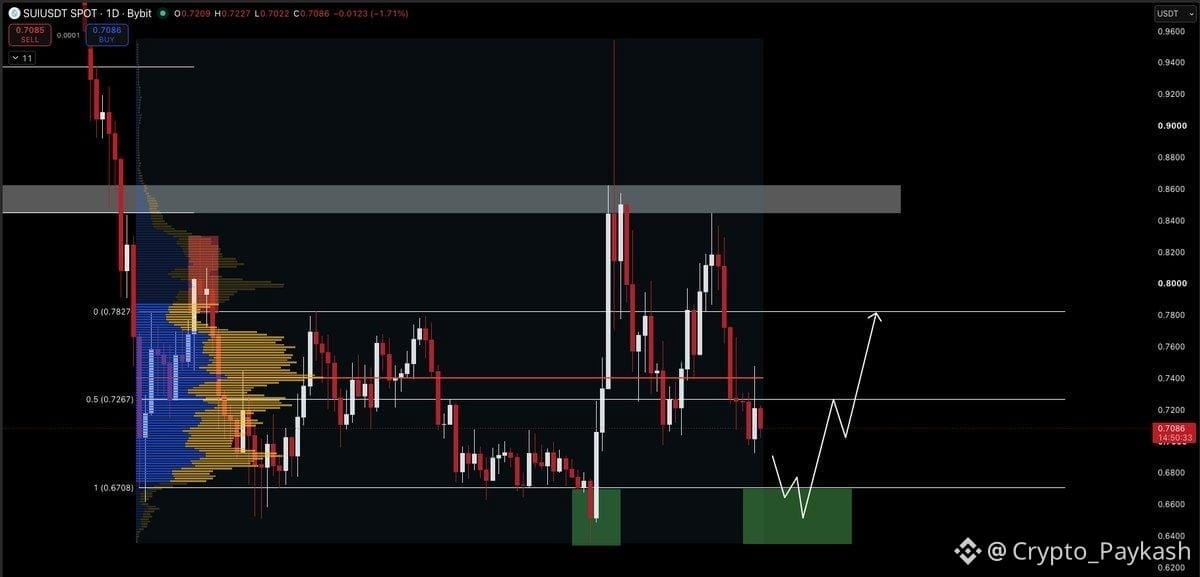
$SUI se rapproche à nouveau d’une zone intéressante.
Après le rejet de BTC, SUI a perdu le niveau médian à 0.726, a retesté le POC, puis repart en trading sous ce dernier.
Si BTC fait ce flush plus profond que je surveille, surtout une mèche rapide sous 75,5K, SUI pourrait revoir la zone basse de 0.67.
Ce niveau correspond aussi au plus bas de la zone de valeur. La dernière fois que SUI l’a balayé, on a observé une forte réaction haussière.
Donc si BTC baisse puis reprend la tendance haussière, une autre déviation autour de 0.67 pourrait préparer une réaction intéressante de SUI.
Je place mes alertes autour du bas de la range et je surveille de près l’évolution du prix.
#FedRateWatch
$SUI se rapproche à nouveau d’une zone intéressante.
Après le rejet de BTC, SUI a perdu le niveau médian à 0.726, a retesté le POC, puis repart en trading sous ce dernier.
Si BTC fait ce flush plus profond que je surveille, surtout une mèche rapide sous 75,5K, SUI pourrait revoir la zone basse de 0.67.
Ce niveau correspond aussi au plus bas de la zone de valeur. La dernière fois que SUI l’a balayé, on a observé une forte réaction haussière.
Donc si BTC baisse puis reprend la tendance haussière, une autre déviation autour de 0.67 pourrait préparer une réaction intéressante de SUI.
Je place mes alertes autour du bas de la range et je surveille de près l’évolution du prix.
#FedRateWatch
Après le rejet de BTC, SUI a perdu le niveau médian à 0.726, a retesté le POC, puis repart en trading sous ce dernier.
Si BTC fait ce flush plus profond que je surveille, surtout une mèche rapide sous 75,5K, SUI pourrait revoir la zone basse de 0.67.
Ce niveau correspond aussi au plus bas de la zone de valeur. La dernière fois que SUI l’a balayé, on a observé une forte réaction haussière.
Donc si BTC baisse puis reprend la tendance haussière, une autre déviation autour de 0.67 pourrait préparer une réaction intéressante de SUI.
Je place mes alertes autour du bas de la range et je surveille de près l’évolution du prix.
#FedRateWatch
46
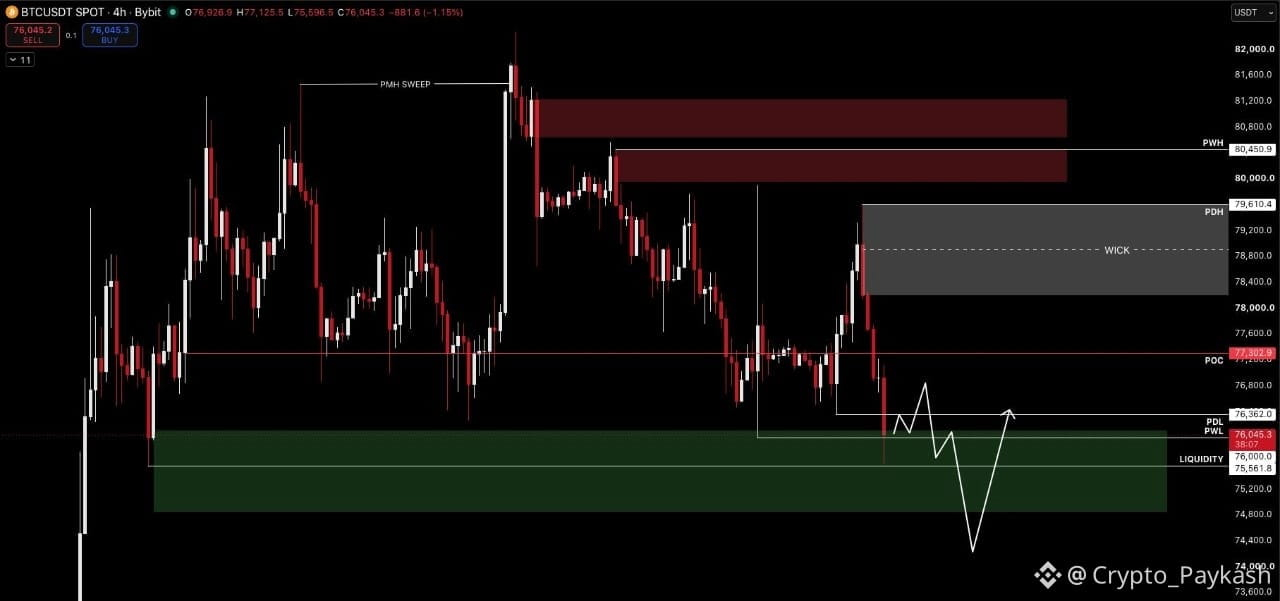
$BTC a balayé la zone des 76K (PWL), exactement comme discuté plus tôt ce matin.
Nous avons obtenu la réaction baissière attendue, mais le prix montre maintenant un rebond correct depuis ces plus bas.
Avec le vote de la loi Clarity Act et le FOMC demain, la volatilité pourrait augmenter. Mon scénario idéal reste une mèche rapide sous 75,5K suivie d’un fort redressement.
Si vous avez capté le balayage de la PWL et pris la réaction, la configuration s’est déjà jouée de façon très satisfaisante. À partir de là, je surveille cette mèche journalière comme prochain objectif.
GG à tous ceux qui ont capté le mouvement.
#BitcoinFalls4%
$BTC a balayé la zone des 76K (PWL), exactement comme discuté plus tôt ce matin.
Nous avons obtenu la réaction baissière attendue, mais le prix montre maintenant un rebond correct depuis ces plus bas.
Avec le vote de la loi Clarity Act et le FOMC demain, la volatilité pourrait augmenter. Mon scénario idéal reste une mèche rapide sous 75,5K suivie d’un fort redressement.
Si vous avez capté le balayage de la PWL et pris la réaction, la configuration s’est déjà jouée de façon très satisfaisante. À partir de là, je surveille cette mèche journalière comme prochain objectif.
GG à tous ceux qui ont capté le mouvement.
#BitcoinFalls4%
Nous avons obtenu la réaction baissière attendue, mais le prix montre maintenant un rebond correct depuis ces plus bas.
Avec le vote de la loi Clarity Act et le FOMC demain, la volatilité pourrait augmenter. Mon scénario idéal reste une mèche rapide sous 75,5K suivie d’un fort redressement.
Si vous avez capté le balayage de la PWL et pris la réaction, la configuration s’est déjà jouée de façon très satisfaisante. À partir de là, je surveille cette mèche journalière comme prochain objectif.
GG à tous ceux qui ont capté le mouvement.
#BitcoinFalls4%
61
Connectez-vous pour découvrir plus de contenu
Rejoignez la communauté mondiale des adeptes de cryptomonnaies sur Binance Square
⚡️ Suviez les dernières informations importantes sur les cryptomonnaies.
💬 Jugé digne de confiance par la plus grande plateforme d’échange de cryptomonnaies au monde.
👍 Découvrez les connaissances que partagent les créateurs vérifiés.
Adresse e-mail/Nº de téléphone
Sujets d’actualité
AIStocksWhatNext
129,053 vues
1,582 mentions
Partagez et gagnez une récompense de trafic dans notre campagne de hashtag tendance
✨Sujet : Quelles autres opportunités d’investissement restent-elles alors que les actions liées à l’IA continuent de grimper ?
👉Comment participer :
Publiez une courte publication ou un article avec le hashtag #AIStocksWhatNext
Partagez si vous êtes plutôt haussier ou baissier, et publiez vos avoirs en actions IA ou votre transaction — utiliser le widget de trading peut améliorer votre éligibilité.
Vous pouvez aussi renforcer votre publication en partageant des données ou des graphiques, et en évitant les images générées par l’IA.
✍️Créez du contenu à partir des angles ci-dessous :
- Nvidia affirme que les ventes de puces vont doubler l’an prochain, et que les principaux acteurs de l’IA continuent d’enregistrer des revenus records ; les dépenses en calcul qui soutiennent tout cela sont tout aussi impressionnantes. La demande en IA décolle-t-elle vraiment ? Et combien de temps cela peut-il durer ? Les actions IA montent partout. Est-ce une vraie cassure, ou juste un rebond à court terme ?
- Des leaders de l’industrie appellent à ralentir le développement de l’IA, tandis que Trump prévoit de construire une « Force IA », affirmant que l’IA pourrait représenter 25 % du PIB américain à l’avenir. De quel côté êtes-vous ? Le soutien au niveau des États sera-t-il un gain de long terme pour les actions IA ?
- Achetez-vous des actions liées à l’IA ? Partagez votre transaction/position liée à l’IA avec notre widget de partage de trading.
⏰Période de la campagne :
- 2026-09-22 7:00 - 2026-09-24 4:00 UTC
🎁Récompense :
- Les publications qualifiées qui respectent les consignes ci-dessus et contiennent plus de 100 mots seront examinées et pourront recevoir un boost aléatoire de trafic de 500 à 3 000 vues. Vous recevrez une notification de la part de votre secrétaire de flux si votre publication est sélectionnée.
- Ayez une chance de voir votre article mis en avant sur Binance Square Official
Vous cherchez des idées pour votre publication ? Visitez la page du sujet #AIStocksWhatNext ou la page Square Guide on How to Post for Better Reach.
Binance Square Official
·238 mentions J’aime
·437k vues
BitcoinBreaksAboveMayHighNears$86K
3,178 vues
56 mentions
DogecoinRises15%
7,907 vues
362 mentions