

VinCoop
500 Publications

VinCoop
Signaler
Bloquer l’utilisateur
Market Analyst | Blockchain Infrastructure & Tokenomics Deep research on ecosystem growth and sustainable token design. :trophy: Top CoinMarketCap KoL :handshake: Partnering for Growth: Institutional Services & Listing Partner at MEXC, WhiteBIT
0 Suivis
6 Abonnés
31 J’aime
Publications
·
--
🛠️ The Build Budget Covers Launch, but Not the Years After It When a founder adds $BTC to the roadmap, the first budget usually covers the build itself: engineering, integrations, security work, and everything needed to get the product live. That number is visible early, so it naturally becomes the center of the build-versus-buy discussion. What is easier to miss is what happens once the project leaves the roadmap and becomes infrastructure the company owns. Security still needs people watching it, liquidity and payment connections need ongoing support, order-processing systems need maintenance, and compliance work changes as the business adds markets and products. That means an in-house build is not paid for once. The initial project is followed by a permanent operating layer, while an external provider has its own recurring fee structure. Looking at only the build estimate makes those two options seem less comparable than they really are. For a fintech where crypto is a feature, WhiteBIT Crypto-as-a-Service can reduce the need to build and operate that infrastructure internally while keeping the customer-facing product under the fintech’s brand. It supports wallets, buy/sell, storage and transfers across 340+ assets and 80+ networks. https://institutional.whitebit.com/crypto-as-a-service?utm_source=coinmarketcap&utm_medium=CaAs_vinc&utm_campaign=post Economics can tilt toward ownership if crypto infrastructure becomes central to a business. At scale, running an owned stack with dedicated staff can be cheaper than paying a provider. The mistake is not choosing to build, but pricing the decision as though spending ends at launch. Disclaimer: This is not financial or investment advice. Do your own research before making any decisions. Use at your own risk. #BTC Price Analysis# #Bitcoin Price Prediction: What is Bitcoins next move?# #Ad
🛠️ The Build Budget Covers Launch, but Not the Years After It When a founder adds $BTC to the roadmap, the first budget usually covers the build itself: engineering, integrations, security work, and everything needed to get the product live. That number is visible early, so it naturally becomes the center of the build-versus-buy discussion. What is easier to miss is what happens once the project leaves the roadmap and becomes infrastructure the company owns. Security still needs people watching it, liquidity and payment connections need ongoing support, order-processing systems need maintenance, and compliance work changes as the business adds markets and products. That means an in-house build is not paid for once. The initial project is followed by a permanent operating layer, while an external provider has its own recurring fee structure. Looking at only the build estimate makes those two options seem less comparable than they really are. For a fintech where crypto is a feature, WhiteBIT Crypto-as-a-Service can reduce the need to build and operate that infrastructure internally while keeping the customer-facing product under the fintech’s brand. It supports wallets, buy/sell, storage and transfers across 340+ assets and 80+ networks. https://institutional.whitebit.com/crypto-as-a-service?utm_source=coinmarketcap&utm_medium=CaAs_vinc&utm_campaign=post Economics can tilt toward ownership if crypto infrastructure becomes central to a business. At scale, running an owned stack with dedicated staff can be cheaper than paying a provider. The mistake is not choosing to build, but pricing the decision as though spending ends at launch. Disclaimer: This is not financial or investment advice. Do your own research before making any decisions. Use at your own risk. #BTC Price Analysis# #Bitcoin Price Prediction: What is Bitcoins next move?# #Ad

·
--
Ripple’s Payments Model Was Never XRP-Only $BTC often frames the broader crypto market, but Ripple’s payments strategy is built around a different question: which settlement asset fits a specific transaction best? Resurfaced comments from CEO Brad Garlinghouse make that clear — XRP may be the right bridge asset in some cases, while a stablecoin can be better in others. When XRP fits: A source currency can be converted into $XRP, moved across markets and converted again into the destination currency. The goal is fast cross-border settlement without keeping capital pre-funded in multiple accounts. When a stablecoin fits: RLUSD, USDC or USDT can offer predictable dollar-denominated settlement without exposing a corporate payment flow to the price movement of a floating asset. Ripple Payments already reflects that multi-asset structure. According to the company, businesses can settle in RLUSD, USDC, USDT or fiat, while the network operates across 60+ markets and has processed more than $100B in payment volume. So the resurfaced January comments do not point to a pivot away from XRP. They describe the architecture Ripple already uses: XRP for some liquidity routes, stablecoins for others, and the customer requirement deciding which rail gets used. #BTC Price Analysis# #Ripple #Ad #Bitcoin Price Prediction: What is Bitcoins next move?#
Ripple’s Payments Model Was Never XRP-Only $BTC often frames the broader crypto market, but Ripple’s payments strategy is built around a different question: which settlement asset fits a specific transaction best? Resurfaced comments from CEO Brad Garlinghouse make that clear — XRP may be the right bridge asset in some cases, while a stablecoin can be better in others. When XRP fits: A source currency can be converted into $XRP, moved across markets and converted again into the destination currency. The goal is fast cross-border settlement without keeping capital pre-funded in multiple accounts. When a stablecoin fits: RLUSD, USDC or USDT can offer predictable dollar-denominated settlement without exposing a corporate payment flow to the price movement of a floating asset. Ripple Payments already reflects that multi-asset structure. According to the company, businesses can settle in RLUSD, USDC, USDT or fiat, while the network operates across 60+ markets and has processed more than $100B in payment volume. So the resurfaced January comments do not point to a pivot away from XRP. They describe the architecture Ripple already uses: XRP for some liquidity routes, stablecoins for others, and the customer requirement deciding which rail gets used. #BTC Price Analysis# #Ripple #Ad #Bitcoin Price Prediction: What is Bitcoins next move?#

37
·
--
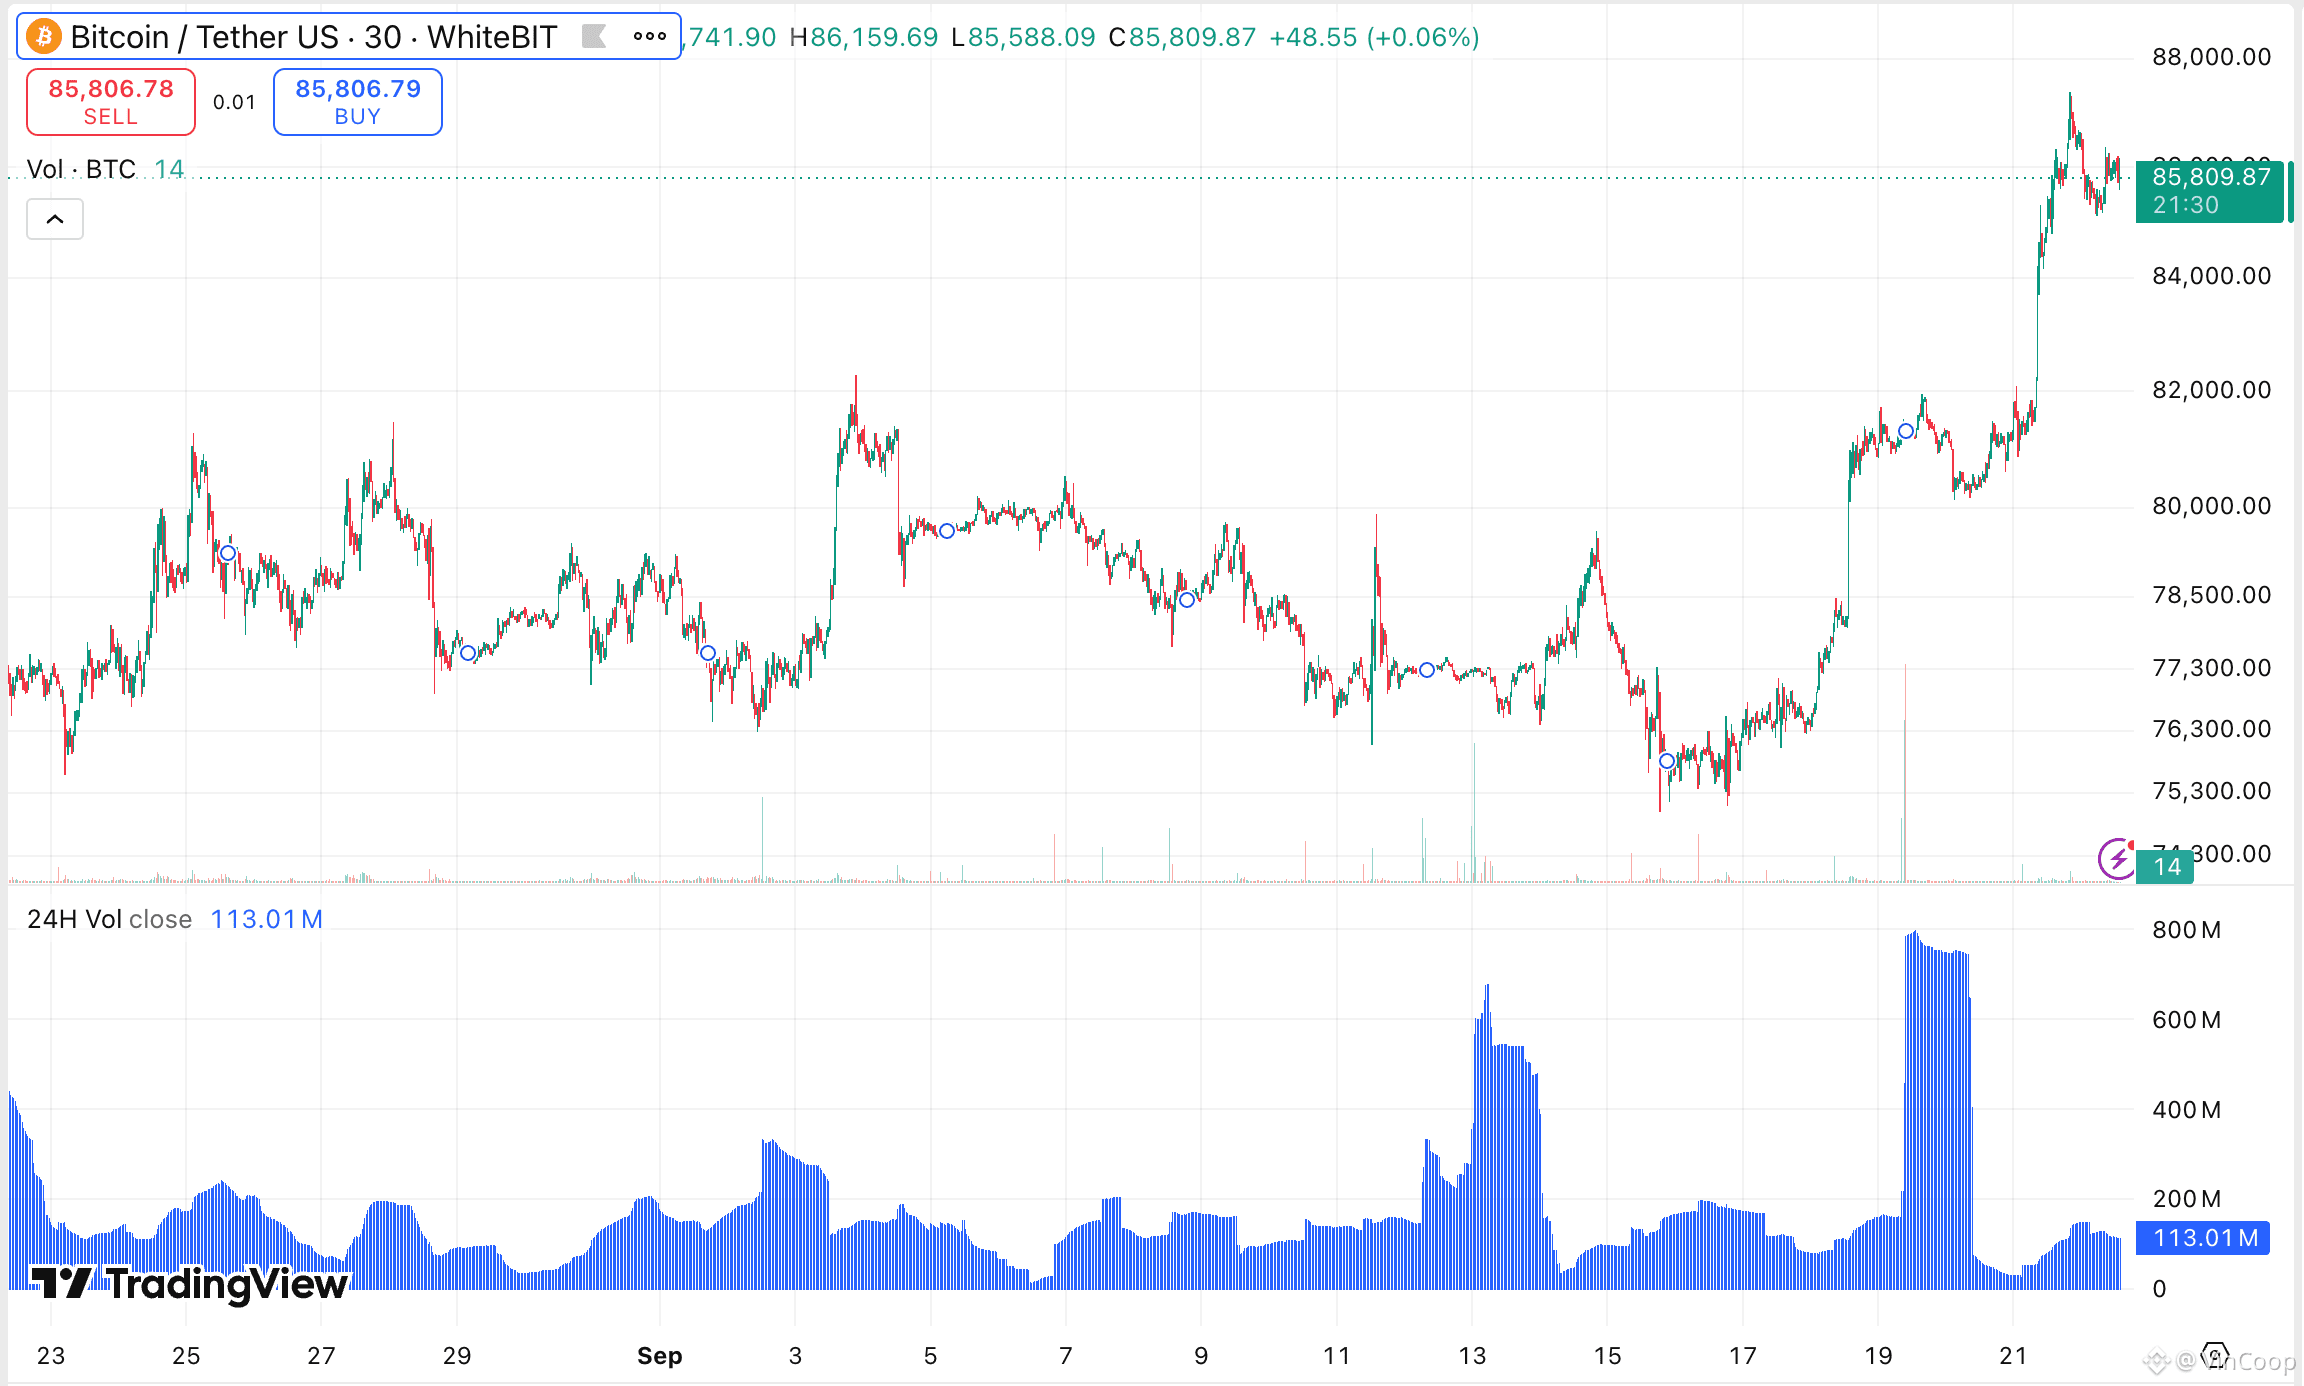
Bitcoin’s $300K Target Is Really a Power-Law Scenario $BTC is trading near the $82K–$86K resistance zone, while Fidelity’s Jurrien Timmer is looking much further out. His latest model maps a possible path toward $300K by 2029, based on Bitcoin’s long-term Power Law trend rather than a short-term price pattern. The model rests on two layers. First, Bitcoin defended the $57.7K–$60K area after falling more than 50% from its 2025 high of $126,251. Timmer treats $60K as the critical support that keeps the long-term structure intact. Second, weekly stochastic indicators have moved out of oversold territory, while the chart has formed what he describes as a double bottom. Long-term model: $300K by 2029 Near-term trigger: break above ~$82.5K Next psychological level: $100K Model invalidation risk: loss of the long-term support structure The important distinction is that $300K is not a near-term trading target. It is the output of a logarithmic model that Timmer uses to frame Bitcoin’s multi-year trend, including past drawdowns of 56% and 63%. So the immediate question is much smaller than $300K: whether Bitcoin can turn the $82K–$86K area from resistance into support. If it cannot, the long-term model remains just that, a model, not a confirmed path. #BTC Price Analysis# #BTC #Bitcoin
Bitcoin’s $300K Target Is Really a Power-Law Scenario $BTC is trading near the $82K–$86K resistance zone, while Fidelity’s Jurrien Timmer is looking much further out. His latest model maps a possible path toward $300K by 2029, based on Bitcoin’s long-term Power Law trend rather than a short-term price pattern. The model rests on two layers. First, Bitcoin defended the $57.7K–$60K area after falling more than 50% from its 2025 high of $126,251. Timmer treats $60K as the critical support that keeps the long-term structure intact. Second, weekly stochastic indicators have moved out of oversold territory, while the chart has formed what he describes as a double bottom. Long-term model: $300K by 2029 Near-term trigger: break above ~$82.5K Next psychological level: $100K Model invalidation risk: loss of the long-term support structure The important distinction is that $300K is not a near-term trading target. It is the output of a logarithmic model that Timmer uses to frame Bitcoin’s multi-year trend, including past drawdowns of 56% and 63%. So the immediate question is much smaller than $300K: whether Bitcoin can turn the $82K–$86K area from resistance into support. If it cannot, the long-term model remains just that, a model, not a confirmed path. #BTC Price Analysis# #BTC #Bitcoin

151
·
--
Moonclave’s Next Test Is Distribution, Not Price $BTC may still set the broader market tone, but smaller Solana-based projects are competing on a different metric: whether attention turns into repeat participation. Moonclave says its loyalty program has now passed 12,000 members, while a recent reactivation campaign generated 427,000+ impressions and added 4,400 followers. The community numbers moved quickly as well. Discord reportedly grew from roughly 4,000 to 10,000+ members, while participants received more than 76M EXP and a $10,000 prize pool through the project’s rewards system. What makes the next step worth watching is distribution. Moonclave says it is working toward a new exchange listing for $MCV, but the venue has not yet been disclosed or confirmed. That creates a simple progression: attention → community growth → product participation → broader token access The first three stages now have measurable numbers behind them. The exchange step is still pending, so the more useful signal will be whether wider access eventually translates into sustained use of Moonclave’s on-chain prediction market rather than just another short-term listing spike. #BTC Price Analysis# #Crypto #BTC Above 60K#
Moonclave’s Next Test Is Distribution, Not Price $BTC may still set the broader market tone, but smaller Solana-based projects are competing on a different metric: whether attention turns into repeat participation. Moonclave says its loyalty program has now passed 12,000 members, while a recent reactivation campaign generated 427,000+ impressions and added 4,400 followers. The community numbers moved quickly as well. Discord reportedly grew from roughly 4,000 to 10,000+ members, while participants received more than 76M EXP and a $10,000 prize pool through the project’s rewards system. What makes the next step worth watching is distribution. Moonclave says it is working toward a new exchange listing for $MCV, but the venue has not yet been disclosed or confirmed. That creates a simple progression: attention → community growth → product participation → broader token access The first three stages now have measurable numbers behind them. The exchange step is still pending, so the more useful signal will be whether wider access eventually translates into sustained use of Moonclave’s on-chain prediction market rather than just another short-term listing spike. #BTC Price Analysis# #Crypto #BTC Above 60K#

64
·
--
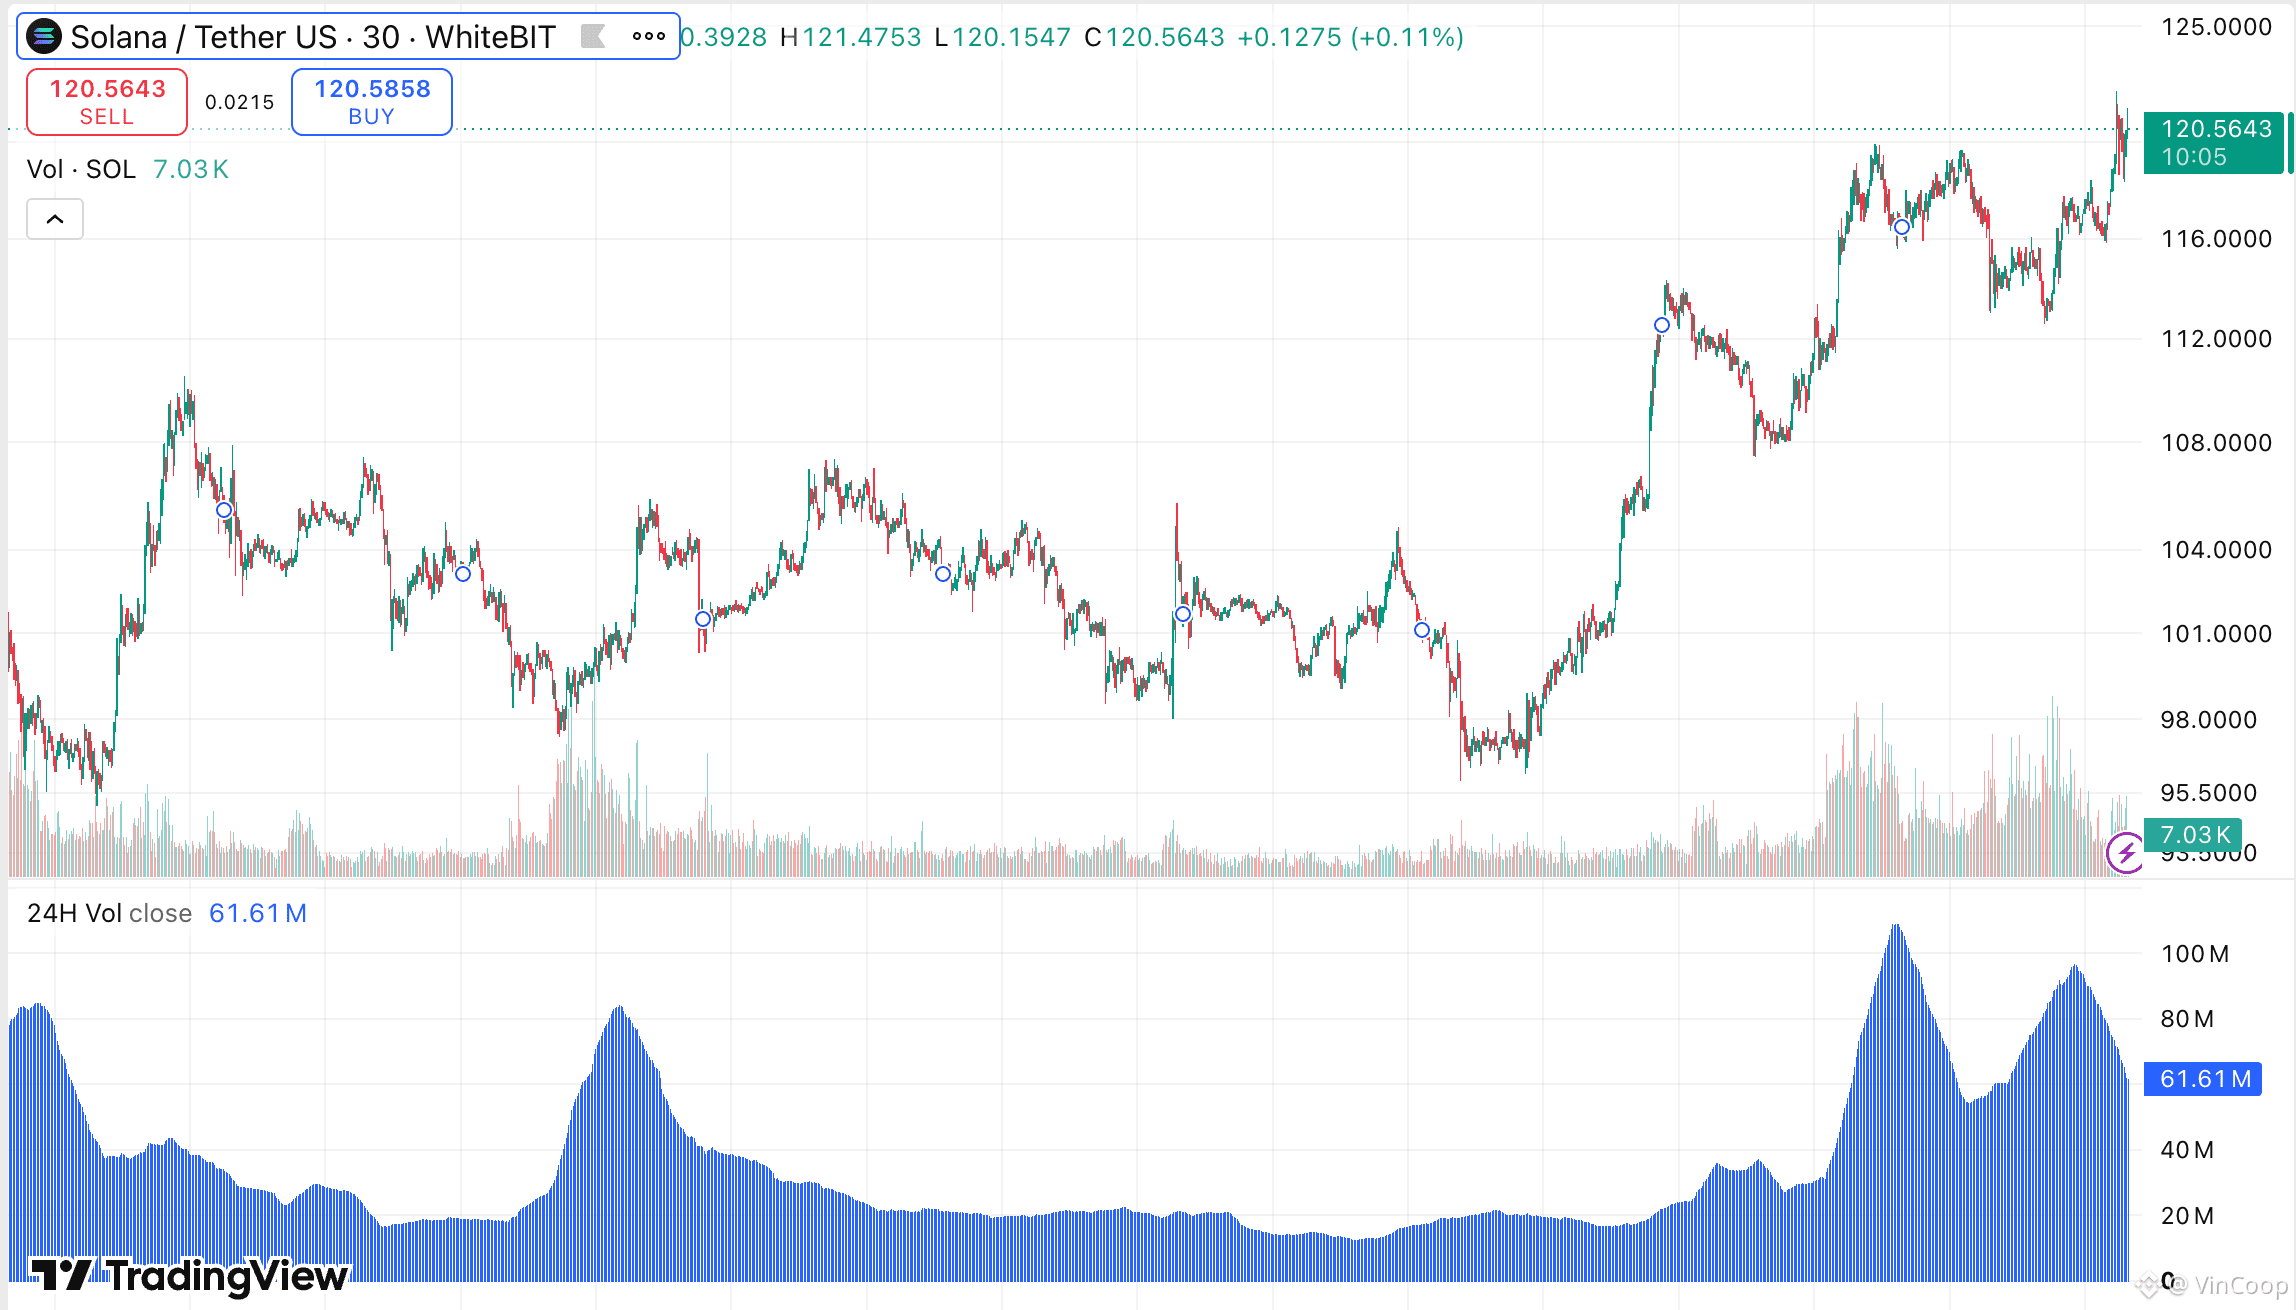
SOL Returns to $120 as Stablecoin Rules Move Forward $SOL is back near $120.5 after recovering from the $116 area, with the latest 30-minute chart putting the $121–122 zone back in focus. The move comes as the Federal Reserve opened public comment on two proposals implementing parts of the GENIUS Act. One would require Fed-supervised payment stablecoin issuers to fully back their tokens with permitted reserve assets and meet capital, custody and risk-management standards. The second sets out an application process for supervised banks that want to issue payment stablecoins. The proposals do not regulate or endorse Solana itself, so it would be misleading to treat them as a direct catalyst for SOL. For the chart, the simpler question is whether buyers can push through the recent $121–122 resistance area. A rejection would put the recent support around $116 back into view. Separately, WhiteBIT announced this month that its TradFi perpetual pairs are now available through its TradingView integration, adding instruments linked to traditional-market assets alongside its existing crypto markets. Disclaimer: This content is for informational purposes only and is not financial advice. TradFi pairs are derivative instruments that track traditional-market assets and do not provide ownership of the underlying assets. Availability may vary by jurisdiction. #Altcoin Season# #Solana #SOL
SOL Returns to $120 as Stablecoin Rules Move Forward $SOL is back near $120.5 after recovering from the $116 area, with the latest 30-minute chart putting the $121–122 zone back in focus. The move comes as the Federal Reserve opened public comment on two proposals implementing parts of the GENIUS Act. One would require Fed-supervised payment stablecoin issuers to fully back their tokens with permitted reserve assets and meet capital, custody and risk-management standards. The second sets out an application process for supervised banks that want to issue payment stablecoins. The proposals do not regulate or endorse Solana itself, so it would be misleading to treat them as a direct catalyst for SOL. For the chart, the simpler question is whether buyers can push through the recent $121–122 resistance area. A rejection would put the recent support around $116 back into view. Separately, WhiteBIT announced this month that its TradFi perpetual pairs are now available through its TradingView integration, adding instruments linked to traditional-market assets alongside its existing crypto markets. Disclaimer: This content is for informational purposes only and is not financial advice. TradFi pairs are derivative instruments that track traditional-market assets and do not provide ownership of the underlying assets. Availability may vary by jurisdiction. #Altcoin Season# #Solana #SOL
·
--
Bitcoin ETF Demand and Derivatives Traders Are Pulling in Opposite Directions $BTC spot ETFs added $190.65M on Thursday, extending their inflow streak to six consecutive sessions. Across those six days, total inflows reached about $2.84B, with BlackRock’s IBIT contributing $162.63M in the latest session. The cash market is therefore sending a clear signal: institutional ETF demand has returned. But derivatives traders are not confirming that optimism. ETF SIDE: 6 straight inflow days $190.65M latest inflow $108.92B in net BTC ETF assets DERIVATIVES SIDE: BTC open interest back near May levels $3B+ BTC OI on Hyperliquid alone Negative basis while OI rises That last combination matters. A negative basis alongside increasing open interest suggests new short positioning is being added rather than traders simply closing longs. So Bitcoin is currently caught between two different forms of conviction: ETFs are steadily accumulating exposure, while parts of the leveraged market are betting the rally will fade. The next move will show which side can absorb the other’s pressure first. #BTC Price Analysis# #Bitcoin #Bitcoin Price Prediction: What is Bitcoins next move?#
Bitcoin ETF Demand and Derivatives Traders Are Pulling in Opposite Directions $BTC spot ETFs added $190.65M on Thursday, extending their inflow streak to six consecutive sessions. Across those six days, total inflows reached about $2.84B, with BlackRock’s IBIT contributing $162.63M in the latest session. The cash market is therefore sending a clear signal: institutional ETF demand has returned. But derivatives traders are not confirming that optimism. ETF SIDE: 6 straight inflow days $190.65M latest inflow $108.92B in net BTC ETF assets DERIVATIVES SIDE: BTC open interest back near May levels $3B+ BTC OI on Hyperliquid alone Negative basis while OI rises That last combination matters. A negative basis alongside increasing open interest suggests new short positioning is being added rather than traders simply closing longs. So Bitcoin is currently caught between two different forms of conviction: ETFs are steadily accumulating exposure, while parts of the leveraged market are betting the rally will fade. The next move will show which side can absorb the other’s pressure first. #BTC Price Analysis# #Bitcoin #Bitcoin Price Prediction: What is Bitcoins next move?#

BTC+0,59%
IBITETF-0,58%
24
·
--
Cardano Is Days Away From Its First Major Golden Cross of 2026 $ADA is trading near $0.256, up 8% in 24 hours and 21% over the week, while its rising 50-day moving average approaches the 200-day MA. If the crossover completes, it would be Cardano’s first daily golden cross of 2026. The setup has already changed materially since Sept. 16. ADA rebounded from $0.19, moved above the 50-day MA near $0.206 and the 200-day MA around $0.214, and reached an intraday high of $0.258. From here, the chart leaves three distinct paths: Continuation: holding above the moving averages keeps $0.28 and $0.30 in view. False breakout: a drop back below the MAs would weaken the signal. Consolidation: the golden cross can complete without an immediate breakout, leaving ADA range-bound. That last point matters. A golden cross reflects improving medium-term trend structure, but it does not guarantee acceleration. Cardano’s previous one in August 2025 was followed by several months of lower highs rather than a sustained vertical move. #ADA #Ad #Cardano
Cardano Is Days Away From Its First Major Golden Cross of 2026 $ADA is trading near $0.256, up 8% in 24 hours and 21% over the week, while its rising 50-day moving average approaches the 200-day MA. If the crossover completes, it would be Cardano’s first daily golden cross of 2026. The setup has already changed materially since Sept. 16. ADA rebounded from $0.19, moved above the 50-day MA near $0.206 and the 200-day MA around $0.214, and reached an intraday high of $0.258. From here, the chart leaves three distinct paths: Continuation: holding above the moving averages keeps $0.28 and $0.30 in view. False breakout: a drop back below the MAs would weaken the signal. Consolidation: the golden cross can complete without an immediate breakout, leaving ADA range-bound. That last point matters. A golden cross reflects improving medium-term trend structure, but it does not guarantee acceleration. Cardano’s previous one in August 2025 was followed by several months of lower highs rather than a sustained vertical move. #ADA #Ad #Cardano

22
·
--
A Term Sheet Can Price the Relationship. It Can’t Test It. In market making, it’s easy to focus on $BTC spreads, fee tiers, and headline rebates. But those numbers still don’t show how a new venue will behave once a desk connects its own systems and starts trading. A one-month test period can look like extra waiting. Once trading is live, though, the desk can see how the integration works inside its existing stack, how orders fill at normal sizes, what the actual maker/taker mix looks like, and whether reporting and account structure work as expected. In my latest Medium article, I look at what a desk can learn during that first month, why those findings can affect the final terms, and how Kraken, WhiteBIT, and Bybit structure market-maker onboarding differently. 👉 Read the full article here: https://medium.com/@Vin_Coop/a-term-sheet-can-set-the-fees-it-cant-show-the-fill-behavior-5c1ac2d278e7?postPublishedType=initial Would you fix the terms upfront, or test the venue first? #BTC Price Analysis# #Bitcoin Price Prediction: What is Bitcoins next move?# #BTC #Ad
A Term Sheet Can Price the Relationship. It Can’t Test It. In market making, it’s easy to focus on $BTC spreads, fee tiers, and headline rebates. But those numbers still don’t show how a new venue will behave once a desk connects its own systems and starts trading. A one-month test period can look like extra waiting. Once trading is live, though, the desk can see how the integration works inside its existing stack, how orders fill at normal sizes, what the actual maker/taker mix looks like, and whether reporting and account structure work as expected. In my latest Medium article, I look at what a desk can learn during that first month, why those findings can affect the final terms, and how Kraken, WhiteBIT, and Bybit structure market-maker onboarding differently. 👉 Read the full article here: https://medium.com/@Vin_Coop/a-term-sheet-can-set-the-fees-it-cant-show-the-fill-behavior-5c1ac2d278e7?postPublishedType=initial Would you fix the terms upfront, or test the venue first? #BTC Price Analysis# #Bitcoin Price Prediction: What is Bitcoins next move?# #BTC #Ad

44
·
--
Solana Just Received Another $250M Block of USDC Liquidity $SOL is once again at the center of a major stablecoin issuance event: Circle’s authorized minting infrastructure created 250M USDC on Solana, adding a large new block of dollar-token supply to the network. The key distinction is what that mint actually means. 250M USDC minted does not mean $250M was immediately used to buy SOL or other crypto. Circle can issue USDC to manage liquidity, transfers, redemptions and inventory across supported chains. What is confirmed is simpler: Solana now has another quarter-billion dollars of USDC liquidity available for potential use across exchanges, payments and DeFi. That makes this more of a network liquidity signal than a price signal. The more important question is where those newly minted tokens move next - into trading venues, payment flows, DeFi protocols or back across chains. #Altcoin Season# #Solana #Ad #Macro Insights#
Solana Just Received Another $250M Block of USDC Liquidity $SOL is once again at the center of a major stablecoin issuance event: Circle’s authorized minting infrastructure created 250M USDC on Solana, adding a large new block of dollar-token supply to the network. The key distinction is what that mint actually means. 250M USDC minted does not mean $250M was immediately used to buy SOL or other crypto. Circle can issue USDC to manage liquidity, transfers, redemptions and inventory across supported chains. What is confirmed is simpler: Solana now has another quarter-billion dollars of USDC liquidity available for potential use across exchanges, payments and DeFi. That makes this more of a network liquidity signal than a price signal. The more important question is where those newly minted tokens move next - into trading venues, payment flows, DeFi protocols or back across chains. #Altcoin Season# #Solana #Ad #Macro Insights#

55
·
--
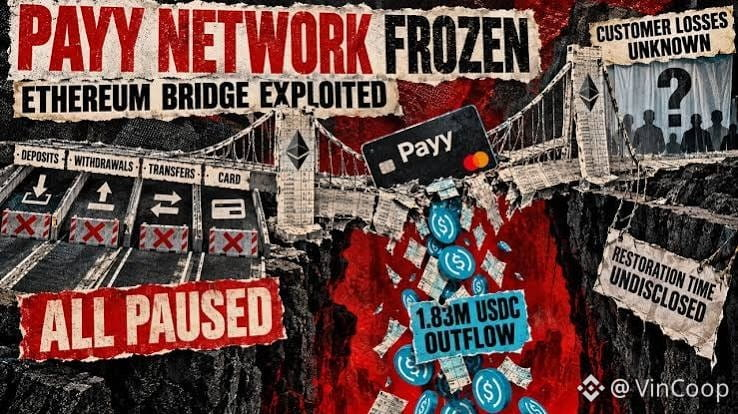
Payy’s $1.83M Bridge Exploit Became a Much Bigger Operational Problem $BTC was not involved in the attack, but the Payy incident shows a broader crypto-infrastructure risk: a relatively contained bridge exploit can freeze an entire payment experience. After about 1.83M USDC left Payy’s Ethereum bridge contract, the company paused deposits, withdrawals, transfers and even card payments. One exploited contract → four user functions stopped. That distinction matters more than the headline loss. The visible on-chain transfer was 1,832,149.4681 USDC, but Payy has not yet disclosed the total loss, the number of affected users or whether customer balances themselves were compromised. The immediate damage is therefore operational rather than fully quantified financial loss. Users cannot move stablecoins, withdraw funds or spend through the card until service resumes. For payment-focused crypto products, this is the real stress test: security incidents do not stay isolated to the bridge layer when the same infrastructure also sits underneath everyday spending. #BTC Price Analysis# #Bitcoin Price Prediction: What is Bitcoins next move?# #Ad #BTC
Payy’s $1.83M Bridge Exploit Became a Much Bigger Operational Problem $BTC was not involved in the attack, but the Payy incident shows a broader crypto-infrastructure risk: a relatively contained bridge exploit can freeze an entire payment experience. After about 1.83M USDC left Payy’s Ethereum bridge contract, the company paused deposits, withdrawals, transfers and even card payments. One exploited contract → four user functions stopped. That distinction matters more than the headline loss. The visible on-chain transfer was 1,832,149.4681 USDC, but Payy has not yet disclosed the total loss, the number of affected users or whether customer balances themselves were compromised. The immediate damage is therefore operational rather than fully quantified financial loss. Users cannot move stablecoins, withdraw funds or spend through the card until service resumes. For payment-focused crypto products, this is the real stress test: security incidents do not stay isolated to the bridge layer when the same infrastructure also sits underneath everyday spending. #BTC Price Analysis# #Bitcoin Price Prediction: What is Bitcoins next move?# #Ad #BTC
58
·
--
Bitcoin’s Maturity May Be Showing Up as Smaller Extremes $BTC may be entering a different kind of cycle. CryptoQuant founder Ki Young Ju argues that another 10x rally is unlikely, with a 3–5x move more plausible — but he pairs that with an equally important idea: future bear markets may also become less destructive. OLD CYCLE: smaller market → more retail speculation → explosive rallies → crashes approaching 80%. CURRENT CYCLE: larger market → more institutional ownership → less extreme upside → potentially shallower drawdowns. Ju points to on-chain data behind that shift. Bitcoin’s MVRV never fell below 1 during this cycle, meaning holders in aggregate never dropped below their average on-chain cost basis. Realized cap is also rising, long-term whales have reduced selling, and large futures traders reportedly opened longs near recent lows. The thesis therefore is not that Bitcoin has stopped offering upside. It is that the risk/reward profile may be changing: fewer extreme multiples, but also less dependence on violent boom-and-bust resets. Three signals would help test that idea from here: MVRV staying above 1, realized cap continuing to rise, and large holders avoiding renewed distribution. #BTC Price Analysis# #Altcoin Season# #BTC
Bitcoin’s Maturity May Be Showing Up as Smaller Extremes $BTC may be entering a different kind of cycle. CryptoQuant founder Ki Young Ju argues that another 10x rally is unlikely, with a 3–5x move more plausible — but he pairs that with an equally important idea: future bear markets may also become less destructive. OLD CYCLE: smaller market → more retail speculation → explosive rallies → crashes approaching 80%. CURRENT CYCLE: larger market → more institutional ownership → less extreme upside → potentially shallower drawdowns. Ju points to on-chain data behind that shift. Bitcoin’s MVRV never fell below 1 during this cycle, meaning holders in aggregate never dropped below their average on-chain cost basis. Realized cap is also rising, long-term whales have reduced selling, and large futures traders reportedly opened longs near recent lows. The thesis therefore is not that Bitcoin has stopped offering upside. It is that the risk/reward profile may be changing: fewer extreme multiples, but also less dependence on violent boom-and-bust resets. Three signals would help test that idea from here: MVRV staying above 1, realized cap continuing to rise, and large holders avoiding renewed distribution. #BTC Price Analysis# #Altcoin Season# #BTC

60
·
--
X Is Turning Cashtags Into a Trading Funnel $BTC , $SOL and other supported assets can now sit one click away from a brokerage inside X. The platform’s new U.S. Cashtag Partner Program adds a “Trade” option to asset pages, sending users from price charts and financial conversations directly to participating brokers. The important change is the distance between attention and execution. Before: post → search asset → open exchange → find market → trade Now: post → Cashtag → Trade → brokerage X itself does not execute orders. Users still leave the platform, sign in to a supported brokerage and complete the transaction there. Initial partners include Interactive Brokers, Moomoo, Gemini, Kraken and Coinbase, while available assets differ by provider. That means this is not yet native social trading. KYC, funded brokerage accounts and separate execution infrastructure remain necessary. But shortening the path from narrative to transaction could make market attention convert into trading activity faster — while also increasing the importance of misinformation, coordinated promotion and manipulation risks on financial social media. #Altcoin Season# #BTC Price Analysis# #Solana #Bitcoin Price Prediction: What is Bitcoins next move?#
X Is Turning Cashtags Into a Trading Funnel $BTC , $SOL and other supported assets can now sit one click away from a brokerage inside X. The platform’s new U.S. Cashtag Partner Program adds a “Trade” option to asset pages, sending users from price charts and financial conversations directly to participating brokers. The important change is the distance between attention and execution. Before: post → search asset → open exchange → find market → trade Now: post → Cashtag → Trade → brokerage X itself does not execute orders. Users still leave the platform, sign in to a supported brokerage and complete the transaction there. Initial partners include Interactive Brokers, Moomoo, Gemini, Kraken and Coinbase, while available assets differ by provider. That means this is not yet native social trading. KYC, funded brokerage accounts and separate execution infrastructure remain necessary. But shortening the path from narrative to transaction could make market attention convert into trading activity faster — while also increasing the importance of misinformation, coordinated promotion and manipulation risks on financial social media. #Altcoin Season# #BTC Price Analysis# #Solana #Bitcoin Price Prediction: What is Bitcoins next move?#

66
·
--
Bitcoin-Backed Lending Is Getting a Fixed-Rate Layer $BTC holders on Coinbase can now borrow USDC without accepting a floating interest rate. The new product uses Morpho Midnight on Base, with both the rate and repayment date fixed when the loan opens — a different structure from Coinbase’s existing variable-rate Morpho Blue loans. That difference changes what the borrower has to manage. With a variable loan, the cost of borrowing can move with market demand. A fixed-term structure removes that uncertainty, although the Bitcoin collateral itself still fluctuates in value. Coinbase’s existing crypto-backed lending business already has $1.4B+ in active loans backed by roughly $3B in collateral. The wider Bitcoin-backed credit market is estimated at around $16B, while a 2026 survey of 1,244 crypto holders in the U.S. and Australia found 88% would consider using crypto-backed credit. The important shift is not simply another loan product. Bitcoin is increasingly being used as collateral for structured credit rather than sold to raise liquidity — and fixed-rate products make that borrowing model look more like conventional lending while keeping the settlement and collateral infrastructure on-chain. #BTC Price Analysis# #BTC #Ad #Coinbase
Bitcoin-Backed Lending Is Getting a Fixed-Rate Layer $BTC holders on Coinbase can now borrow USDC without accepting a floating interest rate. The new product uses Morpho Midnight on Base, with both the rate and repayment date fixed when the loan opens — a different structure from Coinbase’s existing variable-rate Morpho Blue loans. That difference changes what the borrower has to manage. With a variable loan, the cost of borrowing can move with market demand. A fixed-term structure removes that uncertainty, although the Bitcoin collateral itself still fluctuates in value. Coinbase’s existing crypto-backed lending business already has $1.4B+ in active loans backed by roughly $3B in collateral. The wider Bitcoin-backed credit market is estimated at around $16B, while a 2026 survey of 1,244 crypto holders in the U.S. and Australia found 88% would consider using crypto-backed credit. The important shift is not simply another loan product. Bitcoin is increasingly being used as collateral for structured credit rather than sold to raise liquidity — and fixed-rate products make that borrowing model look more like conventional lending while keeping the settlement and collateral infrastructure on-chain. #BTC Price Analysis# #BTC #Ad #Coinbase
·
--
54% of Sampled BTC Perp Volume Came From Two Trade Sizes $BTC perpetual activity on Kalshi showed a concentrated pattern in CoinDesk’s September 17–20 sample. Trades around $2,500 and $5,000 accounted for 54% of the $8.5M in Bitcoin perpetual value analyzed. ETH showed a similar pattern. Trades near $5,499 represented 57% of the $13.5M sampled. CoinDesk said the recurring dollar amounts were consistent with automated fixed-size execution, but the public data does not identify the traders or establish misconduct. The numbers show why the composition of volume matters alongside the headline figure: repeated trade sizes can account for a significant share of sampled activity. In a separate update, WhiteBIT announced on September 11 that its TradFi perpetual pairs are now available through its TradingView integration. These contracts track price movements of traditional-market assets without providing ownership of the underlying assets. Disclaimer: This content is for informational purposes only and does not constitute financial advice. TradFi pairs are futures instruments linked to traditional-market assets and do not provide ownership of the underlying assets. Availability through TradingView is limited to supported jurisdictions. #BTC Price Analysis# #Bitcoin #Ad #Bitcoin Price Prediction: What is Bitcoins next move?#
54% of Sampled BTC Perp Volume Came From Two Trade Sizes $BTC perpetual activity on Kalshi showed a concentrated pattern in CoinDesk’s September 17–20 sample. Trades around $2,500 and $5,000 accounted for 54% of the $8.5M in Bitcoin perpetual value analyzed. ETH showed a similar pattern. Trades near $5,499 represented 57% of the $13.5M sampled. CoinDesk said the recurring dollar amounts were consistent with automated fixed-size execution, but the public data does not identify the traders or establish misconduct. The numbers show why the composition of volume matters alongside the headline figure: repeated trade sizes can account for a significant share of sampled activity. In a separate update, WhiteBIT announced on September 11 that its TradFi perpetual pairs are now available through its TradingView integration. These contracts track price movements of traditional-market assets without providing ownership of the underlying assets. Disclaimer: This content is for informational purposes only and does not constitute financial advice. TradFi pairs are futures instruments linked to traditional-market assets and do not provide ownership of the underlying assets. Availability through TradingView is limited to supported jurisdictions. #BTC Price Analysis# #Bitcoin #Ad #Bitcoin Price Prediction: What is Bitcoins next move?#
34
·
--
Ethereum’s Rally Is Being Built on Two Different Markets $BTC may still set the broader direction, but $ETH is building its own setup near $2,776 after gaining roughly 11% in September and 74.6% in Q3 so far. What makes the move interesting is that leverage and spot demand are rising at the same time. DERIVATIVES: ETH open interest has climbed above $16B across exchanges, including about $6.8B on Binance — levels not seen there since January. Traders have repeatedly rebuilt positions after liquidation events, while Binance carries an unusually large share of short positioning. That adds volatility, but the current data does not show a clear short-squeeze setup above $2,800. SPOT: Exchange reserves have fallen to about 14.8M ETH, with only 3.8M on Binance. Bitmine has resumed treasury buying and reportedly holds 4.9% of ETH supply, while one Hyperliquid whale recently sold 1,107 BTC, bought spot ETH and then staked it. So ETH is not relying on leverage alone. Derivatives show traders increasing directional exposure, while shrinking exchange balances and large spot purchases point to simultaneous demand for the underlying asset. The immediate pressure zone sits around $2,800, while long positioning is concentrated around $2,600–$2,700. That leaves Ethereum between two forces: growing participation above and a meaningful pool of leveraged risk below. #BTC Price Analysis# #Ethereum #ETH #BTC
Ethereum’s Rally Is Being Built on Two Different Markets $BTC may still set the broader direction, but $ETH is building its own setup near $2,776 after gaining roughly 11% in September and 74.6% in Q3 so far. What makes the move interesting is that leverage and spot demand are rising at the same time. DERIVATIVES: ETH open interest has climbed above $16B across exchanges, including about $6.8B on Binance — levels not seen there since January. Traders have repeatedly rebuilt positions after liquidation events, while Binance carries an unusually large share of short positioning. That adds volatility, but the current data does not show a clear short-squeeze setup above $2,800. SPOT: Exchange reserves have fallen to about 14.8M ETH, with only 3.8M on Binance. Bitmine has resumed treasury buying and reportedly holds 4.9% of ETH supply, while one Hyperliquid whale recently sold 1,107 BTC, bought spot ETH and then staked it. So ETH is not relying on leverage alone. Derivatives show traders increasing directional exposure, while shrinking exchange balances and large spot purchases point to simultaneous demand for the underlying asset. The immediate pressure zone sits around $2,800, while long positioning is concentrated around $2,600–$2,700. That leaves Ethereum between two forces: growing participation above and a meaningful pool of leveraged risk below. #BTC Price Analysis# #Ethereum #ETH #BTC

41
·
--
XRP’s $5.40 Chart Target Starts With a Much Smaller Test $BTC options are pricing roughly a 5.0% move through Sept. 27, while $XRP sits much higher at 8.9% after an 8.7% daily rally to $1.54. Against that short-term volatility, veteran trader Peter Brandt has published a much longer-term XRP chart pointing to an eventual $5.40 - about 251% above $1.54. Brandt explicitly separated the chart from a trade recommendation. The projection comes from a multi-year monthly structure in which XRP broke above descending resistance, later traded above $3, and then entered a prolonged correction. The immediate gap is much smaller than $5.40. XRP is now around $1.49–$1.54, still below its 18-month moving average near $1.88. Any long-term continuation would first require recovering that lost area rather than jumping directly toward the headline target. Meanwhile, XRP’s near-term volatility is already elevated: XRP: 8.9% implied move SOL: 8.0% ETH: 6.9% BTC: 5.0% So Brandt’s chart is best read as a long-horizon structure, while the current market is still dealing with a much nearer question: whether XRP can turn its latest 8.7% rebound into a sustained recovery above the $1.88 zone. #BTC Price Analysis# #Ripple #XRP #Ad
XRP’s $5.40 Chart Target Starts With a Much Smaller Test $BTC options are pricing roughly a 5.0% move through Sept. 27, while $XRP sits much higher at 8.9% after an 8.7% daily rally to $1.54. Against that short-term volatility, veteran trader Peter Brandt has published a much longer-term XRP chart pointing to an eventual $5.40 - about 251% above $1.54. Brandt explicitly separated the chart from a trade recommendation. The projection comes from a multi-year monthly structure in which XRP broke above descending resistance, later traded above $3, and then entered a prolonged correction. The immediate gap is much smaller than $5.40. XRP is now around $1.49–$1.54, still below its 18-month moving average near $1.88. Any long-term continuation would first require recovering that lost area rather than jumping directly toward the headline target. Meanwhile, XRP’s near-term volatility is already elevated: XRP: 8.9% implied move SOL: 8.0% ETH: 6.9% BTC: 5.0% So Brandt’s chart is best read as a long-horizon structure, while the current market is still dealing with a much nearer question: whether XRP can turn its latest 8.7% rebound into a sustained recovery above the $1.88 zone. #BTC Price Analysis# #Ripple #XRP #Ad
67
·
--
The Same $1 of Volume Can Carry a Different Score Trading volume is usually treated as one number. Crypto.com Market Maker Programme adds another variable: which instrument generated it. Its Market Maker API uses instrument-specific volume multipliers when calculating programme scores. The Altcoin Score is calculated as Altcoin Volume × Instrument Volume Multiplier, meaning the same amount of qualifying volume can carry a different weight depending on the instrument. For market makers, the API exposes the data behind that calculation: 30-day total trading volume, share of the Exchange’s 30-day volume, altcoin volume, altcoin volume share, and the resulting altcoin score. Instrument-level rolling $BTC volume and overall volume-percentage metrics are updated hourly. https://crypto.com/exchange/mm-programme?utm_source=coinmarketcap&utm_medium=mmpr_vinc&utm_campaign=post The multiplier itself is available through a public Market Maker API endpoint, giving desks visibility into how individual instruments are weighted rather than treating every pair identically in programme calculations. On the execution side, Crypto com supports REST, WebSocket and FIX. Its FIX implementation is based on FIX 4.4, with separate connections for order management, drop copy, and market data through AWS PrivateLink. What the public documentation does not fully show is how these scores translate into the commercial terms offered to a specific desk. The scoring mechanics are visible, but a complete current schedule linking individual scores to rebates or other programme economics is not publicly disclosed. So volume alone does not describe the whole setup. On Crypto com, where that volume is generated can also change how it is counted inside the Market Maker Programme. Disclaimer: This is not financial or investment advice. DYOR before making any decisions. Use at your own risk. #BTC Price Analysis# #Crypto #Bitcoin Price Prediction: What is Bitcoins next move?#
The Same $1 of Volume Can Carry a Different Score Trading volume is usually treated as one number. Crypto.com Market Maker Programme adds another variable: which instrument generated it. Its Market Maker API uses instrument-specific volume multipliers when calculating programme scores. The Altcoin Score is calculated as Altcoin Volume × Instrument Volume Multiplier, meaning the same amount of qualifying volume can carry a different weight depending on the instrument. For market makers, the API exposes the data behind that calculation: 30-day total trading volume, share of the Exchange’s 30-day volume, altcoin volume, altcoin volume share, and the resulting altcoin score. Instrument-level rolling $BTC volume and overall volume-percentage metrics are updated hourly. https://crypto.com/exchange/mm-programme?utm_source=coinmarketcap&utm_medium=mmpr_vinc&utm_campaign=post The multiplier itself is available through a public Market Maker API endpoint, giving desks visibility into how individual instruments are weighted rather than treating every pair identically in programme calculations. On the execution side, Crypto com supports REST, WebSocket and FIX. Its FIX implementation is based on FIX 4.4, with separate connections for order management, drop copy, and market data through AWS PrivateLink. What the public documentation does not fully show is how these scores translate into the commercial terms offered to a specific desk. The scoring mechanics are visible, but a complete current schedule linking individual scores to rebates or other programme economics is not publicly disclosed. So volume alone does not describe the whole setup. On Crypto com, where that volume is generated can also change how it is counted inside the Market Maker Programme. Disclaimer: This is not financial or investment advice. DYOR before making any decisions. Use at your own risk. #BTC Price Analysis# #Crypto #Bitcoin Price Prediction: What is Bitcoins next move?#

3
·
--
Cardano Just Added a Payment Rail for AI Agents While $BTC dominates market attention, $ADA just gained a very different kind of utility: Cardano is now part of the official x402 SDK, allowing apps and AI agents to pay for API calls using ADA or Cardano Native Tokens directly over a web request. The interesting part is what disappears from the payment flow. There is no account, no API key and no checkout page. A service already using x402 can enable Cardano, while the payment happens as part of the HTTP request itself. That changes the model from: user opens app → creates account → enters payment details → checks out to: software requests service → payment is attached → service responds Cardano’s integration is also beyond a written specification. The source says client, server, facilitator and end-to-end examples have already been merged into the x402 repository. The Cardano Foundation joined the Linux Foundation-led x402 initiative in July, alongside participants including Visa, Mastercard, Stripe, Google and AWS. For ADA, the significance is not simply another place where the token can be “accepted.” It is access to a machine-to-machine payment standard designed for software that needs to buy services autonomously - potentially turning ADA and native Cardano tokens into settlement assets inside the emerging agent economy. #ADA #Cardano #Altcoin Season#
Cardano Just Added a Payment Rail for AI Agents While $BTC dominates market attention, $ADA just gained a very different kind of utility: Cardano is now part of the official x402 SDK, allowing apps and AI agents to pay for API calls using ADA or Cardano Native Tokens directly over a web request. The interesting part is what disappears from the payment flow. There is no account, no API key and no checkout page. A service already using x402 can enable Cardano, while the payment happens as part of the HTTP request itself. That changes the model from: user opens app → creates account → enters payment details → checks out to: software requests service → payment is attached → service responds Cardano’s integration is also beyond a written specification. The source says client, server, facilitator and end-to-end examples have already been merged into the x402 repository. The Cardano Foundation joined the Linux Foundation-led x402 initiative in July, alongside participants including Visa, Mastercard, Stripe, Google and AWS. For ADA, the significance is not simply another place where the token can be “accepted.” It is access to a machine-to-machine payment standard designed for software that needs to buy services autonomously - potentially turning ADA and native Cardano tokens into settlement assets inside the emerging agent economy. #ADA #Cardano #Altcoin Season#

52
·
--
Bitcoin’s Break Above $82.8K Was Accelerated by a Short Squeeze $BTC pushed through its May swing high near $82,800 and reached $84,257, but the speed of the move is almost as important as the breakout itself. In a single hour, Bitcoin recorded $218.58M in liquidations and $212.78M, or 97.3%, were shorts. That one hour accounted for roughly 79% of all BTC liquidations over the previous 24 hours. The sequence was straightforward: buying pushed Bitcoin into resistance, leveraged shorts became vulnerable, forced closures required additional buying, and that added fuel as price moved above $82.8K. The liquidation data explains the acceleration, not the original demand. Once those forced buyers disappear, Bitcoin has to prove the higher range can hold on ordinary market demand. $84,257 — breakout high $82,800 — former May resistance, now the key retest $80,000 — first major level back in focus if the breakout fails $77.9K–$78.5K — moving-average support cluster below With four-hour RSI near 80, momentum is already stretched. A hold above $82.8K would turn the breakout into a stronger structural move; a quick loss of that level would show how much of the surge depended on the squeeze itself. #BTC Price Analysis# #Bitcoin Price Prediction: What is Bitcoins next move?# #Bitcoin
Bitcoin’s Break Above $82.8K Was Accelerated by a Short Squeeze $BTC pushed through its May swing high near $82,800 and reached $84,257, but the speed of the move is almost as important as the breakout itself. In a single hour, Bitcoin recorded $218.58M in liquidations and $212.78M, or 97.3%, were shorts. That one hour accounted for roughly 79% of all BTC liquidations over the previous 24 hours. The sequence was straightforward: buying pushed Bitcoin into resistance, leveraged shorts became vulnerable, forced closures required additional buying, and that added fuel as price moved above $82.8K. The liquidation data explains the acceleration, not the original demand. Once those forced buyers disappear, Bitcoin has to prove the higher range can hold on ordinary market demand. $84,257 — breakout high $82,800 — former May resistance, now the key retest $80,000 — first major level back in focus if the breakout fails $77.9K–$78.5K — moving-average support cluster below With four-hour RSI near 80, momentum is already stretched. A hold above $82.8K would turn the breakout into a stronger structural move; a quick loss of that level would show how much of the surge depended on the squeeze itself. #BTC Price Analysis# #Bitcoin Price Prediction: What is Bitcoins next move?# #Bitcoin

44
·
--
What Actually Happens After You Press “Sell”? Once $BTC is sold, the visible crypto step is over, but the withdrawal is only halfway through. What follows happens across systems users rarely see: fiat instructions, banking rails, settlement windows, and recipient-bank processing. Engineers often reduce an off-ramp to “sell crypto, send fiat.” In practice, those are only the beginning and the end of a longer chain. 1. Execution. The sell needs enough liquidity at the actual order size. 2. Fiat instruction. Beneficiary details have to reach the banking layer correctly. 3. Banking rail. Cut-off times and settlement windows determine when the transfer moves. 4. Recipient bank. The receiving bank can apply its own processing or hold logic after the transfer arrives. This is why a withdrawal can look “stuck” even when the crypto side has already worked. The asset is sold, but the fiat is still moving through systems the user cannot see. One way to reduce uncertainty in that middle section is to standardize the fiat leg. WhiteBIT On/Off-Ramp is one example: EUR withdrawals can move through SEPA, with a €5 fixed fee and individual limits of up to €100,000 per operation. https://institutional.whitebit.com/payments-for-businesses?utm_source=coinmarketcap&utm_medium=ofonrramp_vinc&utm_campaign=post The final bank still sits outside that rail. Its own checks and processing can add time after the transfer reaches the recipient side. So off-ramp performance is not only about how fast crypto sells. What matters is understanding every handoff between execution and usable fiat and knowing which parts of that chain remain outside the platform’s control. Disclaimer: This is not financial or investment advice. Do your own research before making any decisions. Use at your own risk. #BTC Price Analysis# #Bitcoin Price Prediction: What is Bitcoins next move?# #Ad #BTC
What Actually Happens After You Press “Sell”? Once $BTC is sold, the visible crypto step is over, but the withdrawal is only halfway through. What follows happens across systems users rarely see: fiat instructions, banking rails, settlement windows, and recipient-bank processing. Engineers often reduce an off-ramp to “sell crypto, send fiat.” In practice, those are only the beginning and the end of a longer chain. 1. Execution. The sell needs enough liquidity at the actual order size. 2. Fiat instruction. Beneficiary details have to reach the banking layer correctly. 3. Banking rail. Cut-off times and settlement windows determine when the transfer moves. 4. Recipient bank. The receiving bank can apply its own processing or hold logic after the transfer arrives. This is why a withdrawal can look “stuck” even when the crypto side has already worked. The asset is sold, but the fiat is still moving through systems the user cannot see. One way to reduce uncertainty in that middle section is to standardize the fiat leg. WhiteBIT On/Off-Ramp is one example: EUR withdrawals can move through SEPA, with a €5 fixed fee and individual limits of up to €100,000 per operation. https://institutional.whitebit.com/payments-for-businesses?utm_source=coinmarketcap&utm_medium=ofonrramp_vinc&utm_campaign=post The final bank still sits outside that rail. Its own checks and processing can add time after the transfer reaches the recipient side. So off-ramp performance is not only about how fast crypto sells. What matters is understanding every handoff between execution and usable fiat and knowing which parts of that chain remain outside the platform’s control. Disclaimer: This is not financial or investment advice. Do your own research before making any decisions. Use at your own risk. #BTC Price Analysis# #Bitcoin Price Prediction: What is Bitcoins next move?# #Ad #BTC

3
Connectez-vous pour découvrir plus de contenu
Rejoignez la communauté mondiale des adeptes de cryptomonnaies sur Binance Square
⚡️ Suviez les dernières informations importantes sur les cryptomonnaies.
💬 Jugé digne de confiance par la plus grande plateforme d’échange de cryptomonnaies au monde.
👍 Découvrez les connaissances que partagent les créateurs vérifiés.
Adresse e-mail/Nº de téléphone
Sujets d’actualité
TrumpRejectsIranHormuzReopening
1,104 vues
104 mentions
TRUMP JUST KILLED THE HORMUZ RELIEF TRADE. 🚨
Iran offered a 7-day path to reopen the Strait of Hormuz if Washington eased military pressure and lifted its blockade. For oil markets, that was the cleanest bearish catalyst on the table.
Then Trump rejected Iran’s ceasefire terms.
The two sides are still far apart, and Washington has shown little urgency to return to the June framework.
That puts the market right back into the risk-premium trade:
Hormuz stays constrained → oil supply risk stays elevated.
Diplomacy fails → $CL and $BZ can reprice higher fast.
Any renewed strikes → volatility explodes again.
The Strait carried roughly one-fifth of global oil and LNG shipments before the war, so this isn’t just another geopolitical headline.
The market sold oil on hope.
Trump just removed a big piece of that hope. 👀
$CL $BZ #TrumpRejectsIranHormuzReopening #CircleTetherFreezeBitgetHackerWallet
KimHotbae
·1 mentions J’aime
·190 vues
CircleTetherFreezeBitgetHackerWallet
24,488 vues
335 mentions
SECSaysTokenBuybacksNotAutoSecurities
5,457 vues
133 mentions