

Bluechip
8.7k Publications

Bluechip
 Compte Square Vérifié+
Signaler
Bloquer l’utilisateur
Trade régulièrement
5.6 an(s)
24 Suivis
67.7K+ Abonnés
94.6K+ J’aime
Publications
Tous
Citations
Vidéos
Direct
PINNED
·
--
Haussier
🚨 THE ALPHA BOARD – FOUNDERS ACCESS 🚨
After multiple requests from some followers, I’ve decided to open something private.
What I share publicly is only a fraction of the full picture.
The market is a game of liquidity, timing, and understanding.
Most people always arrive… too late.
Today, I’m officially opening The Alpha Board, a private group built for those who want to see the move before it happens, not after.
Inside, you’ll get:
• Advanced market analysis ($BTC , Stocks, macro)
• Key liquidity zones & forward scenarios
• Smart money flow breakdowns
• Clear market structure insights
• Direct access + a serious community
This is NOT a signals group.
This is where you build a real edge.
If you’re tired of:
- following the crowd
- entering too late
- not understanding why the market moves
Then this is exactly for you.
Founder one-time access: $39
Limited spots available
Scan the QR code or click on the link to join instantly
This post will be auto-deleted in 15 days
The market doesn’t reward the fastest.
It rewards the most prepared.
[The Alpha Board link](https://app.binance.com/uni-qr/group-chat-landing?channelToken=uxZ207Vrh6cPhZPhAovsaQ&type=1&entrySource=sharing_link)
#BTC #crypto #trading #smartmoney #BinanceSquare
🚨 THE ALPHA BOARD – FOUNDERS ACCESS 🚨
After multiple requests from some followers, I’ve decided to open something private.
What I share publicly is only a fraction of the full picture.
The market is a game of liquidity, timing, and understanding.
Most people always arrive… too late.
Today, I’m officially opening The Alpha Board, a private group built for those who want to see the move before it happens, not after.
Inside, you’ll get:
• Advanced market analysis ($BTC , Stocks, macro)
• Key liquidity zones & forward scenarios
• Smart money flow breakdowns
• Clear market structure insights
• Direct access + a serious community
This is NOT a signals group.
This is where you build a real edge.
If you’re tired of:
- following the crowd
- entering too late
- not understanding why the market moves
Then this is exactly for you.
Founder one-time access: $39
Limited spots available
Scan the QR code or click on the link to join instantly
This post will be auto-deleted in 15 days
The market doesn’t reward the fastest.
It rewards the most prepared.
The Alpha Board link
#BTC #crypto #trading #smartmoney #BinanceSquare
After multiple requests from some followers, I’ve decided to open something private.
What I share publicly is only a fraction of the full picture.
The market is a game of liquidity, timing, and understanding.
Most people always arrive… too late.
Today, I’m officially opening The Alpha Board, a private group built for those who want to see the move before it happens, not after.
Inside, you’ll get:
• Advanced market analysis ($BTC , Stocks, macro)
• Key liquidity zones & forward scenarios
• Smart money flow breakdowns
• Clear market structure insights
• Direct access + a serious community
This is NOT a signals group.
This is where you build a real edge.
If you’re tired of:
- following the crowd
- entering too late
- not understanding why the market moves
Then this is exactly for you.
Founder one-time access: $39
Limited spots available
Scan the QR code or click on the link to join instantly
This post will be auto-deleted in 15 days
The market doesn’t reward the fastest.
It rewards the most prepared.
The Alpha Board link
#BTC #crypto #trading #smartmoney #BinanceSquare
64
30
2.8k
PINNED
·
--
$BTC squiggles
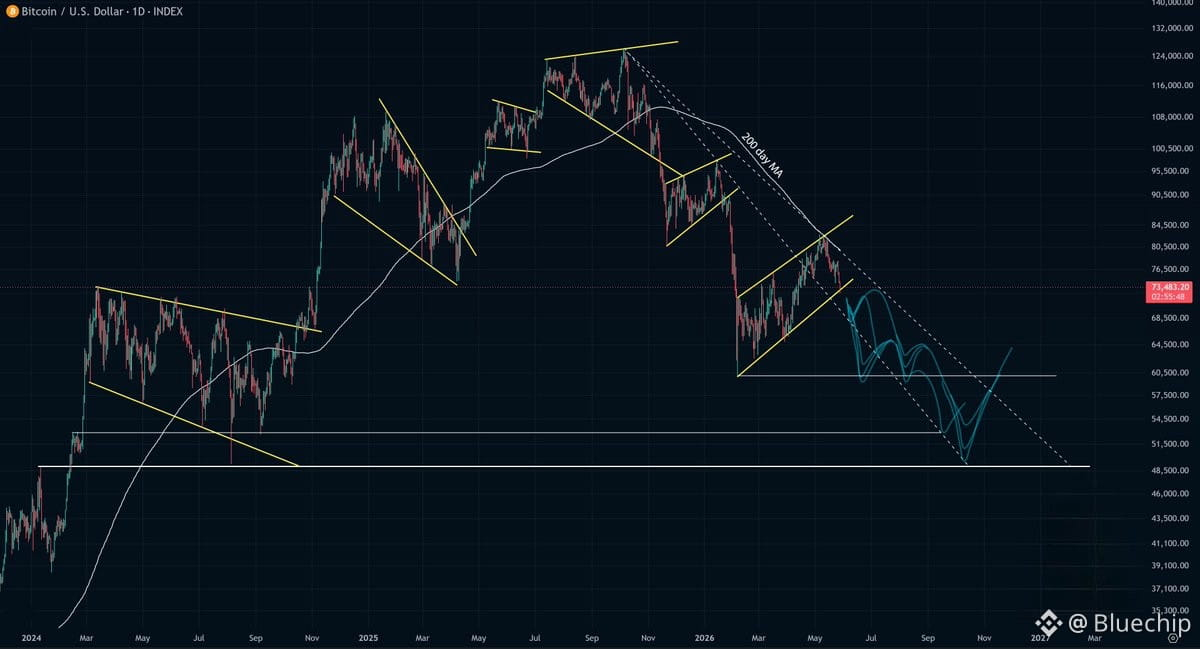
Here's a rough visualization of how I see the most likely scenarios playing out. If you average them, you'll get a feel for the broad concept I have. I can absolutely be wrong, but it's my take on things currently.
Note that I give the diagonal (dotted) trend lines some importance in controlling the price movements as well as the horizontal support levels.
This falls in alignment with my other post on the odds I give these Bitcoin scenarios.
{future}(BTCUSDT)
$BTC squiggles
Here's a rough visualization of how I see the most likely scenarios playing out. If you average them, you'll get a feel for the broad concept I have. I can absolutely be wrong, but it's my take on things currently.
Note that I give the diagonal (dotted) trend lines some importance in controlling the price movements as well as the horizontal support levels.
This falls in alignment with my other post on the odds I give these Bitcoin scenarios.
Here's a rough visualization of how I see the most likely scenarios playing out. If you average them, you'll get a feel for the broad concept I have. I can absolutely be wrong, but it's my take on things currently.
Note that I give the diagonal (dotted) trend lines some importance in controlling the price movements as well as the horizontal support levels.
This falls in alignment with my other post on the odds I give these Bitcoin scenarios.
23
7
94
99.6k
·
--
The most dangerous position in crypto is not a Long or a Short.
It is your Ego.
The moment your market thesis becomes part of your identity, new data starts feeling like an attack instead of information.
You stop asking:
"What is the market telling me?"
And start asking:
"How can I prove I was right?"
The market doesn't care about your reputation, your followers, your entry price, or how confident you were yesterday.
Sometimes the best trade is simply accepting that reality changed before your Ego does.
In markets, survival requires something Freud understood very well:
the Ego must eventually negotiate with reality.
$BTC
{future}(BTCUSDT)
The most dangerous position in crypto is not a Long or a Short.
It is your Ego.
The moment your market thesis becomes part of your identity, new data starts feeling like an attack instead of information.
You stop asking:
"What is the market telling me?"
And start asking:
"How can I prove I was right?"
The market doesn't care about your reputation, your followers, your entry price, or how confident you were yesterday.
Sometimes the best trade is simply accepting that reality changed before your Ego does.
In markets, survival requires something Freud understood very well:
the Ego must eventually negotiate with reality.
$BTC
It is your Ego.
The moment your market thesis becomes part of your identity, new data starts feeling like an attack instead of information.
You stop asking:
"What is the market telling me?"
And start asking:
"How can I prove I was right?"
The market doesn't care about your reputation, your followers, your entry price, or how confident you were yesterday.
Sometimes the best trade is simply accepting that reality changed before your Ego does.
In markets, survival requires something Freud understood very well:
the Ego must eventually negotiate with reality.
$BTC
1
6
1.2k
·
--
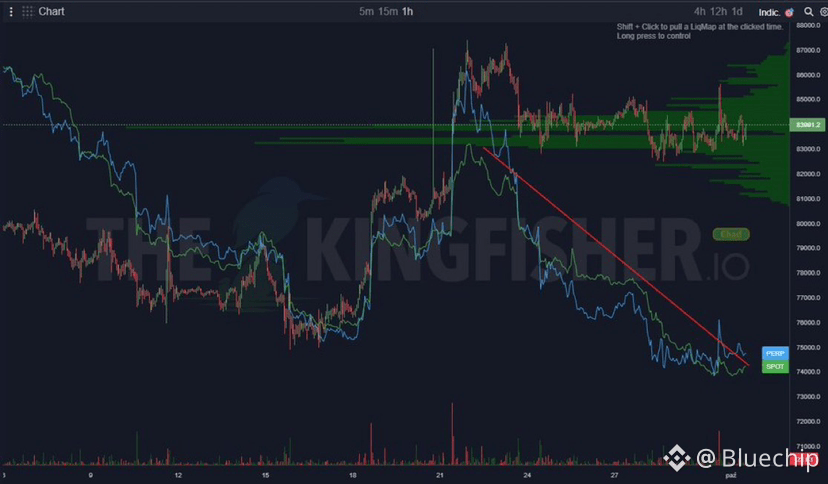
$BTC has held 83-85K for a week. Spot and perp CVD kept printing lower lows the entire time.
Market sellers have been hitting the bid since the 87K top. Passive limit buyers absorbed it all.
- Spot CVD: downtrend from 87K top
- Perp CVD: same, brief breakout Oct 1 failed within hours
- Price: stuck 82.5-85.5K, sitting on the heaviest volume node
Spot CVD breaking its trendline with price above 85.5K = accumulation. Losing 82.5K with CVD still falling = bids got pulled, and the profile thins fast below 82K.
{future}(BTCUSDT)
$BTC has held 83-85K for a week. Spot and perp CVD kept printing lower lows the entire time.
Market sellers have been hitting the bid since the 87K top. Passive limit buyers absorbed it all.
- Spot CVD: downtrend from 87K top
- Perp CVD: same, brief breakout Oct 1 failed within hours
- Price: stuck 82.5-85.5K, sitting on the heaviest volume node
Spot CVD breaking its trendline with price above 85.5K = accumulation. Losing 82.5K with CVD still falling = bids got pulled, and the profile thins fast below 82K.
Market sellers have been hitting the bid since the 87K top. Passive limit buyers absorbed it all.
- Spot CVD: downtrend from 87K top
- Perp CVD: same, brief breakout Oct 1 failed within hours
- Price: stuck 82.5-85.5K, sitting on the heaviest volume node
Spot CVD breaking its trendline with price above 85.5K = accumulation. Losing 82.5K with CVD still falling = bids got pulled, and the profile thins fast below 82K.
2
644
·
--
🟢 $BTC Just Had Its Best Q3 Since 2017
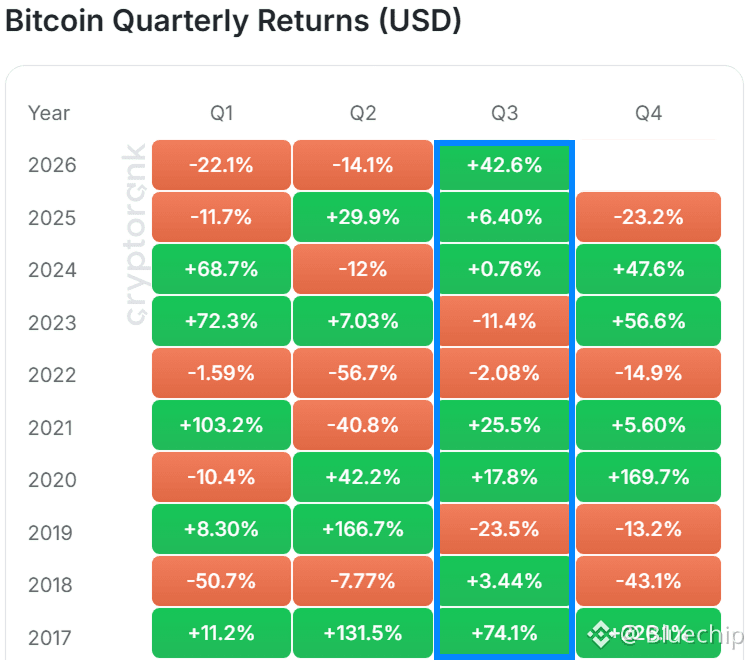
Bitcoin gained 42.6% in Q3 2026, marking its strongest third-quarter performance in nine years.
The rally was enough to reverse much of the weakness from the first half of 2026, after
$BTC posted losses in both Q1 and Q2.
{spot}(BTCUSDT)
🟢 $BTC Just Had Its Best Q3 Since 2017
Bitcoin gained 42.6% in Q3 2026, marking its strongest third-quarter performance in nine years.
The rally was enough to reverse much of the weakness from the first half of 2026, after
$BTC posted losses in both Q1 and Q2.
Bitcoin gained 42.6% in Q3 2026, marking its strongest third-quarter performance in nine years.
The rally was enough to reverse much of the weakness from the first half of 2026, after
$BTC posted losses in both Q1 and Q2.
2
1k
·
--
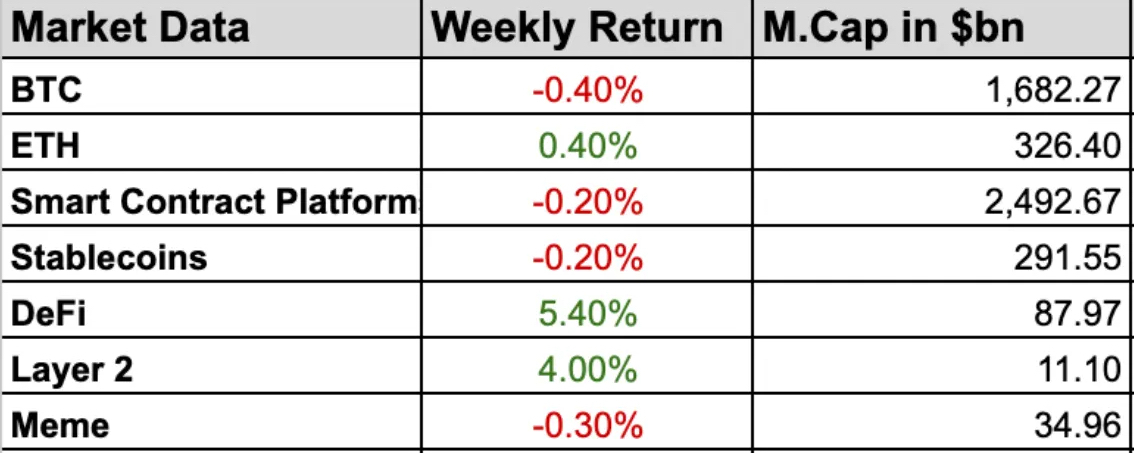
Article
Crypto Market WeeklyThe Stablecoin Wars Begin, While Bitcoin Stays in Range
Hey everyone, and welcome to the Weekly Market.
Two weeks ago we ended on a simple test. The Fed was about to hike, the 10-year sat at 5%, and we said to let the 10-year decide. If the hike pulled yields back under 4.96%, the setup improved quickly. If yields kept climbing through it, anything that does not pay you to hold it was in for a tough quarter.
Neither branch played out. The Fed raised rates by a quarter point on 16 September, 12 votes to 0, taking the target range to 3.75-4.00%. The 10-year never gave back 5% in any convincing way and the 30-year is near 5.3%. Bitcoin went up anyway.
It ran from around $76,800 when we last wrote to about $87,400 on Monday 21 September, its highest level since January, and closed the week at $84,457. That is above the May weekly close of $82,193, which makes it the first higher high since the October 2025 peak. For eleven months every rally had stalled below the one before it. This one did not. It was also the second straight weekly close above the 50-week simple moving average, near $77,700, after 45 weeks underneath it. We flagged the faster exponential version of that line back in August. The slower one has now followed, and held.
Bitcoin gave a little back on Monday, slipping to the $83,200-83,600 area after President Trump rejected Iran’s seven-day ceasefire proposal and Brent jumped back above $106. It is currently trading around $84,000, with Ether near $2,680. Bitcoin remains roughly 33% below its October 2025 peak of $126,198, which is the smallest that number has been since we started printing it.
The quarter closes tonight. The third quarter opened near $58,500, printed a low around $57,700, and is up roughly 42%, enough to swallow the whole of the second quarter’s loss on the three-month chart. It is not confirmed until the candle shuts.
Two things underneath the price matter more than the candle.
First, who paid for it. US spot Bitcoin ETFs took in $2.39 billion last week, their best week since October 2025, while short-term holders sent about 47,600 BTC to exchanges into the move, one of the largest such spikes on record. That is new demand meeting old supply, at almost exactly the price where the average ETF buyer breaks even.
Second, and this is today’s dedicated section: Open USD went live today. Visa, Mastercard, Stripe, Coinbase and Shopify have put their names and more than $1 billion of liquidity commitments behind a dollar stablecoin that gives away nearly all of its reserve income to whoever distributes it. The Fed has just made that income more valuable. Somebody’s margin is about to pay for it.
In this issue, I’ll break down what actually drove the movement, how macro catalysts are compressing into a high-impact window, what on-chain flows are revealing about holder behaviour, and where structural momentum may emerge next.
Let’s get into it.
1. Sector Performance & Key Developments
Open Standard launched Open USD (OUSD) on Ethereum, Solana, Base and Tempo, with more than $1 billion of liquidity commitments from Coinbase, Mastercard, Shopify, Stripe and Visa. The network now counts more than 200 companies. Section 2 is all about it.The SEC granted a five-year “innovation exemption” allowing some tokenised US stocks to trade on blockchain-based systems. The CFTC followed with guidance letting registered firms invest customer funds in tokenised assets and keep records on a blockchain. Both arrived within ten days of CLARITY failing.The New York Stock Exchange signed a memorandum of understanding with Blockchain.com, which would give its 44 million accounts access to tokenised US stocks and ETFs on NYSE’s planned 24/7 venue. It is an agreement to work together, not a launch. No timetable, no list of stocks, no regulatory approval yet.ARK Invest is tokenising its $1.3 billion ARK Venture Fund through Securitize on Ethereum. The fund holds private stakes in OpenAI, Anthropic, Stripe and Databricks. The Wall Street Journal reports that Ondo and BlackRock will bring tokenised “Intelligent Portfolios” onchain.SoFi began settling debit and credit card transactions on Mastercard’s network in its own SoFiUSD stablecoin, and is moving its whole card programme across, expected to exceed $25 billion a year. Merchants never touch the token. They just get paid at weekends.IBM connected to Swift’s blockchain ledger, so banks can send tokenised deposit instructions through the ISO 20022 messages they already use. Seventeen institutions are in the pilot. Canada’s six largest banks are exploring tokenised Canadian dollar deposits for interbank payments.The Federal Reserve proposed reserve and capital rules for stablecoin issuers under the GENIUS Act, which takes effect in January 2027. Tokens would have to be fully backed by short-term Treasury bills or similarly liquid assets. The proposal drew a warning from inside the Board that its anti-money-laundering standard may be too weak.Binance invested $100 million in Circle to push USDC in emerging markets. Separately, Bloomberg reports the US Department of Justice is investigating whether Binance breached Iran sanctions. That is an investigation, not a charge.The Financial Times revealed that Saudi Arabia withdrew from mBridge, the China-led project for settling cross-border payments in central bank digital currencies. The exit happened in May 2025. Only the disclosure is new.Bitget confirmed unauthorised transfers from some of its hot wallets affecting about $351.6 million and suspended withdrawals. The exchange has pointed at North Korean hackers. Treat that attribution as preliminary until a full post-mortem is out.JPMorgan puts Bitcoin’s average production cost at about $85,000. Price had spent 280 days below it, longer than the 224-day stretch in 2018, before briefly rising above last week. Hash rate is down about 19% from its October peak and difficulty about 15%.Riot Platforms repaid a $200 million Bitcoin-backed loan early while leaning further into AI data centres, including a reported $9 billion deal with Anthropic. The miners are becoming landlords.Strategy bought Bitcoin for the first time in three weeks: $75.7 million at an average of $79,670, roughly 950 BTC. It also wants to pay daily dividends on four of its preferred shares, subject to a shareholder vote on 28 October. The stock jumped more than 27% on Monday 21 September.BitMine added 12,500 ETH and now holds 5,983,940 ETH, about 4.9% of supply by its own figure. About 13.6 times more ETH is queued to enter staking than to leave it.Coinbase launched fixed-rate Bitcoin-backed loans through Morpho. The rate is fixed and so is the repayment date, which means collateral can be liquidated at maturity even if the price never fell. Borrowers now carry two risks: the price and the calendar.Coinbase said xAI’s Grok is its leading client for “agentic” trading, meaning AI systems that trade on their own. It also helped Microsoft dismantle EvilTokens, an AI-driven cybercrime network. The CFTC holds its first roundtable on AI and agentic finance on 28 October.Vitalik Buterin published an essay arguing that after the Hegota upgrade in 2027, Ethereum shifts towards checking mathematical proofs rather than re-running every transaction. Glamsterdam, due in the fourth quarter, comes first. Solana began testing Alpenglow, which aims to cut finality from about 12.8 seconds to roughly 150 milliseconds. Test network only, for now.CME will launch Bitcoin Cash and Uniswap futures on 19 October, while its legal fight with the CFTC over retail perpetual futures carries on.Hong Kong plans to pilot tokenised Exchange Fund Bills by the end of 2026. Citi’s base case puts tokenised financial assets at $5.5 trillion by 2030. That is a forecast, not a fact.AMD closed above a $1 trillion market cap for the first time after a jump of nearly 10% in one session, as Meta’s Muse agent topped the App Store. The Nasdaq 100 gained about 2.1% last week against 0.6% for the S&P 500.President Trump and President Xi extended the trade truce by two months to 10 January 2027, with tariff relief on about $30 billion of goods each way. Nothing on rare earths or advanced chips.The Bank of Japan raised its policy rate to 1.25% effective 24 September, following the ECB earlier in the month. Three major central banks have now tightened inside three weeks.
2. Open USD: The Float Goes Up for Auction
The most important launch of the quarter was not a new chain or a new token. It was a dollar.
Open USD (OUSD) went live today on Ethereum, Solana, Base and Tempo. It is issued through Bridge, the stablecoin infrastructure company Stripe bought for $1.1 billion, and run by a separate company called Open Standard. Five founding partners, Coinbase, Mastercard, Shopify, Stripe and Visa, have committed more than $1 billion of liquidity and taken equal equity stakes. BlackRock, BNY and Lead Bank handle the reserves, with monthly attestations promised. Kraken and Uniswap are trading venues from day one, and Coinbase support begins tomorrow.
To see why this matters, start with how a stablecoin makes money
How a stablecoin makes money
You hand an issuer one dollar and receive one token. The issuer puts your dollar into Treasury bills and keeps the interest. You earn nothing. That interest is called the float, and it is the entire business.
With the Fed at 3.75-4.00%, every $1 billion of stablecoins earns its issuer roughly $38-40 million a year.Launch-day reporting puts the market above $300 billion, with Tether’s USDT around $143 billion and Circle’s USDC around $74 billion. At today’s rates USDC’s reserves alone throw off close to $3 billion a year.The quarter-point hike two weeks ago added roughly $750 million a year to the industry’s reserve income. Warsh did not mean to make stablecoin issuers richer. He did.
Until today there were two answers to who keeps that money. Tether keeps most of it. Circle shares a large part with the platforms that distribute USDC, Coinbase above all, and keeps the rest.
Open USD is the third answer. The issuer keeps almost none of it
What Open Standard actually changed
Nearly all reserve income goes to the companies that put OUSD into circulation, in proportion to the supply they bring.Minting and redeeming is free, one for one, at any size. For a business moving large sums between bank dollars and token dollars, that fee was a real cost.Most of the company’s equity is to be handed out over the next four to five years, to founders and non-founders alike, based on how much supply and how much transaction volume each one generates. Moving the token counts, not just parking it.The founding group is expected to grow to 10 to 12 companies, with a board drawn from it. Open Standard is keen to stress that it is a company with owners and a management team, not a committee of 200.
In plain terms, the stablecoin has been turned into a cooperative. The firms that distribute it own it and collect its income.
If that sounds familiar, it should. It is roughly how Visa and Mastercard began: as networks owned by the banks that issued their cards, long before either went public. Two of the five founders are rebuilding their own origin story on a blockchain.
There is a second echo. Seven years ago a Facebook-led group tried to launch a private digital currency called Libra. Visa, Mastercard and Stripe were among the first names on the membership list and among the first to walk away when regulators pushed back. Coinbase and Shopify were members too. All five are back. The difference is that this time a federal law tells them what a stablecoin has to be.
Who pays for it
Circle, first.
Mizuho saw this coming in July. It cut Circle to Underperform, lowered its price target from $85 to $50, raised its estimate of Circle’s 2027 distribution and transaction expense ratio from 64% to 73%, and trimmed its adjusted EBITDA forecast from $1.09 billion to $699 million.The logic is worth spelling out. Circle does not need to lose a single dollar of USDC for this to hurt. Its distributors only need a credible alternative. Every partner renegotiating its USDC revenue share now has a number to point at, and that number is “nearly all of it”.Coinbase, Visa and Mastercard all remain important USDC partners. Backing OUSD does not mean dropping USDC. It means they now sit on both sides of the table.Binance putting $100 million into Circle in the same fortnight, to push USDC in emerging markets, looks like Circle locking in distribution in the one region where the OUSD founders are weakest.
Then the banks, more slowly. The GENIUS Act already bars an issuer from paying interest to the people who hold its token. OUSD does not pay holders. It pays distributors. What a distributor does with that income, whether it keeps it, cuts merchant fees with it or hands some to customers as rewards, is exactly the question the CLARITY negotiations were trying to settle. That language stalled with the bill two weeks ago. Open USD has launched straight into the gap
The caveats
$1 billion is a commitment to be delivered over the coming months, not a balance. Against a $300 billion market it is about a third of one percent.Tempo’s backers talk about $1 billion of OUSD on that chain within months, more than $10 billion during 2027 and potentially over $100 billion after that. Those are one chain’s hopes for itself, not numbers anybody has to hit.A stablecoin is useful because it is liquid, and it is liquid because it is used. USDT’s grip on trading and emerging markets has nothing to do with who collects the interest. OUSD is not really aimed there. Its targets are card settlement, foreign exchange, cross-border payments and lending, which is where its founders already own the customer.Giving away the float only works at scale. An issuer that keeps a sliver of the yield needs a very large supply to cover its costs, and if rates ever fall, the pie shrinks for everybody at once.The holder still earns nothing by default. This is a transfer from issuers to distributors. Whether any of it reaches the person actually holding the token depends on how hard those distributors compete with each other.
Why it reaches beyond crypto
Every dollar stablecoin is a buyer of Treasury bills. Since August we have been writing about a Treasury that cannot find enough buyers at the long end, and about hyperscalers borrowing in the same part of the curve. A stablecoin network owned by the two largest card schemes does nothing for the 30-year. Reserves sit in bills, not bonds. But it does give Washington a growing buyer at the front end that does not haggle over price, which makes it easier to lean on short-dated borrowing. That is the context for reports that the administration is exploring ways to push dollar stablecoins abroad.
Our read : the stablecoin contest has stopped being about who has the most trusted dollar and become a bidding war for distribution. That is good for merchants and platforms, uncomfortable for Circle’s margin, and a slow problem for bank deposits. For Bitcoin it changes nothing this week, which is the same point we made about Korea and perpetuals : the rails can spread without the asset moving. The places that do feel it are the chains that carry the supply.
3. Macro Backdrop
1. PCE: The Good Number Has an Asterisk
Today’s print looked like a gift.
Core PCE for August: 3.0% over twelve months, against 3.3% expected.Headline PCE: 3.4%, against 3.7% expected.Second-quarter GDP was revised up to 2.2% from 1.5%.Kalshi now prices a 65% chance of no hike at the October meeting and 31% for another 25bp. On Monday the market leaned the other way, at roughly 56% for a hike.
Now the asterisk. Starting with this release, the US changed how three PCE categories are measured and revised the data back to 2021.
Portfolio management and investment advice. This is the big one. If an adviser charges 1% of assets and the portfolio rises 20%, the fee in dollars rises 20% even though the adviser never raised the rate. The old method counted part of that as a price increase. The new one estimates the quantity of service from employment data instead.Computer software and accessories now use a broader composite.Legal services drop an unpublished CPI series that had become “unusually volatile”.
Estimates of what the method change alone takes off core PCE start at around 20 basis points. Fundstrat argued beforehand for 0.2 to 0.4 percentage points.
Here is the arithmetic that matters. July was first reported at 3.7% headline and 3.3% core. Those were the numbers on Warsh’s desk at Jackson Hole. Both were revised down today by 30 basis points, to 3.4% and 3.0%. August came in at 3.4% and 3.0%.
So the forecasts of 3.7% and 3.3% were forecasts that nothing had changed since July on the old yardstick. And nothing had changed since July, on the new one. The beat is the revision. Like for like, inflation moved sideways.
That does not make it meaningless.
The Fed targets PCE as published. A lower level is a lower level, and it sits 30bp closer to where Warsh wants it.There was a genuine oddity in the old method. A stock market rally was being counted as inflation, and that inflation was then used to justify the rates that weigh on stocks. That loop has been cut.But a change of yardstick does not make petrol cheaper. August core CPI still rose 0.3% on the month, producer prices 0.4%, and the energy shock we described two weeks ago lands in September’s data, not August’s.
We do not read the whole 30 basis points as disinflation. Part of it is a ruler being swapped. The market’s first reaction has been to take the number at face value. Its second usually involves reading the footnotes.
2. Hormuz: A Road Map Is Not a Reopened Strait
When we last wrote, Brent had touched $109.80 and all three of Saudi Arabia’s export routes were under pressure. Two things changed.
Saudi Arabia worked to restore its damaged pipeline capacity, which eased the most urgent of our three countdowns.On 24 September US and Iranian negotiators met in New York to discuss a phased deal: Iran reopens Hormuz, Washington lifts the naval blockade it has run since July. Tehran offered to reopen the strait within seven days if the blockade is lifted, its assets are unfrozen and hostilities end on all fronts. It even parked its demand for transit fees in a side agreement. That is a real concession.
Brent eased to around $104-105 by Friday and WTI slid towards the low $90s. Then on Monday President Trump rejected the seven-day proposal, and Brent was back above $106 that morning.
We would be careful with the optimism, for three reasons.
This is not the first time in 2026 that Hormuz has looked close to reopening. June’s Islamabad memorandum promised exactly this and collapsed within weeks.Two crew members were injured in unattributed strikes in the strait on 21 September, three days before the talks began.Nothing about the structure of the conflict has changed. Both sides still dispute who controls the water.
A road map is not a ceasefire, and a ceasefire is not a reopened strait.
For crypto the geopolitics matter less than what oil does to the Fed’s maths. Warsh named rising oil as one of his reasons to act. If crude drifts lower through October, one leg of the hawkish case goes with it. If Brent holds above $100, the October hike stays live whatever today’s PCE said. A Hormuz headline in either direction now matters more to Bitcoin than any single data release. Monday proved it.
3. Bonds, Jobs and the Truce
The 10-year is around 5%, having dipped just under late last week as oil eased. The 30-year is near 5.3%. This is still a term premium problem rather than a Fed problem, and one soft inflation print with a footnote attached does not change that.ADP reported 90,000 private-sector jobs added in September, against estimates of 70,000 to 73,000 and a revised 36,000 in August. Education and health added 55,000, leisure and hospitality 22,000, while financial activities lost 16,000. Base pay is growing 3.2% a year. The official report lands Friday. After August’s 162,000 against a consensus near 56,000, nobody should take the forecast on trust.Put the pieces together and the Fed has a lower inflation number, a stronger growth number and a labour market that is not cracking. That is an argument for patience in October, not for cuts.President Trump and President Xi extended the trade truce to 10 January 2027, with tariff relief on about $30 billion of goods each way, a Chinese commitment to buy at least 10 million tons of US coal in each of 2027 and 2028, and a working group on AI. Nothing on rare earths, nothing on advanced chips, and a $14 billion Taiwan arms package still under review. The market’s verdict was “at least it is not worse”, which in this environment is enough.The Bank of Japan’s move to 1.25% takes its policy rate to the highest since 1995. With the ECB and the Fed also tightening this month, the yen funding that fed risk trades for years is getting dearer at the same time as dollars.One date to keep in view: the Treasury’s enlarged buyback programme is still scheduled to end on 4 November, the day after the midterms and a week after the next Fed decision.
4. ETF Insights
The marginal buyer came back but faded fast. Bitcoin ETFs took in $2.39B last week, their strongest week since October 2025, with Monday alone bringing $999M, led by BlackRock’s IBIT. But the pace deteriorated sharply:$999M → $715M → $347M → $195M → $134M from Monday to Friday. Buying fell 87% across the week, and Bitcoin followed the same pattern, peaking Monday before drifting lower even as money continued to arrive
ETF demand has turned the year positive, but $82K is the level that matters. By July 13, Bitcoin ETFs were $5.69B in the red for 2026; roughly $6B has since flowed back. Spot ETFs now hold around 1.27M BTC, close to 6% of all Bitcoin ever mined. Analysts estimate the average ETF investor entered around $82K, which also lines up with May’s high — making the level both a technical marker and a potential institutional break-even point.The buying is absorbing real profit-taking. CryptoQuant shows short-term holders sending roughly 47,600 BTC ($4B+) to exchanges as Bitcoin approached $88K, consistent with investors taking profits. Glassnode’s SOPR remains above 1, suggesting coins are still being sold at a gain without overwhelming the market. Meanwhile, Monday’s $1.06B in liquidations, including $844M of shorts, added forced buying but this time voluntary ETF demand was nearly three times larger. Wallets holding 100–1,000 BTC have also accumulated 113,950 BTC since mid-July.Although unusually large ETF inflows have historically appeared near local peaks, while Bitcoin open interest is now higher than on roughly 92% of days over the past three months. In other words, the rally has both genuine spot demand and leverage behind it. Ether ETFs added $270M on Monday alone, so the next question is whether that demand broadens beyond Bitcoin
5. The Week Ahead
The data calendar is light by recent standards and the headline calendar is not. Oil decides October, and oil is being decided in a negotiating room.
6. Conclusion
The Crypto Fear & Greed Index read 78 on Monday, which it labels Extreme Greed, up from 69 when we last wrote. A month and a half ago it was in Fear.
Wintermute’s desk data adds a number to that feeling: altcoin breadth is stretched to levels that have been followed by flat-to-negative weeks more than 80% of the time, though early in a cycle the exceptions come more often.
The honest framing of where we are. Bitcoin has done the thing it failed to do three times since August. It cleared $82,000, closed a week above the May high, and did it with the Fed hiking and the 10-year at 5%. That is either the start of a different regime or macro pressure arriving late. One week of evidence cannot tell those apart.
It has also not cleared the supply wall we have been describing since August. It pushed through the top of it to $87,400, met more than $4 billion of coins heading to exchanges, and closed in the middle at $84,457. Bitcoin is inside the wall, not through it.
The levels that now decide it:
$82,000-84,000 is the retest zone. It was the May ceiling and it is the average ETF buyer’s cost. It now has to act as a floor, and it will probably be tested more than once.About $74,900 is the structure line, the most recent weekly swing low. Regular readers will recognise it. It is where Bitcoin bottomed on the day the Senate voted down CLARITY. The weekly bull market support band, roughly $70,600-74,500, sits just beneath. A decisive weekly close below that zone says the reversal is failing.About $85,000 is JPMorgan’s estimate of what it costs to mine a bitcoin. Hold above it and the steadiest forced seller in the market gets relief.$89,500-90,000 is the ceiling overhead.
The order of confirmation is breakout, hold, continuation. Bitcoin has done the first. The second starts now.
In August the bull case was a fiscal story. Two weeks ago we called it narrower. Today it has a second leg it did not have then: real money that showed up days after a rate hike, with the 10-year at 5%, and kept showing up for five straight sessions. Against that sit an inflation print flattered by a change of ruler, oil back above $106 and one bad headline from $110, daily inflows that shrank every day last week, and sentiment at Extreme Greed.
The takeaway is simple: do not chase $87,000, let $82,000 prove itself as a floor, and size for an oil headline rather than a data point. Tonight’s quarterly close and Friday’s payrolls will say more than we can.
Crypto Market Weekly
The Stablecoin Wars Begin, While Bitcoin Stays in Range
Hey everyone, and welcome to the Weekly Market.
Two weeks ago we ended on a simple test. The Fed was about to hike, the 10-year sat at 5%, and we said to let the 10-year decide. If the hike pulled yields back under 4.96%, the setup improved quickly. If yields kept climbing through it, anything that does not pay you to hold it was in for a tough quarter.
Neither branch played out. The Fed raised rates by a quarter point on 16 September, 12 votes to 0, taking the target range to 3.75-4.00%. The 10-year never gave back 5% in any convincing way and the 30-year is near 5.3%. Bitcoin went up anyway.
It ran from around $76,800 when we last wrote to about $87,400 on Monday 21 September, its highest level since January, and closed the week at $84,457. That is above the May weekly close of $82,193, which makes it the first higher high since the October 2025 peak. For eleven months every rally had stalled below the one before it. This one did not. It was also the second straight weekly close above the 50-week simple moving average, near $77,700, after 45 weeks underneath it. We flagged the faster exponential version of that line back in August. The slower one has now followed, and held.
Bitcoin gave a little back on Monday, slipping to the $83,200-83,600 area after President Trump rejected Iran’s seven-day ceasefire proposal and Brent jumped back above $106. It is currently trading around $84,000, with Ether near $2,680. Bitcoin remains roughly 33% below its October 2025 peak of $126,198, which is the smallest that number has been since we started printing it.
The quarter closes tonight. The third quarter opened near $58,500, printed a low around $57,700, and is up roughly 42%, enough to swallow the whole of the second quarter’s loss on the three-month chart. It is not confirmed until the candle shuts.
Two things underneath the price matter more than the candle.
First, who paid for it. US spot Bitcoin ETFs took in $2.39 billion last week, their best week since October 2025, while short-term holders sent about 47,600 BTC to exchanges into the move, one of the largest such spikes on record. That is new demand meeting old supply, at almost exactly the price where the average ETF buyer breaks even.
Second, and this is today’s dedicated section: Open USD went live today. Visa, Mastercard, Stripe, Coinbase and Shopify have put their names and more than $1 billion of liquidity commitments behind a dollar stablecoin that gives away nearly all of its reserve income to whoever distributes it. The Fed has just made that income more valuable. Somebody’s margin is about to pay for it.
In this issue, I’ll break down what actually drove the movement, how macro catalysts are compressing into a high-impact window, what on-chain flows are revealing about holder behaviour, and where structural momentum may emerge next.
Let’s get into it.
1. Sector Performance & Key Developments
Open Standard launched Open USD (OUSD) on Ethereum, Solana, Base and Tempo, with more than $1 billion of liquidity commitments from Coinbase, Mastercard, Shopify, Stripe and Visa. The network now counts more than 200 companies. Section 2 is all about it.The SEC granted a five-year “innovation exemption” allowing some tokenised US stocks to trade on blockchain-based systems. The CFTC followed with guidance letting registered firms invest customer funds in tokenised assets and keep records on a blockchain. Both arrived within ten days of CLARITY failing.The New York Stock Exchange signed a memorandum of understanding with Blockchain.com, which would give its 44 million accounts access to tokenised US stocks and ETFs on NYSE’s planned 24/7 venue. It is an agreement to work together, not a launch. No timetable, no list of stocks, no regulatory approval yet.ARK Invest is tokenising its $1.3 billion ARK Venture Fund through Securitize on Ethereum. The fund holds private stakes in OpenAI, Anthropic, Stripe and Databricks. The Wall Street Journal reports that Ondo and BlackRock will bring tokenised “Intelligent Portfolios” onchain.SoFi began settling debit and credit card transactions on Mastercard’s network in its own SoFiUSD stablecoin, and is moving its whole card programme across, expected to exceed $25 billion a year. Merchants never touch the token. They just get paid at weekends.IBM connected to Swift’s blockchain ledger, so banks can send tokenised deposit instructions through the ISO 20022 messages they already use. Seventeen institutions are in the pilot. Canada’s six largest banks are exploring tokenised Canadian dollar deposits for interbank payments.The Federal Reserve proposed reserve and capital rules for stablecoin issuers under the GENIUS Act, which takes effect in January 2027. Tokens would have to be fully backed by short-term Treasury bills or similarly liquid assets. The proposal drew a warning from inside the Board that its anti-money-laundering standard may be too weak.Binance invested $100 million in Circle to push USDC in emerging markets. Separately, Bloomberg reports the US Department of Justice is investigating whether Binance breached Iran sanctions. That is an investigation, not a charge.The Financial Times revealed that Saudi Arabia withdrew from mBridge, the China-led project for settling cross-border payments in central bank digital currencies. The exit happened in May 2025. Only the disclosure is new.Bitget confirmed unauthorised transfers from some of its hot wallets affecting about $351.6 million and suspended withdrawals. The exchange has pointed at North Korean hackers. Treat that attribution as preliminary until a full post-mortem is out.JPMorgan puts Bitcoin’s average production cost at about $85,000. Price had spent 280 days below it, longer than the 224-day stretch in 2018, before briefly rising above last week. Hash rate is down about 19% from its October peak and difficulty about 15%.Riot Platforms repaid a $200 million Bitcoin-backed loan early while leaning further into AI data centres, including a reported $9 billion deal with Anthropic. The miners are becoming landlords.Strategy bought Bitcoin for the first time in three weeks: $75.7 million at an average of $79,670, roughly 950 BTC. It also wants to pay daily dividends on four of its preferred shares, subject to a shareholder vote on 28 October. The stock jumped more than 27% on Monday 21 September.BitMine added 12,500 ETH and now holds 5,983,940 ETH, about 4.9% of supply by its own figure. About 13.6 times more ETH is queued to enter staking than to leave it.Coinbase launched fixed-rate Bitcoin-backed loans through Morpho. The rate is fixed and so is the repayment date, which means collateral can be liquidated at maturity even if the price never fell. Borrowers now carry two risks: the price and the calendar.Coinbase said xAI’s Grok is its leading client for “agentic” trading, meaning AI systems that trade on their own. It also helped Microsoft dismantle EvilTokens, an AI-driven cybercrime network. The CFTC holds its first roundtable on AI and agentic finance on 28 October.Vitalik Buterin published an essay arguing that after the Hegota upgrade in 2027, Ethereum shifts towards checking mathematical proofs rather than re-running every transaction. Glamsterdam, due in the fourth quarter, comes first. Solana began testing Alpenglow, which aims to cut finality from about 12.8 seconds to roughly 150 milliseconds. Test network only, for now.CME will launch Bitcoin Cash and Uniswap futures on 19 October, while its legal fight with the CFTC over retail perpetual futures carries on.Hong Kong plans to pilot tokenised Exchange Fund Bills by the end of 2026. Citi’s base case puts tokenised financial assets at $5.5 trillion by 2030. That is a forecast, not a fact.AMD closed above a $1 trillion market cap for the first time after a jump of nearly 10% in one session, as Meta’s Muse agent topped the App Store. The Nasdaq 100 gained about 2.1% last week against 0.6% for the S&P 500.President Trump and President Xi extended the trade truce by two months to 10 January 2027, with tariff relief on about $30 billion of goods each way. Nothing on rare earths or advanced chips.The Bank of Japan raised its policy rate to 1.25% effective 24 September, following the ECB earlier in the month. Three major central banks have now tightened inside three weeks.
2. Open USD: The Float Goes Up for Auction
The most important launch of the quarter was not a new chain or a new token. It was a dollar.
Open USD (OUSD) went live today on Ethereum, Solana, Base and Tempo. It is issued through Bridge, the stablecoin infrastructure company Stripe bought for $1.1 billion, and run by a separate company called Open Standard. Five founding partners, Coinbase, Mastercard, Shopify, Stripe and Visa, have committed more than $1 billion of liquidity and taken equal equity stakes. BlackRock, BNY and Lead Bank handle the reserves, with monthly attestations promised. Kraken and Uniswap are trading venues from day one, and Coinbase support begins tomorrow.
To see why this matters, start with how a stablecoin makes money
How a stablecoin makes money
You hand an issuer one dollar and receive one token. The issuer puts your dollar into Treasury bills and keeps the interest. You earn nothing. That interest is called the float, and it is the entire business.
With the Fed at 3.75-4.00%, every $1 billion of stablecoins earns its issuer roughly $38-40 million a year.Launch-day reporting puts the market above $300 billion, with Tether’s USDT around $143 billion and Circle’s USDC around $74 billion. At today’s rates USDC’s reserves alone throw off close to $3 billion a year.The quarter-point hike two weeks ago added roughly $750 million a year to the industry’s reserve income. Warsh did not mean to make stablecoin issuers richer. He did.
Until today there were two answers to who keeps that money. Tether keeps most of it. Circle shares a large part with the platforms that distribute USDC, Coinbase above all, and keeps the rest.
Open USD is the third answer. The issuer keeps almost none of it
What Open Standard actually changed
Nearly all reserve income goes to the companies that put OUSD into circulation, in proportion to the supply they bring.Minting and redeeming is free, one for one, at any size. For a business moving large sums between bank dollars and token dollars, that fee was a real cost.Most of the company’s equity is to be handed out over the next four to five years, to founders and non-founders alike, based on how much supply and how much transaction volume each one generates. Moving the token counts, not just parking it.The founding group is expected to grow to 10 to 12 companies, with a board drawn from it. Open Standard is keen to stress that it is a company with owners and a management team, not a committee of 200.
In plain terms, the stablecoin has been turned into a cooperative. The firms that distribute it own it and collect its income.
If that sounds familiar, it should. It is roughly how Visa and Mastercard began: as networks owned by the banks that issued their cards, long before either went public. Two of the five founders are rebuilding their own origin story on a blockchain.
There is a second echo. Seven years ago a Facebook-led group tried to launch a private digital currency called Libra. Visa, Mastercard and Stripe were among the first names on the membership list and among the first to walk away when regulators pushed back. Coinbase and Shopify were members too. All five are back. The difference is that this time a federal law tells them what a stablecoin has to be.
Who pays for it
Circle, first.
Mizuho saw this coming in July. It cut Circle to Underperform, lowered its price target from $85 to $50, raised its estimate of Circle’s 2027 distribution and transaction expense ratio from 64% to 73%, and trimmed its adjusted EBITDA forecast from $1.09 billion to $699 million.The logic is worth spelling out. Circle does not need to lose a single dollar of USDC for this to hurt. Its distributors only need a credible alternative. Every partner renegotiating its USDC revenue share now has a number to point at, and that number is “nearly all of it”.Coinbase, Visa and Mastercard all remain important USDC partners. Backing OUSD does not mean dropping USDC. It means they now sit on both sides of the table.Binance putting $100 million into Circle in the same fortnight, to push USDC in emerging markets, looks like Circle locking in distribution in the one region where the OUSD founders are weakest.
Then the banks, more slowly. The GENIUS Act already bars an issuer from paying interest to the people who hold its token. OUSD does not pay holders. It pays distributors. What a distributor does with that income, whether it keeps it, cuts merchant fees with it or hands some to customers as rewards, is exactly the question the CLARITY negotiations were trying to settle. That language stalled with the bill two weeks ago. Open USD has launched straight into the gap
The caveats
$1 billion is a commitment to be delivered over the coming months, not a balance. Against a $300 billion market it is about a third of one percent.Tempo’s backers talk about $1 billion of OUSD on that chain within months, more than $10 billion during 2027 and potentially over $100 billion after that. Those are one chain’s hopes for itself, not numbers anybody has to hit.A stablecoin is useful because it is liquid, and it is liquid because it is used. USDT’s grip on trading and emerging markets has nothing to do with who collects the interest. OUSD is not really aimed there. Its targets are card settlement, foreign exchange, cross-border payments and lending, which is where its founders already own the customer.Giving away the float only works at scale. An issuer that keeps a sliver of the yield needs a very large supply to cover its costs, and if rates ever fall, the pie shrinks for everybody at once.The holder still earns nothing by default. This is a transfer from issuers to distributors. Whether any of it reaches the person actually holding the token depends on how hard those distributors compete with each other.
Why it reaches beyond crypto
Every dollar stablecoin is a buyer of Treasury bills. Since August we have been writing about a Treasury that cannot find enough buyers at the long end, and about hyperscalers borrowing in the same part of the curve. A stablecoin network owned by the two largest card schemes does nothing for the 30-year. Reserves sit in bills, not bonds. But it does give Washington a growing buyer at the front end that does not haggle over price, which makes it easier to lean on short-dated borrowing. That is the context for reports that the administration is exploring ways to push dollar stablecoins abroad.
Our read : the stablecoin contest has stopped being about who has the most trusted dollar and become a bidding war for distribution. That is good for merchants and platforms, uncomfortable for Circle’s margin, and a slow problem for bank deposits. For Bitcoin it changes nothing this week, which is the same point we made about Korea and perpetuals : the rails can spread without the asset moving. The places that do feel it are the chains that carry the supply.
3. Macro Backdrop
1. PCE: The Good Number Has an Asterisk
Today’s print looked like a gift.
Core PCE for August: 3.0% over twelve months, against 3.3% expected.Headline PCE: 3.4%, against 3.7% expected.Second-quarter GDP was revised up to 2.2% from 1.5%.Kalshi now prices a 65% chance of no hike at the October meeting and 31% for another 25bp. On Monday the market leaned the other way, at roughly 56% for a hike.
Now the asterisk. Starting with this release, the US changed how three PCE categories are measured and revised the data back to 2021.
Portfolio management and investment advice. This is the big one. If an adviser charges 1% of assets and the portfolio rises 20%, the fee in dollars rises 20% even though the adviser never raised the rate. The old method counted part of that as a price increase. The new one estimates the quantity of service from employment data instead.Computer software and accessories now use a broader composite.Legal services drop an unpublished CPI series that had become “unusually volatile”.
Estimates of what the method change alone takes off core PCE start at around 20 basis points. Fundstrat argued beforehand for 0.2 to 0.4 percentage points.
Here is the arithmetic that matters. July was first reported at 3.7% headline and 3.3% core. Those were the numbers on Warsh’s desk at Jackson Hole. Both were revised down today by 30 basis points, to 3.4% and 3.0%. August came in at 3.4% and 3.0%.
So the forecasts of 3.7% and 3.3% were forecasts that nothing had changed since July on the old yardstick. And nothing had changed since July, on the new one. The beat is the revision. Like for like, inflation moved sideways.
That does not make it meaningless.
The Fed targets PCE as published. A lower level is a lower level, and it sits 30bp closer to where Warsh wants it.There was a genuine oddity in the old method. A stock market rally was being counted as inflation, and that inflation was then used to justify the rates that weigh on stocks. That loop has been cut.But a change of yardstick does not make petrol cheaper. August core CPI still rose 0.3% on the month, producer prices 0.4%, and the energy shock we described two weeks ago lands in September’s data, not August’s.
We do not read the whole 30 basis points as disinflation. Part of it is a ruler being swapped. The market’s first reaction has been to take the number at face value. Its second usually involves reading the footnotes.
2. Hormuz: A Road Map Is Not a Reopened Strait
When we last wrote, Brent had touched $109.80 and all three of Saudi Arabia’s export routes were under pressure. Two things changed.
Saudi Arabia worked to restore its damaged pipeline capacity, which eased the most urgent of our three countdowns.On 24 September US and Iranian negotiators met in New York to discuss a phased deal: Iran reopens Hormuz, Washington lifts the naval blockade it has run since July. Tehran offered to reopen the strait within seven days if the blockade is lifted, its assets are unfrozen and hostilities end on all fronts. It even parked its demand for transit fees in a side agreement. That is a real concession.
Brent eased to around $104-105 by Friday and WTI slid towards the low $90s. Then on Monday President Trump rejected the seven-day proposal, and Brent was back above $106 that morning.
We would be careful with the optimism, for three reasons.
This is not the first time in 2026 that Hormuz has looked close to reopening. June’s Islamabad memorandum promised exactly this and collapsed within weeks.Two crew members were injured in unattributed strikes in the strait on 21 September, three days before the talks began.Nothing about the structure of the conflict has changed. Both sides still dispute who controls the water.
A road map is not a ceasefire, and a ceasefire is not a reopened strait.
For crypto the geopolitics matter less than what oil does to the Fed’s maths. Warsh named rising oil as one of his reasons to act. If crude drifts lower through October, one leg of the hawkish case goes with it. If Brent holds above $100, the October hike stays live whatever today’s PCE said. A Hormuz headline in either direction now matters more to Bitcoin than any single data release. Monday proved it.
3. Bonds, Jobs and the Truce
The 10-year is around 5%, having dipped just under late last week as oil eased. The 30-year is near 5.3%. This is still a term premium problem rather than a Fed problem, and one soft inflation print with a footnote attached does not change that.ADP reported 90,000 private-sector jobs added in September, against estimates of 70,000 to 73,000 and a revised 36,000 in August. Education and health added 55,000, leisure and hospitality 22,000, while financial activities lost 16,000. Base pay is growing 3.2% a year. The official report lands Friday. After August’s 162,000 against a consensus near 56,000, nobody should take the forecast on trust.Put the pieces together and the Fed has a lower inflation number, a stronger growth number and a labour market that is not cracking. That is an argument for patience in October, not for cuts.President Trump and President Xi extended the trade truce to 10 January 2027, with tariff relief on about $30 billion of goods each way, a Chinese commitment to buy at least 10 million tons of US coal in each of 2027 and 2028, and a working group on AI. Nothing on rare earths, nothing on advanced chips, and a $14 billion Taiwan arms package still under review. The market’s verdict was “at least it is not worse”, which in this environment is enough.The Bank of Japan’s move to 1.25% takes its policy rate to the highest since 1995. With the ECB and the Fed also tightening this month, the yen funding that fed risk trades for years is getting dearer at the same time as dollars.One date to keep in view: the Treasury’s enlarged buyback programme is still scheduled to end on 4 November, the day after the midterms and a week after the next Fed decision.
4. ETF Insights
The marginal buyer came back but faded fast. Bitcoin ETFs took in $2.39B last week, their strongest week since October 2025, with Monday alone bringing $999M, led by BlackRock’s IBIT. But the pace deteriorated sharply:$999M → $715M → $347M → $195M → $134M from Monday to Friday. Buying fell 87% across the week, and Bitcoin followed the same pattern, peaking Monday before drifting lower even as money continued to arrive
ETF demand has turned the year positive, but $82K is the level that matters. By July 13, Bitcoin ETFs were $5.69B in the red for 2026; roughly $6B has since flowed back. Spot ETFs now hold around 1.27M BTC, close to 6% of all Bitcoin ever mined. Analysts estimate the average ETF investor entered around $82K, which also lines up with May’s high — making the level both a technical marker and a potential institutional break-even point.The buying is absorbing real profit-taking. CryptoQuant shows short-term holders sending roughly 47,600 BTC ($4B+) to exchanges as Bitcoin approached $88K, consistent with investors taking profits. Glassnode’s SOPR remains above 1, suggesting coins are still being sold at a gain without overwhelming the market. Meanwhile, Monday’s $1.06B in liquidations, including $844M of shorts, added forced buying but this time voluntary ETF demand was nearly three times larger. Wallets holding 100–1,000 BTC have also accumulated 113,950 BTC since mid-July.Although unusually large ETF inflows have historically appeared near local peaks, while Bitcoin open interest is now higher than on roughly 92% of days over the past three months. In other words, the rally has both genuine spot demand and leverage behind it. Ether ETFs added $270M on Monday alone, so the next question is whether that demand broadens beyond Bitcoin
5. The Week Ahead
The data calendar is light by recent standards and the headline calendar is not. Oil decides October, and oil is being decided in a negotiating room.
6. Conclusion
The Crypto Fear & Greed Index read 78 on Monday, which it labels Extreme Greed, up from 69 when we last wrote. A month and a half ago it was in Fear.
Wintermute’s desk data adds a number to that feeling: altcoin breadth is stretched to levels that have been followed by flat-to-negative weeks more than 80% of the time, though early in a cycle the exceptions come more often.
The honest framing of where we are. Bitcoin has done the thing it failed to do three times since August. It cleared $82,000, closed a week above the May high, and did it with the Fed hiking and the 10-year at 5%. That is either the start of a different regime or macro pressure arriving late. One week of evidence cannot tell those apart.
It has also not cleared the supply wall we have been describing since August. It pushed through the top of it to $87,400, met more than $4 billion of coins heading to exchanges, and closed in the middle at $84,457. Bitcoin is inside the wall, not through it.
The levels that now decide it:
$82,000-84,000 is the retest zone. It was the May ceiling and it is the average ETF buyer’s cost. It now has to act as a floor, and it will probably be tested more than once.About $74,900 is the structure line, the most recent weekly swing low. Regular readers will recognise it. It is where Bitcoin bottomed on the day the Senate voted down CLARITY. The weekly bull market support band, roughly $70,600-74,500, sits just beneath. A decisive weekly close below that zone says the reversal is failing.About $85,000 is JPMorgan’s estimate of what it costs to mine a bitcoin. Hold above it and the steadiest forced seller in the market gets relief.$89,500-90,000 is the ceiling overhead.
The order of confirmation is breakout, hold, continuation. Bitcoin has done the first. The second starts now.
In August the bull case was a fiscal story. Two weeks ago we called it narrower. Today it has a second leg it did not have then: real money that showed up days after a rate hike, with the 10-year at 5%, and kept showing up for five straight sessions. Against that sit an inflation print flattered by a change of ruler, oil back above $106 and one bad headline from $110, daily inflows that shrank every day last week, and sentiment at Extreme Greed.
The takeaway is simple: do not chase $87,000, let $82,000 prove itself as a floor, and size for an oil headline rather than a data point. Tonight’s quarterly close and Friday’s payrolls will say more than we can.
Hey everyone, and welcome to the Weekly Market.
Two weeks ago we ended on a simple test. The Fed was about to hike, the 10-year sat at 5%, and we said to let the 10-year decide. If the hike pulled yields back under 4.96%, the setup improved quickly. If yields kept climbing through it, anything that does not pay you to hold it was in for a tough quarter.
Neither branch played out. The Fed raised rates by a quarter point on 16 September, 12 votes to 0, taking the target range to 3.75-4.00%. The 10-year never gave back 5% in any convincing way and the 30-year is near 5.3%. Bitcoin went up anyway.
It ran from around $76,800 when we last wrote to about $87,400 on Monday 21 September, its highest level since January, and closed the week at $84,457. That is above the May weekly close of $82,193, which makes it the first higher high since the October 2025 peak. For eleven months every rally had stalled below the one before it. This one did not. It was also the second straight weekly close above the 50-week simple moving average, near $77,700, after 45 weeks underneath it. We flagged the faster exponential version of that line back in August. The slower one has now followed, and held.
Bitcoin gave a little back on Monday, slipping to the $83,200-83,600 area after President Trump rejected Iran’s seven-day ceasefire proposal and Brent jumped back above $106. It is currently trading around $84,000, with Ether near $2,680. Bitcoin remains roughly 33% below its October 2025 peak of $126,198, which is the smallest that number has been since we started printing it.
The quarter closes tonight. The third quarter opened near $58,500, printed a low around $57,700, and is up roughly 42%, enough to swallow the whole of the second quarter’s loss on the three-month chart. It is not confirmed until the candle shuts.
Two things underneath the price matter more than the candle.
First, who paid for it. US spot Bitcoin ETFs took in $2.39 billion last week, their best week since October 2025, while short-term holders sent about 47,600 BTC to exchanges into the move, one of the largest such spikes on record. That is new demand meeting old supply, at almost exactly the price where the average ETF buyer breaks even.
Second, and this is today’s dedicated section: Open USD went live today. Visa, Mastercard, Stripe, Coinbase and Shopify have put their names and more than $1 billion of liquidity commitments behind a dollar stablecoin that gives away nearly all of its reserve income to whoever distributes it. The Fed has just made that income more valuable. Somebody’s margin is about to pay for it.
In this issue, I’ll break down what actually drove the movement, how macro catalysts are compressing into a high-impact window, what on-chain flows are revealing about holder behaviour, and where structural momentum may emerge next.
Let’s get into it.
1. Sector Performance & Key Developments
Open Standard launched Open USD (OUSD) on Ethereum, Solana, Base and Tempo, with more than $1 billion of liquidity commitments from Coinbase, Mastercard, Shopify, Stripe and Visa. The network now counts more than 200 companies. Section 2 is all about it.The SEC granted a five-year “innovation exemption” allowing some tokenised US stocks to trade on blockchain-based systems. The CFTC followed with guidance letting registered firms invest customer funds in tokenised assets and keep records on a blockchain. Both arrived within ten days of CLARITY failing.The New York Stock Exchange signed a memorandum of understanding with Blockchain.com, which would give its 44 million accounts access to tokenised US stocks and ETFs on NYSE’s planned 24/7 venue. It is an agreement to work together, not a launch. No timetable, no list of stocks, no regulatory approval yet.ARK Invest is tokenising its $1.3 billion ARK Venture Fund through Securitize on Ethereum. The fund holds private stakes in OpenAI, Anthropic, Stripe and Databricks. The Wall Street Journal reports that Ondo and BlackRock will bring tokenised “Intelligent Portfolios” onchain.SoFi began settling debit and credit card transactions on Mastercard’s network in its own SoFiUSD stablecoin, and is moving its whole card programme across, expected to exceed $25 billion a year. Merchants never touch the token. They just get paid at weekends.IBM connected to Swift’s blockchain ledger, so banks can send tokenised deposit instructions through the ISO 20022 messages they already use. Seventeen institutions are in the pilot. Canada’s six largest banks are exploring tokenised Canadian dollar deposits for interbank payments.The Federal Reserve proposed reserve and capital rules for stablecoin issuers under the GENIUS Act, which takes effect in January 2027. Tokens would have to be fully backed by short-term Treasury bills or similarly liquid assets. The proposal drew a warning from inside the Board that its anti-money-laundering standard may be too weak.Binance invested $100 million in Circle to push USDC in emerging markets. Separately, Bloomberg reports the US Department of Justice is investigating whether Binance breached Iran sanctions. That is an investigation, not a charge.The Financial Times revealed that Saudi Arabia withdrew from mBridge, the China-led project for settling cross-border payments in central bank digital currencies. The exit happened in May 2025. Only the disclosure is new.Bitget confirmed unauthorised transfers from some of its hot wallets affecting about $351.6 million and suspended withdrawals. The exchange has pointed at North Korean hackers. Treat that attribution as preliminary until a full post-mortem is out.JPMorgan puts Bitcoin’s average production cost at about $85,000. Price had spent 280 days below it, longer than the 224-day stretch in 2018, before briefly rising above last week. Hash rate is down about 19% from its October peak and difficulty about 15%.Riot Platforms repaid a $200 million Bitcoin-backed loan early while leaning further into AI data centres, including a reported $9 billion deal with Anthropic. The miners are becoming landlords.Strategy bought Bitcoin for the first time in three weeks: $75.7 million at an average of $79,670, roughly 950 BTC. It also wants to pay daily dividends on four of its preferred shares, subject to a shareholder vote on 28 October. The stock jumped more than 27% on Monday 21 September.BitMine added 12,500 ETH and now holds 5,983,940 ETH, about 4.9% of supply by its own figure. About 13.6 times more ETH is queued to enter staking than to leave it.Coinbase launched fixed-rate Bitcoin-backed loans through Morpho. The rate is fixed and so is the repayment date, which means collateral can be liquidated at maturity even if the price never fell. Borrowers now carry two risks: the price and the calendar.Coinbase said xAI’s Grok is its leading client for “agentic” trading, meaning AI systems that trade on their own. It also helped Microsoft dismantle EvilTokens, an AI-driven cybercrime network. The CFTC holds its first roundtable on AI and agentic finance on 28 October.Vitalik Buterin published an essay arguing that after the Hegota upgrade in 2027, Ethereum shifts towards checking mathematical proofs rather than re-running every transaction. Glamsterdam, due in the fourth quarter, comes first. Solana began testing Alpenglow, which aims to cut finality from about 12.8 seconds to roughly 150 milliseconds. Test network only, for now.CME will launch Bitcoin Cash and Uniswap futures on 19 October, while its legal fight with the CFTC over retail perpetual futures carries on.Hong Kong plans to pilot tokenised Exchange Fund Bills by the end of 2026. Citi’s base case puts tokenised financial assets at $5.5 trillion by 2030. That is a forecast, not a fact.AMD closed above a $1 trillion market cap for the first time after a jump of nearly 10% in one session, as Meta’s Muse agent topped the App Store. The Nasdaq 100 gained about 2.1% last week against 0.6% for the S&P 500.President Trump and President Xi extended the trade truce by two months to 10 January 2027, with tariff relief on about $30 billion of goods each way. Nothing on rare earths or advanced chips.The Bank of Japan raised its policy rate to 1.25% effective 24 September, following the ECB earlier in the month. Three major central banks have now tightened inside three weeks.
2. Open USD: The Float Goes Up for Auction
The most important launch of the quarter was not a new chain or a new token. It was a dollar.
Open USD (OUSD) went live today on Ethereum, Solana, Base and Tempo. It is issued through Bridge, the stablecoin infrastructure company Stripe bought for $1.1 billion, and run by a separate company called Open Standard. Five founding partners, Coinbase, Mastercard, Shopify, Stripe and Visa, have committed more than $1 billion of liquidity and taken equal equity stakes. BlackRock, BNY and Lead Bank handle the reserves, with monthly attestations promised. Kraken and Uniswap are trading venues from day one, and Coinbase support begins tomorrow.
To see why this matters, start with how a stablecoin makes money
How a stablecoin makes money
You hand an issuer one dollar and receive one token. The issuer puts your dollar into Treasury bills and keeps the interest. You earn nothing. That interest is called the float, and it is the entire business.
With the Fed at 3.75-4.00%, every $1 billion of stablecoins earns its issuer roughly $38-40 million a year.Launch-day reporting puts the market above $300 billion, with Tether’s USDT around $143 billion and Circle’s USDC around $74 billion. At today’s rates USDC’s reserves alone throw off close to $3 billion a year.The quarter-point hike two weeks ago added roughly $750 million a year to the industry’s reserve income. Warsh did not mean to make stablecoin issuers richer. He did.
Until today there were two answers to who keeps that money. Tether keeps most of it. Circle shares a large part with the platforms that distribute USDC, Coinbase above all, and keeps the rest.
Open USD is the third answer. The issuer keeps almost none of it
What Open Standard actually changed
Nearly all reserve income goes to the companies that put OUSD into circulation, in proportion to the supply they bring.Minting and redeeming is free, one for one, at any size. For a business moving large sums between bank dollars and token dollars, that fee was a real cost.Most of the company’s equity is to be handed out over the next four to five years, to founders and non-founders alike, based on how much supply and how much transaction volume each one generates. Moving the token counts, not just parking it.The founding group is expected to grow to 10 to 12 companies, with a board drawn from it. Open Standard is keen to stress that it is a company with owners and a management team, not a committee of 200.
In plain terms, the stablecoin has been turned into a cooperative. The firms that distribute it own it and collect its income.
If that sounds familiar, it should. It is roughly how Visa and Mastercard began: as networks owned by the banks that issued their cards, long before either went public. Two of the five founders are rebuilding their own origin story on a blockchain.
There is a second echo. Seven years ago a Facebook-led group tried to launch a private digital currency called Libra. Visa, Mastercard and Stripe were among the first names on the membership list and among the first to walk away when regulators pushed back. Coinbase and Shopify were members too. All five are back. The difference is that this time a federal law tells them what a stablecoin has to be.
Who pays for it
Circle, first.
Mizuho saw this coming in July. It cut Circle to Underperform, lowered its price target from $85 to $50, raised its estimate of Circle’s 2027 distribution and transaction expense ratio from 64% to 73%, and trimmed its adjusted EBITDA forecast from $1.09 billion to $699 million.The logic is worth spelling out. Circle does not need to lose a single dollar of USDC for this to hurt. Its distributors only need a credible alternative. Every partner renegotiating its USDC revenue share now has a number to point at, and that number is “nearly all of it”.Coinbase, Visa and Mastercard all remain important USDC partners. Backing OUSD does not mean dropping USDC. It means they now sit on both sides of the table.Binance putting $100 million into Circle in the same fortnight, to push USDC in emerging markets, looks like Circle locking in distribution in the one region where the OUSD founders are weakest.
Then the banks, more slowly. The GENIUS Act already bars an issuer from paying interest to the people who hold its token. OUSD does not pay holders. It pays distributors. What a distributor does with that income, whether it keeps it, cuts merchant fees with it or hands some to customers as rewards, is exactly the question the CLARITY negotiations were trying to settle. That language stalled with the bill two weeks ago. Open USD has launched straight into the gap
The caveats
$1 billion is a commitment to be delivered over the coming months, not a balance. Against a $300 billion market it is about a third of one percent.Tempo’s backers talk about $1 billion of OUSD on that chain within months, more than $10 billion during 2027 and potentially over $100 billion after that. Those are one chain’s hopes for itself, not numbers anybody has to hit.A stablecoin is useful because it is liquid, and it is liquid because it is used. USDT’s grip on trading and emerging markets has nothing to do with who collects the interest. OUSD is not really aimed there. Its targets are card settlement, foreign exchange, cross-border payments and lending, which is where its founders already own the customer.Giving away the float only works at scale. An issuer that keeps a sliver of the yield needs a very large supply to cover its costs, and if rates ever fall, the pie shrinks for everybody at once.The holder still earns nothing by default. This is a transfer from issuers to distributors. Whether any of it reaches the person actually holding the token depends on how hard those distributors compete with each other.
Why it reaches beyond crypto
Every dollar stablecoin is a buyer of Treasury bills. Since August we have been writing about a Treasury that cannot find enough buyers at the long end, and about hyperscalers borrowing in the same part of the curve. A stablecoin network owned by the two largest card schemes does nothing for the 30-year. Reserves sit in bills, not bonds. But it does give Washington a growing buyer at the front end that does not haggle over price, which makes it easier to lean on short-dated borrowing. That is the context for reports that the administration is exploring ways to push dollar stablecoins abroad.
Our read : the stablecoin contest has stopped being about who has the most trusted dollar and become a bidding war for distribution. That is good for merchants and platforms, uncomfortable for Circle’s margin, and a slow problem for bank deposits. For Bitcoin it changes nothing this week, which is the same point we made about Korea and perpetuals : the rails can spread without the asset moving. The places that do feel it are the chains that carry the supply.
3. Macro Backdrop
1. PCE: The Good Number Has an Asterisk
Today’s print looked like a gift.
Core PCE for August: 3.0% over twelve months, against 3.3% expected.Headline PCE: 3.4%, against 3.7% expected.Second-quarter GDP was revised up to 2.2% from 1.5%.Kalshi now prices a 65% chance of no hike at the October meeting and 31% for another 25bp. On Monday the market leaned the other way, at roughly 56% for a hike.
Now the asterisk. Starting with this release, the US changed how three PCE categories are measured and revised the data back to 2021.
Portfolio management and investment advice. This is the big one. If an adviser charges 1% of assets and the portfolio rises 20%, the fee in dollars rises 20% even though the adviser never raised the rate. The old method counted part of that as a price increase. The new one estimates the quantity of service from employment data instead.Computer software and accessories now use a broader composite.Legal services drop an unpublished CPI series that had become “unusually volatile”.
Estimates of what the method change alone takes off core PCE start at around 20 basis points. Fundstrat argued beforehand for 0.2 to 0.4 percentage points.
Here is the arithmetic that matters. July was first reported at 3.7% headline and 3.3% core. Those were the numbers on Warsh’s desk at Jackson Hole. Both were revised down today by 30 basis points, to 3.4% and 3.0%. August came in at 3.4% and 3.0%.
So the forecasts of 3.7% and 3.3% were forecasts that nothing had changed since July on the old yardstick. And nothing had changed since July, on the new one. The beat is the revision. Like for like, inflation moved sideways.
That does not make it meaningless.
The Fed targets PCE as published. A lower level is a lower level, and it sits 30bp closer to where Warsh wants it.There was a genuine oddity in the old method. A stock market rally was being counted as inflation, and that inflation was then used to justify the rates that weigh on stocks. That loop has been cut.But a change of yardstick does not make petrol cheaper. August core CPI still rose 0.3% on the month, producer prices 0.4%, and the energy shock we described two weeks ago lands in September’s data, not August’s.
We do not read the whole 30 basis points as disinflation. Part of it is a ruler being swapped. The market’s first reaction has been to take the number at face value. Its second usually involves reading the footnotes.
2. Hormuz: A Road Map Is Not a Reopened Strait
When we last wrote, Brent had touched $109.80 and all three of Saudi Arabia’s export routes were under pressure. Two things changed.
Saudi Arabia worked to restore its damaged pipeline capacity, which eased the most urgent of our three countdowns.On 24 September US and Iranian negotiators met in New York to discuss a phased deal: Iran reopens Hormuz, Washington lifts the naval blockade it has run since July. Tehran offered to reopen the strait within seven days if the blockade is lifted, its assets are unfrozen and hostilities end on all fronts. It even parked its demand for transit fees in a side agreement. That is a real concession.
Brent eased to around $104-105 by Friday and WTI slid towards the low $90s. Then on Monday President Trump rejected the seven-day proposal, and Brent was back above $106 that morning.
We would be careful with the optimism, for three reasons.
This is not the first time in 2026 that Hormuz has looked close to reopening. June’s Islamabad memorandum promised exactly this and collapsed within weeks.Two crew members were injured in unattributed strikes in the strait on 21 September, three days before the talks began.Nothing about the structure of the conflict has changed. Both sides still dispute who controls the water.
A road map is not a ceasefire, and a ceasefire is not a reopened strait.
For crypto the geopolitics matter less than what oil does to the Fed’s maths. Warsh named rising oil as one of his reasons to act. If crude drifts lower through October, one leg of the hawkish case goes with it. If Brent holds above $100, the October hike stays live whatever today’s PCE said. A Hormuz headline in either direction now matters more to Bitcoin than any single data release. Monday proved it.
3. Bonds, Jobs and the Truce
The 10-year is around 5%, having dipped just under late last week as oil eased. The 30-year is near 5.3%. This is still a term premium problem rather than a Fed problem, and one soft inflation print with a footnote attached does not change that.ADP reported 90,000 private-sector jobs added in September, against estimates of 70,000 to 73,000 and a revised 36,000 in August. Education and health added 55,000, leisure and hospitality 22,000, while financial activities lost 16,000. Base pay is growing 3.2% a year. The official report lands Friday. After August’s 162,000 against a consensus near 56,000, nobody should take the forecast on trust.Put the pieces together and the Fed has a lower inflation number, a stronger growth number and a labour market that is not cracking. That is an argument for patience in October, not for cuts.President Trump and President Xi extended the trade truce to 10 January 2027, with tariff relief on about $30 billion of goods each way, a Chinese commitment to buy at least 10 million tons of US coal in each of 2027 and 2028, and a working group on AI. Nothing on rare earths, nothing on advanced chips, and a $14 billion Taiwan arms package still under review. The market’s verdict was “at least it is not worse”, which in this environment is enough.The Bank of Japan’s move to 1.25% takes its policy rate to the highest since 1995. With the ECB and the Fed also tightening this month, the yen funding that fed risk trades for years is getting dearer at the same time as dollars.One date to keep in view: the Treasury’s enlarged buyback programme is still scheduled to end on 4 November, the day after the midterms and a week after the next Fed decision.
4. ETF Insights
The marginal buyer came back but faded fast. Bitcoin ETFs took in $2.39B last week, their strongest week since October 2025, with Monday alone bringing $999M, led by BlackRock’s IBIT. But the pace deteriorated sharply:$999M → $715M → $347M → $195M → $134M from Monday to Friday. Buying fell 87% across the week, and Bitcoin followed the same pattern, peaking Monday before drifting lower even as money continued to arrive
ETF demand has turned the year positive, but $82K is the level that matters. By July 13, Bitcoin ETFs were $5.69B in the red for 2026; roughly $6B has since flowed back. Spot ETFs now hold around 1.27M BTC, close to 6% of all Bitcoin ever mined. Analysts estimate the average ETF investor entered around $82K, which also lines up with May’s high — making the level both a technical marker and a potential institutional break-even point.The buying is absorbing real profit-taking. CryptoQuant shows short-term holders sending roughly 47,600 BTC ($4B+) to exchanges as Bitcoin approached $88K, consistent with investors taking profits. Glassnode’s SOPR remains above 1, suggesting coins are still being sold at a gain without overwhelming the market. Meanwhile, Monday’s $1.06B in liquidations, including $844M of shorts, added forced buying but this time voluntary ETF demand was nearly three times larger. Wallets holding 100–1,000 BTC have also accumulated 113,950 BTC since mid-July.Although unusually large ETF inflows have historically appeared near local peaks, while Bitcoin open interest is now higher than on roughly 92% of days over the past three months. In other words, the rally has both genuine spot demand and leverage behind it. Ether ETFs added $270M on Monday alone, so the next question is whether that demand broadens beyond Bitcoin
5. The Week Ahead
The data calendar is light by recent standards and the headline calendar is not. Oil decides October, and oil is being decided in a negotiating room.
6. Conclusion
The Crypto Fear & Greed Index read 78 on Monday, which it labels Extreme Greed, up from 69 when we last wrote. A month and a half ago it was in Fear.
Wintermute’s desk data adds a number to that feeling: altcoin breadth is stretched to levels that have been followed by flat-to-negative weeks more than 80% of the time, though early in a cycle the exceptions come more often.
The honest framing of where we are. Bitcoin has done the thing it failed to do three times since August. It cleared $82,000, closed a week above the May high, and did it with the Fed hiking and the 10-year at 5%. That is either the start of a different regime or macro pressure arriving late. One week of evidence cannot tell those apart.
It has also not cleared the supply wall we have been describing since August. It pushed through the top of it to $87,400, met more than $4 billion of coins heading to exchanges, and closed in the middle at $84,457. Bitcoin is inside the wall, not through it.
The levels that now decide it:
$82,000-84,000 is the retest zone. It was the May ceiling and it is the average ETF buyer’s cost. It now has to act as a floor, and it will probably be tested more than once.About $74,900 is the structure line, the most recent weekly swing low. Regular readers will recognise it. It is where Bitcoin bottomed on the day the Senate voted down CLARITY. The weekly bull market support band, roughly $70,600-74,500, sits just beneath. A decisive weekly close below that zone says the reversal is failing.About $85,000 is JPMorgan’s estimate of what it costs to mine a bitcoin. Hold above it and the steadiest forced seller in the market gets relief.$89,500-90,000 is the ceiling overhead.
The order of confirmation is breakout, hold, continuation. Bitcoin has done the first. The second starts now.
In August the bull case was a fiscal story. Two weeks ago we called it narrower. Today it has a second leg it did not have then: real money that showed up days after a rate hike, with the 10-year at 5%, and kept showing up for five straight sessions. Against that sit an inflation print flattered by a change of ruler, oil back above $106 and one bad headline from $110, daily inflows that shrank every day last week, and sentiment at Extreme Greed.
The takeaway is simple: do not chase $87,000, let $82,000 prove itself as a floor, and size for an oil headline rather than a data point. Tonight’s quarterly close and Friday’s payrolls will say more than we can.
2
603
·
--
$BTC
🎯 $85,200 Liquidity Taken Out
A new liquidity cluster has formed slightly higher at $85,500.
At the same time, a significant amount of liquidity remains untouched below the current price.
{future}(BTCUSDT)
$BTC
🎯 $85,200 Liquidity Taken Out
A new liquidity cluster has formed slightly higher at $85,500.
At the same time, a significant amount of liquidity remains untouched below the current price.
🎯 $85,200 Liquidity Taken Out
A new liquidity cluster has formed slightly higher at $85,500.
At the same time, a significant amount of liquidity remains untouched below the current price.
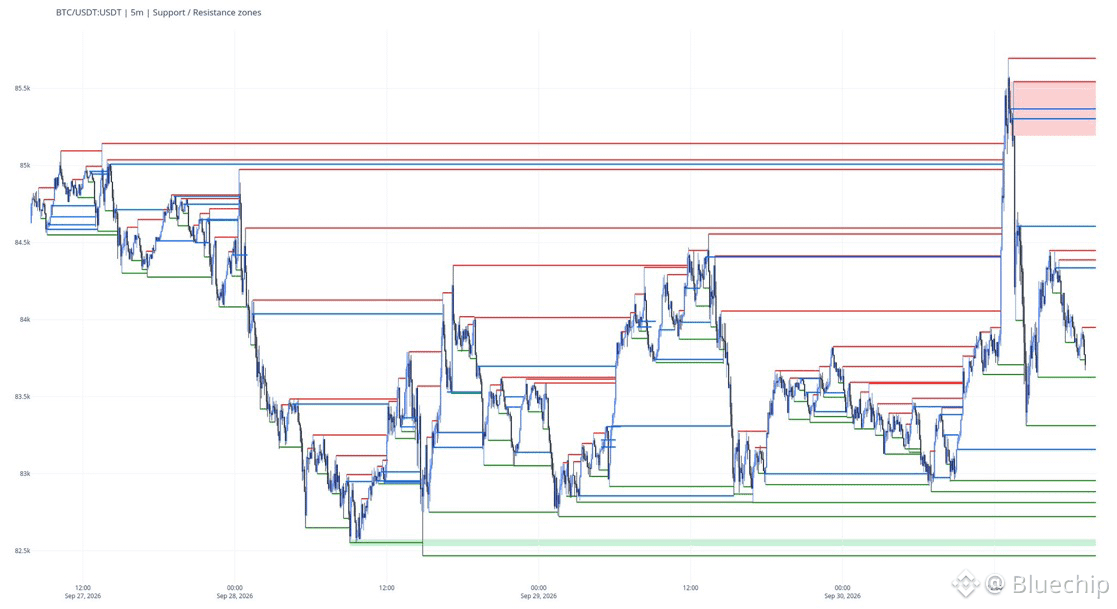
Bluechip
·
--
$BTC
This is where liquidity is stacked 👀
Above: $85,200
Below: $79,000
This is where liquidity is stacked 👀
Above: $85,200
Below: $79,000
4
758
·
--
$ETH has nice liquidation walls, lets see them fall 🔥️️️️️️
{future}(ETHUSDT)
$ETH has nice liquidation walls, lets see them fall 🔥️️️️️️
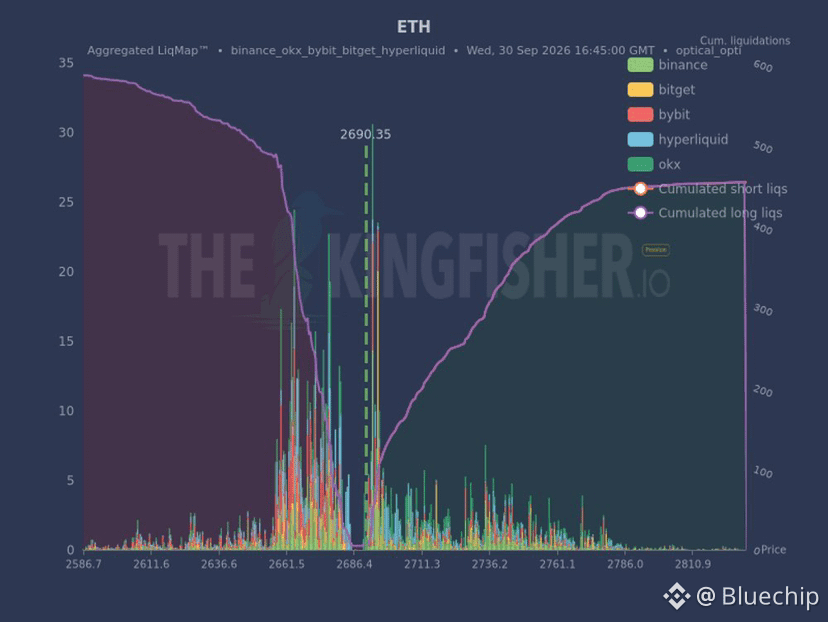
4
3
2.8k
·
--
Short Term Holder momentum is weakening again.
The 30D Short Term Holder Net Position Change is now very close to negative territory, meaning STHs are no longer accumulating at the same pace they were 30 days ago. This can point to weaker buying pressure or a longer consolidation phase.
If the metric turns deeply negative, it can also precede faster downside moves, so Exchange Netflow becomes important here. For now, we are not seeing significant BTC inflows into exchanges, which keeps the signal relatively neutral.
Onchain usually starts showing these shifts before the market narrative catches up. Better to follow the data than turn bullish or bearish too early.
{spot}(BTCUSDT)
Short Term Holder momentum is weakening again.
The 30D Short Term Holder Net Position Change is now very close to negative territory, meaning STHs are no longer accumulating at the same pace they were 30 days ago. This can point to weaker buying pressure or a longer consolidation phase.
If the metric turns deeply negative, it can also precede faster downside moves, so Exchange Netflow becomes important here. For now, we are not seeing significant BTC inflows into exchanges, which keeps the signal relatively neutral.
Onchain usually starts showing these shifts before the market narrative catches up. Better to follow the data than turn bullish or bearish too early.
The 30D Short Term Holder Net Position Change is now very close to negative territory, meaning STHs are no longer accumulating at the same pace they were 30 days ago. This can point to weaker buying pressure or a longer consolidation phase.
If the metric turns deeply negative, it can also precede faster downside moves, so Exchange Netflow becomes important here. For now, we are not seeing significant BTC inflows into exchanges, which keeps the signal relatively neutral.
Onchain usually starts showing these shifts before the market narrative catches up. Better to follow the data than turn bullish or bearish too early.
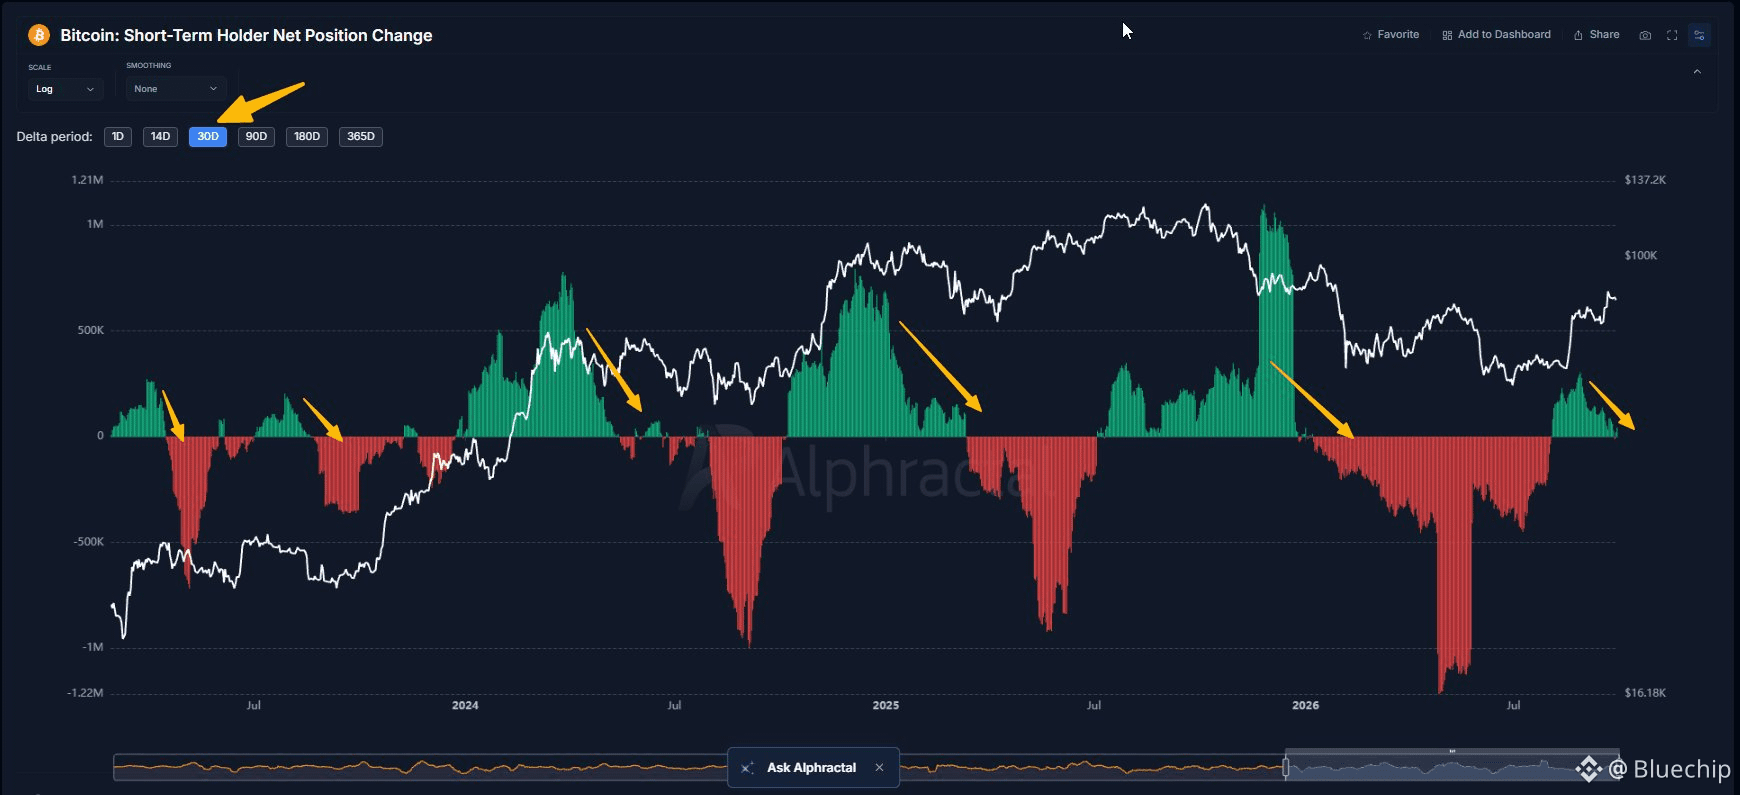
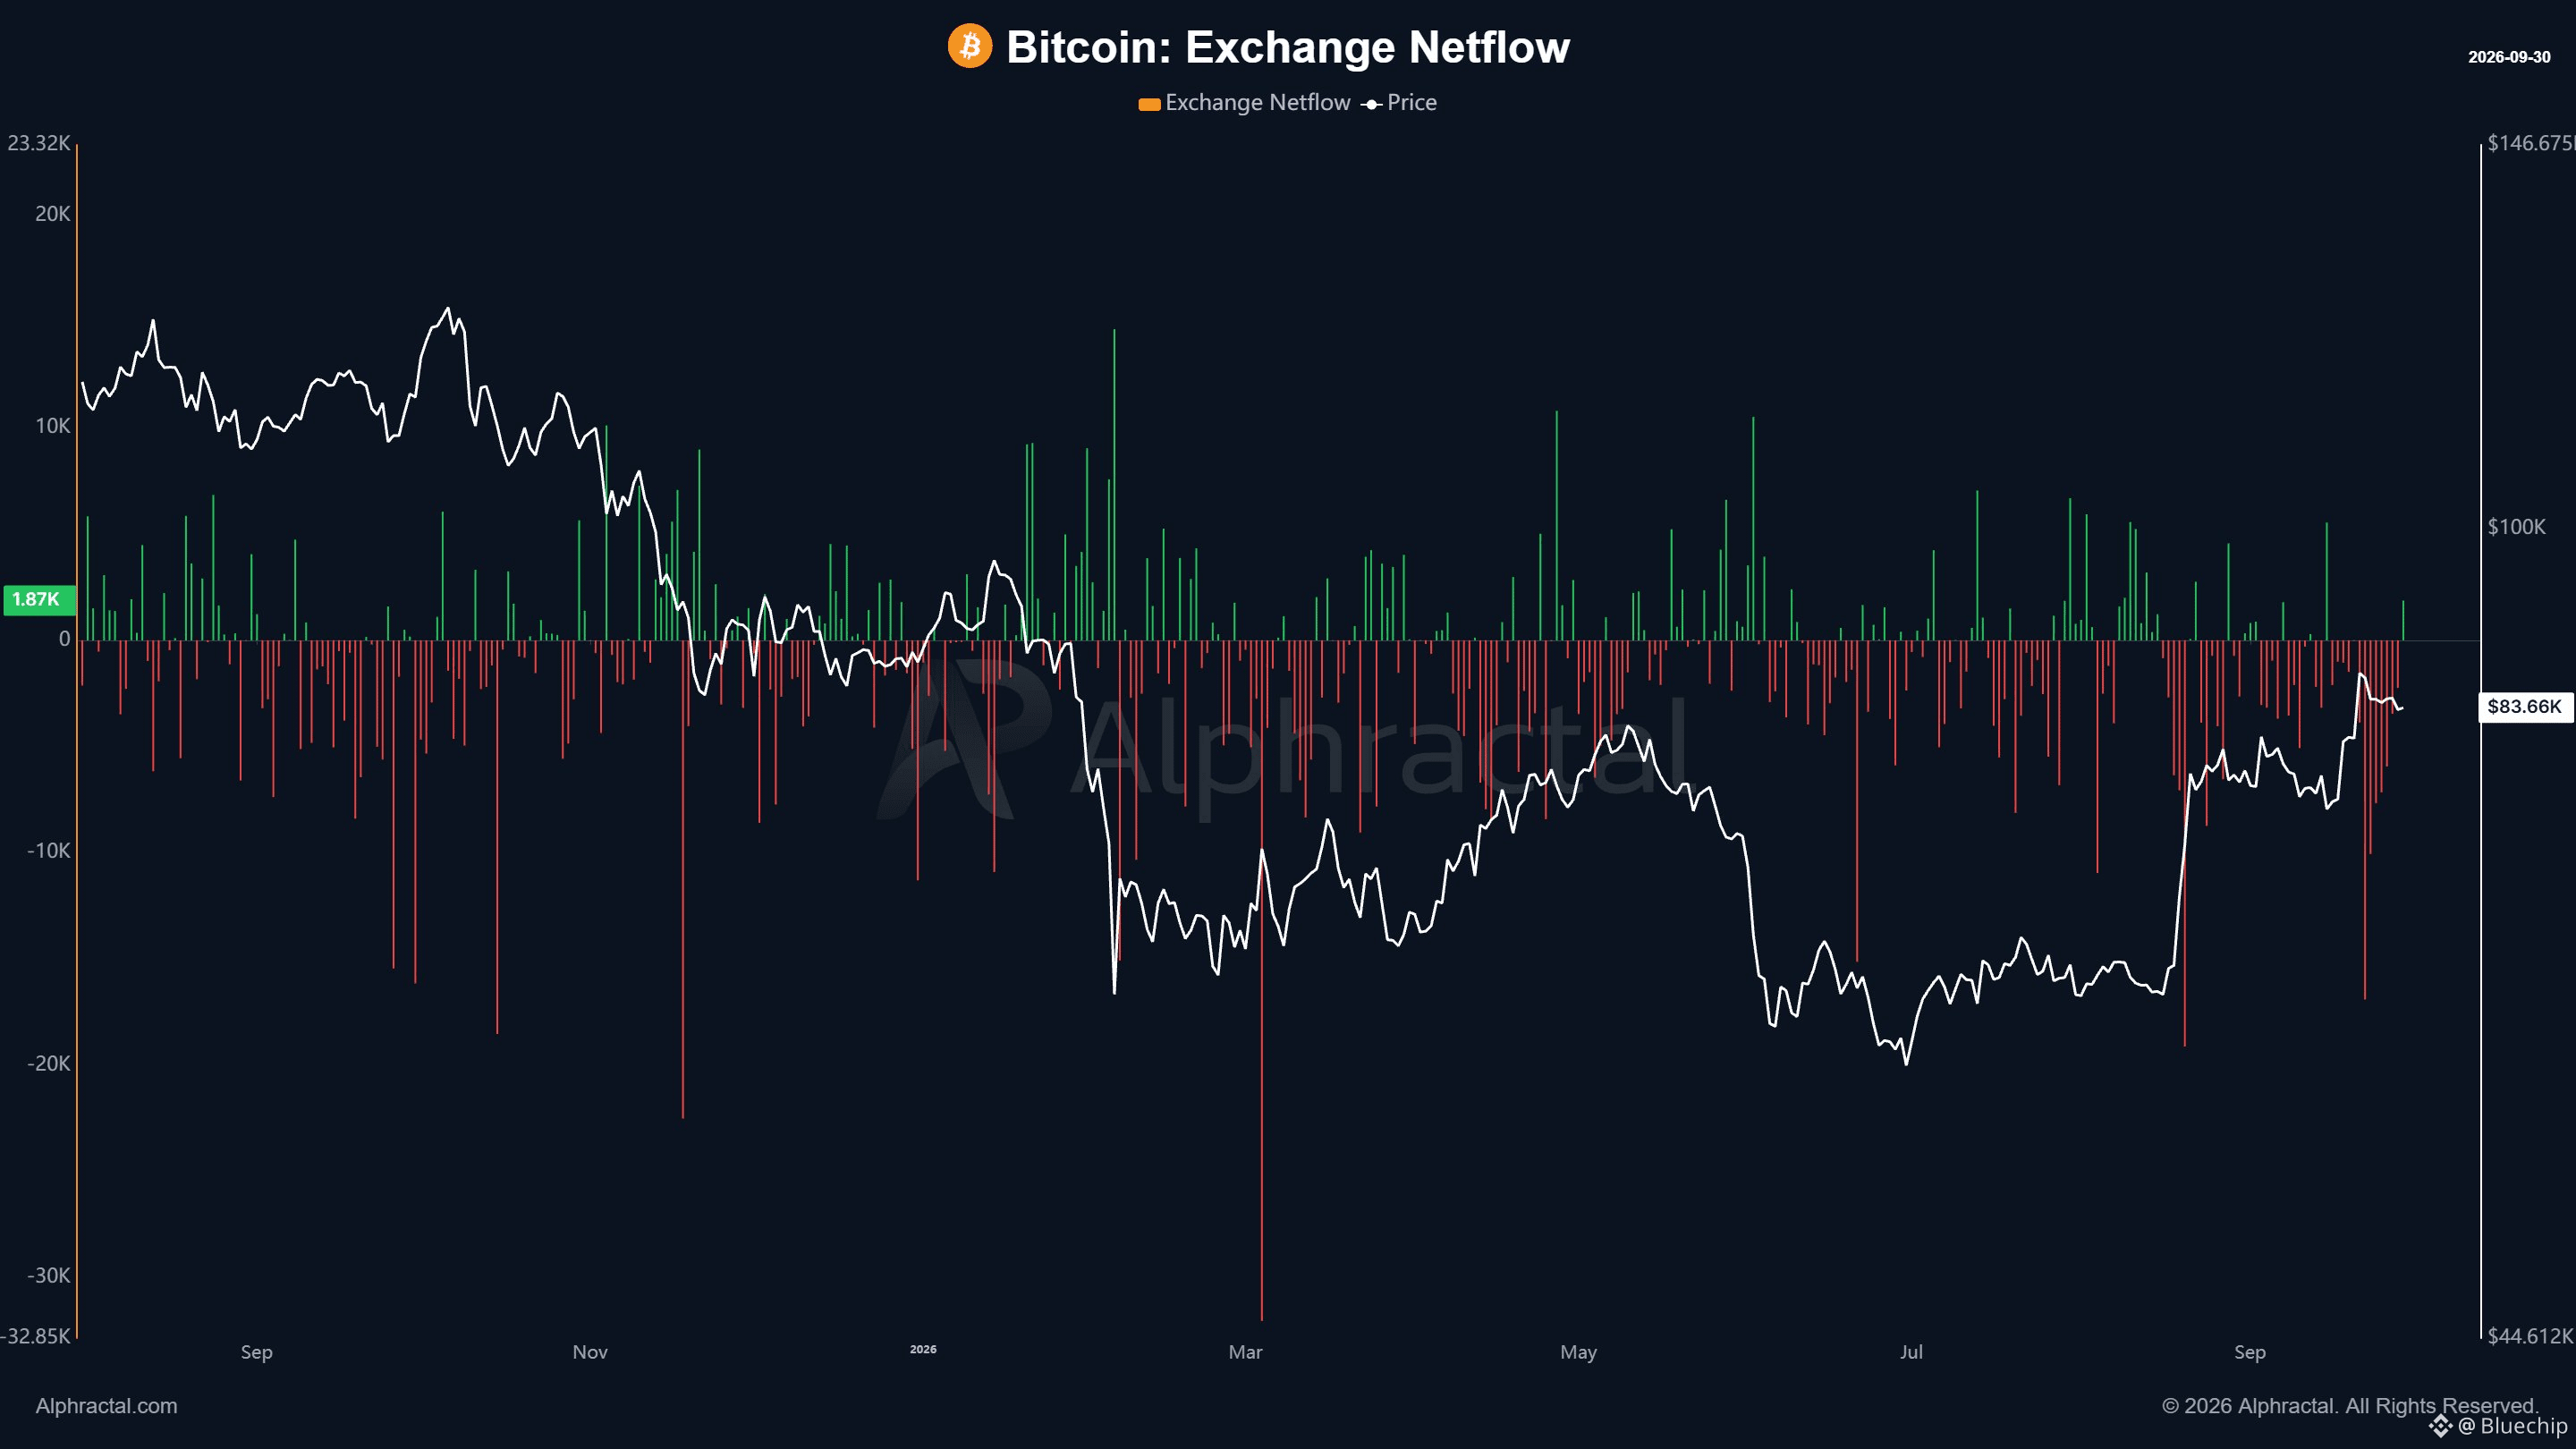
4
402
·
--
Crypto is starting to ignore traditional markets again.
The correlation is breaking down, and the behavior is beginning to look a lot like the early days of crypto, when this market simply moved on its own.
Stocks can rally.
Macro can scream.
Traditional markets can do whatever they want.
Crypto is increasingly trading by its own rules.
And that is exactly what makes this market interesting again.
Crypto is starting to ignore traditional markets again.
The correlation is breaking down, and the behavior is beginning to look a lot like the early days of crypto, when this market simply moved on its own.
Stocks can rally.
Macro can scream.
Traditional markets can do whatever they want.
Crypto is increasingly trading by its own rules.
And that is exactly what makes this market interesting again.
The correlation is breaking down, and the behavior is beginning to look a lot like the early days of crypto, when this market simply moved on its own.
Stocks can rally.
Macro can scream.
Traditional markets can do whatever they want.
Crypto is increasingly trading by its own rules.
And that is exactly what makes this market interesting again.
2
7
983
·
--
Finally… some good news for the markets. U.S. inflation came in below expectations.
Today’s PCE report, the Fed’s preferred inflation gauge, came in better than expected.
🟢 Core PCE: 0.2%
🔴 Expected: 0.3%
In other words, inflation came in cooler than expected.
Why does this matter?
Because softer inflation means less pressure on the Fed to keep monetary policy tight.
And if this trend continues, we could see:
📉 Bond yields
📉 The dollar
📈 Gold $XAUT
📈 Stocks
📈 Crypto $BTC
In simple terms:
Lower inflation → less pressure on the Fed → easier financial conditions → support for risk assets.
But don’t get ahead of the market.
One inflation print doesn’t mean the road is now clear for rate cuts.
The real question is:
Will upcoming data confirm that inflation is actually moving toward 2%… or was this just a temporary positive surprise?
Watch yields and the dollar before chasing the move.
{future}(XAUTUSDT)
{future}(BTCUSDT)
Finally… some good news for the markets. U.S. inflation came in below expectations.
Today’s PCE report, the Fed’s preferred inflation gauge, came in better than expected.
🟢 Core PCE: 0.2%
🔴 Expected: 0.3%
In other words, inflation came in cooler than expected.
Why does this matter?
Because softer inflation means less pressure on the Fed to keep monetary policy tight.
And if this trend continues, we could see:
📉 Bond yields
📉 The dollar
📈 Gold $XAUT
📈 Stocks
📈 Crypto $BTC
In simple terms:
Lower inflation → less pressure on the Fed → easier financial conditions → support for risk assets.
But don’t get ahead of the market.
One inflation print doesn’t mean the road is now clear for rate cuts.
The real question is:
Will upcoming data confirm that inflation is actually moving toward 2%… or was this just a temporary positive surprise?
Watch yields and the dollar before chasing the move.
Today’s PCE report, the Fed’s preferred inflation gauge, came in better than expected.
🟢 Core PCE: 0.2%
🔴 Expected: 0.3%
In other words, inflation came in cooler than expected.
Why does this matter?
Because softer inflation means less pressure on the Fed to keep monetary policy tight.
And if this trend continues, we could see:
📉 Bond yields
📉 The dollar
📈 Gold $XAUT
📈 Stocks
📈 Crypto $BTC
In simple terms:
Lower inflation → less pressure on the Fed → easier financial conditions → support for risk assets.
But don’t get ahead of the market.
One inflation print doesn’t mean the road is now clear for rate cuts.
The real question is:
Will upcoming data confirm that inflation is actually moving toward 2%… or was this just a temporary positive surprise?
Watch yields and the dollar before chasing the move.
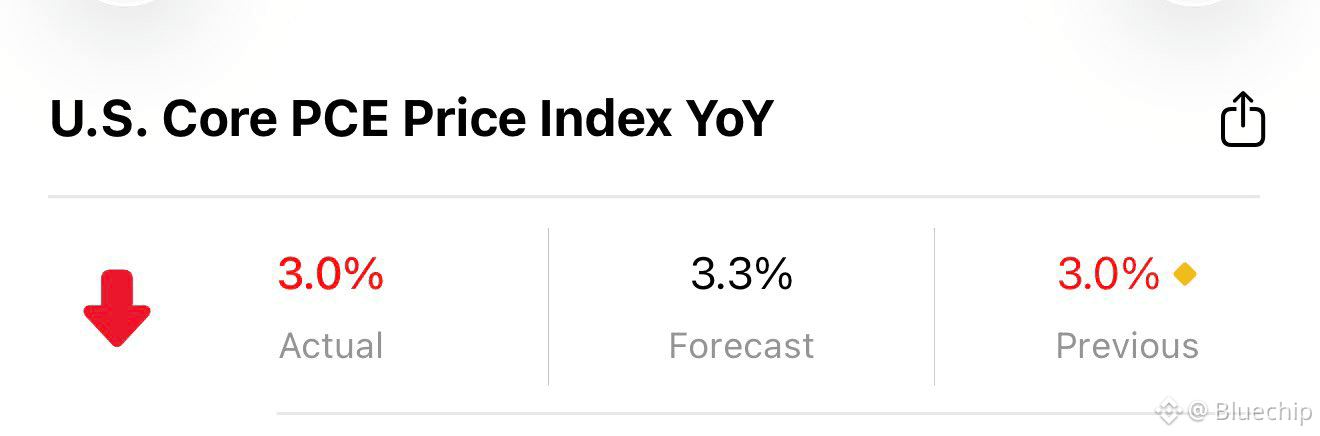
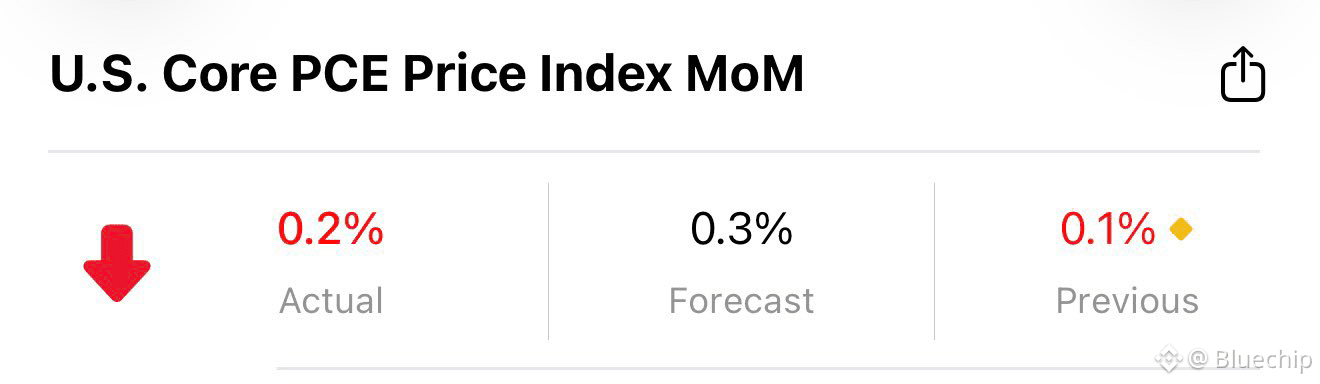
1
3
1k
·
--
$85.5K JUST GOT RECLAIMED. THE RANGE IS BREAKING.
$BTC is holding $85,478 after tagging a high of $87,471 and spending days chopping underneath.
The 1H just printed the reclaim. Price flushed toward $80,587, bashed around $83k–$85k, then ran the mid-line in one push. Volume $2.52B. OI $2.87B. $36.05M liquidated.
$85,480 is the level they lost and just took back.
{future}(BTCUSDT)
$85.5K JUST GOT RECLAIMED. THE RANGE IS BREAKING.
$BTC is holding $85,478 after tagging a high of $87,471 and spending days chopping underneath.
The 1H just printed the reclaim. Price flushed toward $80,587, bashed around $83k–$85k, then ran the mid-line in one push. Volume $2.52B. OI $2.87B. $36.05M liquidated.
$85,480 is the level they lost and just took back.
$BTC is holding $85,478 after tagging a high of $87,471 and spending days chopping underneath.
The 1H just printed the reclaim. Price flushed toward $80,587, bashed around $83k–$85k, then ran the mid-line in one push. Volume $2.52B. OI $2.87B. $36.05M liquidated.
$85,480 is the level they lost and just took back.
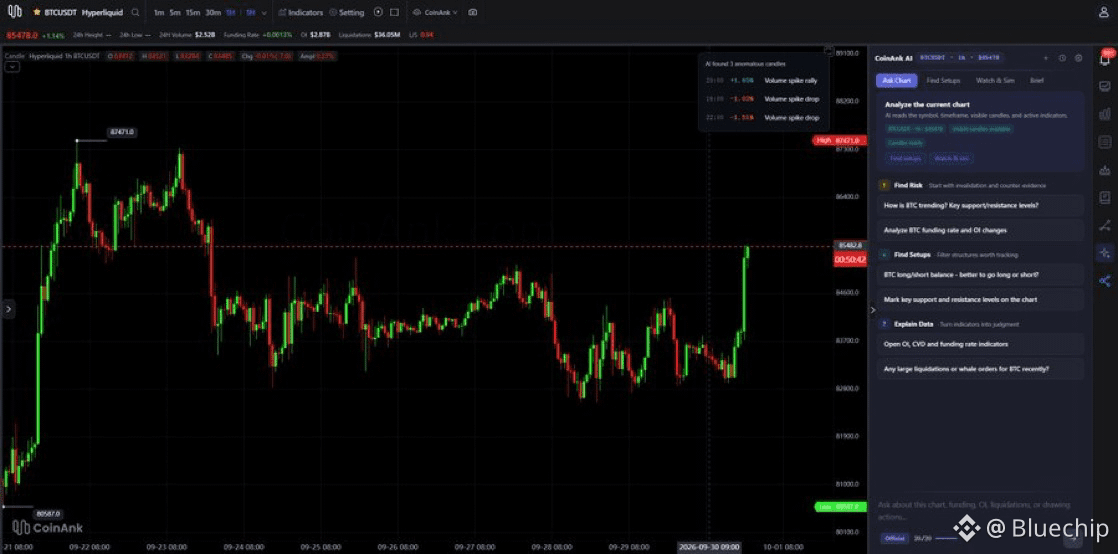
2
3
1.5k
·
--
$BTC is holding 83K. The flow underneath has been selling since the 87.4K top.
Market sellers own this range. Resting bids on both books keep absorbing them.
- Spot CVD -375.9M
- Perp CVD -903.23M
- Coinbase Premium -0.04%, red almost the entire window
- Depth delta +455 spot, +3.5K perps
- Funding -0.0013%, OI 7.79B flat
Bids are doing the job US spot buyers refuse to do. If 82.4K gives, the next real liquidity sits near 80K.
{future}(BTCUSDT)
$BTC is holding 83K. The flow underneath has been selling since the 87.4K top.
Market sellers own this range. Resting bids on both books keep absorbing them.
- Spot CVD -375.9M
- Perp CVD -903.23M
- Coinbase Premium -0.04%, red almost the entire window
- Depth delta +455 spot, +3.5K perps
- Funding -0.0013%, OI 7.79B flat
Bids are doing the job US spot buyers refuse to do. If 82.4K gives, the next real liquidity sits near 80K.
Market sellers own this range. Resting bids on both books keep absorbing them.
- Spot CVD -375.9M
- Perp CVD -903.23M
- Coinbase Premium -0.04%, red almost the entire window
- Depth delta +455 spot, +3.5K perps
- Funding -0.0013%, OI 7.79B flat
Bids are doing the job US spot buyers refuse to do. If 82.4K gives, the next real liquidity sits near 80K.
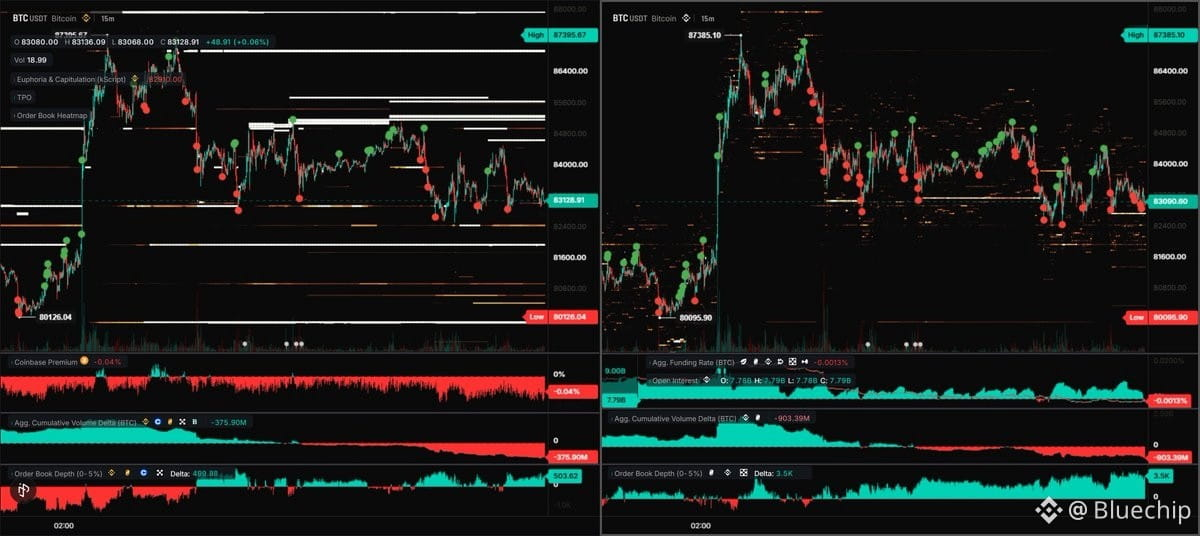
2
8
1.3k
·
--
An interesting relationship in Bitcoin positioning:
Bitcoin tends to show more strength when its Top Trader Long/Short Ratio is below the Total Crypto ratio.
When Bitcoin’s ratio moves above the broader crypto market, BTC has historically shown more weakness.
In other words, excessive Long positioning in Bitcoin can become a warning signal rather than a confirmation of strength.
Worth monitoring this divergence closely.
An interesting relationship in Bitcoin positioning:
Bitcoin tends to show more strength when its Top Trader Long/Short Ratio is below the Total Crypto ratio.
When Bitcoin’s ratio moves above the broader crypto market, BTC has historically shown more weakness.
In other words, excessive Long positioning in Bitcoin can become a warning signal rather than a confirmation of strength.
Worth monitoring this divergence closely.
Bitcoin tends to show more strength when its Top Trader Long/Short Ratio is below the Total Crypto ratio.
When Bitcoin’s ratio moves above the broader crypto market, BTC has historically shown more weakness.
In other words, excessive Long positioning in Bitcoin can become a warning signal rather than a confirmation of strength.
Worth monitoring this divergence closely.
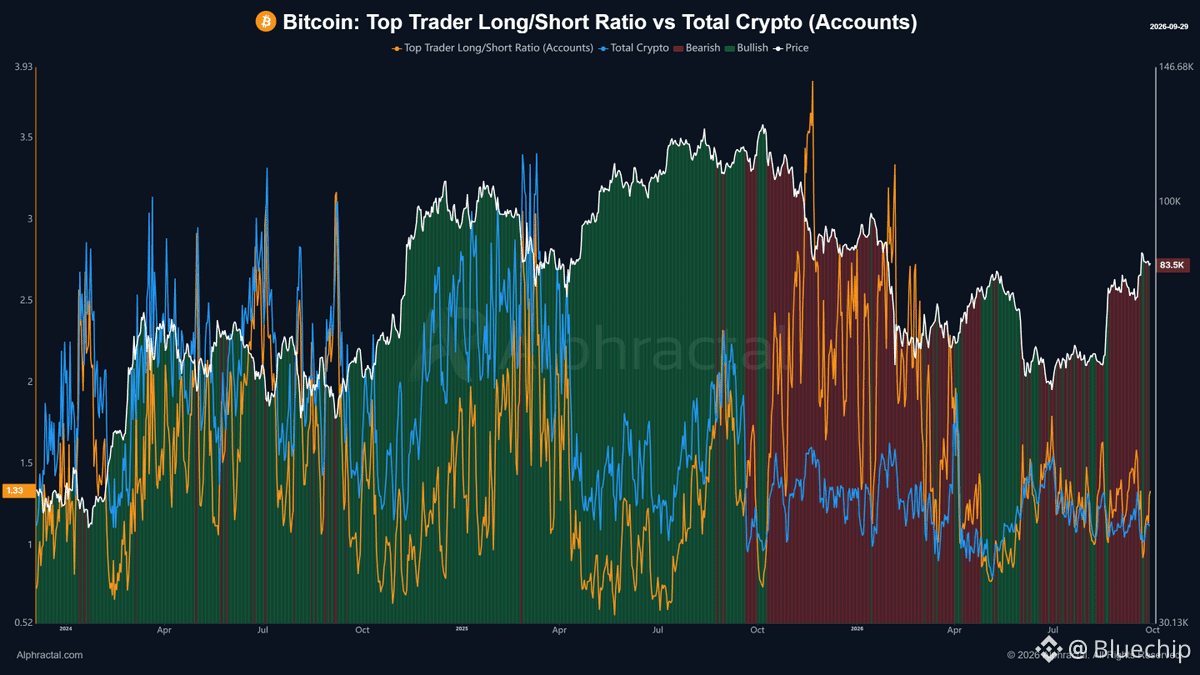
1
7
1.3k
·
--
$BTC I’m watching BTC’s $85–86K zone, where the strongest concentration sits on the chart. Below, I’m keeping an eye on $81–82K.
I expect the upper cluster to be tested first. If we get there, the price reaction will be key
{future}(BTCUSDT)
$BTC I’m watching BTC’s $85–86K zone, where the strongest concentration sits on the chart. Below, I’m keeping an eye on $81–82K.
I expect the upper cluster to be tested first. If we get there, the price reaction will be key
I expect the upper cluster to be tested first. If we get there, the price reaction will be key
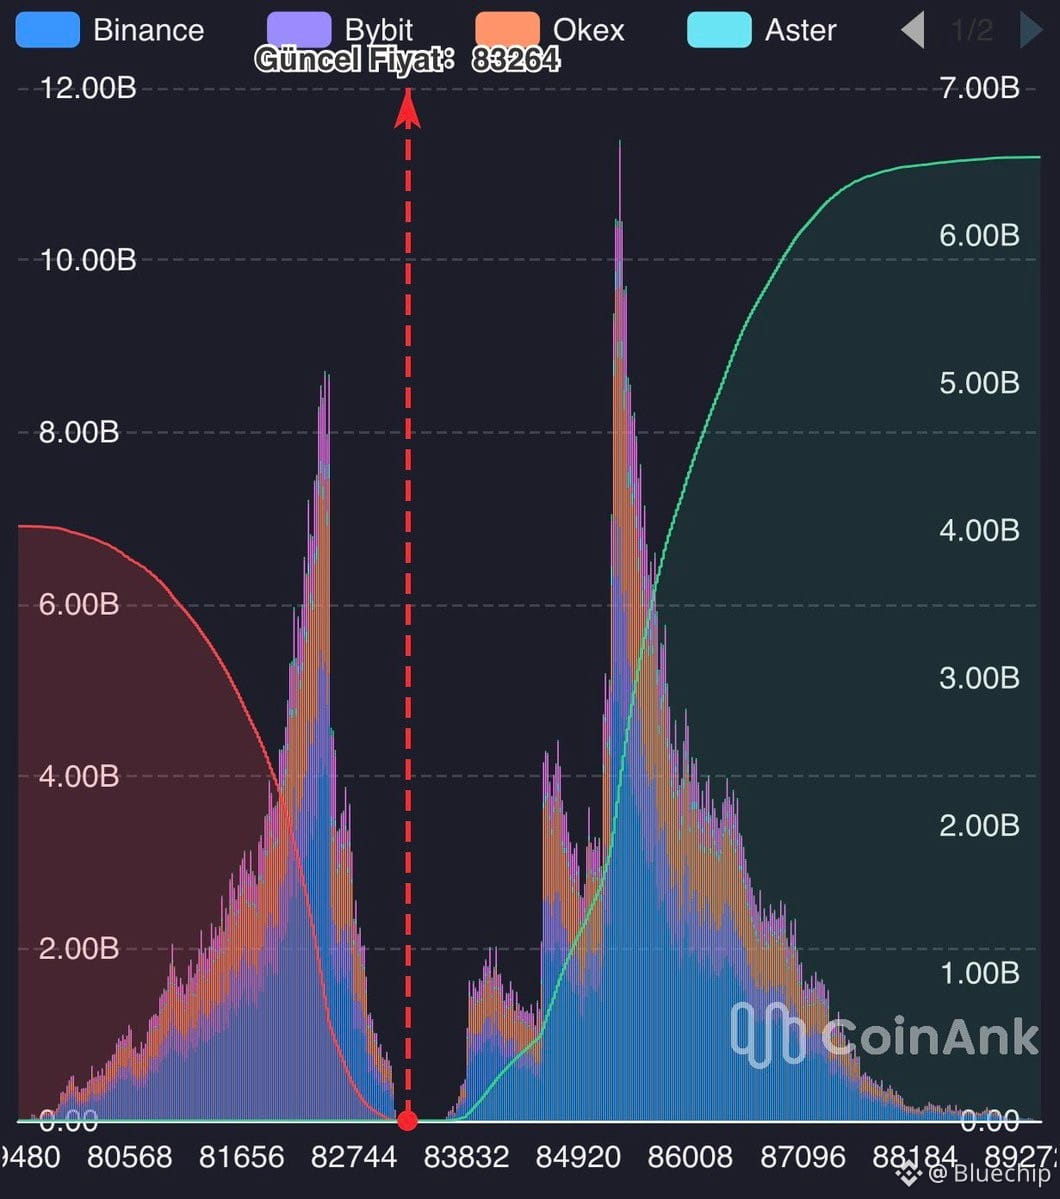
Bluechip
·
--
$BTC
This is where liquidity is stacked 👀
Above: $85,200
Below: $79,000
This is where liquidity is stacked 👀
Above: $85,200
Below: $79,000
1
6
758
·
--
When a coin you hold pumps, remember we're here to make money, not cheerlead
{future}(BNBUSDT)
When a coin you hold pumps, remember we're here to make money, not cheerlead
12
762
·
--
$BTC
The largest liquidation level from the past 365 days was cleared last week!
Now, what remains are the bulls sitting on significant unrealized profits.
Will they be liquidated too?
{future}(BTCUSDT)
$BTC
The largest liquidation level from the past 365 days was cleared last week!
Now, what remains are the bulls sitting on significant unrealized profits.
Will they be liquidated too?
The largest liquidation level from the past 365 days was cleared last week!
Now, what remains are the bulls sitting on significant unrealized profits.
Will they be liquidated too?
Bluechip
·
--
Bitcoin’s latest rally to $87K was enough to wipe out the main short positions built across the market over the past 365 days.
When filtering for the largest clusters of leveraged positions, it becomes clear how price tends to move toward these liquidity zones.
Recently, we witnessed the liquidation of the largest short liquidation pool of the year.
Now, the largest remaining unliquidated positions are concentrated on the long side.
When filtering for the largest clusters of leveraged positions, it becomes clear how price tends to move toward these liquidity zones.
Recently, we witnessed the liquidation of the largest short liquidation pool of the year.
Now, the largest remaining unliquidated positions are concentrated on the long side.
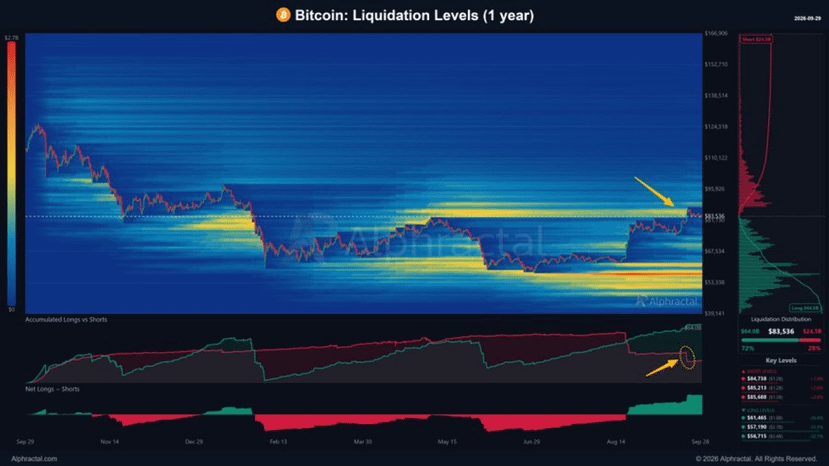
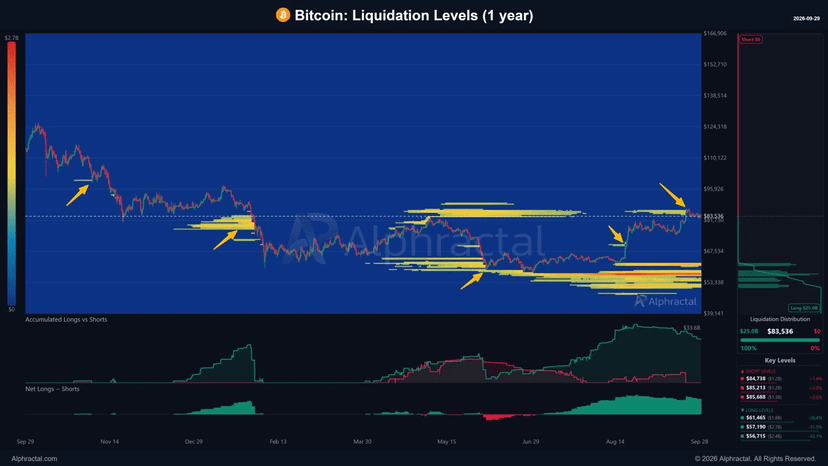
3
8
1.8k
·
--
Bitcoin’s latest rally to $87K was enough to wipe out the main short positions built across the market over the past 365 days.
When filtering for the largest clusters of leveraged positions, it becomes clear how price tends to move toward these liquidity zones.
Recently, we witnessed the liquidation of the largest short liquidation pool of the year.
Now, the largest remaining unliquidated positions are concentrated on the long side.
Bitcoin’s latest rally to $87K was enough to wipe out the main short positions built across the market over the past 365 days.
When filtering for the largest clusters of leveraged positions, it becomes clear how price tends to move toward these liquidity zones.
Recently, we witnessed the liquidation of the largest short liquidation pool of the year.
Now, the largest remaining unliquidated positions are concentrated on the long side.
When filtering for the largest clusters of leveraged positions, it becomes clear how price tends to move toward these liquidity zones.
Recently, we witnessed the liquidation of the largest short liquidation pool of the year.
Now, the largest remaining unliquidated positions are concentrated on the long side.
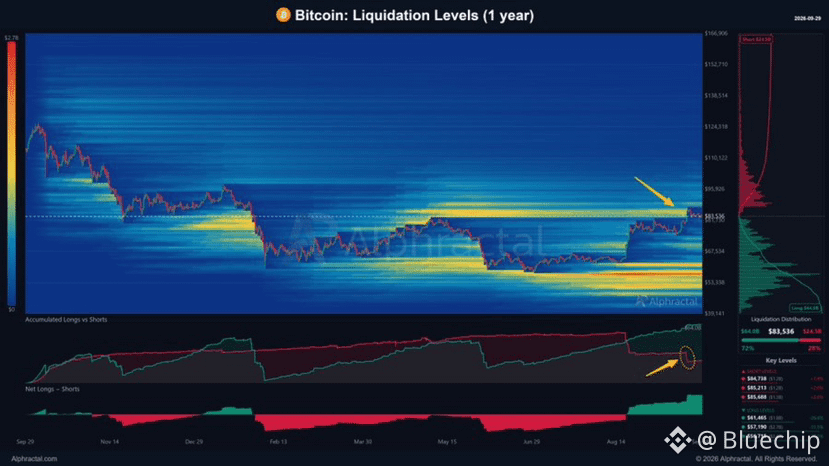
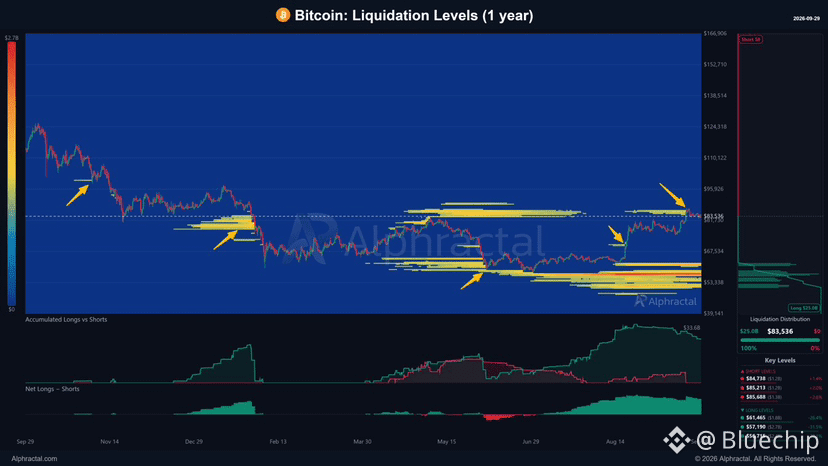
1
14
3.3k
·
--
$BTC
This is where liquidity is stacked 👀
Above: $85,200
Below: $79,000
{future}(BTCUSDT)
$BTC
This is where liquidity is stacked 👀
Above: $85,200
Below: $79,000
This is where liquidity is stacked 👀
Above: $85,200
Below: $79,000
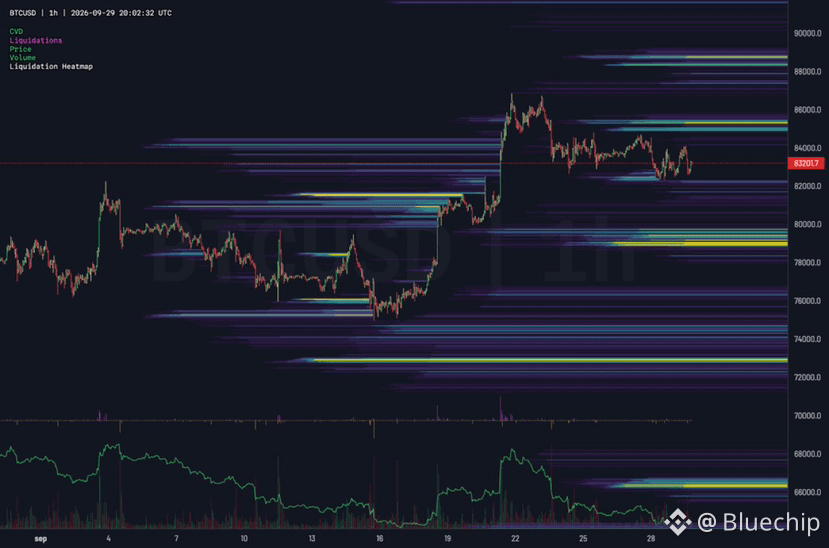
2
2
8
1.5k
·
--
Coin Days Destroyed has started rising again, indicating increased movement of $BTC that had remained inactive for longer periods.
{future}(BTCUSDT)
Coin Days Destroyed has started rising again, indicating increased movement of $BTC that had remained inactive for longer periods.
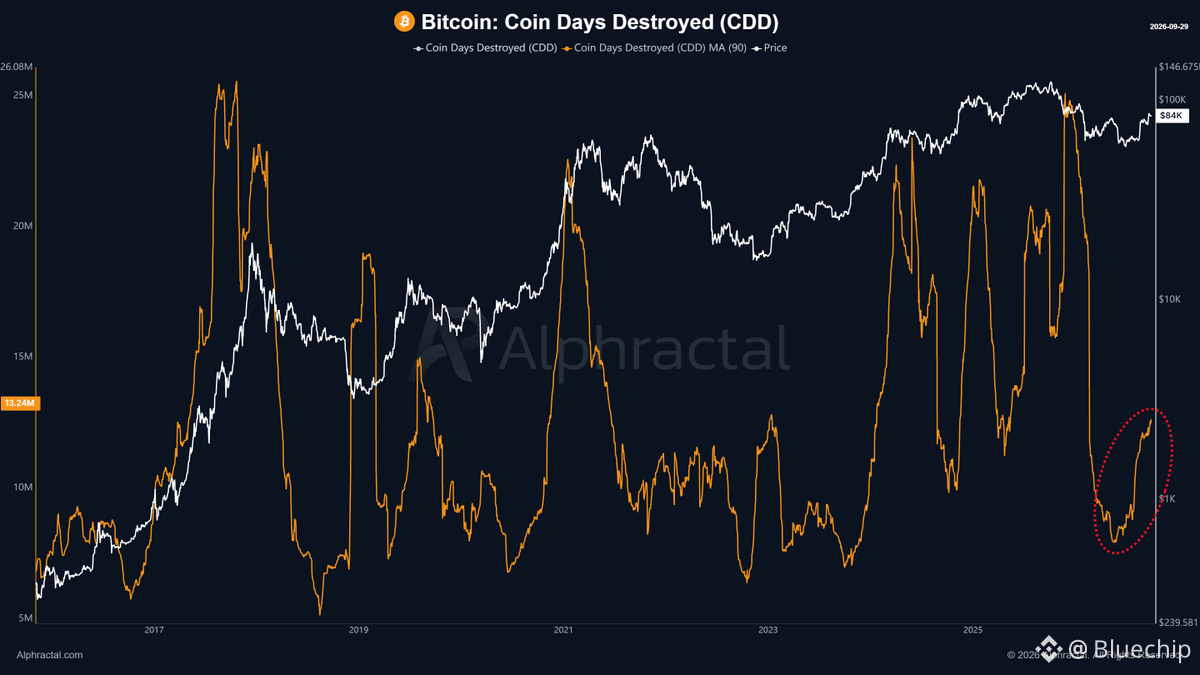
1
7
959
Connectez-vous pour découvrir plus de contenu
Rejoignez la communauté mondiale des adeptes de cryptomonnaies sur Binance Square
⚡️ Suviez les dernières informations importantes sur les cryptomonnaies.
💬 Jugé digne de confiance par la plus grande plateforme d’échange de cryptomonnaies au monde.
👍 Découvrez les connaissances que partagent les créateurs vérifiés.
Adresse e-mail/Nº de téléphone
Sujets d’actualité
EtherGains70.9%InQ3
140,658 vues
1,107 mentions
One of the best third quarters in history 💰
September closed out last night, and with it, the quarter. For the quarter, BTC is up 42%—the second-best Q3 on record. ETH had a record-breaking Q3 overall, up 70%.
Looking at the chart, things are still looking good: we’re holding support, but we’re testing it more and more often. Plus, ETF momentum is weakening — inflows are gradually declining, and yesterday saw outflows for the first time in a long while.
Yes, historically, October has been a good month for crypto — it’s not called “Uptober” for nothing. But it’s also one of the most volatile months. Last year, for example, we managed to hit a new all-time high (ATH) and experience a flash crash.
🚀 High Accuracy Trades.
$BTC
$ETH
$SOL
#EtherGains70.9%InQ3 #DollarIndexHitsHighestSinceMay2025 #CFTCSubmitsTwoEventContractRulesToWhiteHouse #MicronBeatsEarningsLiftsGuidance
Knowledge is Power
·0 mentions J’aime
·226 vues
TreasuryLetsStatesFileStablecoinCertificationsEarly
7,475 vues
78 mentions
US10YearYieldNears5.3%
144,891 vues
1,109 mentions