

Bit_Rase
29.3k Publications

Bit_Rase
 Compte Square Vérifié+
Signaler
Bloquer l’utilisateur
Crypto Enthusiast | #BTC since 2017 | NFTs, Exchanges and Blockchain Analysis #Binance kol X.🇵🇰 @X_Girlz0
Ouvert au trading
Trade régulièrement
5 an(s)
371 Suivis
43.1K+ Abonnés
110.8K+ J’aime
Publications
Portefeuille
Tous
Citations
Direct
PINNED
·
--
Vérifié
AI agents are moving beyond conversations. The next challenge is giving them the ability to take real actions, make payments, and operate within rules that humans can trust.
Think about an AI agent that needs a paid API to complete a task. It must discover the service, access the payment system, pay the correct amount, and receive the result. Without proper controls, giving an agent financial freedom creates unnecessary risks.
This is where Kite becomes interesting.
Kite Agent Passport is designed to let AI agents pay for services using a funded wallet and spending sessions approved by the owner. These sessions can define a total budget, a per-transaction limit, and an expiration time. The owner approves the session with a passkey before the agent begins spending.
That distinction matters. Real autonomy should not mean unlimited access to someone else's money.
Kite also supports x402 payments, which allow agents to access paid APIs programmatically. This creates a path toward a more connected agent economy, where software can discover services, pay for access, and complete tasks without requiring manual payment approval for every transaction.
But technology alone will not determine success. Developer adoption, service availability, security, and reliable execution will all matter. The real question is whether independent developers and businesses will build useful products on top of this infrastructure.
For me, the most important metric is not how often AI agents are discussed. It is how many useful tasks they can actually complete, with transparent payments and clear spending limits.
That is the part of the agent economy worth watching.
What do you think will be the biggest barrier to autonomous AI payments: security, adoption, or trust?
#KiteBBW $KITE
{future}(KITEUSDT)
AI agents are moving beyond conversations. The next challenge is giving them the ability to take real actions, make payments, and operate within rules that humans can trust.
Think about an AI agent that needs a paid API to complete a task. It must discover the service, access the payment system, pay the correct amount, and receive the result. Without proper controls, giving an agent financial freedom creates unnecessary risks.
This is where Kite becomes interesting.
Kite Agent Passport is designed to let AI agents pay for services using a funded wallet and spending sessions approved by the owner. These sessions can define a total budget, a per-transaction limit, and an expiration time. The owner approves the session with a passkey before the agent begins spending.
That distinction matters. Real autonomy should not mean unlimited access to someone else's money.
Kite also supports x402 payments, which allow agents to access paid APIs programmatically. This creates a path toward a more connected agent economy, where software can discover services, pay for access, and complete tasks without requiring manual payment approval for every transaction.
But technology alone will not determine success. Developer adoption, service availability, security, and reliable execution will all matter. The real question is whether independent developers and businesses will build useful products on top of this infrastructure.
For me, the most important metric is not how often AI agents are discussed. It is how many useful tasks they can actually complete, with transparent payments and clear spending limits.
That is the part of the agent economy worth watching.
What do you think will be the biggest barrier to autonomous AI payments: security, adoption, or trust?
#KiteBBW $KITE
Think about an AI agent that needs a paid API to complete a task. It must discover the service, access the payment system, pay the correct amount, and receive the result. Without proper controls, giving an agent financial freedom creates unnecessary risks.
This is where Kite becomes interesting.
Kite Agent Passport is designed to let AI agents pay for services using a funded wallet and spending sessions approved by the owner. These sessions can define a total budget, a per-transaction limit, and an expiration time. The owner approves the session with a passkey before the agent begins spending.
That distinction matters. Real autonomy should not mean unlimited access to someone else's money.
Kite also supports x402 payments, which allow agents to access paid APIs programmatically. This creates a path toward a more connected agent economy, where software can discover services, pay for access, and complete tasks without requiring manual payment approval for every transaction.
But technology alone will not determine success. Developer adoption, service availability, security, and reliable execution will all matter. The real question is whether independent developers and businesses will build useful products on top of this infrastructure.
For me, the most important metric is not how often AI agents are discussed. It is how many useful tasks they can actually complete, with transparent payments and clear spending limits.
That is the part of the agent economy worth watching.
What do you think will be the biggest barrier to autonomous AI payments: security, adoption, or trust?
#KiteBBW $KITE

24
1
29
7.5k
PINNED
·
--
Vérifié
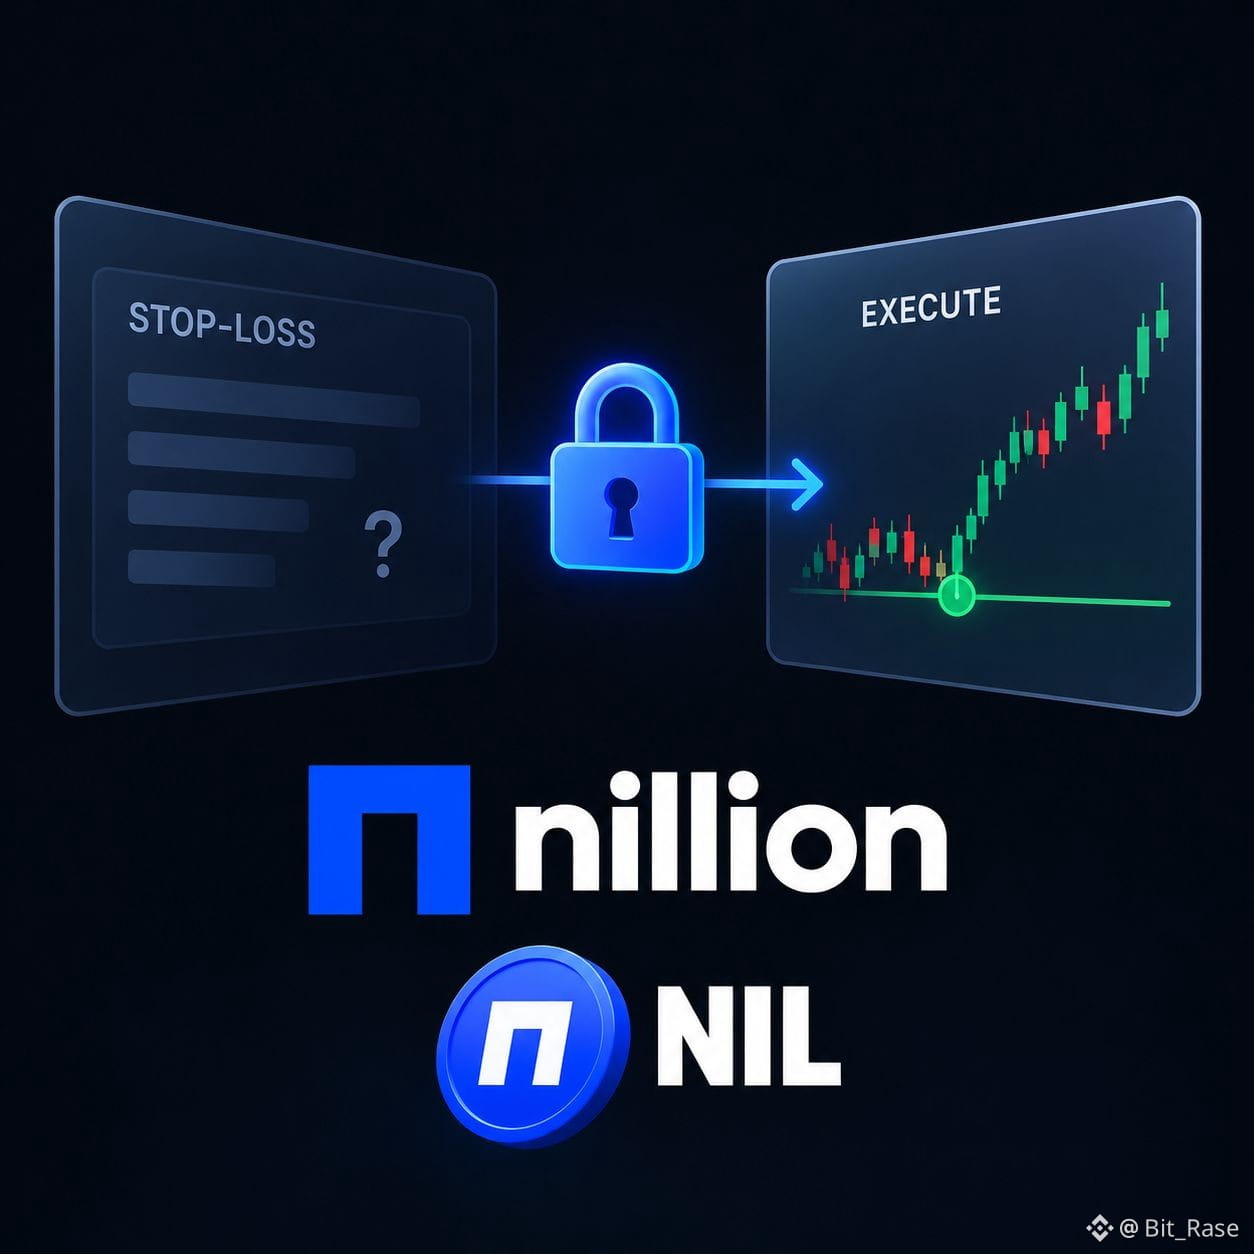
I kept thinking about how much of a trading strategy is exposed before a trade even happens. On-chain transparency sounds fair, but it also means others can study your intentions before your order executes.
That made me look at @nillionnetwork differently. Its Covenants approach focuses on keeping instructions encrypted until specific conditions are met. The interesting part isn’t just privacy. It’s removing the advantage someone gets from seeing your next move early.
Imagine setting a sell condition without revealing the level to everyone watching the chain. You wouldn’t need to trust a third party to keep your strategy hidden.
Dusk is live on Ethereum mainnet, making this idea something developers can already explore rather than just discuss.
I’m curious whether encrypted intent can change how on-chain markets behave. If strategies become harder to observe, will markets become fairer, or will new advantages simply emerge elsewhere?
#nil $NIL @nillionnetwork
I kept thinking about how much of a trading strategy is exposed before a trade even happens. On-chain transparency sounds fair, but it also means others can study your intentions before your order executes.
That made me look at @Nillion differently. Its Covenants approach focuses on keeping instructions encrypted until specific conditions are met. The interesting part isn’t just privacy. It’s removing the advantage someone gets from seeing your next move early.
Imagine setting a sell condition without revealing the level to everyone watching the chain. You wouldn’t need to trust a third party to keep your strategy hidden.
Dusk is live on Ethereum mainnet, making this idea something developers can already explore rather than just discuss.
I’m curious whether encrypted intent can change how on-chain markets behave. If strategies become harder to observe, will markets become fairer, or will new advantages simply emerge elsewhere?
#nil $NIL @Nillion
That made me look at @Nillion differently. Its Covenants approach focuses on keeping instructions encrypted until specific conditions are met. The interesting part isn’t just privacy. It’s removing the advantage someone gets from seeing your next move early.
Imagine setting a sell condition without revealing the level to everyone watching the chain. You wouldn’t need to trust a third party to keep your strategy hidden.
Dusk is live on Ethereum mainnet, making this idea something developers can already explore rather than just discuss.
I’m curious whether encrypted intent can change how on-chain markets behave. If strategies become harder to observe, will markets become fairer, or will new advantages simply emerge elsewhere?
#nil $NIL @Nillion
11
2
36
9.3k
·
--
When I started my journey on Binance, I never imagined how much I would learn, how far I would grow, and how many people I would be able to help along the way. ❤️
Over the past 5+ years, Binance has been more than just a platform for me. It has been a place to learn, explore opportunities, build experience, and share knowledge with the crypto community.
💡 I’ve learned valuable lessons.
📈 I’ve experienced growth and earned through my journey.
🤝 I’ve shared knowledge and helped others understand crypto.
🔥 And most importantly, I’ve learned that success comes from patience, consistency, and continuous learning.
I’m proud of how far I’ve come, but I believe there is still so much more to learn and achieve.
To everyone who has been part of this journey, thank you for being here. ❤️
Now I want to hear from you 👇
How long have you been on Binance, and what is the biggest lesson crypto has taught you?
Let’s share our experiences and grow together! 🚀
#Binance #BinanceSquare #CryptoJourney #CryptoCommunity #Bitcoin
When I started my journey on Binance, I never imagined how much I would learn, how far I would grow, and how many people I would be able to help along the way. ❤️
Over the past 5+ years, Binance has been more than just a platform for me. It has been a place to learn, explore opportunities, build experience, and share knowledge with the crypto community.
💡 I’ve learned valuable lessons.
📈 I’ve experienced growth and earned through my journey.
🤝 I’ve shared knowledge and helped others understand crypto.
🔥 And most importantly, I’ve learned that success comes from patience, consistency, and continuous learning.
I’m proud of how far I’ve come, but I believe there is still so much more to learn and achieve.
To everyone who has been part of this journey, thank you for being here. ❤️
Now I want to hear from you 👇
How long have you been on Binance, and what is the biggest lesson crypto has taught you?
Let’s share our experiences and grow together! 🚀
#Binance #BinanceSquare #CryptoJourney #CryptoCommunity #Bitcoin
Over the past 5+ years, Binance has been more than just a platform for me. It has been a place to learn, explore opportunities, build experience, and share knowledge with the crypto community.
💡 I’ve learned valuable lessons.
📈 I’ve experienced growth and earned through my journey.
🤝 I’ve shared knowledge and helped others understand crypto.
🔥 And most importantly, I’ve learned that success comes from patience, consistency, and continuous learning.
I’m proud of how far I’ve come, but I believe there is still so much more to learn and achieve.
To everyone who has been part of this journey, thank you for being here. ❤️
Now I want to hear from you 👇
How long have you been on Binance, and what is the biggest lesson crypto has taught you?
Let’s share our experiences and grow together! 🚀
#Binance #BinanceSquare #CryptoJourney #CryptoCommunity #Bitcoin

26
3
91
·
--
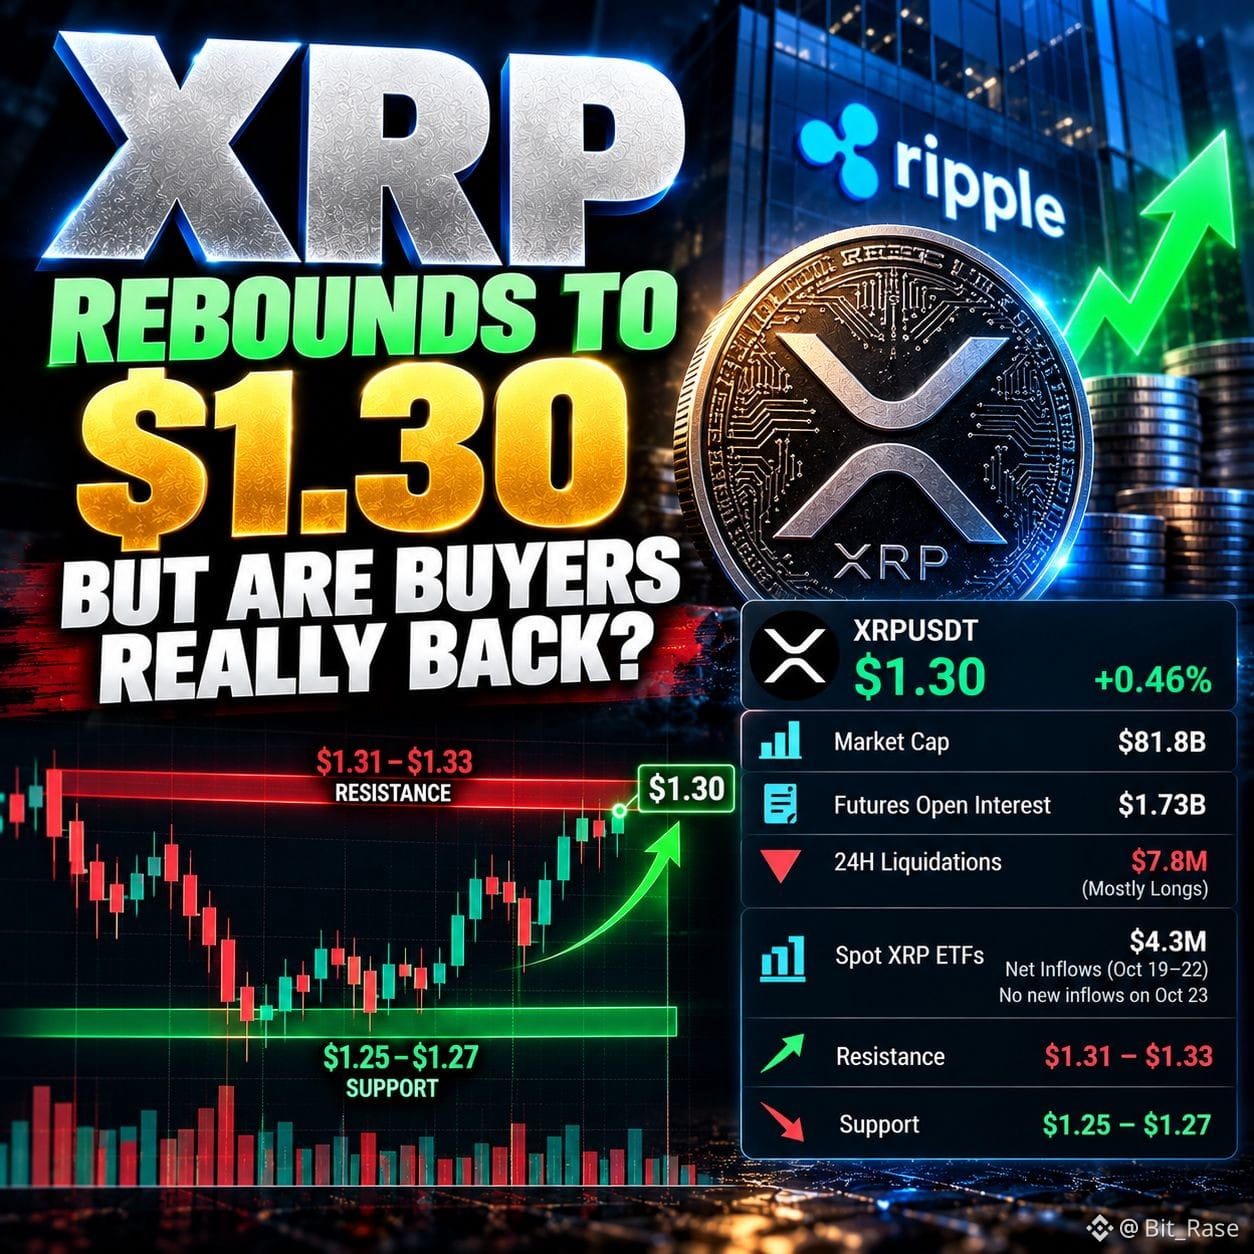
🚨 XRP REBOUNDS TO $1.30 — BUT ARE BUYERS REALLY BACK?
XRP is showing a modest recovery, but derivatives positioning suggests the market is not out of danger yet.
🟢 Price: ~$1.30 📊 24H change: +0.46% 💰 Market cap: ~$81.8B ⚠️ Futures open interest: ~$1.73B 🔻 24H liquidations: ~$7.8M, mostly longs 📍 Key support: $1.25–$1.27 📈 Resistance: $1.31–$1.33
Here’s the tension: XRP is recovering slightly, yet nearly 80% of tracked futures accounts are positioned long on some major venues. If price fails to rise, crowded bullish positioning could create another liquidation wave.
Spot XRP ETFs recorded $4.3M in net inflows from October 19–22, but saw no new inflows on October 23. Institutional demand remains positive over that period, though the latest pace is weak.
Conditional setup
Bullish trigger: Break and hold above $1.33 Entry zone: $1.31–$1.33 after confirmation SL: $1.27 TP1: $1.37 TP2: $1.42
If $1.25 breaks, the recovery thesis weakens.
The key question: Can spot demand overpower leveraged positioning, or is this just a temporary bounce?
#XRP #Ripple #CryptoNews #XRPUSDT
🚨 XRP REBOUNDS TO $1.30 — BUT ARE BUYERS REALLY BACK?
XRP is showing a modest recovery, but derivatives positioning suggests the market is not out of danger yet.
🟢 Price: ~$1.30 📊 24H change: +0.46% 💰 Market cap: ~$81.8B ⚠️ Futures open interest: ~$1.73B 🔻 24H liquidations: ~$7.8M, mostly longs 📍 Key support: $1.25–$1.27 📈 Resistance: $1.31–$1.33
Here’s the tension: XRP is recovering slightly, yet nearly 80% of tracked futures accounts are positioned long on some major venues. If price fails to rise, crowded bullish positioning could create another liquidation wave.
Spot XRP ETFs recorded $4.3M in net inflows from October 19–22, but saw no new inflows on October 23. Institutional demand remains positive over that period, though the latest pace is weak.
Conditional setup
Bullish trigger: Break and hold above $1.33 Entry zone: $1.31–$1.33 after confirmation SL: $1.27 TP1: $1.37 TP2: $1.42
If $1.25 breaks, the recovery thesis weakens.
The key question: Can spot demand overpower leveraged positioning, or is this just a temporary bounce?
#XRP #Ripple #CryptoNews #XRPUSDT
XRP is showing a modest recovery, but derivatives positioning suggests the market is not out of danger yet.
🟢 Price: ~$1.30 📊 24H change: +0.46% 💰 Market cap: ~$81.8B ⚠️ Futures open interest: ~$1.73B 🔻 24H liquidations: ~$7.8M, mostly longs 📍 Key support: $1.25–$1.27 📈 Resistance: $1.31–$1.33
Here’s the tension: XRP is recovering slightly, yet nearly 80% of tracked futures accounts are positioned long on some major venues. If price fails to rise, crowded bullish positioning could create another liquidation wave.
Spot XRP ETFs recorded $4.3M in net inflows from October 19–22, but saw no new inflows on October 23. Institutional demand remains positive over that period, though the latest pace is weak.
Conditional setup
Bullish trigger: Break and hold above $1.33 Entry zone: $1.31–$1.33 after confirmation SL: $1.27 TP1: $1.37 TP2: $1.42
If $1.25 breaks, the recovery thesis weakens.
The key question: Can spot demand overpower leveraged positioning, or is this just a temporary bounce?
#XRP #Ripple #CryptoNews #XRPUSDT
2
322
·
--
Partiellement vrai
🚨 CRUDE OIL PERPS RISE 1.12% — BUT IS BUYING CONVICTION FADING?
$CL is trading near $103.69, with the latest October 24 snapshot showing a 1.12% gain.
🟢 Price: $103.69
📊 24H volume: $662.67M
📉 Open interest: $366.46M
⚠️ 24H OI change: -2.18%
📍 Previous-day reference: $102.31
Here’s the tension: price is rising while open interest is falling. That can indicate position closing rather than fresh leveraged conviction, although it does not confirm which side is exiting.
Funding is near zero, while the contract trades at a slight discount to its reference index.
Conditional setup
Bullish trigger: Sustained move above $104
Entry: Only after a confirmed breakout and retest
Invalidation: Loss of the $102.31 reference level
Targets: Confirm from the live chart before setting profit levels.
If buyers cannot hold the breakout, the current rally may lack follow-through. Watch price and open interest together for confirmation.
#CrudeOil #CLUSDT #MarketAnalysis
🚨 CRUDE OIL PERPS RISE 1.12% — BUT IS BUYING CONVICTION FADING?
$CL is trading near $103.69, with the latest October 24 snapshot showing a 1.12% gain.
🟢 Price: $103.69
📊 24H volume: $662.67M
📉 Open interest: $366.46M
⚠️ 24H OI change: -2.18%
📍 Previous-day reference: $102.31
Here’s the tension: price is rising while open interest is falling. That can indicate position closing rather than fresh leveraged conviction, although it does not confirm which side is exiting.
Funding is near zero, while the contract trades at a slight discount to its reference index.
Conditional setup
Bullish trigger: Sustained move above $104
Entry: Only after a confirmed breakout and retest
Invalidation: Loss of the $102.31 reference level
Targets: Confirm from the live chart before setting profit levels.
If buyers cannot hold the breakout, the current rally may lack follow-through. Watch price and open interest together for confirmation.
#CrudeOil #CLUSDT #MarketAnalysis
$CL is trading near $103.69, with the latest October 24 snapshot showing a 1.12% gain.
🟢 Price: $103.69
📊 24H volume: $662.67M
📉 Open interest: $366.46M
⚠️ 24H OI change: -2.18%
📍 Previous-day reference: $102.31
Here’s the tension: price is rising while open interest is falling. That can indicate position closing rather than fresh leveraged conviction, although it does not confirm which side is exiting.
Funding is near zero, while the contract trades at a slight discount to its reference index.
Conditional setup
Bullish trigger: Sustained move above $104
Entry: Only after a confirmed breakout and retest
Invalidation: Loss of the $102.31 reference level
Targets: Confirm from the live chart before setting profit levels.
If buyers cannot hold the breakout, the current rally may lack follow-through. Watch price and open interest together for confirmation.
#CrudeOil #CLUSDT #MarketAnalysis

3
474
·
--
Vérifié
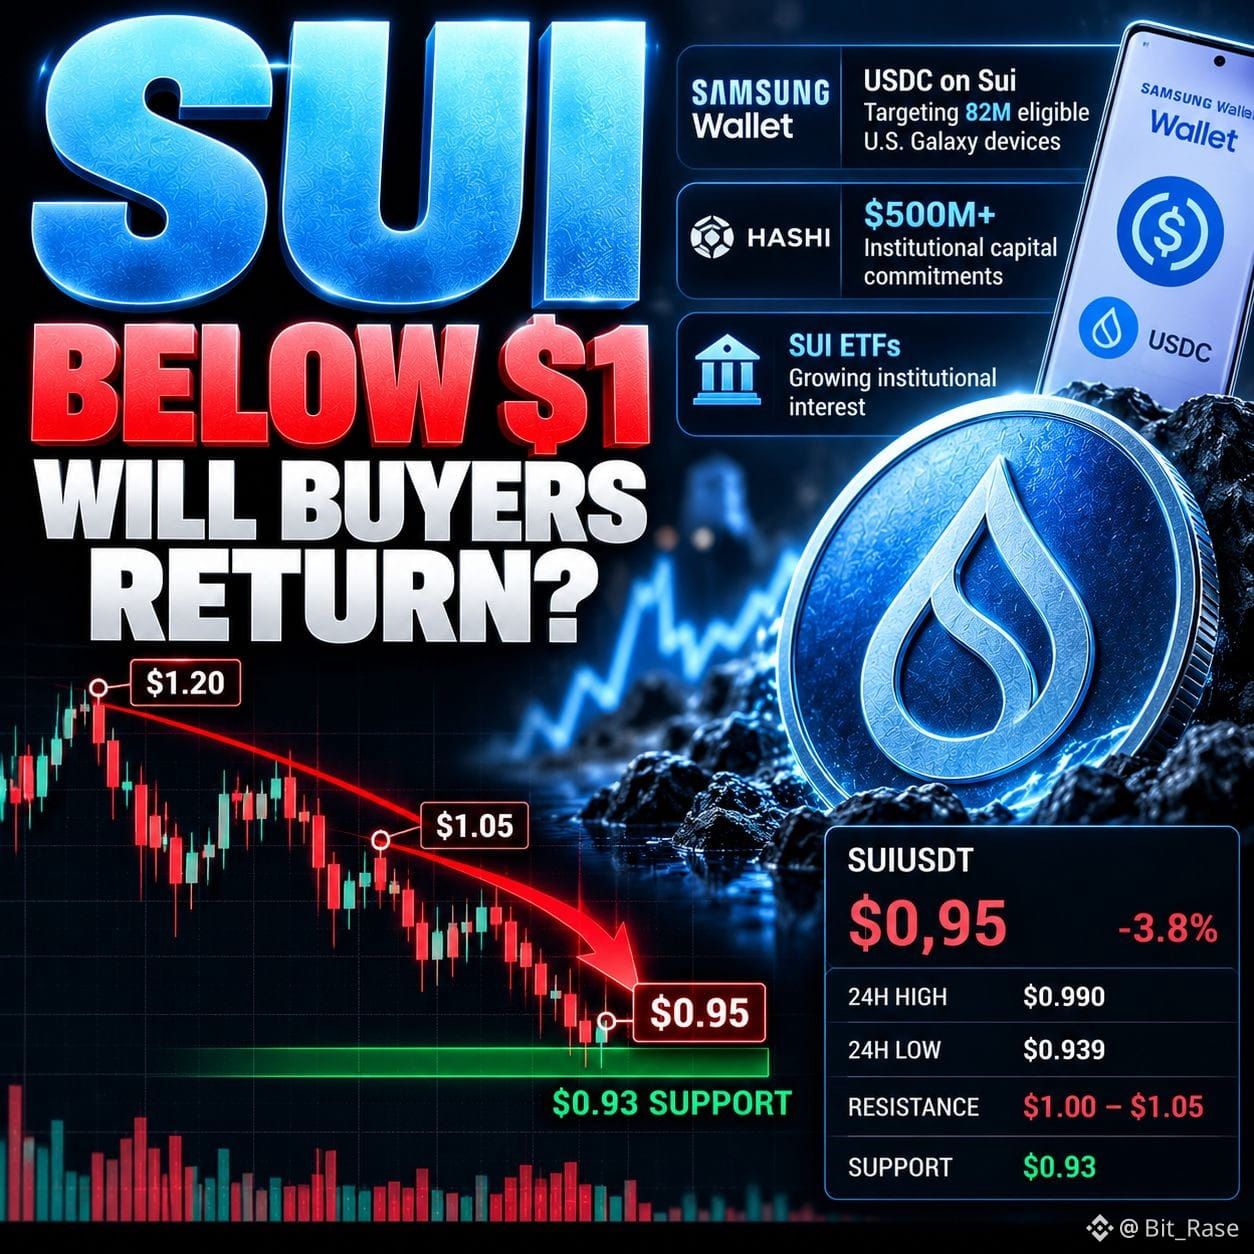
🚨 SUI BELOW $1 — WILL REAL ADOPTION FINALLY BRING BUYERS BACK?
$SUI is hovering near $0.95 after another weak session. The $1.00 level has turned into a key recovery test, while sellers continue to pressure short-term momentum.
But the fundamental picture is getting interesting.
🔹 Samsung Wallet is integrating USDC on Sui, targeting 82M eligible U.S. Galaxy devices.
🔹 Hashi is rolling out Bitcoin-backed finance infrastructure with $500M+ in institutional capital commitments.
🔹 U.S. SUI ETFs have attracted institutional interest, but recent inflows alone cannot guarantee a price recovery.
Here’s the tension: ecosystem expansion is real, but token demand must show up in actual flows and sustained price strength.
Conditional setup
Bullish trigger: Reclaim $1.00–$1.05
Entry zone: $0.98–$1.00 after confirmation
SL: $0.93
TP1: $1.05
TP2: $1.10
TP3: $1.20
If $0.93 breaks decisively, the recovery thesis weakens and lower support may come into play.
The key question: Can SUI turn institutional interest into sustained buying pressure?
#SUI #SuiNetwork #CryptoNews
🚨 SUI BELOW $1 — WILL REAL ADOPTION FINALLY BRING BUYERS BACK?
$SUI is hovering near $0.95 after another weak session. The $1.00 level has turned into a key recovery test, while sellers continue to pressure short-term momentum.
But the fundamental picture is getting interesting.
🔹 Samsung Wallet is integrating USDC on Sui, targeting 82M eligible U.S. Galaxy devices.
🔹 Hashi is rolling out Bitcoin-backed finance infrastructure with $500M+ in institutional capital commitments.
🔹 U.S. SUI ETFs have attracted institutional interest, but recent inflows alone cannot guarantee a price recovery.
Here’s the tension: ecosystem expansion is real, but token demand must show up in actual flows and sustained price strength.
Conditional setup
Bullish trigger: Reclaim $1.00–$1.05
Entry zone: $0.98–$1.00 after confirmation
SL: $0.93
TP1: $1.05
TP2: $1.10
TP3: $1.20
If $0.93 breaks decisively, the recovery thesis weakens and lower support may come into play.
The key question: Can SUI turn institutional interest into sustained buying pressure?
#SUI #SuiNetwork #CryptoNews
$SUI is hovering near $0.95 after another weak session. The $1.00 level has turned into a key recovery test, while sellers continue to pressure short-term momentum.
But the fundamental picture is getting interesting.
🔹 Samsung Wallet is integrating USDC on Sui, targeting 82M eligible U.S. Galaxy devices.
🔹 Hashi is rolling out Bitcoin-backed finance infrastructure with $500M+ in institutional capital commitments.
🔹 U.S. SUI ETFs have attracted institutional interest, but recent inflows alone cannot guarantee a price recovery.
Here’s the tension: ecosystem expansion is real, but token demand must show up in actual flows and sustained price strength.
Conditional setup
Bullish trigger: Reclaim $1.00–$1.05
Entry zone: $0.98–$1.00 after confirmation
SL: $0.93
TP1: $1.05
TP2: $1.10
TP3: $1.20
If $0.93 breaks decisively, the recovery thesis weakens and lower support may come into play.
The key question: Can SUI turn institutional interest into sustained buying pressure?
#SUI #SuiNetwork #CryptoNews
2
4
866
·
--
Vérifié
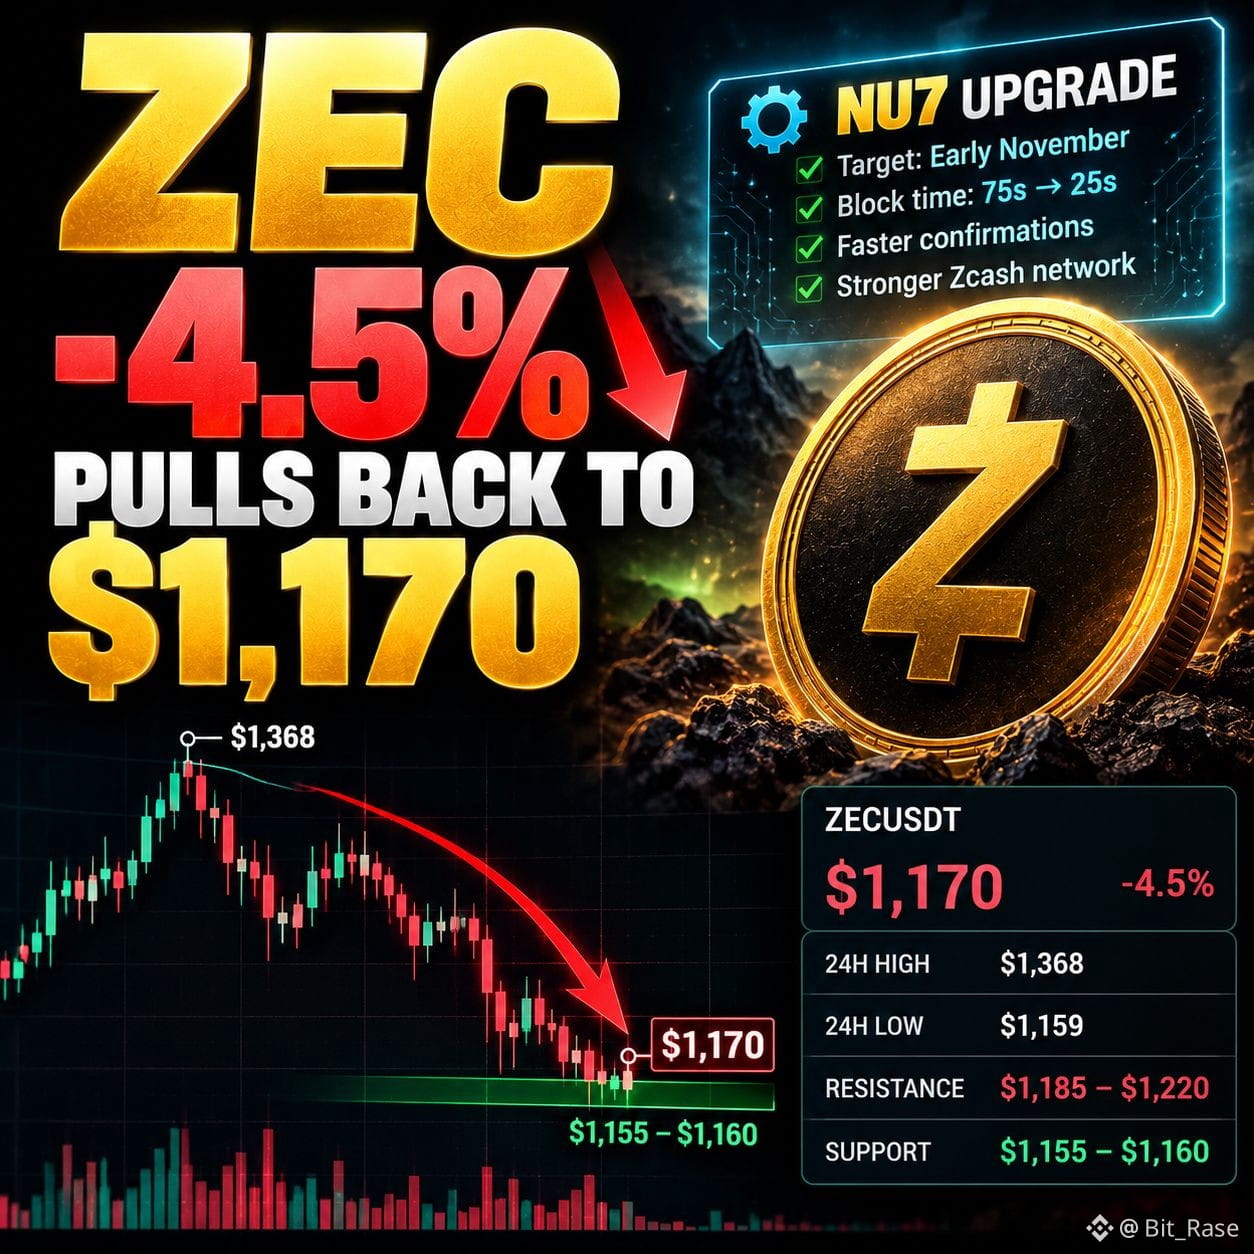
🚨 ZEC DROPS 4.5% — CAN THE NOVEMBER UPGRADE SAVE THE RALLY?
Zcash ( $ZEC ) is trading near $1,170 after pulling back from its October 21 high of $1,368. The latest decline puts short-term buyers under pressure.
🔴 Price: ~$1,170
🔴 24H low: ~$1,159
🔴 Immediate resistance: $1,185–$1,220
The bigger catalyst is NU7, targeted for early November. The upgrade aims to cut block times from 75 to 25 seconds, potentially making confirmations around 3× faster.
But here’s the tension: a stronger technical roadmap does not automatically mean stronger buying pressure. ZEC is still correcting, and the $1,155–$1,160 zone is the first area to watch.
Conditional setup
Bullish trigger: Reclaim $1,220
Entry zone: $1,200–$1,220 after confirmation
SL: $1,150
TP1: $1,280
TP2: $1,335
If support fails, the recovery setup weakens. The key question is whether buyers return before the NU7 catalyst becomes a sell-the-news event.
#ZEC #Zcash #CryptoNews
🚨 ZEC DROPS 4.5% — CAN THE NOVEMBER UPGRADE SAVE THE RALLY?
Zcash ( $ZEC ) is trading near $1,170 after pulling back from its October 21 high of $1,368. The latest decline puts short-term buyers under pressure.
🔴 Price: ~$1,170
🔴 24H low: ~$1,159
🔴 Immediate resistance: $1,185–$1,220
The bigger catalyst is NU7, targeted for early November. The upgrade aims to cut block times from 75 to 25 seconds, potentially making confirmations around 3× faster.
But here’s the tension: a stronger technical roadmap does not automatically mean stronger buying pressure. ZEC is still correcting, and the $1,155–$1,160 zone is the first area to watch.
Conditional setup
Bullish trigger: Reclaim $1,220
Entry zone: $1,200–$1,220 after confirmation
SL: $1,150
TP1: $1,280
TP2: $1,335
If support fails, the recovery setup weakens. The key question is whether buyers return before the NU7 catalyst becomes a sell-the-news event.
#ZEC #Zcash #CryptoNews
Zcash ( $ZEC ) is trading near $1,170 after pulling back from its October 21 high of $1,368. The latest decline puts short-term buyers under pressure.
🔴 Price: ~$1,170
🔴 24H low: ~$1,159
🔴 Immediate resistance: $1,185–$1,220
The bigger catalyst is NU7, targeted for early November. The upgrade aims to cut block times from 75 to 25 seconds, potentially making confirmations around 3× faster.
But here’s the tension: a stronger technical roadmap does not automatically mean stronger buying pressure. ZEC is still correcting, and the $1,155–$1,160 zone is the first area to watch.
Conditional setup
Bullish trigger: Reclaim $1,220
Entry zone: $1,200–$1,220 after confirmation
SL: $1,150
TP1: $1,280
TP2: $1,335
If support fails, the recovery setup weakens. The key question is whether buyers return before the NU7 catalyst becomes a sell-the-news event.
#ZEC #Zcash #CryptoNews
1
7
5.4k
·
--
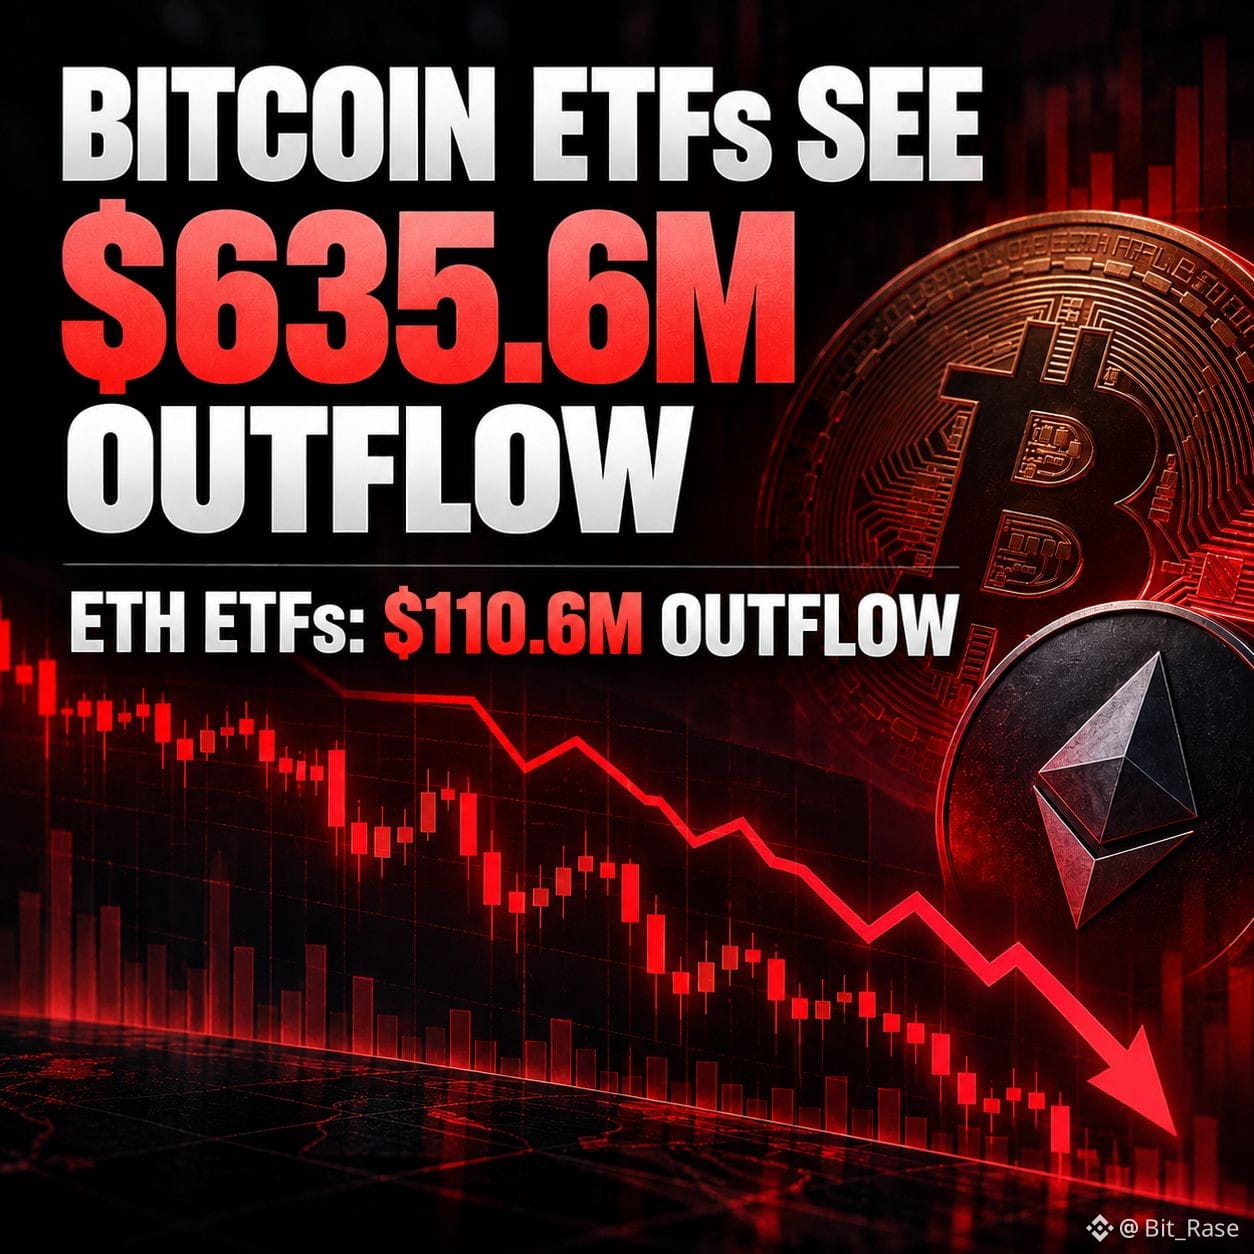
🚨 BREAKING: $635.6M WORTH OF BITCOIN ETF MONEY EXITED IN ONE DAY
U.S. spot Bitcoin ETFs recorded $635.6M in net outflows on October 22, their largest single-day withdrawal since June 25.
🔴 Bitcoin ETFs: -$635.6M
🔴 Ethereum ETFs: -$110.6M
BlackRock’s IBIT, Fidelity’s FBTC, and ARKB led Bitcoin ETF outflows. Ethereum funds also faced pressure, with $75.5M leaving BlackRock’s ETHA.
Here’s the key question: Is institutional demand weakening, or are investors temporarily reducing risk?
One day of outflows does not confirm a sustained sell-off. The next ETF flow data and Bitcoin’s price reaction will help show whether buyers are absorbing the pressure.
#Bitcoin #BTC #CryptoNews #BitcoinETF #Ethereum
🚨 BREAKING: $635.6M WORTH OF BITCOIN ETF MONEY EXITED IN ONE DAY
U.S. spot Bitcoin ETFs recorded $635.6M in net outflows on October 22, their largest single-day withdrawal since June 25.
🔴 Bitcoin ETFs: -$635.6M
🔴 Ethereum ETFs: -$110.6M
BlackRock’s IBIT, Fidelity’s FBTC, and ARKB led Bitcoin ETF outflows. Ethereum funds also faced pressure, with $75.5M leaving BlackRock’s ETHA.
Here’s the key question: Is institutional demand weakening, or are investors temporarily reducing risk?
One day of outflows does not confirm a sustained sell-off. The next ETF flow data and Bitcoin’s price reaction will help show whether buyers are absorbing the pressure.
#Bitcoin #BTC #CryptoNews #BitcoinETF #Ethereum
U.S. spot Bitcoin ETFs recorded $635.6M in net outflows on October 22, their largest single-day withdrawal since June 25.
🔴 Bitcoin ETFs: -$635.6M
🔴 Ethereum ETFs: -$110.6M
BlackRock’s IBIT, Fidelity’s FBTC, and ARKB led Bitcoin ETF outflows. Ethereum funds also faced pressure, with $75.5M leaving BlackRock’s ETHA.
Here’s the key question: Is institutional demand weakening, or are investors temporarily reducing risk?
One day of outflows does not confirm a sustained sell-off. The next ETF flow data and Bitcoin’s price reaction will help show whether buyers are absorbing the pressure.
#Bitcoin #BTC #CryptoNews #BitcoinETF #Ethereum
3
821
·
--
$BTC is defending the $80K–$81.5K support zone, but Bitcoin’s recovery remains fragile. BTC is trading near $81,175 on October 24, following repeated rejection from the $84.8K area. The key question is whether buyers can hold the current floor or whether weakening demand triggers another leg lower.
Market structure: Bitcoin has formed lower highs since reaching approximately $87,197 on October 2. Price remains near the 50-day moving-average zone but above the longer-term 200-day average, leaving the short-term structure weak without fully breaking the broader trend.
The central tension: bullish conviction persists, but institutional flows have reversed. U.S. spot Bitcoin ETFs recorded $635.6M in net outflows on October 22, erasing much of the previous session’s inflow. Meanwhile, speculation in cat-themed coins reflects high-risk appetite, but there is no verified evidence that this activity is directly diverting significant capital away from BTC.
Support and Resistance:
· Resistance: $82K–$82.6K first, followed by $83.7K–$84.8K. The major overhead supply zone remains $86.5K–$87.5K.
· Support: $80K–$81.5K is the immediate defense zone. A decisive daily breakdown could expose $79.8K, followed by the $77.5K–$78.4K region.
Level to watch: $82.6K. A daily close above this zone with expanding spot volume would improve recovery momentum. Rejection below it keeps BTC vulnerable to another test of $80K.
Trade plan: A confirmed reclaim of $82.6K opens a potential move toward $83.7K–$84.8K. If BTC holds $80K–$81.5K and selling pressure declines, a base may develop. A daily close below $80K followed by a failed reclaim would invalidate the immediate support thesis.
Risk note: ETF outflows and weak spot demand remain headwinds. Cat-coin speculation is a sentiment signal, not proof of a direct BTC capital rotation. The decisive evidence will be Bitcoin’s response at support, sustained spot buying and confirmation above resistance.
This is a chart read, not financial advice.
$BTC is defending the $80K–$81.5K support zone, but Bitcoin’s recovery remains fragile. BTC is trading near $81,175 on October 24, following repeated rejection from the $84.8K area. The key question is whether buyers can hold the current floor or whether weakening demand triggers another leg lower.
Market structure: Bitcoin has formed lower highs since reaching approximately $87,197 on October 2. Price remains near the 50-day moving-average zone but above the longer-term 200-day average, leaving the short-term structure weak without fully breaking the broader trend.
The central tension: bullish conviction persists, but institutional flows have reversed. U.S. spot Bitcoin ETFs recorded $635.6M in net outflows on October 22, erasing much of the previous session’s inflow. Meanwhile, speculation in cat-themed coins reflects high-risk appetite, but there is no verified evidence that this activity is directly diverting significant capital away from BTC.
Support and Resistance:
· Resistance: $82K–$82.6K first, followed by $83.7K–$84.8K. The major overhead supply zone remains $86.5K–$87.5K.
· Support: $80K–$81.5K is the immediate defense zone. A decisive daily breakdown could expose $79.8K, followed by the $77.5K–$78.4K region.
Level to watch: $82.6K. A daily close above this zone with expanding spot volume would improve recovery momentum. Rejection below it keeps BTC vulnerable to another test of $80K.
Trade plan: A confirmed reclaim of $82.6K opens a potential move toward $83.7K–$84.8K. If BTC holds $80K–$81.5K and selling pressure declines, a base may develop. A daily close below $80K followed by a failed reclaim would invalidate the immediate support thesis.
Risk note: ETF outflows and weak spot demand remain headwinds. Cat-coin speculation is a sentiment signal, not proof of a direct BTC capital rotation. The decisive evidence will be Bitcoin’s response at support, sustained spot buying and confirmation above resistance.
This is a chart read, not financial advice.
Market structure: Bitcoin has formed lower highs since reaching approximately $87,197 on October 2. Price remains near the 50-day moving-average zone but above the longer-term 200-day average, leaving the short-term structure weak without fully breaking the broader trend.
The central tension: bullish conviction persists, but institutional flows have reversed. U.S. spot Bitcoin ETFs recorded $635.6M in net outflows on October 22, erasing much of the previous session’s inflow. Meanwhile, speculation in cat-themed coins reflects high-risk appetite, but there is no verified evidence that this activity is directly diverting significant capital away from BTC.
Support and Resistance:
· Resistance: $82K–$82.6K first, followed by $83.7K–$84.8K. The major overhead supply zone remains $86.5K–$87.5K.
· Support: $80K–$81.5K is the immediate defense zone. A decisive daily breakdown could expose $79.8K, followed by the $77.5K–$78.4K region.
Level to watch: $82.6K. A daily close above this zone with expanding spot volume would improve recovery momentum. Rejection below it keeps BTC vulnerable to another test of $80K.
Trade plan: A confirmed reclaim of $82.6K opens a potential move toward $83.7K–$84.8K. If BTC holds $80K–$81.5K and selling pressure declines, a base may develop. A daily close below $80K followed by a failed reclaim would invalidate the immediate support thesis.
Risk note: ETF outflows and weak spot demand remain headwinds. Cat-coin speculation is a sentiment signal, not proof of a direct BTC capital rotation. The decisive evidence will be Bitcoin’s response at support, sustained spot buying and confirmation above resistance.
This is a chart read, not financial advice.
2
488
·
--
$ICP is testing whether the $2.34 support thesis still holds, but the latest price action shows the market has not yet reached that level. ICP closed near $2.76 on October 23 after falling from $3.06 on October 17. The rebound is fragile: buyers must reclaim nearby resistance before the $3.40–$3.60 recovery target becomes realistic.
The central tension: the long-term rebound remains possible, but the short-term trend is still under pressure. ICP dropped 6.4% on October 22, with price reaching $2.68 before recovering. Daily RSI remains near 41, showing weak momentum rather than a confirmed bullish reversal.
Support and Resistance:
· Resistance: $2.84 first, then $2.96–$3.13. Above that, $3.40–$3.60 becomes the broader recovery zone.
· Support: $2.68–$2.63 first, followed by $2.54. The key structural level from your thesis remains $2.343.
Level to watch: $2.84. A daily close above this zone would be the first sign that buyers are regaining control. Rejection below it leaves ICP vulnerable to another test of $2.63 and potentially the $2.34 support area.
Trade plan: A confirmed reclaim of $2.84, followed by a break above $2.96, would strengthen the path toward $3.13 and then $3.40–$3.60. If price falls toward $2.34 and quickly reclaims it, the original rebound thesis remains viable. A daily close below $2.343 followed by a failed reclaim would invalidate that structure. The $4.07 reclaim remains a later confirmation level for the $4.81 thesis.
Risk note: The current market price is still above the cited $2.343 support, so that level has not been retested in the latest sessions. Avoid treating the $4.81 target as active until ICP first repairs its lower resistance structure.
$ICP is testing whether the $2.34 support thesis still holds, but the latest price action shows the market has not yet reached that level. ICP closed near $2.76 on October 23 after falling from $3.06 on October 17. The rebound is fragile: buyers must reclaim nearby resistance before the $3.40–$3.60 recovery target becomes realistic.
The central tension: the long-term rebound remains possible, but the short-term trend is still under pressure. ICP dropped 6.4% on October 22, with price reaching $2.68 before recovering. Daily RSI remains near 41, showing weak momentum rather than a confirmed bullish reversal.
Support and Resistance:
· Resistance: $2.84 first, then $2.96–$3.13. Above that, $3.40–$3.60 becomes the broader recovery zone.
· Support: $2.68–$2.63 first, followed by $2.54. The key structural level from your thesis remains $2.343.
Level to watch: $2.84. A daily close above this zone would be the first sign that buyers are regaining control. Rejection below it leaves ICP vulnerable to another test of $2.63 and potentially the $2.34 support area.
Trade plan: A confirmed reclaim of $2.84, followed by a break above $2.96, would strengthen the path toward $3.13 and then $3.40–$3.60. If price falls toward $2.34 and quickly reclaims it, the original rebound thesis remains viable. A daily close below $2.343 followed by a failed reclaim would invalidate that structure. The $4.07 reclaim remains a later confirmation level for the $4.81 thesis.
Risk note: The current market price is still above the cited $2.343 support, so that level has not been retested in the latest sessions. Avoid treating the $4.81 target as active until ICP first repairs its lower resistance structure.
The central tension: the long-term rebound remains possible, but the short-term trend is still under pressure. ICP dropped 6.4% on October 22, with price reaching $2.68 before recovering. Daily RSI remains near 41, showing weak momentum rather than a confirmed bullish reversal.
Support and Resistance:
· Resistance: $2.84 first, then $2.96–$3.13. Above that, $3.40–$3.60 becomes the broader recovery zone.
· Support: $2.68–$2.63 first, followed by $2.54. The key structural level from your thesis remains $2.343.
Level to watch: $2.84. A daily close above this zone would be the first sign that buyers are regaining control. Rejection below it leaves ICP vulnerable to another test of $2.63 and potentially the $2.34 support area.
Trade plan: A confirmed reclaim of $2.84, followed by a break above $2.96, would strengthen the path toward $3.13 and then $3.40–$3.60. If price falls toward $2.34 and quickly reclaims it, the original rebound thesis remains viable. A daily close below $2.343 followed by a failed reclaim would invalidate that structure. The $4.07 reclaim remains a later confirmation level for the $4.81 thesis.
Risk note: The current market price is still above the cited $2.343 support, so that level has not been retested in the latest sessions. Avoid treating the $4.81 target as active until ICP first repairs its lower resistance structure.
9
2.8k
·
--
$ETH is testing whether the $2,300–$2,350 region can hold after October’s selloff. Ethereum has lost ground from its September highs near $2,800, and the latest weakness reflects more than technical profit-taking. The key question is whether buyers can defend support while institutional demand remains under pressure.
Context: ETH recently traded around $2,384, with the $2,500 level still acting as a major recovery barrier. The latest technical picture remains mixed: short-term momentum has weakened, while a sustained reclaim of $2,500 would be the first meaningful sign that buyers are regaining control. <Cite refs={["turn669310search4","turn669310search5"]}/>
The central tension: leveraged positioning is resetting, but ETF demand remains weak. U.S. spot Ethereum ETFs recorded a $20.3M net outflow on October 22, extending the recent withdrawal trend. Futures open interest was reported around $31.25B, down 13.37% over 30 days, suggesting leverage has been reduced even as spot demand struggles to recover. <Cite refs={["turn669310search2","turn669310search3"]}/>
Support and Resistance:
· Resistance: $2,450–$2,480 first, followed by $2,500–$2,550.
· Support: $2,350–$2,325 first. A decisive breakdown could expose $2,250–$2,200. <Cite refs={["turn669310search3","turn669310search4","turn669310search5"]}/>
Level to watch: $2,500. A daily close above this zone with expanding spot volume would strengthen the recovery and open a path toward $2,550. Rejection below $2,450 keeps the market vulnerable to another support test.
Trade plan: A confirmed close above $2,500 favors $2,550, with $2,600 as the next stretch target. If ETH retests $2,325–$2,350 and holds, a relief bounce remains possible. A daily close below $2,325 would weaken the setup and expose the $2,250 area.
Risk note: NFT losses and sales to fund derivatives trading may reflect broader speculative-risk rotation, but one trader’s decision does not prove ETH demand is improving. Persistent ETF outflows remain a headwind, and ETH needs sustained spot buying to validate any rebound.
$ETH is testing whether the $2,300–$2,350 region can hold after October’s selloff. Ethereum has lost ground from its September highs near $2,800, and the latest weakness reflects more than technical profit-taking. The key question is whether buyers can defend support while institutional demand remains under pressure.
Context: ETH recently traded around $2,384, with the $2,500 level still acting as a major recovery barrier. The latest technical picture remains mixed: short-term momentum has weakened, while a sustained reclaim of $2,500 would be the first meaningful sign that buyers are regaining control. <Cite refs={["turn669310search4","turn669310search5"]}/>
The central tension: leveraged positioning is resetting, but ETF demand remains weak. U.S. spot Ethereum ETFs recorded a $20.3M net outflow on October 22, extending the recent withdrawal trend. Futures open interest was reported around $31.25B, down 13.37% over 30 days, suggesting leverage has been reduced even as spot demand struggles to recover. <Cite refs={["turn669310search2","turn669310search3"]}/>
Support and Resistance:
· Resistance: $2,450–$2,480 first, followed by $2,500–$2,550.
· Support: $2,350–$2,325 first. A decisive breakdown could expose $2,250–$2,200. <Cite refs={["turn669310search3","turn669310search4","turn669310search5"]}/>
Level to watch: $2,500. A daily close above this zone with expanding spot volume would strengthen the recovery and open a path toward $2,550. Rejection below $2,450 keeps the market vulnerable to another support test.
Trade plan: A confirmed close above $2,500 favors $2,550, with $2,600 as the next stretch target. If ETH retests $2,325–$2,350 and holds, a relief bounce remains possible. A daily close below $2,325 would weaken the setup and expose the $2,250 area.
Risk note: NFT losses and sales to fund derivatives trading may reflect broader speculative-risk rotation, but one trader’s decision does not prove ETH demand is improving. Persistent ETF outflows remain a headwind, and ETH needs sustained spot buying to validate any rebound.
Context: ETH recently traded around $2,384, with the $2,500 level still acting as a major recovery barrier. The latest technical picture remains mixed: short-term momentum has weakened, while a sustained reclaim of $2,500 would be the first meaningful sign that buyers are regaining control. <Cite refs={["turn669310search4","turn669310search5"]}/>
The central tension: leveraged positioning is resetting, but ETF demand remains weak. U.S. spot Ethereum ETFs recorded a $20.3M net outflow on October 22, extending the recent withdrawal trend. Futures open interest was reported around $31.25B, down 13.37% over 30 days, suggesting leverage has been reduced even as spot demand struggles to recover. <Cite refs={["turn669310search2","turn669310search3"]}/>
Support and Resistance:
· Resistance: $2,450–$2,480 first, followed by $2,500–$2,550.
· Support: $2,350–$2,325 first. A decisive breakdown could expose $2,250–$2,200. <Cite refs={["turn669310search3","turn669310search4","turn669310search5"]}/>
Level to watch: $2,500. A daily close above this zone with expanding spot volume would strengthen the recovery and open a path toward $2,550. Rejection below $2,450 keeps the market vulnerable to another support test.
Trade plan: A confirmed close above $2,500 favors $2,550, with $2,600 as the next stretch target. If ETH retests $2,325–$2,350 and holds, a relief bounce remains possible. A daily close below $2,325 would weaken the setup and expose the $2,250 area.
Risk note: NFT losses and sales to fund derivatives trading may reflect broader speculative-risk rotation, but one trader’s decision does not prove ETH demand is improving. Persistent ETF outflows remain a headwind, and ETH needs sustained spot buying to validate any rebound.
3
706
·
--
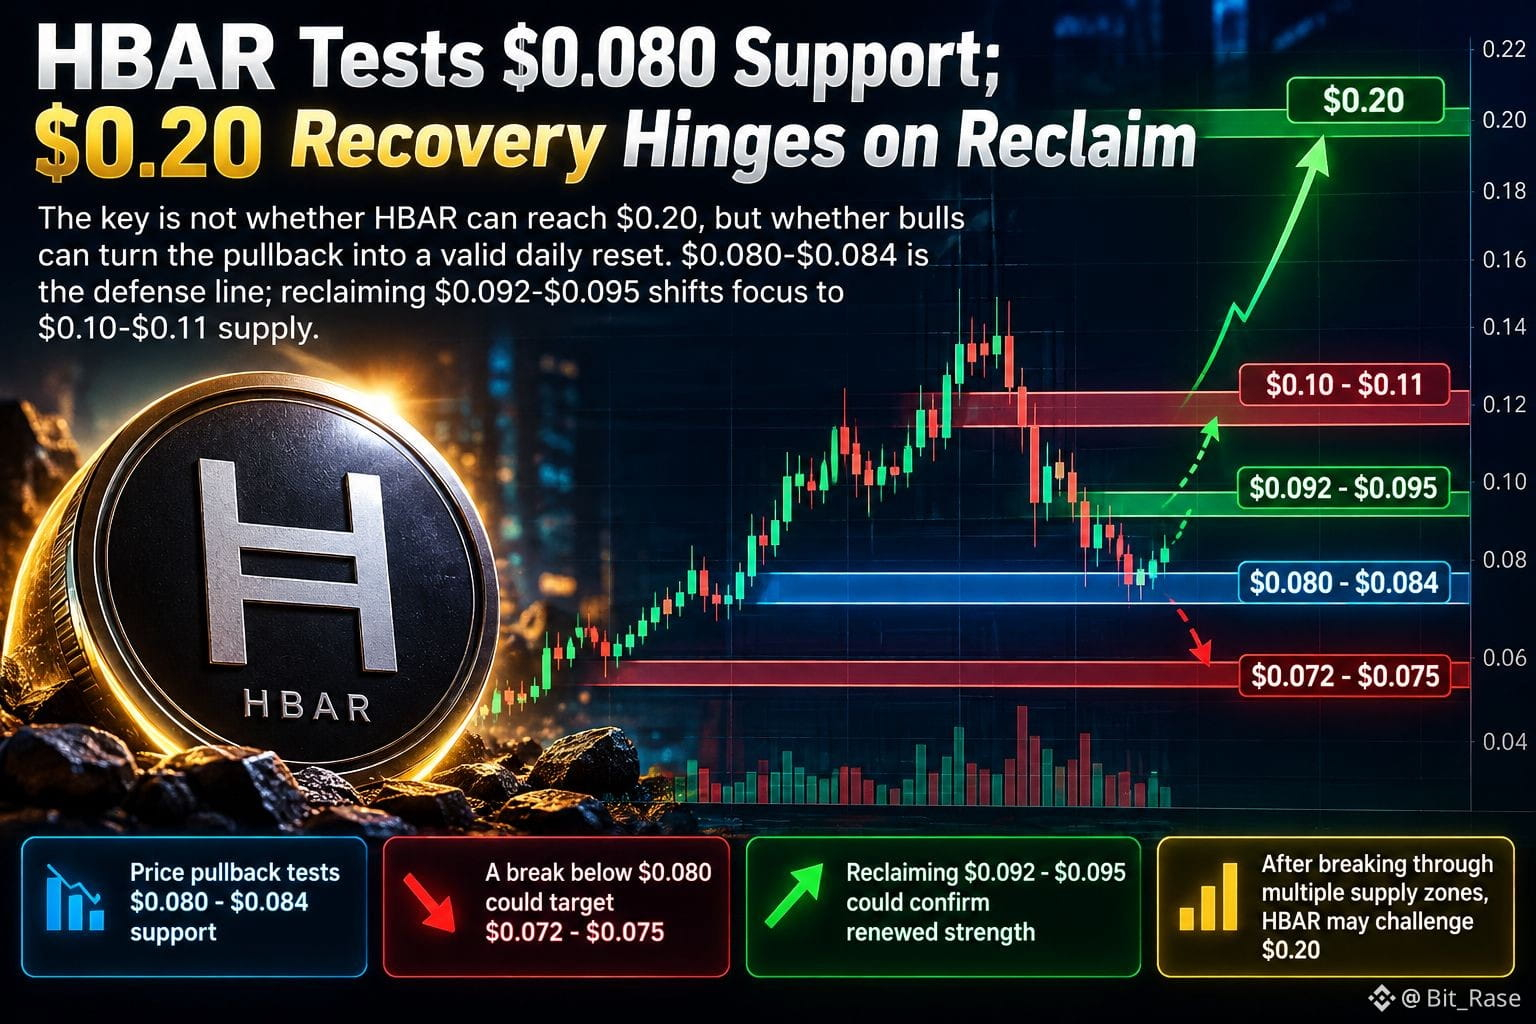
HBAR Tests $0.080 Support; $0.20 Recovery Hinges on Reclaim
At The key is not whether HBAR can reach $0.20, but whether bulls can turn the pullback into a valid daily reset. $0.080-$0.084 is the defense line; reclaiming $0.092-$0.095 shifts focus to $0.10-$0.11 supply.
Price pullback tests 0.080-0.084 support
A break below 0.080 could target 0.072-0.075
Reclaiming 0.092-0.095 could confirm renewed strength
After breaking through multiple supply zones, HBAR may challenge 0.20
HBAR Tests $0.080 Support; $0.20 Recovery Hinges on Reclaim
At The key is not whether HBAR can reach $0.20, but whether bulls can turn the pullback into a valid daily reset. $0.080-$0.084 is the defense line; reclaiming $0.092-$0.095 shifts focus to $0.10-$0.11 supply.
Price pullback tests 0.080-0.084 support
A break below 0.080 could target 0.072-0.075
Reclaiming 0.092-0.095 could confirm renewed strength
After breaking through multiple supply zones, HBAR may challenge 0.20
At The key is not whether HBAR can reach $0.20, but whether bulls can turn the pullback into a valid daily reset. $0.080-$0.084 is the defense line; reclaiming $0.092-$0.095 shifts focus to $0.10-$0.11 supply.
Price pullback tests 0.080-0.084 support
A break below 0.080 could target 0.072-0.075
Reclaiming 0.092-0.095 could confirm renewed strength
After breaking through multiple supply zones, HBAR may challenge 0.20
5
861
·
--
Amkor Secures $1.3 Billion NVIDIA Deal To Expand Al Packaging
At Amkor shares rose premarket after securing a $1.3 billion agreement with NVIDIA to expand semiconductor packaging capacity in South Korea.
Secured $1.3B Al packaging capacity expansion deal from NVIDIA
Al packaging capacity planned to increase by over 300% by 2028
Analysts' average price target is $71.83, with a Buy-leaning rating
Value, growth, and quality scores are all strong
Stock price is below key moving averages; the death cross still weighs on the trend
Amkor Secures $1.3 Billion NVIDIA Deal To Expand Al Packaging
At Amkor shares rose premarket after securing a $1.3 billion agreement with NVIDIA to expand semiconductor packaging capacity in South Korea.
Secured $1.3B Al packaging capacity expansion deal from NVIDIA
Al packaging capacity planned to increase by over 300% by 2028
Analysts' average price target is $71.83, with a Buy-leaning rating
Value, growth, and quality scores are all strong
Stock price is below key moving averages; the death cross still weighs on the trend
At Amkor shares rose premarket after securing a $1.3 billion agreement with NVIDIA to expand semiconductor packaging capacity in South Korea.
Secured $1.3B Al packaging capacity expansion deal from NVIDIA
Al packaging capacity planned to increase by over 300% by 2028
Analysts' average price target is $71.83, with a Buy-leaning rating
Value, growth, and quality scores are all strong
Stock price is below key moving averages; the death cross still weighs on the trend

3
214
·
--
Dogecoin Foundation Unifies Wallet, Apps and Merchant Payments Under Dogecoin Labs
At This is not a routine ecosystem reshuffle. It aims to turn DOGE from a trading symbol into a payment asset by placing My Doge, DogeOS and merchant tools under one operator. The key is whether testnet-stage DogeOS can launch and drive real adoption.
$DOGE
{future}(DOGEUSDT)
Dogecoin Foundation Unifies Wallet, Apps and Merchant Payments Under Dogecoin Labs
At This is not a routine ecosystem reshuffle. It aims to turn DOGE from a trading symbol into a payment asset by placing My Doge, DogeOS and merchant tools under one operator. The key is whether testnet-stage DogeOS can launch and drive real adoption.
$DOGE
At This is not a routine ecosystem reshuffle. It aims to turn DOGE from a trading symbol into a payment asset by placing My Doge, DogeOS and merchant tools under one operator. The key is whether testnet-stage DogeOS can launch and drive real adoption.
$DOGE

2
161
·
--
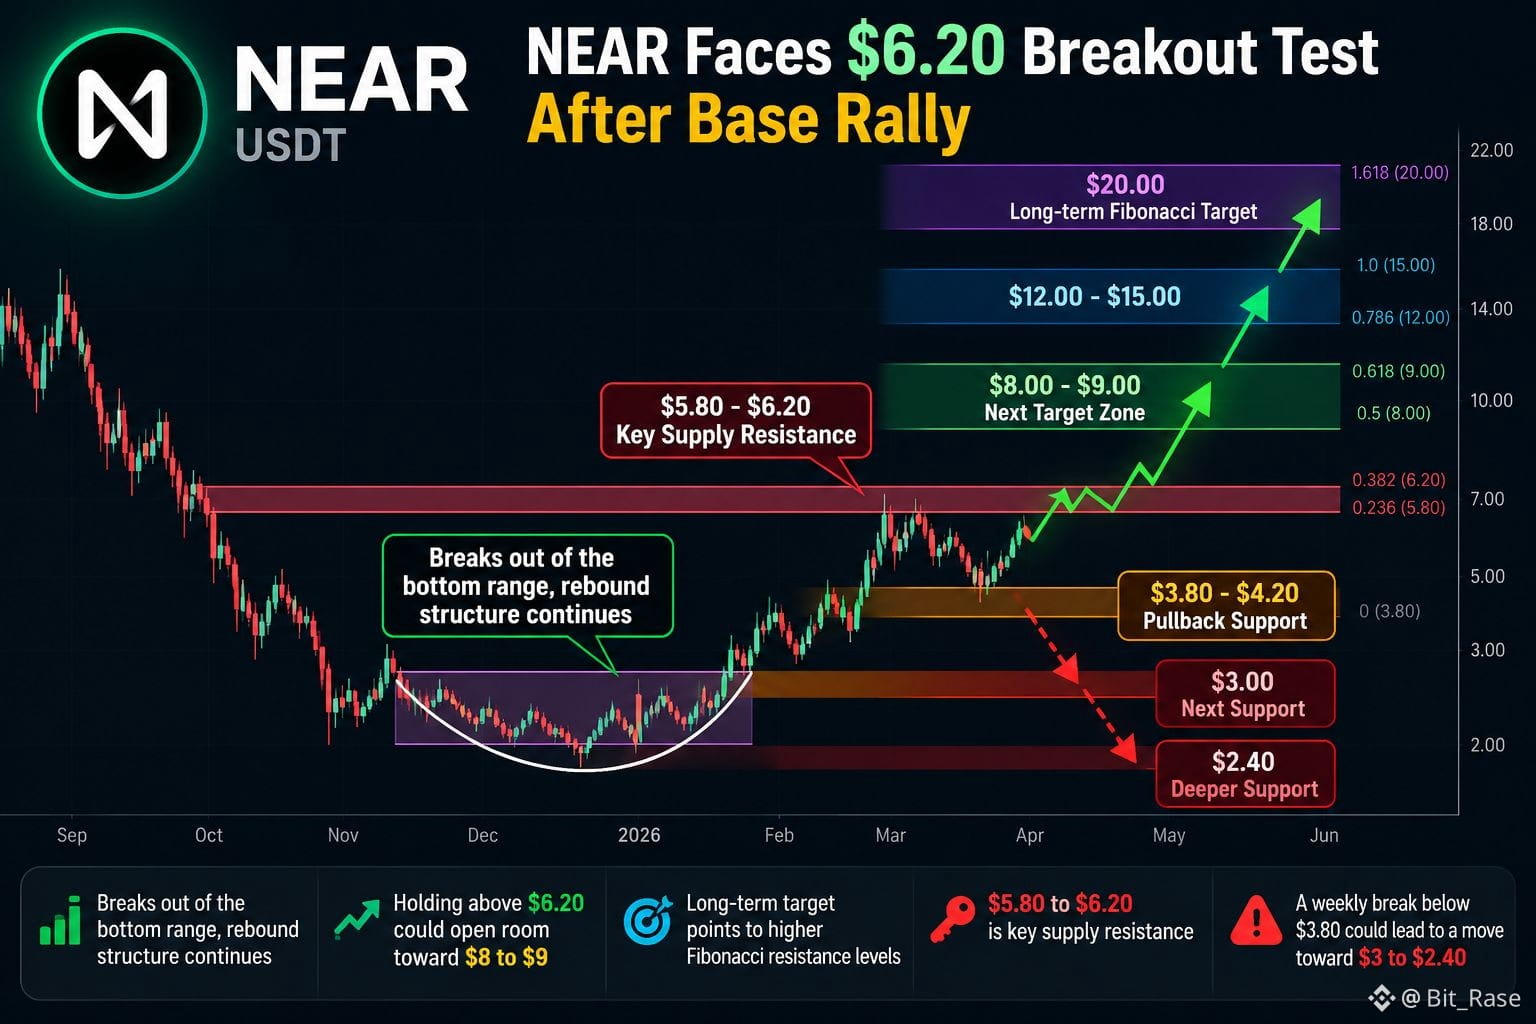
NEAR Faces $6.20 Breakout Test After Base Rally
At The chart setup is binary: a clean break and retest above the $6.20 ceiling would shift attention to the $8-$9 supply zone, while failure to hold the $3.80-$4.20 pullback area would weaken the recovery narrative. Longer-term Fibonacci targets extend toward the prior cycle-high region near $20, but every resistance level still needs to be earned-technical analysis is a staircase, not an elevator.
Breaks out of the bottom range, rebound structure continues
Holding above $6.20 could open room toward $8 to $9
Long-term target points to higher Fibonacci resistance levels
$5.80 to $6.20 is key supply resistance
A weekly break below $3.80 could lead to a move toward $3 to $2.40
$NEAR
{future}(NEARUSDT)
NEAR Faces $6.20 Breakout Test After Base Rally
At The chart setup is binary: a clean break and retest above the $6.20 ceiling would shift attention to the $8-$9 supply zone, while failure to hold the $3.80-$4.20 pullback area would weaken the recovery narrative. Longer-term Fibonacci targets extend toward the prior cycle-high region near $20, but every resistance level still needs to be earned-technical analysis is a staircase, not an elevator.
Breaks out of the bottom range, rebound structure continues
Holding above $6.20 could open room toward $8 to $9
Long-term target points to higher Fibonacci resistance levels
$5.80 to $6.20 is key supply resistance
A weekly break below $3.80 could lead to a move toward $3 to $2.40
$NEAR
At The chart setup is binary: a clean break and retest above the $6.20 ceiling would shift attention to the $8-$9 supply zone, while failure to hold the $3.80-$4.20 pullback area would weaken the recovery narrative. Longer-term Fibonacci targets extend toward the prior cycle-high region near $20, but every resistance level still needs to be earned-technical analysis is a staircase, not an elevator.
Breaks out of the bottom range, rebound structure continues
Holding above $6.20 could open room toward $8 to $9
Long-term target points to higher Fibonacci resistance levels
$5.80 to $6.20 is key supply resistance
A weekly break below $3.80 could lead to a move toward $3 to $2.40
$NEAR
9
1.9k
·
--
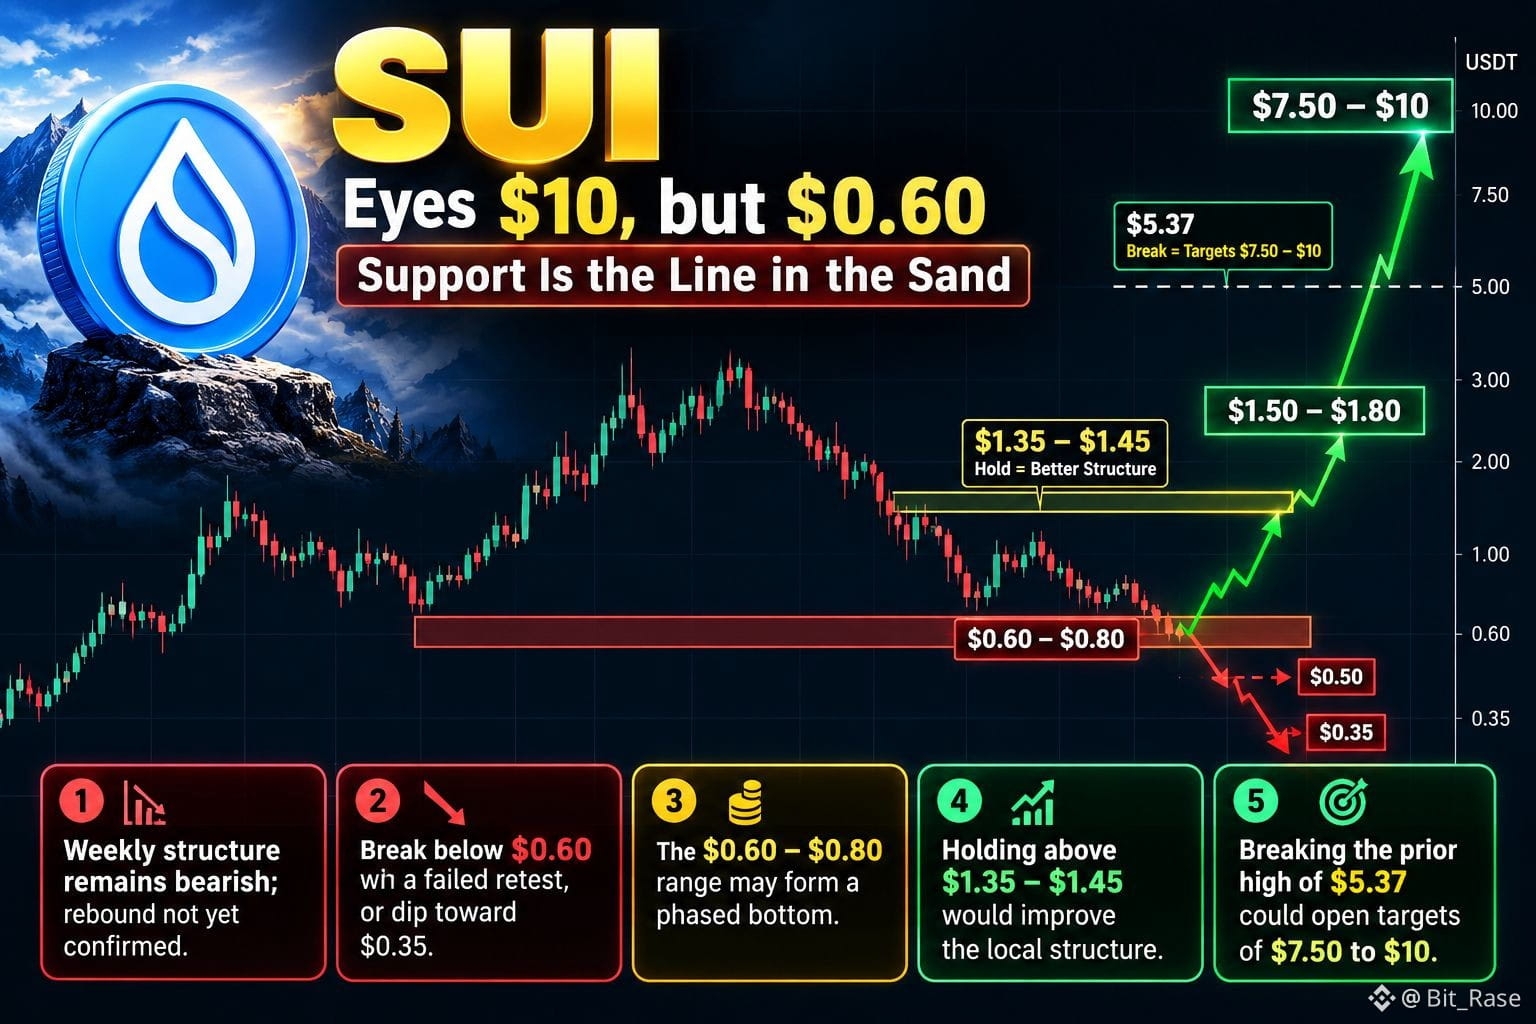
SUI Eyes $10, but $0.60 Support Is the Line in the Sand
At Not a straight ticket to $10, but a weekly repair battle: hold $0.60-$0.80, reclaim key levels after liquidity sweeps. Break $1.35-$1.45, confirm $1.50-$1.80; lose $0.60 and risk points to $0.50-$0.35. $7.50-$10 needs a hold above $5.37.
Weekly structure remains bearish; rebound not yet confirmed
Break below 0.60 with a failed retest, or dip toward 0.35
The 0.60-0.80 range may form a phased bottom
Holding above 1.35-1.45 would improve the local structure
Breaking the prior high of 5.37 could open targets of 7.5 to 10
$SUI
{future}(SUIUSDT)
SUI Eyes $10, but $0.60 Support Is the Line in the Sand
At Not a straight ticket to $10, but a weekly repair battle: hold $0.60-$0.80, reclaim key levels after liquidity sweeps. Break $1.35-$1.45, confirm $1.50-$1.80; lose $0.60 and risk points to $0.50-$0.35. $7.50-$10 needs a hold above $5.37.
Weekly structure remains bearish; rebound not yet confirmed
Break below 0.60 with a failed retest, or dip toward 0.35
The 0.60-0.80 range may form a phased bottom
Holding above 1.35-1.45 would improve the local structure
Breaking the prior high of 5.37 could open targets of 7.5 to 10
$SUI
At Not a straight ticket to $10, but a weekly repair battle: hold $0.60-$0.80, reclaim key levels after liquidity sweeps. Break $1.35-$1.45, confirm $1.50-$1.80; lose $0.60 and risk points to $0.50-$0.35. $7.50-$10 needs a hold above $5.37.
Weekly structure remains bearish; rebound not yet confirmed
Break below 0.60 with a failed retest, or dip toward 0.35
The 0.60-0.80 range may form a phased bottom
Holding above 1.35-1.45 would improve the local structure
Breaking the prior high of 5.37 could open targets of 7.5 to 10
$SUI
6
1.9k
·
--
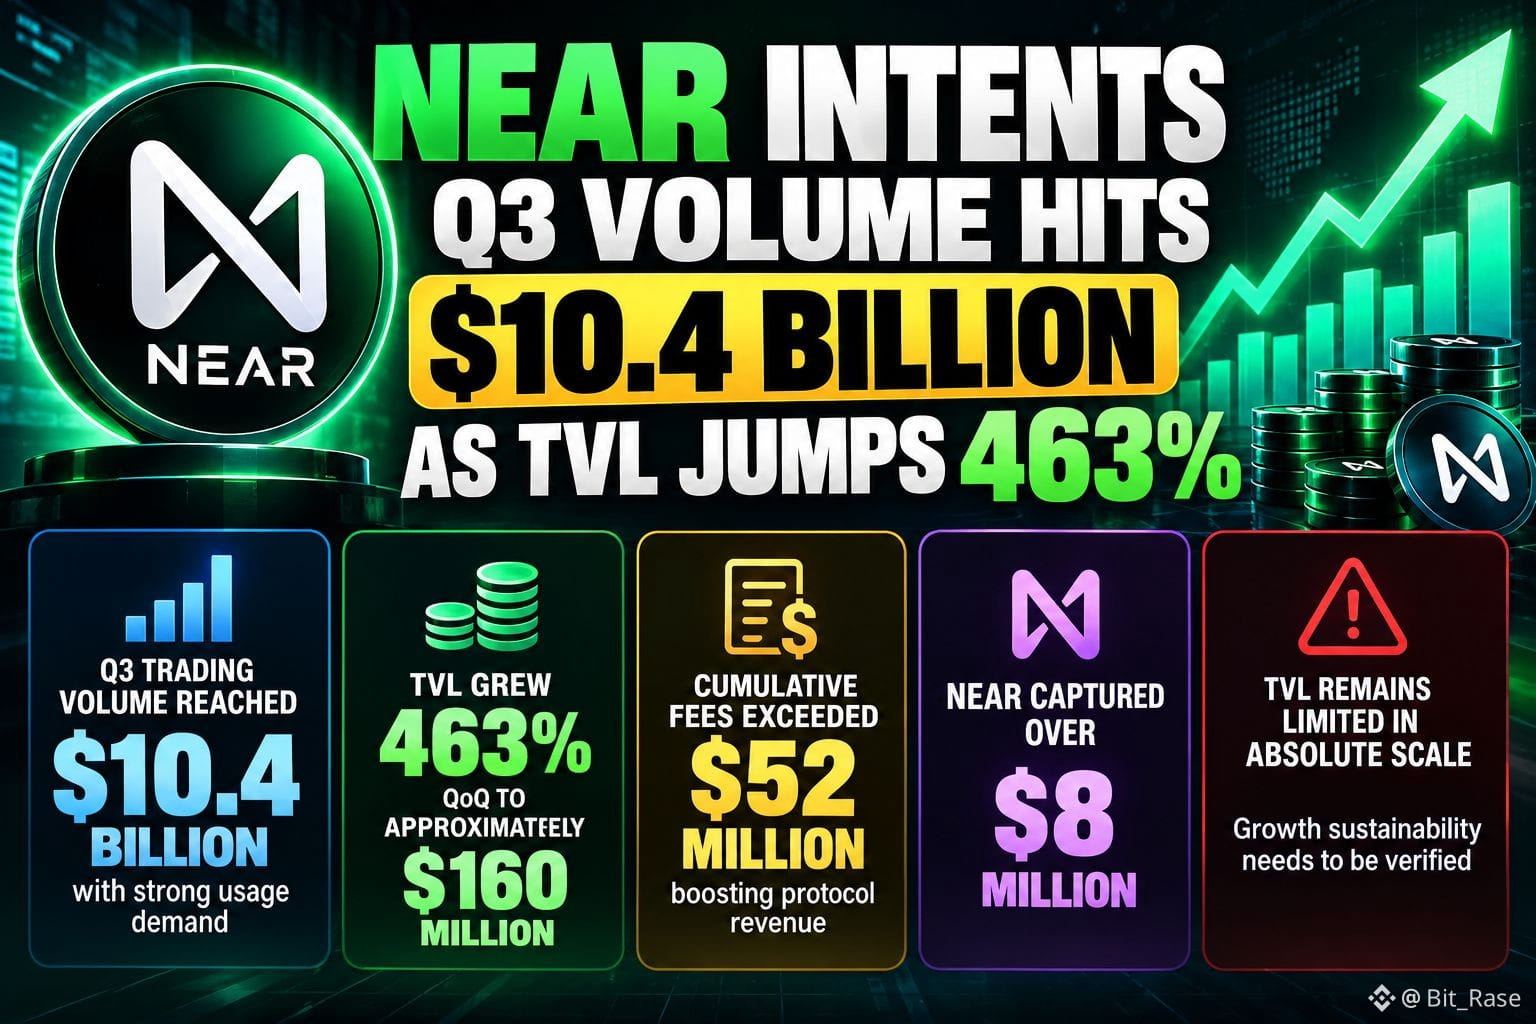
NEAR Intents Q3 Volume Hits $10.4B as TVL Jumps 463%
At This is more than rising cross-chain intent trading: the protocol is converting traffic into verifiable fees and value capture. Cumulative fees exceed $52M, with NEAR capturing over $8M. Focus is whether $160M TVL expands after Confidential Intents opens access.
Q3 trading volume reached $10.4 billion, with strong usage demand
TVL grew 463% QoQ to approximately $160 million
Cumulative fees exceeded $52 million, boosting protocol revenue
NEAR captured over $8 million
TVL remains limited in absolute scale; growth sustainability needs to be verified
$NEAR
{future}(NEARUSDT)
NEAR Intents Q3 Volume Hits $10.4B as TVL Jumps 463%
At This is more than rising cross-chain intent trading: the protocol is converting traffic into verifiable fees and value capture. Cumulative fees exceed $52M, with NEAR capturing over $8M. Focus is whether $160M TVL expands after Confidential Intents opens access.
Q3 trading volume reached $10.4 billion, with strong usage demand
TVL grew 463% QoQ to approximately $160 million
Cumulative fees exceeded $52 million, boosting protocol revenue
NEAR captured over $8 million
TVL remains limited in absolute scale; growth sustainability needs to be verified
$NEAR
At This is more than rising cross-chain intent trading: the protocol is converting traffic into verifiable fees and value capture. Cumulative fees exceed $52M, with NEAR capturing over $8M. Focus is whether $160M TVL expands after Confidential Intents opens access.
Q3 trading volume reached $10.4 billion, with strong usage demand
TVL grew 463% QoQ to approximately $160 million
Cumulative fees exceeded $52 million, boosting protocol revenue
NEAR captured over $8 million
TVL remains limited in absolute scale; growth sustainability needs to be verified
$NEAR
2
396
·
--
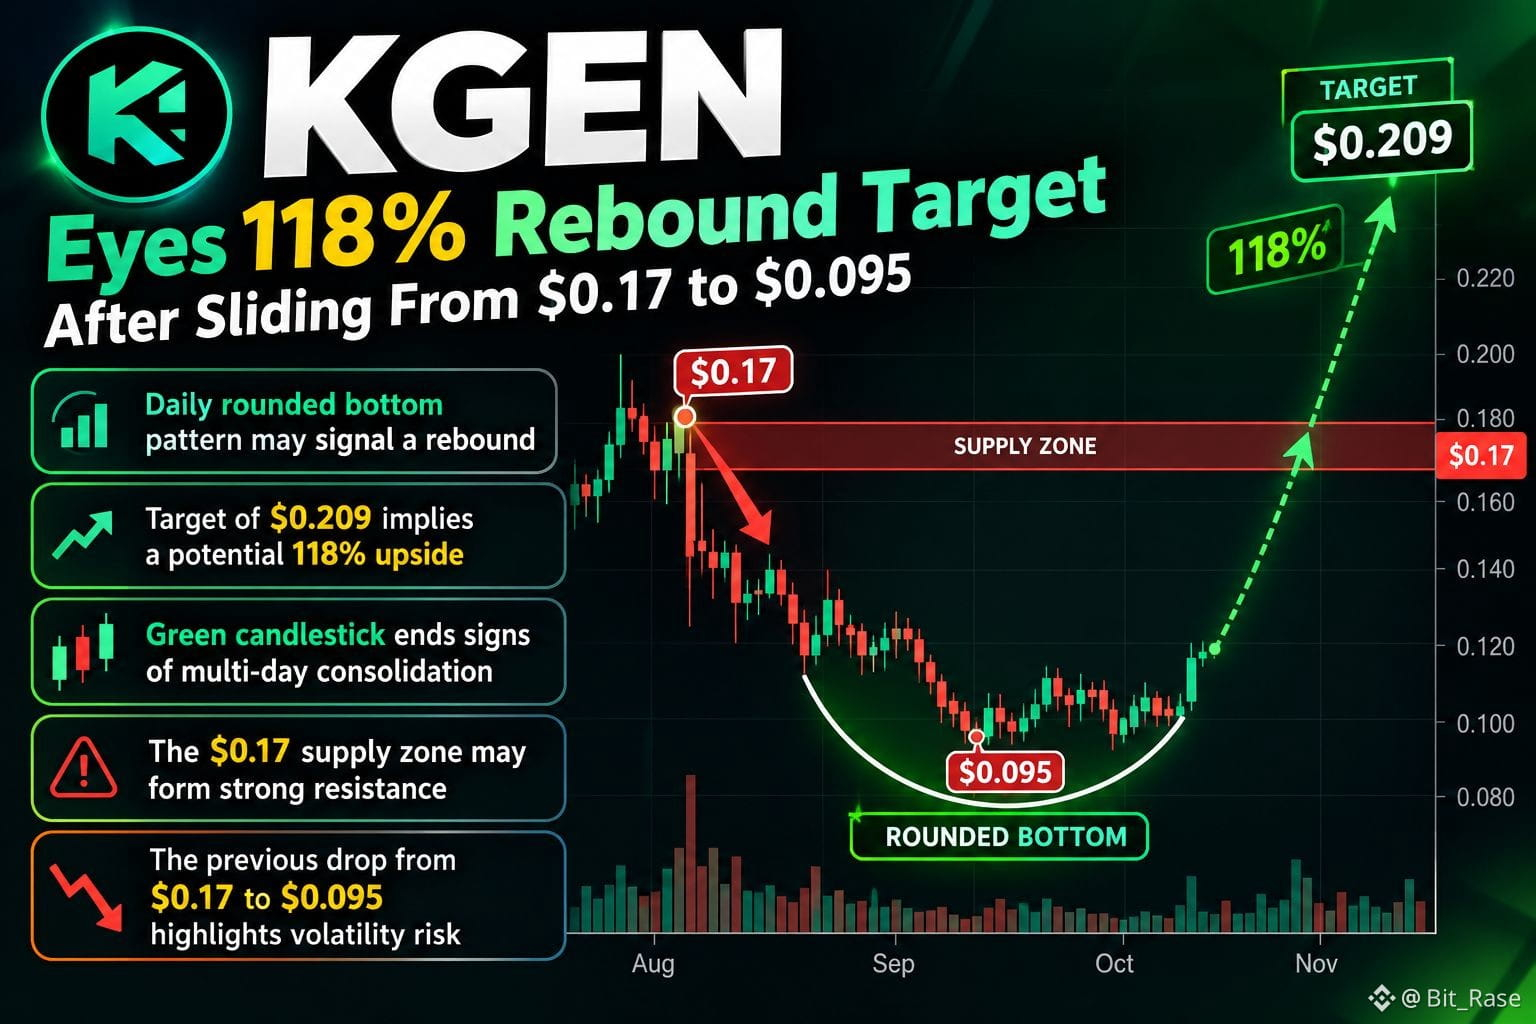
KGEN Eyes 118% Rebound Target After Sliding From $0.17 to $0.095
At The chart thesis hinges on a potential daily rounded-bottom reversal after several sessions of compressed, indecisive trading. A recovery toward the cited $0.17 supply zone is the first real test, not a victory lap; clearing or rejecting there would determine whether momentum can extend toward the heavier-volume area near $0.209. Until then, this is a reversal setup, not a confirmed trend change.
Daily rounded bottom pattern may signal a rebound
Target of 0.209 implies a potential 118% upside
Green candlestick ends signs of multi-day consolidation
The 0.17 supply zone may form strong resistance
The previous drop from 0.17 to 0.095 highlights volatility risk
$KGEN
{future}(KGENUSDT)
KGEN Eyes 118% Rebound Target After Sliding From $0.17 to $0.095
At The chart thesis hinges on a potential daily rounded-bottom reversal after several sessions of compressed, indecisive trading. A recovery toward the cited $0.17 supply zone is the first real test, not a victory lap; clearing or rejecting there would determine whether momentum can extend toward the heavier-volume area near $0.209. Until then, this is a reversal setup, not a confirmed trend change.
Daily rounded bottom pattern may signal a rebound
Target of 0.209 implies a potential 118% upside
Green candlestick ends signs of multi-day consolidation
The 0.17 supply zone may form strong resistance
The previous drop from 0.17 to 0.095 highlights volatility risk
$KGEN
At The chart thesis hinges on a potential daily rounded-bottom reversal after several sessions of compressed, indecisive trading. A recovery toward the cited $0.17 supply zone is the first real test, not a victory lap; clearing or rejecting there would determine whether momentum can extend toward the heavier-volume area near $0.209. Until then, this is a reversal setup, not a confirmed trend change.
Daily rounded bottom pattern may signal a rebound
Target of 0.209 implies a potential 118% upside
Green candlestick ends signs of multi-day consolidation
The 0.17 supply zone may form strong resistance
The previous drop from 0.17 to 0.095 highlights volatility risk
$KGEN
2
561
·
--
Citi Sees Ave Emerging as Tokenized Collateral Liquidity Hub
At The real thesis is not another crypto lending app-it is whether Aave can become the financing layer for assets moving on-chain. V4, Horizon and GHO position it at the intersection of collateral, liquidity and funding. As tokenization expands from stablecoins into money-market funds, private credit, Treasuries and potentially equities, the key watchpoint is whether those assets gain usable collateral flows; that is where tokenization stops being a wrapper and starts behaving like capital markets.
Citi is bullish on Aave becoming a liquidity hub for tokenized collateral
V4, Horizon, and GHO drive expanded financing use cases
Growth in institutions and tokenized assets may expand protocol demand
Tokenized capital markets still need regulatory and market validation
$AAVE
{future}(AAVEUSDT)
Citi Sees Ave Emerging as Tokenized Collateral Liquidity Hub
At The real thesis is not another crypto lending app-it is whether Aave can become the financing layer for assets moving on-chain. V4, Horizon and GHO position it at the intersection of collateral, liquidity and funding. As tokenization expands from stablecoins into money-market funds, private credit, Treasuries and potentially equities, the key watchpoint is whether those assets gain usable collateral flows; that is where tokenization stops being a wrapper and starts behaving like capital markets.
Citi is bullish on Aave becoming a liquidity hub for tokenized collateral
V4, Horizon, and GHO drive expanded financing use cases
Growth in institutions and tokenized assets may expand protocol demand
Tokenized capital markets still need regulatory and market validation
$AAVE
At The real thesis is not another crypto lending app-it is whether Aave can become the financing layer for assets moving on-chain. V4, Horizon and GHO position it at the intersection of collateral, liquidity and funding. As tokenization expands from stablecoins into money-market funds, private credit, Treasuries and potentially equities, the key watchpoint is whether those assets gain usable collateral flows; that is where tokenization stops being a wrapper and starts behaving like capital markets.
Citi is bullish on Aave becoming a liquidity hub for tokenized collateral
V4, Horizon, and GHO drive expanded financing use cases
Growth in institutions and tokenized assets may expand protocol demand
Tokenized capital markets still need regulatory and market validation
$AAVE

2
280
·
--
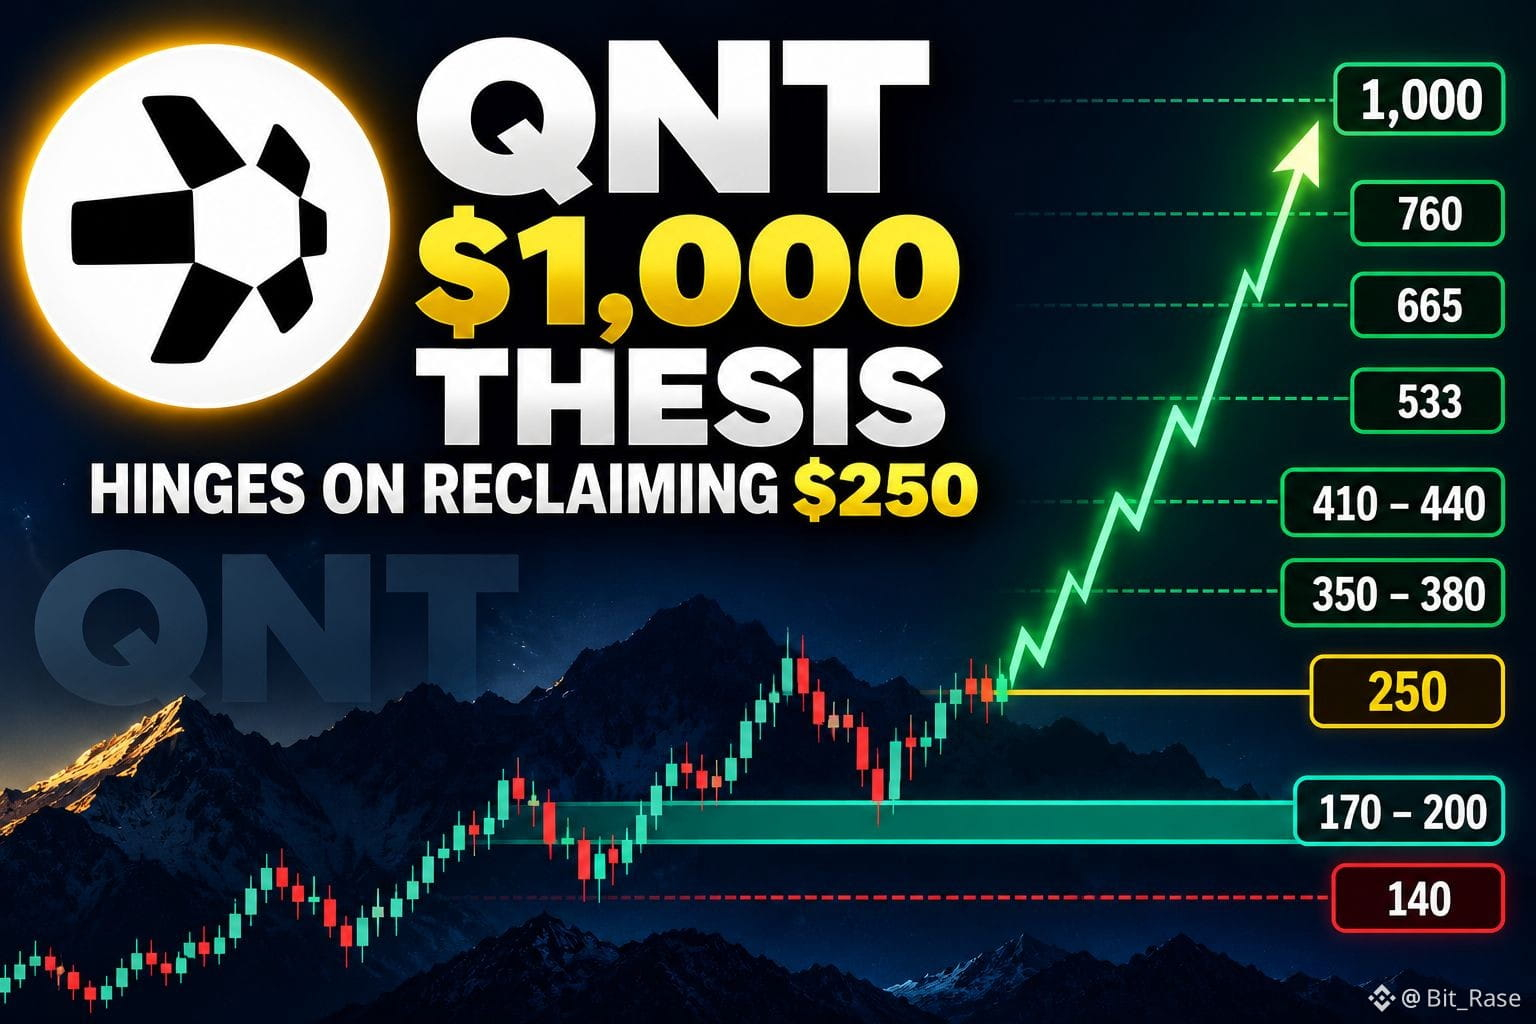
QNT's $1,000 Thesis Hinges on Reclaiming $250
At The "four-digit target" is not a straight sprint but a layered technical setup: holding 170-200 keeps the rebound valid; reclaiming 250 brings 350-380 and 410-440 back into view. Only a confirmed breakout makes 533, 665, and 760 meaningful; below 170, 140 is key.
Reclaiming 250 would confirm the recovery trend
Breaking 410-440 could open the path toward targets of 533 to 1,000
For now, the 170-200 retest zone still needs to hold first
A break below 170 would weaken the short-term technical structure
$QNT
{future}(QNTUSDT)
QNT's $1,000 Thesis Hinges on Reclaiming $250
At The "four-digit target" is not a straight sprint but a layered technical setup: holding 170-200 keeps the rebound valid; reclaiming 250 brings 350-380 and 410-440 back into view. Only a confirmed breakout makes 533, 665, and 760 meaningful; below 170, 140 is key.
Reclaiming 250 would confirm the recovery trend
Breaking 410-440 could open the path toward targets of 533 to 1,000
For now, the 170-200 retest zone still needs to hold first
A break below 170 would weaken the short-term technical structure
$QNT
At The "four-digit target" is not a straight sprint but a layered technical setup: holding 170-200 keeps the rebound valid; reclaiming 250 brings 350-380 and 410-440 back into view. Only a confirmed breakout makes 533, 665, and 760 meaningful; below 170, 140 is key.
Reclaiming 250 would confirm the recovery trend
Breaking 410-440 could open the path toward targets of 533 to 1,000
For now, the 170-200 retest zone still needs to hold first
A break below 170 would weaken the short-term technical structure
$QNT
1
5
1.6k
Connectez-vous pour découvrir plus de contenu
Rejoignez la communauté mondiale des adeptes de cryptomonnaies sur Binance Square
⚡️ Suviez les dernières informations importantes sur les cryptomonnaies.
💬 Jugé digne de confiance par la plus grande plateforme d’échange de cryptomonnaies au monde.
👍 Découvrez les connaissances que partagent les créateurs vérifiés.
Adresse e-mail/Nº de téléphone
Sujets d’actualité
BinancePick
3M vues
152,382 mentions
Join #EarningsSeason: Predict Earnings on Binance Pick, Share Your Take on Binance Square!
Binance Square Official
·409 mentions J’aime
·342.8k vues
EarningsSeason
5.3M vues
25,899 mentions
AnthropicTTMRevenueGrewAbout1200%
25,481 vues
378 mentions