

bigfunzd
47 Publications

bigfunzd
Signaler
Bloquer l’utilisateur
BP-82F3985C1140
25 Suivis
18 Abonnés
53 J’aime
Publications
Tous
Citations
·
--
Haussier
$MU earnings could be more important for the memory cycle than the headline numbers suggest.
Micron guided for Q4 revenue of $50B ± $1B and ~86% gross margin. Q3 already delivered $25.11 EPS, while its Cloud Memory gross margin reached 83%.
For me, the key question is what management says about DRAM pricing, HBM demand and FY2027 margins.
If margins hold above guidance and the outlook stays strong, the memory supercycle narrative gets more support. If pricing momentum slows, the market may focus on how sustainable these numbers really are.
I’ll be watching guidance more than the headline beat.
#EarningsSeason $MUB
$MU earnings could be more important for the memory cycle than the headline numbers suggest.
Micron guided for Q4 revenue of $50B ± $1B and ~86% gross margin. Q3 already delivered $25.11 EPS, while its Cloud Memory gross margin reached 83%.
For me, the key question is what management says about DRAM pricing, HBM demand and FY2027 margins.
If margins hold above guidance and the outlook stays strong, the memory supercycle narrative gets more support. If pricing momentum slows, the market may focus on how sustainable these numbers really are.
I’ll be watching guidance more than the headline beat.
#EarningsSeason $MUB
Micron guided for Q4 revenue of $50B ± $1B and ~86% gross margin. Q3 already delivered $25.11 EPS, while its Cloud Memory gross margin reached 83%.
For me, the key question is what management says about DRAM pricing, HBM demand and FY2027 margins.
If margins hold above guidance and the outlook stays strong, the memory supercycle narrative gets more support. If pricing momentum slows, the market may focus on how sustainable these numbers really are.
I’ll be watching guidance more than the headline beat.
#EarningsSeason $MUB


Binance Square Official
·
--
Earnings Season: Micron Q4 Earnings — Bullish or Bearish?
Binance Square is launching the Earnings Season! Join us as we breakdown the market data before and after earnings from the hottest stocks.
Micron's FY2026 Q4 earnings are about to drop this week. The results aren't just about $MU prices, it becomes a key test of whether the whole memory supercycle narrative can hold up.
Stay tuned to Binance Square Earnings Season — be the first to know and act around the biggest earnings!
What's on the Agenda?
Sep 28 — Micron FY2026 Q4 earnings preview: a quick look at what to watch this quarterSep 29 — Micron Earnings Season preview livestream (Chinese)Sep 30 — Micron Earnings Season preview livestream (English)Oct 1 — Micron FY2026 Q4 earnings recap: digging into the market insights behind dataOct 1 — Post-earnings analysts livestream (Chinese)Oct 2 — Post-earnings analysts livestream (English)
#EarningsSeason Topic Challenge
How to join:
Publish a short post or article with hashtag #EarningsSeason How will you adjust your trades/positions before/after the report? Use trade-sharing cards to share your $MU trades/positions for a higher chance to earn a traffic boost.Back up your view with data or charts, and avoid AI-generated images/views.Try to answer one of the following questions in your post:Are you bullish or bearish on $MU price once Q4 earnings are out?Read Micron FY2026 Q4 earnings preview, and share your take: will Micron really be able to push its gross margin past 86% in Q4? How much longer do you think the memory super cycle can run?
Submission window:
Sep 29, 2026, 10:00 – Oct 1, 2026, 10:00 (UTC)
Rewards:
Qualified posts that comply with the above guidelines will be reviewed and may receive a random traffic boost in views. Use trade-sharing cards to share your $MU trades/positions for a higher chance to earn a traffic boost. You will receive a notification from your feed secretary if your post is selected. Get a chance to have your views featured on Binance Square Official.
Need ideas for your post? Visit #EarningsSeason or the Square Guide on How to Post for Better Reach.
Micron's FY2026 Q4 earnings are about to drop this week. The results aren't just about $MU prices, it becomes a key test of whether the whole memory supercycle narrative can hold up.
Stay tuned to Binance Square Earnings Season — be the first to know and act around the biggest earnings!
What's on the Agenda?
Sep 28 — Micron FY2026 Q4 earnings preview: a quick look at what to watch this quarterSep 29 — Micron Earnings Season preview livestream (Chinese)Sep 30 — Micron Earnings Season preview livestream (English)Oct 1 — Micron FY2026 Q4 earnings recap: digging into the market insights behind dataOct 1 — Post-earnings analysts livestream (Chinese)Oct 2 — Post-earnings analysts livestream (English)
#EarningsSeason Topic Challenge
How to join:
Publish a short post or article with hashtag #EarningsSeason How will you adjust your trades/positions before/after the report? Use trade-sharing cards to share your $MU trades/positions for a higher chance to earn a traffic boost.Back up your view with data or charts, and avoid AI-generated images/views.Try to answer one of the following questions in your post:Are you bullish or bearish on $MU price once Q4 earnings are out?Read Micron FY2026 Q4 earnings preview, and share your take: will Micron really be able to push its gross margin past 86% in Q4? How much longer do you think the memory super cycle can run?
Submission window:
Sep 29, 2026, 10:00 – Oct 1, 2026, 10:00 (UTC)
Rewards:
Qualified posts that comply with the above guidelines will be reviewed and may receive a random traffic boost in views. Use trade-sharing cards to share your $MU trades/positions for a higher chance to earn a traffic boost. You will receive a notification from your feed secretary if your post is selected. Get a chance to have your views featured on Binance Square Official.
Need ideas for your post? Visit #EarningsSeason or the Square Guide on How to Post for Better Reach.

1
191
·
--

Article
Where is your USDT right now, and where do you need it?Your USDT has been sitting on Ethereum, but the mini-app you actually want to use lives on TON. Or, perhaps, you are holding USDT on TON, but the farm you want to enter is on Base. This is one of the most common situations in multichain crypto: the networks are different, and that changes everything.
Why you cannot just “send” USDT across chains
What is the most recognizable asset for users of various blockchains? For many users, that asset is USDT. Tether alone accounts for around 59% of the entire stablecoin market — more than every other stablecoin put together.
USDT on TON, USDT on TRON, and USDT on Ethereum may share the same name and the same dollar peg, but they are not the same technical object.
Each network has its own addresses, token contracts, wallet standards, gas rules, and settlement environment. A normal token transfer only works inside a single blockchain — it moves the token between two addresses on the same network. It cannot carry that token out of one network and into another.
This is where the most common beginner mistake happens. Many wallets and exchanges support several networks, and the interface may let you send USDT on one network to an address on a completely different one. On the screen it looks like one action. In reality, the transfer is broadcast on the wrong network, the receiving address does not exist there, and in most cases the funds are unrecoverable.
That is why sending assets across networks requires a special mechanism. There are several, and they work in different ways. Let’s walk through the main options
1. Centralized exchange
You deposit USDT from one network, trade or convert if needed, and withdraw to another network.
The benefit is familiarity. Many users already know this flow, and exchanges often support many networks.
The trade-off is custody. During the process, your funds sit on the exchange. You may also deal with KYC, withdrawal fees, maintenance windows, limits, or delays.
👍 Good for: users who are comfortable with exchanges, custodial flows, and sharing personal data for KYC.
👎 Less ideal for: users who want a self-custodial DeFi flow.
2. Bridge and bridge aggregators
A bridge helps move assets between blockchains. In many cases, this means locking or holding an asset on one side and creating a representation of it on another side. That representation is often called a wrapped token.
A bridge aggregator searches across several bridges and providers to find a route. This improves the experience because users do not have to manually compare every bridge themselves. The aggregator may help find a better option by cost, speed, or supported networks.
The trade-off is that waiting times vary, some routes depend on wrapped assets. Beside this, bridges hold pooled liquidity across chains, which makes them one of the most concentrated attack surfaces in DeFi. According to DeFiLlama, cross-chain bridge exploits account for over $345 million in cumulative losses since 2022.
👍 Good for: specific transfer needs and route discovery. 👎 Less ideal for: users who do not want to research the differences between bridges, and those who prefer to avoid the bridge security risk.
3. Cross-chain atomic swap
A cross-chain atomic swap lets you exchange an asset on one blockchain directly for an asset on another blockchain. For example:
USDT on TON → USDC on Base USDT on TRON → USDT on TON USDC on Ethereum → USDT on TRON
What does "atomic" mean? The swap is one indivisible action. Both sides are cryptographically linked, so either the transaction completes as quoted, or neither happens and your funds stay where they started.
What this changes compared to the other options:
No custody. The swap is self-custodial from start to finish. Your funds stay in your wallet until the moment they leave for the destination — no account or KYC needed.
No bridge attack surface. The largest bridge exploits drained pooled reserves of locked assets. Atomic swaps do not hold funds in that shape — each swap is a direct paired exchange, not a withdrawal from a shared pool.
No wrapped token. You receive the native asset on the destination chain.
The quote is the fill. The price shown at confirmation is the price that executes.
With STONfi cross-chain swaps, the process happens inside one self-custodial interface. You choose the asset, choose the destination, review the amount, confirm — and that’s it!
Behind the swap is Omniston, STONfi’s protocol that unifies TON's fragmented liquidity across DEXs and RFQ resolvers and serves as a cross-chain execution layer. It coordinates the cross-chain flow so that the user does not have to manually manage bridges, separate swaps, or intermediate steps.
Ready to explore simple and secure routes across chains? Join the STONfi’s cross-chain campaign and learn how to move assets: complete tasks, collect miles, and unlock weekly
#STONfi
Where is your USDT right now, and where do you need it?
Your USDT has been sitting on Ethereum, but the mini-app you actually want to use lives on TON. Or, perhaps, you are holding USDT on TON, but the farm you want to enter is on Base. This is one of the most common situations in multichain crypto: the networks are different, and that changes everything.
Why you cannot just “send” USDT across chains
What is the most recognizable asset for users of various blockchains? For many users, that asset is USDT. Tether alone accounts for around 59% of the entire stablecoin market — more than every other stablecoin put together.
USDT on TON, USDT on TRON, and USDT on Ethereum may share the same name and the same dollar peg, but they are not the same technical object.
Each network has its own addresses, token contracts, wallet standards, gas rules, and settlement environment. A normal token transfer only works inside a single blockchain — it moves the token between two addresses on the same network. It cannot carry that token out of one network and into another.
This is where the most common beginner mistake happens. Many wallets and exchanges support several networks, and the interface may let you send USDT on one network to an address on a completely different one. On the screen it looks like one action. In reality, the transfer is broadcast on the wrong network, the receiving address does not exist there, and in most cases the funds are unrecoverable.
That is why sending assets across networks requires a special mechanism. There are several, and they work in different ways. Let’s walk through the main options
1. Centralized exchange
You deposit USDT from one network, trade or convert if needed, and withdraw to another network.
The benefit is familiarity. Many users already know this flow, and exchanges often support many networks.
The trade-off is custody. During the process, your funds sit on the exchange. You may also deal with KYC, withdrawal fees, maintenance windows, limits, or delays.
👍 Good for: users who are comfortable with exchanges, custodial flows, and sharing personal data for KYC.
👎 Less ideal for: users who want a self-custodial DeFi flow.
2. Bridge and bridge aggregators
A bridge helps move assets between blockchains. In many cases, this means locking or holding an asset on one side and creating a representation of it on another side. That representation is often called a wrapped token.
A bridge aggregator searches across several bridges and providers to find a route. This improves the experience because users do not have to manually compare every bridge themselves. The aggregator may help find a better option by cost, speed, or supported networks.
The trade-off is that waiting times vary, some routes depend on wrapped assets. Beside this, bridges hold pooled liquidity across chains, which makes them one of the most concentrated attack surfaces in DeFi. According to DeFiLlama, cross-chain bridge exploits account for over $345 million in cumulative losses since 2022.
👍 Good for: specific transfer needs and route discovery. 👎 Less ideal for: users who do not want to research the differences between bridges, and those who prefer to avoid the bridge security risk.
3. Cross-chain atomic swap
A cross-chain atomic swap lets you exchange an asset on one blockchain directly for an asset on another blockchain. For example:
USDT on TON → USDC on Base USDT on TRON → USDT on TON USDC on Ethereum → USDT on TRON
What does "atomic" mean? The swap is one indivisible action. Both sides are cryptographically linked, so either the transaction completes as quoted, or neither happens and your funds stay where they started.
What this changes compared to the other options:
No custody. The swap is self-custodial from start to finish. Your funds stay in your wallet until the moment they leave for the destination — no account or KYC needed.
No bridge attack surface. The largest bridge exploits drained pooled reserves of locked assets. Atomic swaps do not hold funds in that shape — each swap is a direct paired exchange, not a withdrawal from a shared pool.
No wrapped token. You receive the native asset on the destination chain.
The quote is the fill. The price shown at confirmation is the price that executes.
With STONfi cross-chain swaps, the process happens inside one self-custodial interface. You choose the asset, choose the destination, review the amount, confirm — and that’s it!
Behind the swap is Omniston, STONfi’s protocol that unifies TON's fragmented liquidity across DEXs and RFQ resolvers and serves as a cross-chain execution layer. It coordinates the cross-chain flow so that the user does not have to manually manage bridges, separate swaps, or intermediate steps.
Ready to explore simple and secure routes across chains? Join the STONfi’s cross-chain campaign and learn how to move assets: complete tasks, collect miles, and unlock weekly
#STONfi
Why you cannot just “send” USDT across chains
What is the most recognizable asset for users of various blockchains? For many users, that asset is USDT. Tether alone accounts for around 59% of the entire stablecoin market — more than every other stablecoin put together.
USDT on TON, USDT on TRON, and USDT on Ethereum may share the same name and the same dollar peg, but they are not the same technical object.
Each network has its own addresses, token contracts, wallet standards, gas rules, and settlement environment. A normal token transfer only works inside a single blockchain — it moves the token between two addresses on the same network. It cannot carry that token out of one network and into another.
This is where the most common beginner mistake happens. Many wallets and exchanges support several networks, and the interface may let you send USDT on one network to an address on a completely different one. On the screen it looks like one action. In reality, the transfer is broadcast on the wrong network, the receiving address does not exist there, and in most cases the funds are unrecoverable.
That is why sending assets across networks requires a special mechanism. There are several, and they work in different ways. Let’s walk through the main options
1. Centralized exchange
You deposit USDT from one network, trade or convert if needed, and withdraw to another network.
The benefit is familiarity. Many users already know this flow, and exchanges often support many networks.
The trade-off is custody. During the process, your funds sit on the exchange. You may also deal with KYC, withdrawal fees, maintenance windows, limits, or delays.
👍 Good for: users who are comfortable with exchanges, custodial flows, and sharing personal data for KYC.
👎 Less ideal for: users who want a self-custodial DeFi flow.
2. Bridge and bridge aggregators
A bridge helps move assets between blockchains. In many cases, this means locking or holding an asset on one side and creating a representation of it on another side. That representation is often called a wrapped token.
A bridge aggregator searches across several bridges and providers to find a route. This improves the experience because users do not have to manually compare every bridge themselves. The aggregator may help find a better option by cost, speed, or supported networks.
The trade-off is that waiting times vary, some routes depend on wrapped assets. Beside this, bridges hold pooled liquidity across chains, which makes them one of the most concentrated attack surfaces in DeFi. According to DeFiLlama, cross-chain bridge exploits account for over $345 million in cumulative losses since 2022.
👍 Good for: specific transfer needs and route discovery. 👎 Less ideal for: users who do not want to research the differences between bridges, and those who prefer to avoid the bridge security risk.
3. Cross-chain atomic swap
A cross-chain atomic swap lets you exchange an asset on one blockchain directly for an asset on another blockchain. For example:
USDT on TON → USDC on Base USDT on TRON → USDT on TON USDC on Ethereum → USDT on TRON
What does "atomic" mean? The swap is one indivisible action. Both sides are cryptographically linked, so either the transaction completes as quoted, or neither happens and your funds stay where they started.
What this changes compared to the other options:
No custody. The swap is self-custodial from start to finish. Your funds stay in your wallet until the moment they leave for the destination — no account or KYC needed.
No bridge attack surface. The largest bridge exploits drained pooled reserves of locked assets. Atomic swaps do not hold funds in that shape — each swap is a direct paired exchange, not a withdrawal from a shared pool.
No wrapped token. You receive the native asset on the destination chain.
The quote is the fill. The price shown at confirmation is the price that executes.
With STONfi cross-chain swaps, the process happens inside one self-custodial interface. You choose the asset, choose the destination, review the amount, confirm — and that’s it!
Behind the swap is Omniston, STONfi’s protocol that unifies TON's fragmented liquidity across DEXs and RFQ resolvers and serves as a cross-chain execution layer. It coordinates the cross-chain flow so that the user does not have to manually manage bridges, separate swaps, or intermediate steps.
Ready to explore simple and secure routes across chains? Join the STONfi’s cross-chain campaign and learn how to move assets: complete tasks, collect miles, and unlock weekly
#STONfi
1
53
·
--
Haussier
Stablecoins are becoming more than a way to hold dollar value in crypto. They are increasingly becoming the liquidity layer connecting different ecosystems.
That’s why the STON.fi integration with Arc caught my attention.
Arc is built with stablecoin finance in mind, while USDC serves as its native gas token. Bringing that environment into Omniston creates another route for stablecoin liquidity to interact with assets across supported chains.
What I find interesting is the bigger infrastructure shift.
Instead of liquidity staying isolated inside individual ecosystems, cross-chain systems can help make that liquidity more accessible without forcing users to manage every network separately.
This is where I think the real value of cross-chain infrastructure becomes clearer: not simply adding more chains, but making liquidity more connected and useful.
The initial $1,000 transaction limit on the Arc integration is also worth keeping in mind. Adoption is built through real usage, and practical limits matter alongside the technology.
@ston_fi #STONfi #Omniston #Arc #USDC #DeFi
#STONfi
Stablecoins are becoming more than a way to hold dollar value in crypto. They are increasingly becoming the liquidity layer connecting different ecosystems.
That’s why the STON.fi integration with Arc caught my attention.
Arc is built with stablecoin finance in mind, while USDC serves as its native gas token. Bringing that environment into Omniston creates another route for stablecoin liquidity to interact with assets across supported chains.
What I find interesting is the bigger infrastructure shift.
Instead of liquidity staying isolated inside individual ecosystems, cross-chain systems can help make that liquidity more accessible without forcing users to manage every network separately.
This is where I think the real value of cross-chain infrastructure becomes clearer: not simply adding more chains, but making liquidity more connected and useful.
The initial $1,000 transaction limit on the Arc integration is also worth keeping in mind. Adoption is built through real usage, and practical limits matter alongside the technology.
@ston_fi #STONfi #Omniston #Arc #USDC #DeFi
#STONfi
That’s why the STON.fi integration with Arc caught my attention.
Arc is built with stablecoin finance in mind, while USDC serves as its native gas token. Bringing that environment into Omniston creates another route for stablecoin liquidity to interact with assets across supported chains.
What I find interesting is the bigger infrastructure shift.
Instead of liquidity staying isolated inside individual ecosystems, cross-chain systems can help make that liquidity more accessible without forcing users to manage every network separately.
This is where I think the real value of cross-chain infrastructure becomes clearer: not simply adding more chains, but making liquidity more connected and useful.
The initial $1,000 transaction limit on the Arc integration is also worth keeping in mind. Adoption is built through real usage, and practical limits matter alongside the technology.
@ston_fi #STONfi #Omniston #Arc #USDC #DeFi
#STONfi

2
162
·
--
Haussier
I like how $CASH is building a simple way to bring more utility into crypto payments. The idea is practical, and I’m interested to see how the ecosystem develops over time.
SR-2EC0409A17488137D9BA78EA
I like how $CASH is building a simple way to bring more utility into crypto payments. The idea is practical, and I’m interested to see how the ecosystem develops over time.
SR-2EC0409A17488137D9BA78EA
SR-2EC0409A17488137D9BA78EA
1
44
·
--
Haussier
Binance makes crypto trading simple.
From buying and selling to tracking the market, everything you need is right in one app.
Simple. Fast. Built for crypto.
SR-2EC0409A17488137D9BA78EA
$CASHCAT
Binance makes crypto trading simple.
From buying and selling to tracking the market, everything you need is right in one app.
Simple. Fast. Built for crypto.
SR-2EC0409A17488137D9BA78EA
$CASHCAT
From buying and selling to tracking the market, everything you need is right in one app.
Simple. Fast. Built for crypto.
SR-2EC0409A17488137D9BA78EA
$CASHCAT
77
·
--
Haussier
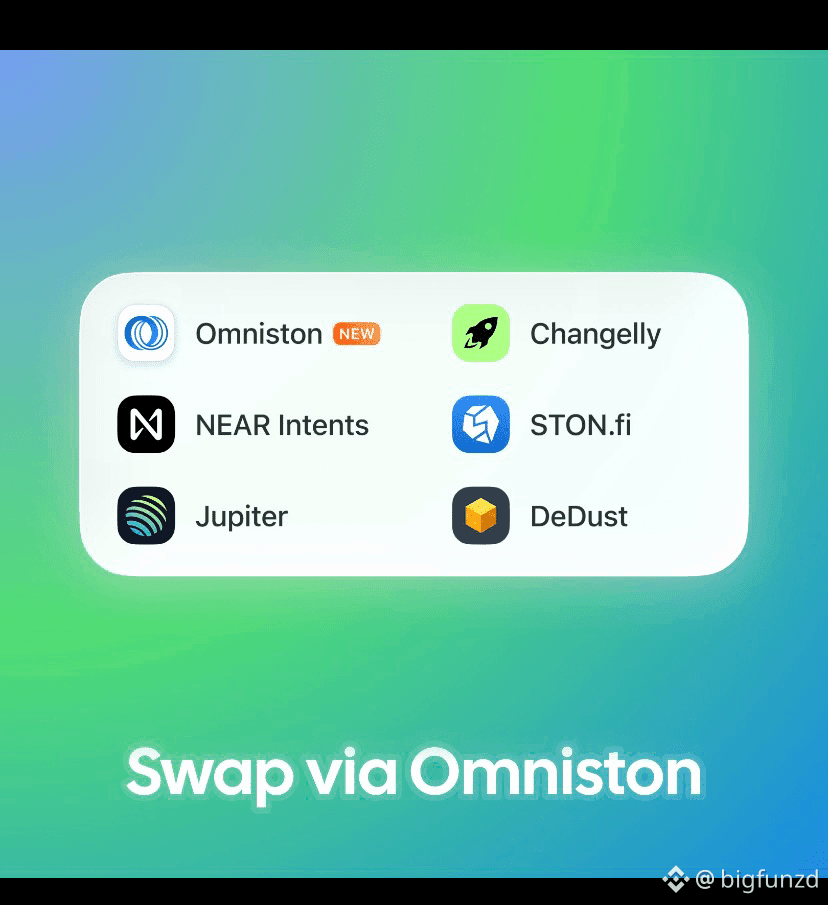
Swap via Omniston 🔍
This image is about making cross-chain swaps simpler.
Omniston provides swap infrastructure that connects users and applications to liquidity across different blockchain ecosystems.
NEAR Intents lets users focus on the outcome they want instead of manually choosing bridges, DEXs, and routes.
The other platforms shown — Jupiter, STON.fi, DeDust, and Changelly — represent different trading and liquidity ecosystems.
The bigger idea is:
Different chains + different liquidity sources → one simpler swap experience.
Instead of:
Bridge → find liquidity → swap → manage gas
the goal is simply:
“I have this asset. I want that asset.”
The infrastructure and liquidity providers handle the complexity behind the scenes.
That’s the bigger story behind “Swap via Omniston.” 🚀
#STONfi
@stonfi
#GlobalStockFundsSee$18.62BInflow
Swap via Omniston 🔍
This image is about making cross-chain swaps simpler.
Omniston provides swap infrastructure that connects users and applications to liquidity across different blockchain ecosystems.
NEAR Intents lets users focus on the outcome they want instead of manually choosing bridges, DEXs, and routes.
The other platforms shown — Jupiter, STON.fi, DeDust, and Changelly — represent different trading and liquidity ecosystems.
The bigger idea is:
Different chains + different liquidity sources → one simpler swap experience.
Instead of:
Bridge → find liquidity → swap → manage gas
the goal is simply:
“I have this asset. I want that asset.”
The infrastructure and liquidity providers handle the complexity behind the scenes.
That’s the bigger story behind “Swap via Omniston.” 🚀
#STONfi
@STONfi DEX
#GlobalStockFundsSee$18.62BInflow
This image is about making cross-chain swaps simpler.
Omniston provides swap infrastructure that connects users and applications to liquidity across different blockchain ecosystems.
NEAR Intents lets users focus on the outcome they want instead of manually choosing bridges, DEXs, and routes.
The other platforms shown — Jupiter, STON.fi, DeDust, and Changelly — represent different trading and liquidity ecosystems.
The bigger idea is:
Different chains + different liquidity sources → one simpler swap experience.
Instead of:
Bridge → find liquidity → swap → manage gas
the goal is simply:
“I have this asset. I want that asset.”
The infrastructure and liquidity providers handle the complexity behind the scenes.
That’s the bigger story behind “Swap via Omniston.” 🚀
#STONfi
@STONfi DEX
#GlobalStockFundsSee$18.62BInflow
1
148
·
--
Haussier
Asset management shouldn’t feel complicated.
Affluent is building infrastructure for trustless, seamless asset management—designed to make onchain finance easier to access, manage, and scale.
The bigger vision is simple: remove unnecessary friction and create an experience where managing digital assets feels natural, secure, and accessible to everyone.
Better infrastructure. Smarter asset management. Built for mass adoption.
#STONfi
@stonfi
#STONfi✅
Asset management shouldn’t feel complicated.
Affluent is building infrastructure for trustless, seamless asset management—designed to make onchain finance easier to access, manage, and scale.
The bigger vision is simple: remove unnecessary friction and create an experience where managing digital assets feels natural, secure, and accessible to everyone.
Better infrastructure. Smarter asset management. Built for mass adoption.
#STONfi
@STONfi DEX
#STONfi✅
Affluent is building infrastructure for trustless, seamless asset management—designed to make onchain finance easier to access, manage, and scale.
The bigger vision is simple: remove unnecessary friction and create an experience where managing digital assets feels natural, secure, and accessible to everyone.
Better infrastructure. Smarter asset management. Built for mass adoption.
#STONfi
@STONfi DEX
#STONfi✅
1
96
·
--
Haussier
One word? Mine is: Interoperable.
DeFi in 2026 feels less like a collection of separate blockchains and more like one connected financial ecosystem. The projects making the biggest impact aren’t just launching new features—they’re removing friction and making on-chain experiences simpler for everyone.
Whether you’re swapping assets, providing liquidity, or exploring new ecosystems, the goal remains the same: fast, secure, and seamless access.
If I had to describe where DeFi is headed in one word, it would be Interoperable.
What’s your one word? 👇
@Stone_Onchain
#STON #DeFi #TON #Web3
#STON.fi
@STONfi DEX
One word? Mine is: Interoperable.
DeFi in 2026 feels less like a collection of separate blockchains and more like one connected financial ecosystem. The projects making the biggest impact aren’t just launching new features—they’re removing friction and making on-chain experiences simpler for everyone.
Whether you’re swapping assets, providing liquidity, or exploring new ecosystems, the goal remains the same: fast, secure, and seamless access.
If I had to describe where DeFi is headed in one word, it would be Interoperable.
What’s your one word? 👇
@Stone_Onchain
#STON #DeFi #TON #Web3
#STON.fi
@STONfi DEX
DeFi in 2026 feels less like a collection of separate blockchains and more like one connected financial ecosystem. The projects making the biggest impact aren’t just launching new features—they’re removing friction and making on-chain experiences simpler for everyone.
Whether you’re swapping assets, providing liquidity, or exploring new ecosystems, the goal remains the same: fast, secure, and seamless access.
If I had to describe where DeFi is headed in one word, it would be Interoperable.
What’s your one word? 👇
@Stone_Onchain
#STON #DeFi #TON #Web3
#STON.fi
@STONfi DEX


1
193
·
--
Haussier
TRON Cross-Chain Flows Are Now Live on STON.fi
The future of DeFi is built on seamless connectivity, and this integration is another major step toward a truly interconnected blockchain ecosystem.
With TRON now supported on STON.fi’s Cross-Chain Flow, users can move assets across networks with greater efficiency, unlocking faster transactions, deeper liquidity, and a smoother cross-chain experience.
As barriers between blockchains continue to disappear, interoperability is becoming the foundation of Web3 innovation. Every new integration strengthens the ecosystem, expands opportunities for users and builders, and brings decentralized finance closer to mass adoption.
Cross-chain isn’t just a feature anymore—it’s the future. And with TRON joining the STON.fi Cross-Chain Flow, that future is already taking shape. 🚀
#STONfi
@stonfi
TRON Cross-Chain Flows Are Now Live on STON.fi
The future of DeFi is built on seamless connectivity, and this integration is another major step toward a truly interconnected blockchain ecosystem.
With TRON now supported on STON.fi’s Cross-Chain Flow, users can move assets across networks with greater efficiency, unlocking faster transactions, deeper liquidity, and a smoother cross-chain experience.
As barriers between blockchains continue to disappear, interoperability is becoming the foundation of Web3 innovation. Every new integration strengthens the ecosystem, expands opportunities for users and builders, and brings decentralized finance closer to mass adoption.
Cross-chain isn’t just a feature anymore—it’s the future. And with TRON joining the STON.fi Cross-Chain Flow, that future is already taking shape. 🚀
#STONfi
@STONfi DEX
The future of DeFi is built on seamless connectivity, and this integration is another major step toward a truly interconnected blockchain ecosystem.
With TRON now supported on STON.fi’s Cross-Chain Flow, users can move assets across networks with greater efficiency, unlocking faster transactions, deeper liquidity, and a smoother cross-chain experience.
As barriers between blockchains continue to disappear, interoperability is becoming the foundation of Web3 innovation. Every new integration strengthens the ecosystem, expands opportunities for users and builders, and brings decentralized finance closer to mass adoption.
Cross-chain isn’t just a feature anymore—it’s the future. And with TRON joining the STON.fi Cross-Chain Flow, that future is already taking shape. 🚀
#STONfi
@STONfi DEX

1
93
·
--
Article
📈 — steady uptrend💡OPEN/USDT — Breakdown After Failed Breakout Attempt (1D)
Price Action:
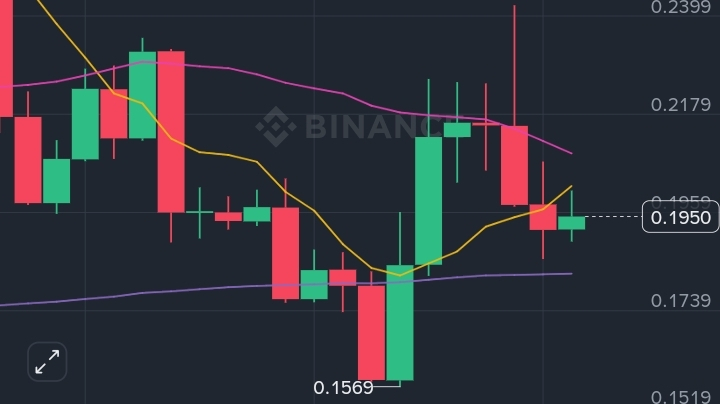
Trading at 0.1950 (-4.46%) after rejection from the 0.2067 local high
Previous breakout momentum lost strength near MA25 resistance
Daily candles now show weakening bullish continuation and rising indecision
Trend Structure:
Market remains in recovery mode, but upside momentum has slowed
Failure to hold above MA25 (0.2091) keeps macro structure neutral-to-cautious
Price currently sitting between short-term support and long-term trend support
Moving Average Signals:
MA7 (0.2018): Price trading below short-term momentum line → bearish short-term pressure
MA25 (0.2091): Major resistance zone rejecting price expansion
MA99 (0.1822): Long-term support still holding structure intact
Volume & Participation:
24h volume: 12.76M OPEN (~$2.51M)
Volume declining compared to breakout phase → momentum cooling
No aggressive follow-through buying after the recent rally attempt
Order Book Sentiment:
Buyers: 48.77%
Sellers: 51.23%
Slight sell-side dominance suggests profit-taking and weak continuation demand
Key Levels:
Level Type Significance
0.2067 Resistance Recovery continuation trigger
0.2091 MA25 Resistance Key macro reclaim level
0.1950 Current Zone Short-term decision area
0.1822 MA99 Support Structural defense level
0.1569 Swing Low Major invalidation zone
Strategic Insight:
Current structure looks like a cooldown phase after failed breakout continuation
Holding above 0.1822 keeps the broader recovery structure alive
Losing this support could shift momentum back toward bearish control
Positioning Logic:
Strong bullish confirmation only returns above 0.2091–0.2067 reclaim zone
Until then, expect range-bound movement or weak consolidation
Risk/reward currently favors patience over aggressive chasing
Edge Insight:
The important signal here is not the pullback itself — it’s the lack of strong buyer follow-through after the breakout attempt. Strong trends attract continuation volume quickly. When price stalls under major moving averages with declining participation, the market usually enters a re-accumulation or redistribution phase before the next major move
$OPEN
#OpleLedger
@Openledger
📈 — steady uptrend
💡OPEN/USDT — Breakdown After Failed Breakout Attempt (1D)
Price Action:
Trading at 0.1950 (-4.46%) after rejection from the 0.2067 local high
Previous breakout momentum lost strength near MA25 resistance
Daily candles now show weakening bullish continuation and rising indecision
Trend Structure:
Market remains in recovery mode, but upside momentum has slowed
Failure to hold above MA25 (0.2091) keeps macro structure neutral-to-cautious
Price currently sitting between short-term support and long-term trend support
Moving Average Signals:
MA7 (0.2018): Price trading below short-term momentum line → bearish short-term pressure
MA25 (0.2091): Major resistance zone rejecting price expansion
MA99 (0.1822): Long-term support still holding structure intact
Volume & Participation:
24h volume: 12.76M OPEN (~$2.51M)
Volume declining compared to breakout phase → momentum cooling
No aggressive follow-through buying after the recent rally attempt
Order Book Sentiment:
Buyers: 48.77%
Sellers: 51.23%
Slight sell-side dominance suggests profit-taking and weak continuation demand
Key Levels:
Level Type Significance
0.2067 Resistance Recovery continuation trigger
0.2091 MA25 Resistance Key macro reclaim level
0.1950 Current Zone Short-term decision area
0.1822 MA99 Support Structural defense level
0.1569 Swing Low Major invalidation zone
Strategic Insight:
Current structure looks like a cooldown phase after failed breakout continuation
Holding above 0.1822 keeps the broader recovery structure alive
Losing this support could shift momentum back toward bearish control
Positioning Logic:
Strong bullish confirmation only returns above 0.2091–0.2067 reclaim zone
Until then, expect range-bound movement or weak consolidation
Risk/reward currently favors patience over aggressive chasing
Edge Insight:
The important signal here is not the pullback itself — it’s the lack of strong buyer follow-through after the breakout attempt. Strong trends attract continuation volume quickly. When price stalls under major moving averages with declining participation, the market usually enters a re-accumulation or redistribution phase before the next major move
$OPEN
#OpleLedger
@Openledger
Price Action:
Trading at 0.1950 (-4.46%) after rejection from the 0.2067 local high
Previous breakout momentum lost strength near MA25 resistance
Daily candles now show weakening bullish continuation and rising indecision
Trend Structure:
Market remains in recovery mode, but upside momentum has slowed
Failure to hold above MA25 (0.2091) keeps macro structure neutral-to-cautious
Price currently sitting between short-term support and long-term trend support
Moving Average Signals:
MA7 (0.2018): Price trading below short-term momentum line → bearish short-term pressure
MA25 (0.2091): Major resistance zone rejecting price expansion
MA99 (0.1822): Long-term support still holding structure intact
Volume & Participation:
24h volume: 12.76M OPEN (~$2.51M)
Volume declining compared to breakout phase → momentum cooling
No aggressive follow-through buying after the recent rally attempt
Order Book Sentiment:
Buyers: 48.77%
Sellers: 51.23%
Slight sell-side dominance suggests profit-taking and weak continuation demand
Key Levels:
Level Type Significance
0.2067 Resistance Recovery continuation trigger
0.2091 MA25 Resistance Key macro reclaim level
0.1950 Current Zone Short-term decision area
0.1822 MA99 Support Structural defense level
0.1569 Swing Low Major invalidation zone
Strategic Insight:
Current structure looks like a cooldown phase after failed breakout continuation
Holding above 0.1822 keeps the broader recovery structure alive
Losing this support could shift momentum back toward bearish control
Positioning Logic:
Strong bullish confirmation only returns above 0.2091–0.2067 reclaim zone
Until then, expect range-bound movement or weak consolidation
Risk/reward currently favors patience over aggressive chasing
Edge Insight:
The important signal here is not the pullback itself — it’s the lack of strong buyer follow-through after the breakout attempt. Strong trends attract continuation volume quickly. When price stalls under major moving averages with declining participation, the market usually enters a re-accumulation or redistribution phase before the next major move
$OPEN
#OpleLedger
@Openledger
1
18
·
--
Haussier
#openledger $OPEN
💡OPEN/USDT — Breakdown After Failed Breakout Attempt (1D)
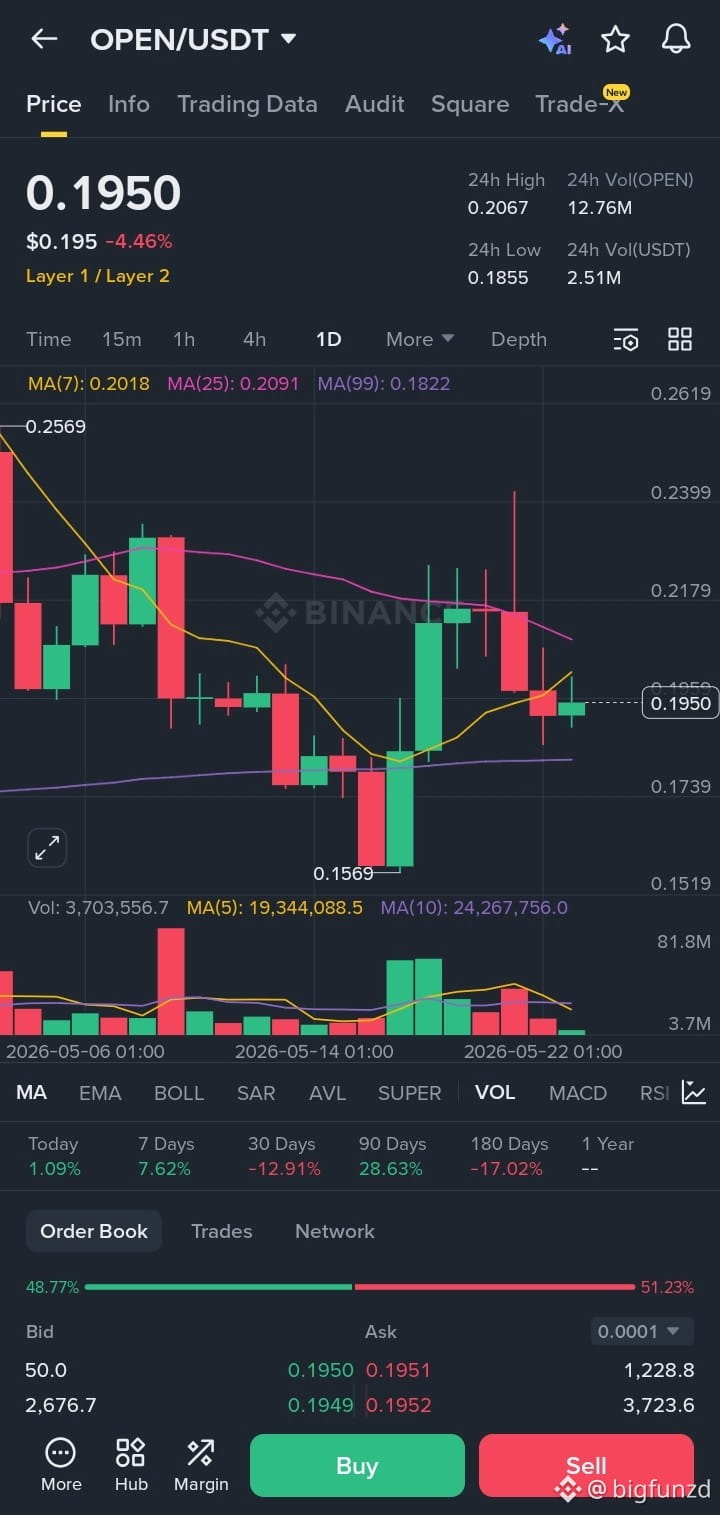
Price Action:
Trading at 0.1950 (-4.46%) after rejection from the 0.2067 local high
Previous breakout momentum lost strength near MA25 resistance
Daily candles now show weakening bullish continuation and rising indecision
Trend Structure:
Market remains in recovery mode, but upside momentum has slowed
Failure to hold above MA25 (0.2091) keeps macro structure neutral-to-cautious
Price currently sitting between short-term support and long-term trend support
Moving Average Signals:
MA7 (0.2018): Price trading below short-term momentum line → bearish short-term pressure
MA25 (0.2091): Major resistance zone rejecting price expansion
MA99 (0.1822): Long-term support still holding structure intact
Volume & Participation:
24h volume: 12.76M OPEN (~$2.51M)
Volume declining compared to breakout phase → momentum cooling
No aggressive follow-through buying after the recent rally attempt
Order Book Sentiment:
Buyers: 48.77%
Sellers: 51.23%
Slight sell-side dominance suggests profit-taking and weak continuation demand
Key Levels:
Level Type Significance
0.2067 Resistance Recovery continuation trigger
0.2091 MA25 Resistance Key macro reclaim level
0.1950 Current Zone Short-term decision area
0.1822 MA99 Support Structural defense level
0.1569 Swing Low Major invalidation zone
Strategic Insight:
Current structure looks like a cooldown phase after failed breakout continuation
Holding above 0.1822 keeps the broader recovery structure alive
Losing this support could shift momentum back toward bearish control
Positioning Logic:
Strong bullish confirmation only returns above 0.2091–0.2067 reclaim zone
Until then, expect range-bound movement or weak consolidation
Risk/reward currently favors patience over aggressive chasing
Edge Insight:
The important signal here is not the pullback itself — it’s the lack of strong buyer follow-through after the breakout attempt. Strong trends attract continuation volume quickly. When price
$OPEN
$BNB
#openledger $OPEN
💡OPEN/USDT — Breakdown After Failed Breakout Attempt (1D)
Price Action:
Trading at 0.1950 (-4.46%) after rejection from the 0.2067 local high
Previous breakout momentum lost strength near MA25 resistance
Daily candles now show weakening bullish continuation and rising indecision
Trend Structure:
Market remains in recovery mode, but upside momentum has slowed
Failure to hold above MA25 (0.2091) keeps macro structure neutral-to-cautious
Price currently sitting between short-term support and long-term trend support
Moving Average Signals:
MA7 (0.2018): Price trading below short-term momentum line → bearish short-term pressure
MA25 (0.2091): Major resistance zone rejecting price expansion
MA99 (0.1822): Long-term support still holding structure intact
Volume & Participation:
24h volume: 12.76M OPEN (~$2.51M)
Volume declining compared to breakout phase → momentum cooling
No aggressive follow-through buying after the recent rally attempt
Order Book Sentiment:
Buyers: 48.77%
Sellers: 51.23%
Slight sell-side dominance suggests profit-taking and weak continuation demand
Key Levels:
Level Type Significance
0.2067 Resistance Recovery continuation trigger
0.2091 MA25 Resistance Key macro reclaim level
0.1950 Current Zone Short-term decision area
0.1822 MA99 Support Structural defense level
0.1569 Swing Low Major invalidation zone
Strategic Insight:
Current structure looks like a cooldown phase after failed breakout continuation
Holding above 0.1822 keeps the broader recovery structure alive
Losing this support could shift momentum back toward bearish control
Positioning Logic:
Strong bullish confirmation only returns above 0.2091–0.2067 reclaim zone
Until then, expect range-bound movement or weak consolidation
Risk/reward currently favors patience over aggressive chasing
Edge Insight:
The important signal here is not the pullback itself — it’s the lack of strong buyer follow-through after the breakout attempt. Strong trends attract continuation volume quickly. When price
$OPEN
$BNB
💡OPEN/USDT — Breakdown After Failed Breakout Attempt (1D)
Price Action:
Trading at 0.1950 (-4.46%) after rejection from the 0.2067 local high
Previous breakout momentum lost strength near MA25 resistance
Daily candles now show weakening bullish continuation and rising indecision
Trend Structure:
Market remains in recovery mode, but upside momentum has slowed
Failure to hold above MA25 (0.2091) keeps macro structure neutral-to-cautious
Price currently sitting between short-term support and long-term trend support
Moving Average Signals:
MA7 (0.2018): Price trading below short-term momentum line → bearish short-term pressure
MA25 (0.2091): Major resistance zone rejecting price expansion
MA99 (0.1822): Long-term support still holding structure intact
Volume & Participation:
24h volume: 12.76M OPEN (~$2.51M)
Volume declining compared to breakout phase → momentum cooling
No aggressive follow-through buying after the recent rally attempt
Order Book Sentiment:
Buyers: 48.77%
Sellers: 51.23%
Slight sell-side dominance suggests profit-taking and weak continuation demand
Key Levels:
Level Type Significance
0.2067 Resistance Recovery continuation trigger
0.2091 MA25 Resistance Key macro reclaim level
0.1950 Current Zone Short-term decision area
0.1822 MA99 Support Structural defense level
0.1569 Swing Low Major invalidation zone
Strategic Insight:
Current structure looks like a cooldown phase after failed breakout continuation
Holding above 0.1822 keeps the broader recovery structure alive
Losing this support could shift momentum back toward bearish control
Positioning Logic:
Strong bullish confirmation only returns above 0.2091–0.2067 reclaim zone
Until then, expect range-bound movement or weak consolidation
Risk/reward currently favors patience over aggressive chasing
Edge Insight:
The important signal here is not the pullback itself — it’s the lack of strong buyer follow-through after the breakout attempt. Strong trends attract continuation volume quickly. When price
$OPEN
$BNB
1
15
·
--
Article
🚀 — breakout / expansion$PLUME
💡PLUME/USDT — Momentum Expansion With Seller Pressure Nearby (4H)
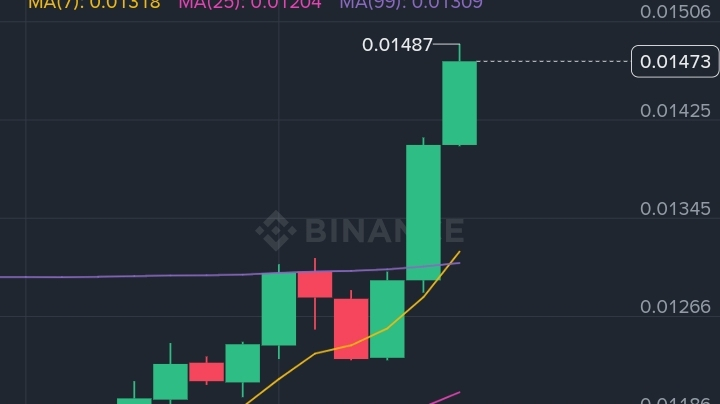
Price Action:
Trading at 0.01473 (+21.23%) after a strong breakout from the 0.01200 consolidation zone
Consecutive bullish candles pushed price into 0.01487 resistance
Structure remains bullish with higher highs and expanding momentum
Trend Structure:
Market transitioned from consolidation into aggressive expansion
Break above long-term trend levels signals possible macro reversal
Current move is momentum-driven, but nearing short-term exhaustion zones
Moving Average Signals:
MA7 (0.01318): Strong upward slope → short-term momentum acceleration
MA25 (0.01204): Medium-term support baseline
MA99 (0.01309): Recently reclaimed → bullish structural confirmation
Volume & Participation:
398.32M PLUME traded (~$5.28M volume)
Rising green volume confirms genuine buying participation
Breakout backed by liquidity, not thin-market volatility
Order Book Sentiment:
Buyers: 48.01%
Sellers: 51.99%
Slight sell-side dominance suggests profit-taking pressure building near resistance
Key Levels:
Level Type Significance
0.01487 Resistance Breakout continuation trigger
0.01320–0.01350 Retest Zone Momentum support area
0.01200 Major Support Previous consolidation base
0.01124 Swing Low Structural invalidation zone
Strategic Insight:
Momentum remains bullish, but price is stretched above short-term averages
Minor cooldown or sideways consolidation would strengthen continuation odds
Holding above 0.01320 keeps breakout structure healthy
Positioning Logic:
Chasing vertical candles near resistance increases risk exposure
Stronger entries usually come after retests or support confirmation
Clean breakout above 0.01487 could open path toward 0.01600 psychological resistance
Edge Insight:
The important detail here is the divergence between price momentum and order-book pressure. Price is expanding, but sellers are beginning to stack overhead. Sustainable continuation depends on whether buyers can absorb that supply without losing structure.
#OpleLedger
#OplenLedger
#Oplendger和OPEN
🚀 — breakout / expansion
$PLUME
💡PLUME/USDT — Momentum Expansion With Seller Pressure Nearby (4H)
Price Action:
Trading at 0.01473 (+21.23%) after a strong breakout from the 0.01200 consolidation zone
Consecutive bullish candles pushed price into 0.01487 resistance
Structure remains bullish with higher highs and expanding momentum
Trend Structure:
Market transitioned from consolidation into aggressive expansion
Break above long-term trend levels signals possible macro reversal
Current move is momentum-driven, but nearing short-term exhaustion zones
Moving Average Signals:
MA7 (0.01318): Strong upward slope → short-term momentum acceleration
MA25 (0.01204): Medium-term support baseline
MA99 (0.01309): Recently reclaimed → bullish structural confirmation
Volume & Participation:
398.32M PLUME traded (~$5.28M volume)
Rising green volume confirms genuine buying participation
Breakout backed by liquidity, not thin-market volatility
Order Book Sentiment:
Buyers: 48.01%
Sellers: 51.99%
Slight sell-side dominance suggests profit-taking pressure building near resistance
Key Levels:
Level Type Significance
0.01487 Resistance Breakout continuation trigger
0.01320–0.01350 Retest Zone Momentum support area
0.01200 Major Support Previous consolidation base
0.01124 Swing Low Structural invalidation zone
Strategic Insight:
Momentum remains bullish, but price is stretched above short-term averages
Minor cooldown or sideways consolidation would strengthen continuation odds
Holding above 0.01320 keeps breakout structure healthy
Positioning Logic:
Chasing vertical candles near resistance increases risk exposure
Stronger entries usually come after retests or support confirmation
Clean breakout above 0.01487 could open path toward 0.01600 psychological resistance
Edge Insight:
The important detail here is the divergence between price momentum and order-book pressure. Price is expanding, but sellers are beginning to stack overhead. Sustainable continuation depends on whether buyers can absorb that supply without losing structure.
#OpleLedger
#OplenLedger
#Oplendger和OPEN
💡PLUME/USDT — Momentum Expansion With Seller Pressure Nearby (4H)
Price Action:
Trading at 0.01473 (+21.23%) after a strong breakout from the 0.01200 consolidation zone
Consecutive bullish candles pushed price into 0.01487 resistance
Structure remains bullish with higher highs and expanding momentum
Trend Structure:
Market transitioned from consolidation into aggressive expansion
Break above long-term trend levels signals possible macro reversal
Current move is momentum-driven, but nearing short-term exhaustion zones
Moving Average Signals:
MA7 (0.01318): Strong upward slope → short-term momentum acceleration
MA25 (0.01204): Medium-term support baseline
MA99 (0.01309): Recently reclaimed → bullish structural confirmation
Volume & Participation:
398.32M PLUME traded (~$5.28M volume)
Rising green volume confirms genuine buying participation
Breakout backed by liquidity, not thin-market volatility
Order Book Sentiment:
Buyers: 48.01%
Sellers: 51.99%
Slight sell-side dominance suggests profit-taking pressure building near resistance
Key Levels:
Level Type Significance
0.01487 Resistance Breakout continuation trigger
0.01320–0.01350 Retest Zone Momentum support area
0.01200 Major Support Previous consolidation base
0.01124 Swing Low Structural invalidation zone
Strategic Insight:
Momentum remains bullish, but price is stretched above short-term averages
Minor cooldown or sideways consolidation would strengthen continuation odds
Holding above 0.01320 keeps breakout structure healthy
Positioning Logic:
Chasing vertical candles near resistance increases risk exposure
Stronger entries usually come after retests or support confirmation
Clean breakout above 0.01487 could open path toward 0.01600 psychological resistance
Edge Insight:
The important detail here is the divergence between price momentum and order-book pressure. Price is expanding, but sellers are beginning to stack overhead. Sustainable continuation depends on whether buyers can absorb that supply without losing structure.
#OpleLedger
#OplenLedger
#Oplendger和OPEN
1
142
·
--
Haussier
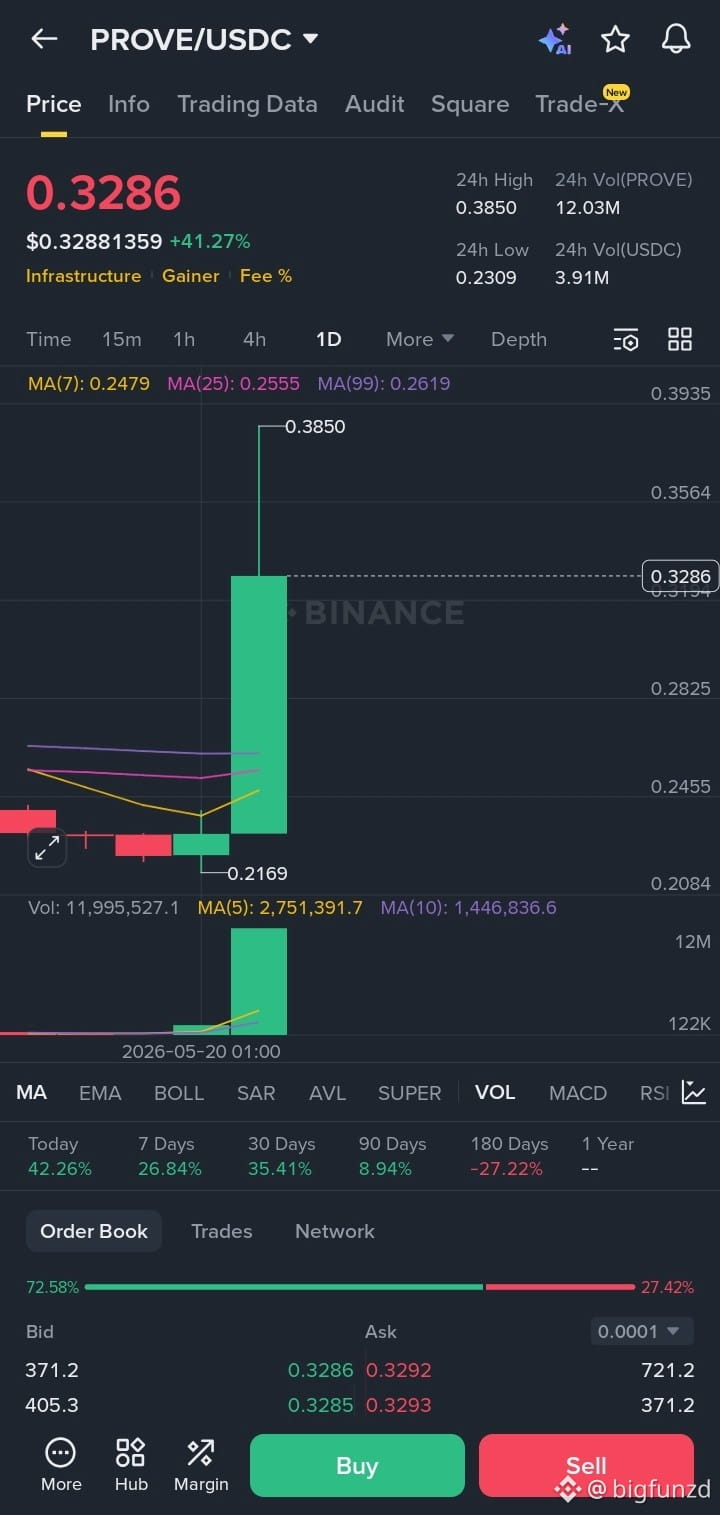
$PROVE
💡PROVE/USDC — Volatility Expansion Breakout (1D)
Price Action:
Trading at 0.3286 (+41.27%) after a major daily breakout
Explosive move from compression phase into full momentum expansion
Wick reached 0.3850 before initial profit-taking appeared
Market Structure:
Long-term sideways/downtrend structure has been broken
Daily candle reclaimed all major moving averages in one expansion move
Current setup reflects aggressive price discovery, not normal trend continuation
Moving Average Signals:
MA7: 0.2479
MA25: 0.2555
MA99: 0.2619
Price aggressively detached above MA cluster → short-term overextension risk increasing
Volume & Participation:
12.03M PROVE traded (~$3.91M)
Massive volume expansion confirms real participation behind the move
This is not low-liquidity drift; capital rotation is visible
Order Book Sentiment:
Buyers dominate with 72.58% bids vs 27.42% asks
Indicates strong dip-buying behavior and thin overhead supply
Key Levels:
Level Type Significance
0.3850 Resistance Breakout continuation trigger
0.3000 Holding Zone Momentum maintenance area
0.2800–0.2600 Retest Zone Healthy cooldown support
0.2169 Swing Low Breakout origin base
Strategic Insight:
Momentum remains strongly bullish, but the daily candle is overheated
Vertical expansions usually need consolidation before sustainable continuation
Holding above 0.3000 keeps buyers in control for another upside attempt
Positioning Logic: $PROVE
Chasing after a 40%+ daily candle carries poor asymmetric risk
Better setups come from consolidation or controlled pullback into support zones
A successful retest of the MA cluster would strengthen macro reversal probability
Edge Insight:
The real signal here is the shift from compression → expansion with aggressive order-book imbalance. Strong trends begin when liquidity, volume, and structural breakout align simultaneously. PROVE is currently showing all three, but sustainability now depends on whether buyers can defend higher price acceptance after the initial impulse
#openledger $OPEN
$PROVE
💡PROVE/USDC — Volatility Expansion Breakout (1D)
Price Action:
Trading at 0.3286 (+41.27%) after a major daily breakout
Explosive move from compression phase into full momentum expansion
Wick reached 0.3850 before initial profit-taking appeared
Market Structure:
Long-term sideways/downtrend structure has been broken
Daily candle reclaimed all major moving averages in one expansion move
Current setup reflects aggressive price discovery, not normal trend continuation
Moving Average Signals:
MA7: 0.2479
MA25: 0.2555
MA99: 0.2619
Price aggressively detached above MA cluster → short-term overextension risk increasing
Volume & Participation:
12.03M PROVE traded (~$3.91M)
Massive volume expansion confirms real participation behind the move
This is not low-liquidity drift; capital rotation is visible
Order Book Sentiment:
Buyers dominate with 72.58% bids vs 27.42% asks
Indicates strong dip-buying behavior and thin overhead supply
Key Levels:
Level Type Significance
0.3850 Resistance Breakout continuation trigger
0.3000 Holding Zone Momentum maintenance area
0.2800–0.2600 Retest Zone Healthy cooldown support
0.2169 Swing Low Breakout origin base
Strategic Insight:
Momentum remains strongly bullish, but the daily candle is overheated
Vertical expansions usually need consolidation before sustainable continuation
Holding above 0.3000 keeps buyers in control for another upside attempt
Positioning Logic: $PROVE
Chasing after a 40%+ daily candle carries poor asymmetric risk
Better setups come from consolidation or controlled pullback into support zones
A successful retest of the MA cluster would strengthen macro reversal probability
Edge Insight:
The real signal here is the shift from compression → expansion with aggressive order-book imbalance. Strong trends begin when liquidity, volume, and structural breakout align simultaneously. PROVE is currently showing all three, but sustainability now depends on whether buyers can defend higher price acceptance after the initial impulse
#openledger $OPEN
💡PROVE/USDC — Volatility Expansion Breakout (1D)
Price Action:
Trading at 0.3286 (+41.27%) after a major daily breakout
Explosive move from compression phase into full momentum expansion
Wick reached 0.3850 before initial profit-taking appeared
Market Structure:
Long-term sideways/downtrend structure has been broken
Daily candle reclaimed all major moving averages in one expansion move
Current setup reflects aggressive price discovery, not normal trend continuation
Moving Average Signals:
MA7: 0.2479
MA25: 0.2555
MA99: 0.2619
Price aggressively detached above MA cluster → short-term overextension risk increasing
Volume & Participation:
12.03M PROVE traded (~$3.91M)
Massive volume expansion confirms real participation behind the move
This is not low-liquidity drift; capital rotation is visible
Order Book Sentiment:
Buyers dominate with 72.58% bids vs 27.42% asks
Indicates strong dip-buying behavior and thin overhead supply
Key Levels:
Level Type Significance
0.3850 Resistance Breakout continuation trigger
0.3000 Holding Zone Momentum maintenance area
0.2800–0.2600 Retest Zone Healthy cooldown support
0.2169 Swing Low Breakout origin base
Strategic Insight:
Momentum remains strongly bullish, but the daily candle is overheated
Vertical expansions usually need consolidation before sustainable continuation
Holding above 0.3000 keeps buyers in control for another upside attempt
Positioning Logic: $PROVE
Chasing after a 40%+ daily candle carries poor asymmetric risk
Better setups come from consolidation or controlled pullback into support zones
A successful retest of the MA cluster would strengthen macro reversal probability
Edge Insight:
The real signal here is the shift from compression → expansion with aggressive order-book imbalance. Strong trends begin when liquidity, volume, and structural breakout align simultaneously. PROVE is currently showing all three, but sustainability now depends on whether buyers can defend higher price acceptance after the initial impulse
#openledger $OPEN
1
176
·
--
Article
📈 — steady uptrend$OPEN
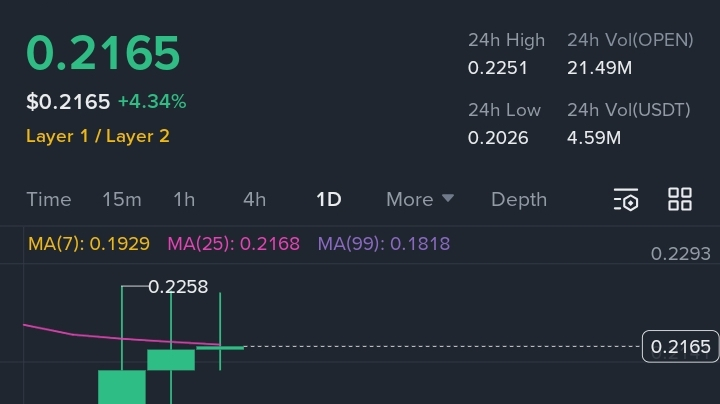
OPEN/USDT — Post-Breakout Consolidation (1D)
Price: $0.2165 (+4.34%)
Price is consolidating after a high-volume breakout from $0.1569 → $0.2258. Current range sits directly under key resistance.
Structure:
Bullish reversal structure forming
Daily candle compression suggests pause, not weakness
Market testing MA25 resistance at $0.2168
Moving Averages:
MA7 ($0.1929): Strong short-term support
MA25 ($0.2168): Immediate breakout barrier
MA99 ($0.1818): Macro structural support
Volume & Sentiment:
Breakout volume confirmed strong participation
Current lower volume = healthy cooldown phase
Order book slightly bullish: 55.28% buyers vs 44.72% sellers
Key Levels:
Resistance: $0.2258 → breakout continuation trigger
Support: $0.1929 → momentum defense zone
Strategic Insight:
Holding above $0.19 keeps bullish structure intact. A daily close above $0.2258 could open expansion toward $0.25–$0.28.
Edge Insight:
The important signal isn’t the pump — it’s whether price can build acceptance above MA25 after the breakout. Strong trends sustain through consolidation, not nonstop candles
$BTC
{future}(BTCUSDT)
#open
#openledger
📈 — steady uptrend
$OPEN
OPEN/USDT — Post-Breakout Consolidation (1D)
Price: $0.2165 (+4.34%)
Price is consolidating after a high-volume breakout from $0.1569 → $0.2258. Current range sits directly under key resistance.
Structure:
Bullish reversal structure forming
Daily candle compression suggests pause, not weakness
Market testing MA25 resistance at $0.2168
Moving Averages:
MA7 ($0.1929): Strong short-term support
MA25 ($0.2168): Immediate breakout barrier
MA99 ($0.1818): Macro structural support
Volume & Sentiment:
Breakout volume confirmed strong participation
Current lower volume = healthy cooldown phase
Order book slightly bullish: 55.28% buyers vs 44.72% sellers
Key Levels:
Resistance: $0.2258 → breakout continuation trigger
Support: $0.1929 → momentum defense zone
Strategic Insight:
Holding above $0.19 keeps bullish structure intact. A daily close above $0.2258 could open expansion toward $0.25–$0.28.
Edge Insight:
The important signal isn’t the pump — it’s whether price can build acceptance above MA25 after the breakout. Strong trends sustain through consolidation, not nonstop candles
$BTC
#open
#openledger
OPEN/USDT — Post-Breakout Consolidation (1D)
Price: $0.2165 (+4.34%)
Price is consolidating after a high-volume breakout from $0.1569 → $0.2258. Current range sits directly under key resistance.
Structure:
Bullish reversal structure forming
Daily candle compression suggests pause, not weakness
Market testing MA25 resistance at $0.2168
Moving Averages:
MA7 ($0.1929): Strong short-term support
MA25 ($0.2168): Immediate breakout barrier
MA99 ($0.1818): Macro structural support
Volume & Sentiment:
Breakout volume confirmed strong participation
Current lower volume = healthy cooldown phase
Order book slightly bullish: 55.28% buyers vs 44.72% sellers
Key Levels:
Resistance: $0.2258 → breakout continuation trigger
Support: $0.1929 → momentum defense zone
Strategic Insight:
Holding above $0.19 keeps bullish structure intact. A daily close above $0.2258 could open expansion toward $0.25–$0.28.
Edge Insight:
The important signal isn’t the pump — it’s whether price can build acceptance above MA25 after the breakout. Strong trends sustain through consolidation, not nonstop candles
$BTC
#open
#openledger
1
43
·
--
Haussier
#openledger $OPEN
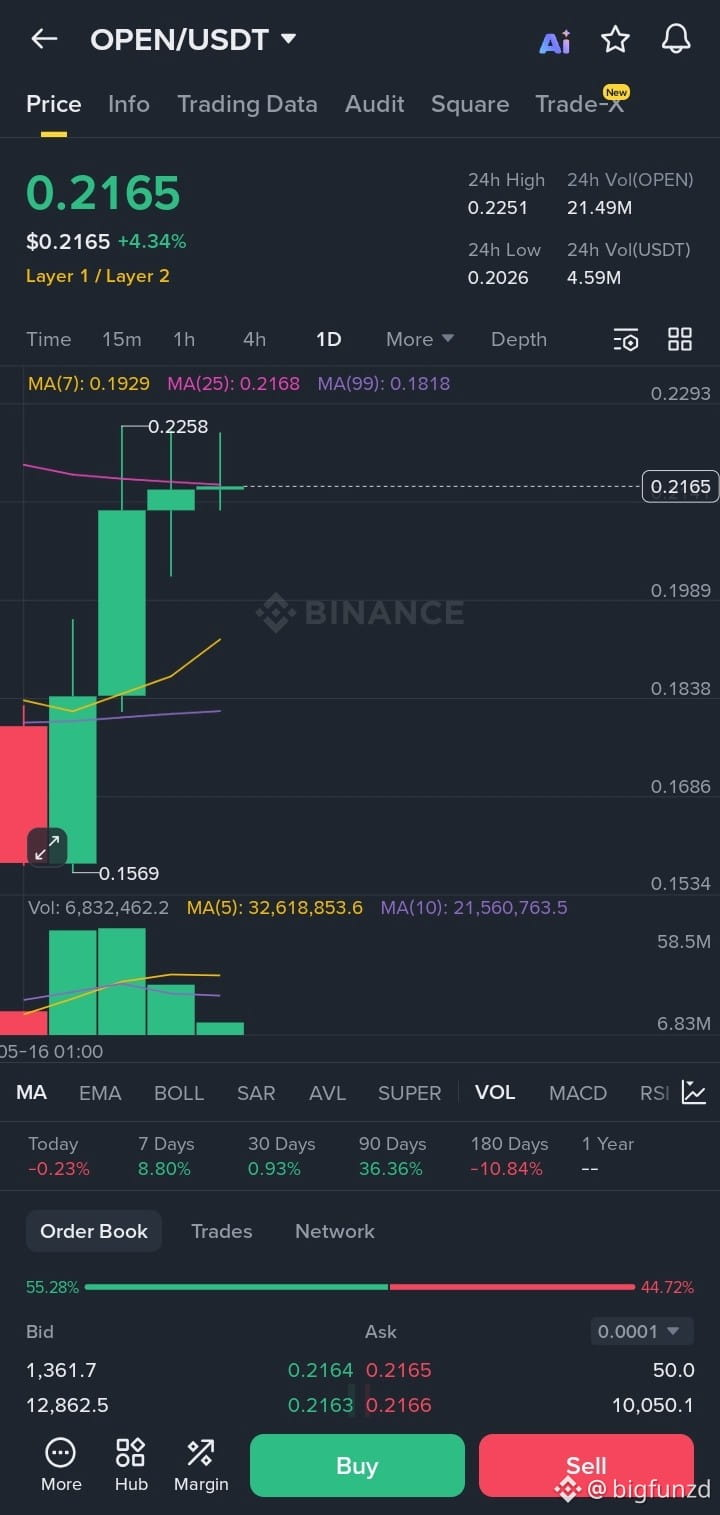
💡OPEN/USDT — Post-Breakout Consolidation (1D)
Price: $0.2165 (+4.34%)
Price is consolidating after a high-volume breakout from $0.1569 → $0.2258. Current range sits directly under key resistance.
Structure:
Bullish reversal structure forming
Daily candle compression suggests pause, not weakness
Market testing MA25 resistance at $0.2168
Moving Averages:
MA7 ($0.1929): Strong short-term support
MA25 ($0.2168): Immediate breakout barrier
MA99 ($0.1818): Macro structural support
Volume & Sentiment:
Breakout volume confirmed strong participation
Current lower volume = healthy cooldown phase
Order book slightly bullish: 55.28% buyers vs 44.72% sellers
Key Levels:
Resistance: $0.2258 → breakout continuation trigger
Support: $0.1929 → momentum defense zone
Strategic Insight:
Holding above $0.19 keeps bullish structure intact. A daily close above $0.2258 could open expansion toward $0.25–$0.28.
Edge Insight:
The important signal isn’t the pump — it’s whether price can build acceptance above MA25 after the breakout. Strong trends sustain through consolidation, not nonstop candles
$OPEN
{future}(OPENUSDT)
#OP #OpenNetwork
#openledger $OPEN
💡OPEN/USDT — Post-Breakout Consolidation (1D)
Price: $0.2165 (+4.34%)
Price is consolidating after a high-volume breakout from $0.1569 → $0.2258. Current range sits directly under key resistance.
Structure:
Bullish reversal structure forming
Daily candle compression suggests pause, not weakness
Market testing MA25 resistance at $0.2168
Moving Averages:
MA7 ($0.1929): Strong short-term support
MA25 ($0.2168): Immediate breakout barrier
MA99 ($0.1818): Macro structural support
Volume & Sentiment:
Breakout volume confirmed strong participation
Current lower volume = healthy cooldown phase
Order book slightly bullish: 55.28% buyers vs 44.72% sellers
Key Levels:
Resistance: $0.2258 → breakout continuation trigger
Support: $0.1929 → momentum defense zone
Strategic Insight:
Holding above $0.19 keeps bullish structure intact. A daily close above $0.2258 could open expansion toward $0.25–$0.28.
Edge Insight:
The important signal isn’t the pump — it’s whether price can build acceptance above MA25 after the breakout. Strong trends sustain through consolidation, not nonstop candles
$OPEN
#OP #OpenNetwork
💡OPEN/USDT — Post-Breakout Consolidation (1D)
Price: $0.2165 (+4.34%)
Price is consolidating after a high-volume breakout from $0.1569 → $0.2258. Current range sits directly under key resistance.
Structure:
Bullish reversal structure forming
Daily candle compression suggests pause, not weakness
Market testing MA25 resistance at $0.2168
Moving Averages:
MA7 ($0.1929): Strong short-term support
MA25 ($0.2168): Immediate breakout barrier
MA99 ($0.1818): Macro structural support
Volume & Sentiment:
Breakout volume confirmed strong participation
Current lower volume = healthy cooldown phase
Order book slightly bullish: 55.28% buyers vs 44.72% sellers
Key Levels:
Resistance: $0.2258 → breakout continuation trigger
Support: $0.1929 → momentum defense zone
Strategic Insight:
Holding above $0.19 keeps bullish structure intact. A daily close above $0.2258 could open expansion toward $0.25–$0.28.
Edge Insight:
The important signal isn’t the pump — it’s whether price can build acceptance above MA25 after the breakout. Strong trends sustain through consolidation, not nonstop candles
$OPEN
#OP #OpenNetwork
1
49
·
--
Haussier
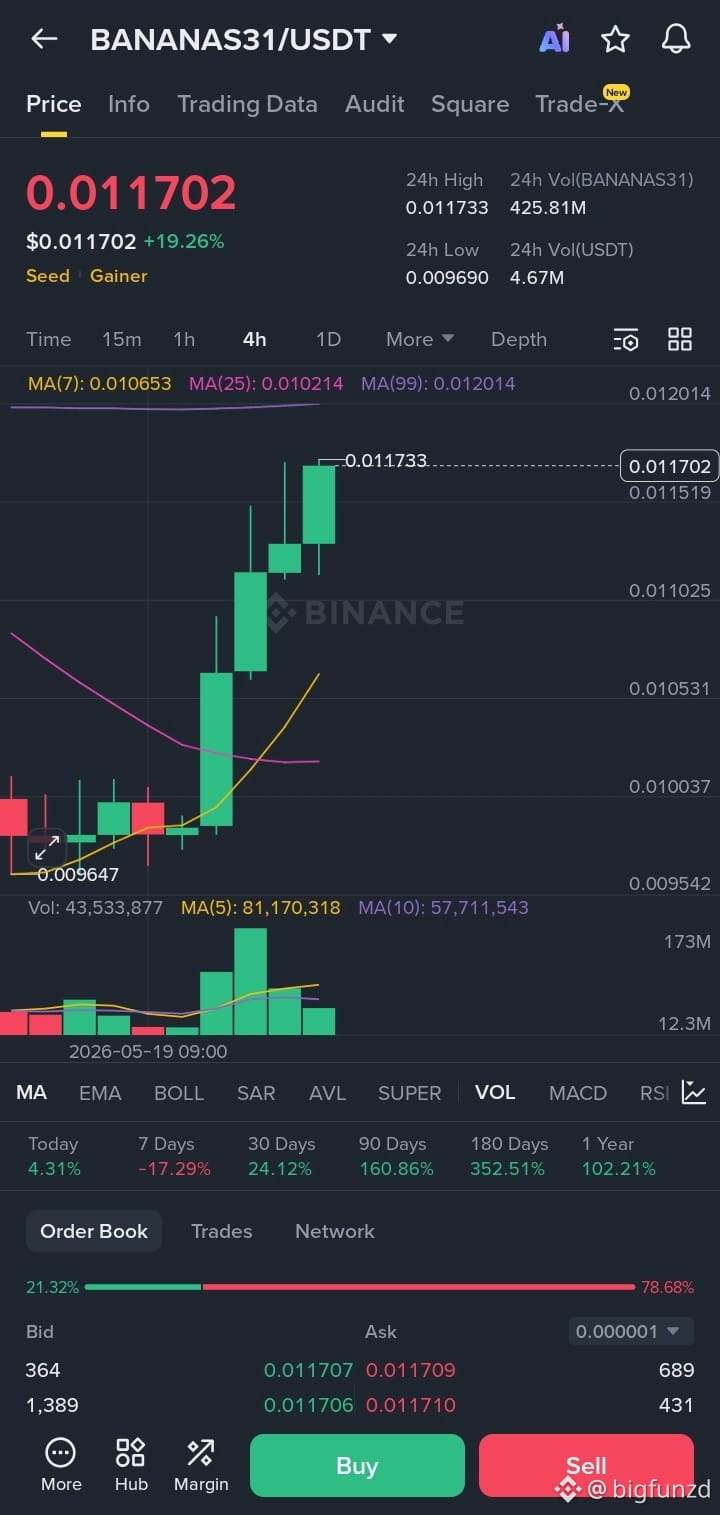
$BANANAS31
💡BANANAS31/USDT — Momentum Breakout Meets Heavy Supply (4H)
Price Action:
Trading at 0.011702 (+19.26%) after a sharp breakout from the 0.0096 consolidation zone
Three consecutive bullish 4H candles confirm aggressive momentum expansion
Price is hovering near the daily high at 0.011733 → breakout pressure remains active
Trend Structure:
Market shifted from consolidation into rapid expansion
Short-term structure is bullish, but price is approaching a critical overhead resistance cluster
Current move reflects speculative momentum acceleration rather than stable trend maturity
Moving Average Signals:
MA7 (0.010653): Strong reclaim confirms short-term bullish momentum
MA25 (0.010214): Potential bullish crossover forming
MA99 (0.012014): Major macro resistance directly overhead
Volume & Participation:
425.81M BANANAS31 traded (~$4.67M volume)
Strong green volume spike validates breakout activity
Liquidity participation is real, not low-volume drift
Performance Context:
Timeframe Performance
7D -17.29%
30D +24.12%
90D +160.86%
180D +352.51%
1Y +102.21%
Market Sentiment:
Order book heavily seller-skewed:
21.32% bids
78.68% asks
Indicates strong overhead supply and active profit-taking pressure near current levels
Key Levels:
Level Type Significance
0.011733 Immediate Resistance Local breakout ceiling
0.012014 MA99 Resistance Major macro barrier
0.010653 MA7 Support Momentum defense zone
0.009690 Breakout Base Major support origin
Strategic Insight:
Momentum remains bullish, but price is entering a high-risk chase zone
Seller imbalance near resistance raises probability of short-term rejection or cooldown
A healthy market structure would likely require consolidation before another expansion leg
Positioning Logic:
Aggressive entries at resistance carry poor risk/reward after vertical candles
Stronger setups usually appear after breakout retests or supply absorption
Sustained acceptance above 0.012014 would confirm continuation potential
Risk Layer
$BANANAS31
#BANAAS31USDT
#SECProposesIPORuleOverhaul
$BANANAS31
💡BANANAS31/USDT — Momentum Breakout Meets Heavy Supply (4H)
Price Action:
Trading at 0.011702 (+19.26%) after a sharp breakout from the 0.0096 consolidation zone
Three consecutive bullish 4H candles confirm aggressive momentum expansion
Price is hovering near the daily high at 0.011733 → breakout pressure remains active
Trend Structure:
Market shifted from consolidation into rapid expansion
Short-term structure is bullish, but price is approaching a critical overhead resistance cluster
Current move reflects speculative momentum acceleration rather than stable trend maturity
Moving Average Signals:
MA7 (0.010653): Strong reclaim confirms short-term bullish momentum
MA25 (0.010214): Potential bullish crossover forming
MA99 (0.012014): Major macro resistance directly overhead
Volume & Participation:
425.81M BANANAS31 traded (~$4.67M volume)
Strong green volume spike validates breakout activity
Liquidity participation is real, not low-volume drift
Performance Context:
Timeframe Performance
7D -17.29%
30D +24.12%
90D +160.86%
180D +352.51%
1Y +102.21%
Market Sentiment:
Order book heavily seller-skewed:
21.32% bids
78.68% asks
Indicates strong overhead supply and active profit-taking pressure near current levels
Key Levels:
Level Type Significance
0.011733 Immediate Resistance Local breakout ceiling
0.012014 MA99 Resistance Major macro barrier
0.010653 MA7 Support Momentum defense zone
0.009690 Breakout Base Major support origin
Strategic Insight:
Momentum remains bullish, but price is entering a high-risk chase zone
Seller imbalance near resistance raises probability of short-term rejection or cooldown
A healthy market structure would likely require consolidation before another expansion leg
Positioning Logic:
Aggressive entries at resistance carry poor risk/reward after vertical candles
Stronger setups usually appear after breakout retests or supply absorption
Sustained acceptance above 0.012014 would confirm continuation potential
Risk Layer
$BANANAS31
#BANAAS31USDT
#SECProposesIPORuleOverhaul
💡BANANAS31/USDT — Momentum Breakout Meets Heavy Supply (4H)
Price Action:
Trading at 0.011702 (+19.26%) after a sharp breakout from the 0.0096 consolidation zone
Three consecutive bullish 4H candles confirm aggressive momentum expansion
Price is hovering near the daily high at 0.011733 → breakout pressure remains active
Trend Structure:
Market shifted from consolidation into rapid expansion
Short-term structure is bullish, but price is approaching a critical overhead resistance cluster
Current move reflects speculative momentum acceleration rather than stable trend maturity
Moving Average Signals:
MA7 (0.010653): Strong reclaim confirms short-term bullish momentum
MA25 (0.010214): Potential bullish crossover forming
MA99 (0.012014): Major macro resistance directly overhead
Volume & Participation:
425.81M BANANAS31 traded (~$4.67M volume)
Strong green volume spike validates breakout activity
Liquidity participation is real, not low-volume drift
Performance Context:
Timeframe Performance
7D -17.29%
30D +24.12%
90D +160.86%
180D +352.51%
1Y +102.21%
Market Sentiment:
Order book heavily seller-skewed:
21.32% bids
78.68% asks
Indicates strong overhead supply and active profit-taking pressure near current levels
Key Levels:
Level Type Significance
0.011733 Immediate Resistance Local breakout ceiling
0.012014 MA99 Resistance Major macro barrier
0.010653 MA7 Support Momentum defense zone
0.009690 Breakout Base Major support origin
Strategic Insight:
Momentum remains bullish, but price is entering a high-risk chase zone
Seller imbalance near resistance raises probability of short-term rejection or cooldown
A healthy market structure would likely require consolidation before another expansion leg
Positioning Logic:
Aggressive entries at resistance carry poor risk/reward after vertical candles
Stronger setups usually appear after breakout retests or supply absorption
Sustained acceptance above 0.012014 would confirm continuation potential
Risk Layer
$BANANAS31
#BANAAS31USDT
#SECProposesIPORuleOverhaul
5
1
201
·
--
Article
🔥 — strong momentum$FIDA
💡FIDA/USDT — Vertical Expansion Phase (4H)
Price Action:
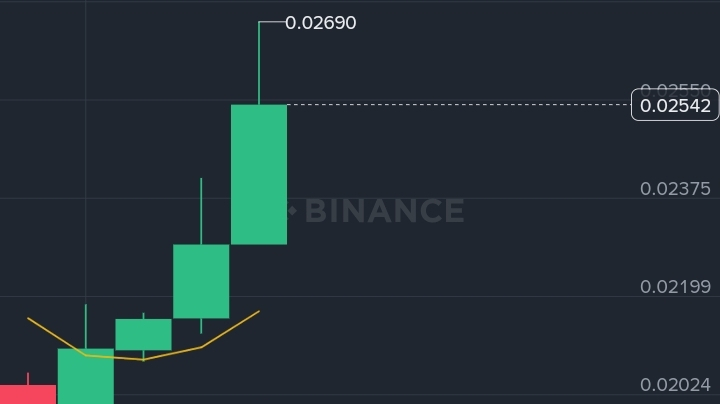
Trading at 0.02542 (+22.86%) after an aggressive breakout from the 0.01973 base
Three consecutive bullish 4H candles confirm strong momentum acceleration
Price wicked into 0.02690 before facing first signs of profit-taking
Market Structure:
Transitioned from compression → parabolic expansion
Structure shifted from accumulation into momentum discovery
Current move reflects strong breakout continuation, not random volatility
Moving Average Alignment:
MA7 (0.02173): Price heavily extended above short-term trendline
MA25 (0.01999): Intermediate trend support remains intact
MA99 (0.01872): Macro structure reclaimed with full bullish MA stack
Volume & Participation:
403.55M FIDA traded (~$9.25M volume)
Volume expansion validates breakout strength
Buyer dominance remains healthy at 54.46% vs 45.54% asks
Performance Context:
Timeframe Performance
7D +28.90%
30D +60.28%
90D +34.50%
180D -47.80%
1Y -73.27%
Macro Insight:
The long-term drawdown combined with recent acceleration suggests a possible bottoming reversal structure. This type of move often begins with short covering, followed by speculative momentum inflows.
Key Levels:
Level Type Significance
0.02690 Resistance Breakout continuation trigger
0.02350–0.02200 Retest Zone Healthy consolidation region
0.02173 MA7 Support Short-term momentum defense
0.01973 Major Support Breakout origin base
Strategic Insight:
Momentum remains strongly bullish, but price is entering an overheated zone
Long upper wick near 0.02690 signals active profit-taking pressure
Chasing vertical candles here increases downside exposure if momentum cools
Positioning Logic:
Best risk/reward comes from waiting for controlled consolidation or breakout retest
Sustained 4H close above 0.02690 opens path toward psychological resistance near 0.03000
Failure to hold above 0.02350 could trigger broader cooldown into moving average support
Edge Insight:
Strong rallies become sustainable when trend structure, volume expansion, and narrative alignment appear together. FIDA currently shows all three. The real edge now is not spotting the breakout — it’s identifying whether buyers can defend higher price acceptance after the initial expansion phase
#USBTCStrategicReserve #CFTCChallengesMinnesotaPredictionMarketBan #FIDAUSDT #RWAMarketCapRisesTo$65B
🔥 — strong momentum
$FIDA
💡FIDA/USDT — Vertical Expansion Phase (4H)
Price Action:
Trading at 0.02542 (+22.86%) after an aggressive breakout from the 0.01973 base
Three consecutive bullish 4H candles confirm strong momentum acceleration
Price wicked into 0.02690 before facing first signs of profit-taking
Market Structure:
Transitioned from compression → parabolic expansion
Structure shifted from accumulation into momentum discovery
Current move reflects strong breakout continuation, not random volatility
Moving Average Alignment:
MA7 (0.02173): Price heavily extended above short-term trendline
MA25 (0.01999): Intermediate trend support remains intact
MA99 (0.01872): Macro structure reclaimed with full bullish MA stack
Volume & Participation:
403.55M FIDA traded (~$9.25M volume)
Volume expansion validates breakout strength
Buyer dominance remains healthy at 54.46% vs 45.54% asks
Performance Context:
Timeframe Performance
7D +28.90%
30D +60.28%
90D +34.50%
180D -47.80%
1Y -73.27%
Macro Insight:
The long-term drawdown combined with recent acceleration suggests a possible bottoming reversal structure. This type of move often begins with short covering, followed by speculative momentum inflows.
Key Levels:
Level Type Significance
0.02690 Resistance Breakout continuation trigger
0.02350–0.02200 Retest Zone Healthy consolidation region
0.02173 MA7 Support Short-term momentum defense
0.01973 Major Support Breakout origin base
Strategic Insight:
Momentum remains strongly bullish, but price is entering an overheated zone
Long upper wick near 0.02690 signals active profit-taking pressure
Chasing vertical candles here increases downside exposure if momentum cools
Positioning Logic:
Best risk/reward comes from waiting for controlled consolidation or breakout retest
Sustained 4H close above 0.02690 opens path toward psychological resistance near 0.03000
Failure to hold above 0.02350 could trigger broader cooldown into moving average support
Edge Insight:
Strong rallies become sustainable when trend structure, volume expansion, and narrative alignment appear together. FIDA currently shows all three. The real edge now is not spotting the breakout — it’s identifying whether buyers can defend higher price acceptance after the initial expansion phase
#USBTCStrategicReserve #CFTCChallengesMinnesotaPredictionMarketBan #FIDAUSDT #RWAMarketCapRisesTo$65B
💡FIDA/USDT — Vertical Expansion Phase (4H)
Price Action:
Trading at 0.02542 (+22.86%) after an aggressive breakout from the 0.01973 base
Three consecutive bullish 4H candles confirm strong momentum acceleration
Price wicked into 0.02690 before facing first signs of profit-taking
Market Structure:
Transitioned from compression → parabolic expansion
Structure shifted from accumulation into momentum discovery
Current move reflects strong breakout continuation, not random volatility
Moving Average Alignment:
MA7 (0.02173): Price heavily extended above short-term trendline
MA25 (0.01999): Intermediate trend support remains intact
MA99 (0.01872): Macro structure reclaimed with full bullish MA stack
Volume & Participation:
403.55M FIDA traded (~$9.25M volume)
Volume expansion validates breakout strength
Buyer dominance remains healthy at 54.46% vs 45.54% asks
Performance Context:
Timeframe Performance
7D +28.90%
30D +60.28%
90D +34.50%
180D -47.80%
1Y -73.27%
Macro Insight:
The long-term drawdown combined with recent acceleration suggests a possible bottoming reversal structure. This type of move often begins with short covering, followed by speculative momentum inflows.
Key Levels:
Level Type Significance
0.02690 Resistance Breakout continuation trigger
0.02350–0.02200 Retest Zone Healthy consolidation region
0.02173 MA7 Support Short-term momentum defense
0.01973 Major Support Breakout origin base
Strategic Insight:
Momentum remains strongly bullish, but price is entering an overheated zone
Long upper wick near 0.02690 signals active profit-taking pressure
Chasing vertical candles here increases downside exposure if momentum cools
Positioning Logic:
Best risk/reward comes from waiting for controlled consolidation or breakout retest
Sustained 4H close above 0.02690 opens path toward psychological resistance near 0.03000
Failure to hold above 0.02350 could trigger broader cooldown into moving average support
Edge Insight:
Strong rallies become sustainable when trend structure, volume expansion, and narrative alignment appear together. FIDA currently shows all three. The real edge now is not spotting the breakout — it’s identifying whether buyers can defend higher price acceptance after the initial expansion phase
#USBTCStrategicReserve #CFTCChallengesMinnesotaPredictionMarketBan #FIDAUSDT #RWAMarketCapRisesTo$65B
5
1
171
·
--
Haussier
$HOME
💡HOME/USDT — Macro Breakout in Progress (1D)
Price Action:
Trading at 0.02129 (+19.61%) with a strong full-bodied bullish candle
Price has broken above the major 0.02100 resistance zone
24h high sits at 0.02165 → immediate breakout resistance
Trend Structure:
Market shifted from sideways compression into aggressive expansion
Break above long-term resistance suggests early macro reversal attempt
Recent base around 0.01312 now acts as strong structural support
Moving Average Signals:
MA7 (0.01819): Strong upward slope → short-term momentum accelerating
MA25 (0.01591): Bullish crossover confirmed trend continuation
MA99 (0.02100): Critical macro barrier now being reclaimed
Volume & Participation:
Massive volume spike (315M HOME / ~$6.3M) validates breakout strength
Order flow heavily buyer-dominant:
66.41% bids
33.59% asks
This is not low-liquidity drift → real participation is entering
Key Levels:
Level Type Significance
0.02165 Resistance Break confirms continuation leg
0.02100 Flip Zone Major breakout confirmation level
0.01819 Support Short-term momentum support
0.01312 Base Support Strong demand origin
Strategic Insight:
Daily close above 0.02100 is the key confirmation signal
Momentum remains bullish, but candle expansion is becoming overheated
Healthy continuation would likely include consolidation or retest before another leg higher
Positioning Logic:
Bullish bias remains valid while price holds above reclaimed resistance
Chasing extended candles increases risk/reward imbalance
Strongest entries usually come after breakout retests, not emotional expansion candles
Edge Insight:
The important signal here is not just price appreciation — it’s the combination of macro MA reclaim + explosive participation volume. Most fake breakouts lack one of those two elements. HOME currently has both, which shifts this from a simple pump into a potential trend transition
#SolanaAIAgentEconomicImpact
#PolymarketNasdaqPredictionMarketPartnership
#SolanaAIAgentEconomicImpact
$BNB
$HOME
💡HOME/USDT — Macro Breakout in Progress (1D)
Price Action:
Trading at 0.02129 (+19.61%) with a strong full-bodied bullish candle
Price has broken above the major 0.02100 resistance zone
24h high sits at 0.02165 → immediate breakout resistance
Trend Structure:
Market shifted from sideways compression into aggressive expansion
Break above long-term resistance suggests early macro reversal attempt
Recent base around 0.01312 now acts as strong structural support
Moving Average Signals:
MA7 (0.01819): Strong upward slope → short-term momentum accelerating
MA25 (0.01591): Bullish crossover confirmed trend continuation
MA99 (0.02100): Critical macro barrier now being reclaimed
Volume & Participation:
Massive volume spike (315M HOME / ~$6.3M) validates breakout strength
Order flow heavily buyer-dominant:
66.41% bids
33.59% asks
This is not low-liquidity drift → real participation is entering
Key Levels:
Level Type Significance
0.02165 Resistance Break confirms continuation leg
0.02100 Flip Zone Major breakout confirmation level
0.01819 Support Short-term momentum support
0.01312 Base Support Strong demand origin
Strategic Insight:
Daily close above 0.02100 is the key confirmation signal
Momentum remains bullish, but candle expansion is becoming overheated
Healthy continuation would likely include consolidation or retest before another leg higher
Positioning Logic:
Bullish bias remains valid while price holds above reclaimed resistance
Chasing extended candles increases risk/reward imbalance
Strongest entries usually come after breakout retests, not emotional expansion candles
Edge Insight:
The important signal here is not just price appreciation — it’s the combination of macro MA reclaim + explosive participation volume. Most fake breakouts lack one of those two elements. HOME currently has both, which shifts this from a simple pump into a potential trend transition
#SolanaAIAgentEconomicImpact
#PolymarketNasdaqPredictionMarketPartnership
#SolanaAIAgentEconomicImpact
$BNB
💡HOME/USDT — Macro Breakout in Progress (1D)
Price Action:
Trading at 0.02129 (+19.61%) with a strong full-bodied bullish candle
Price has broken above the major 0.02100 resistance zone
24h high sits at 0.02165 → immediate breakout resistance
Trend Structure:
Market shifted from sideways compression into aggressive expansion
Break above long-term resistance suggests early macro reversal attempt
Recent base around 0.01312 now acts as strong structural support
Moving Average Signals:
MA7 (0.01819): Strong upward slope → short-term momentum accelerating
MA25 (0.01591): Bullish crossover confirmed trend continuation
MA99 (0.02100): Critical macro barrier now being reclaimed
Volume & Participation:
Massive volume spike (315M HOME / ~$6.3M) validates breakout strength
Order flow heavily buyer-dominant:
66.41% bids
33.59% asks
This is not low-liquidity drift → real participation is entering
Key Levels:
Level Type Significance
0.02165 Resistance Break confirms continuation leg
0.02100 Flip Zone Major breakout confirmation level
0.01819 Support Short-term momentum support
0.01312 Base Support Strong demand origin
Strategic Insight:
Daily close above 0.02100 is the key confirmation signal
Momentum remains bullish, but candle expansion is becoming overheated
Healthy continuation would likely include consolidation or retest before another leg higher
Positioning Logic:
Bullish bias remains valid while price holds above reclaimed resistance
Chasing extended candles increases risk/reward imbalance
Strongest entries usually come after breakout retests, not emotional expansion candles
Edge Insight:
The important signal here is not just price appreciation — it’s the combination of macro MA reclaim + explosive participation volume. Most fake breakouts lack one of those two elements. HOME currently has both, which shifts this from a simple pump into a potential trend transition
#SolanaAIAgentEconomicImpact
#PolymarketNasdaqPredictionMarketPartnership
#SolanaAIAgentEconomicImpact
$BNB
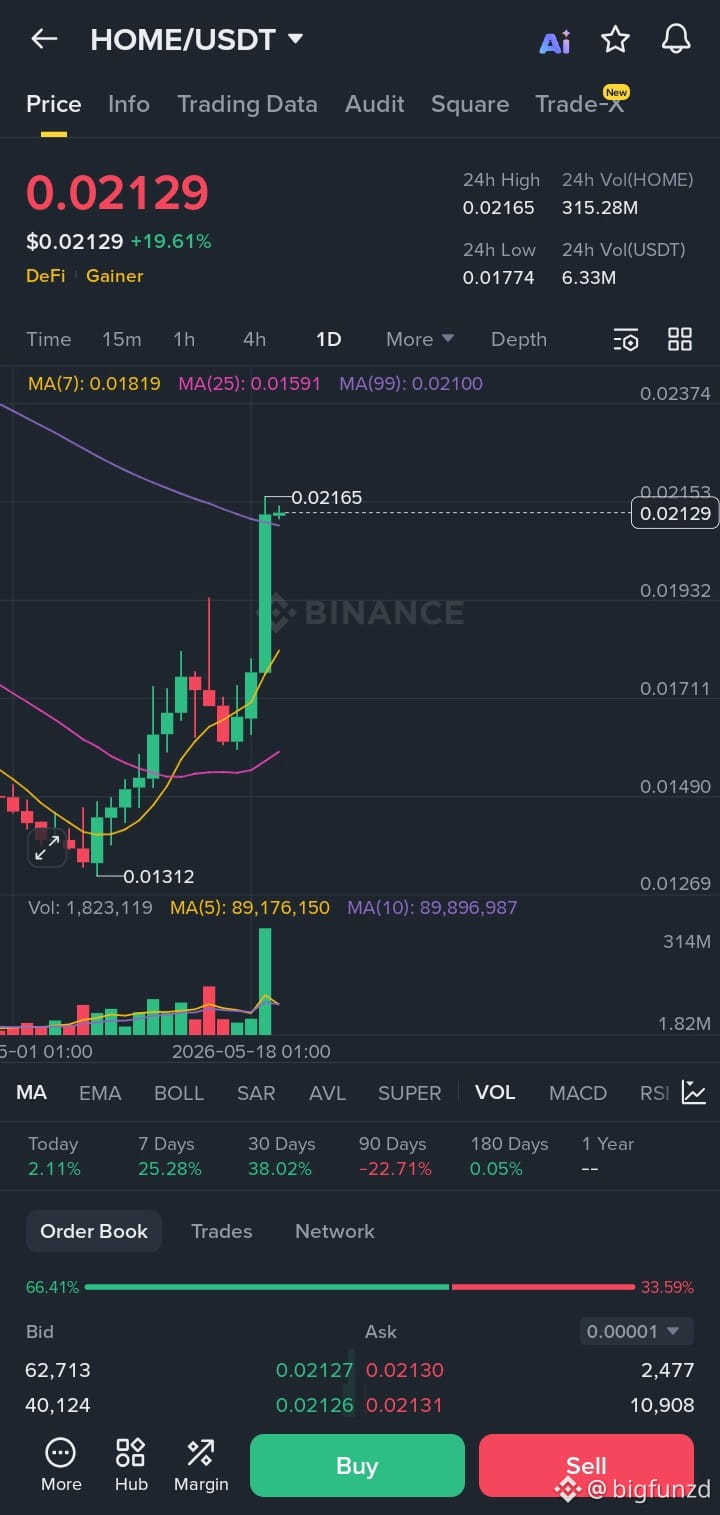
3
1
99
·
--
don't miss out this ecosystemPrivacy is becoming one of the most important layers in blockchain. That’s where @MidnightNetwork steps in.
@MidnightNetwork Midnight is building a network designed for confidential smart contracts, giving developers the ability to create applications where data stays protected while remaining verifiable on-chain.
$NIGHT
As the ecosystem grows, $NIGHT will play a key role in powering activity across the network.
A strong step toward privacy-preserving Web3.
#NİGHT
don't miss out this ecosystem
Privacy is becoming one of the most important layers in blockchain. That’s where @MidnightNetwork steps in.
@MidnightNetwork Midnight is building a network designed for confidential smart contracts, giving developers the ability to create applications where data stays protected while remaining verifiable on-chain.
$NIGHT
As the ecosystem grows, $NIGHT will play a key role in powering activity across the network.
A strong step toward privacy-preserving Web3.
#NİGHT
@MidnightNetwork Midnight is building a network designed for confidential smart contracts, giving developers the ability to create applications where data stays protected while remaining verifiable on-chain.
$NIGHT
As the ecosystem grows, $NIGHT will play a key role in powering activity across the network.
A strong step toward privacy-preserving Web3.
#NİGHT
2
19
·
--
Haussier
#night $NIGHT
Privacy is becoming one of the most important layers in blockchain. That’s where @MidnightNetwork MidnightNetwork steps in.
Midnight is building a network designed for confidential smart contracts, giving developers the ability to create applications where data stays protected while remaining verifiable on-chain.
As the ecosystem grows, $NIGHT will play a key role in powering activity across the network.
A strong step toward privacy-preserving Web3.
#N ight
#night $NIGHT
Privacy is becoming one of the most important layers in blockchain. That’s where @MidnightNetwork MidnightNetwork steps in.
Midnight is building a network designed for confidential smart contracts, giving developers the ability to create applications where data stays protected while remaining verifiable on-chain.
As the ecosystem grows, $NIGHT will play a key role in powering activity across the network.
A strong step toward privacy-preserving Web3.
#N ight
Privacy is becoming one of the most important layers in blockchain. That’s where @MidnightNetwork MidnightNetwork steps in.
Midnight is building a network designed for confidential smart contracts, giving developers the ability to create applications where data stays protected while remaining verifiable on-chain.
As the ecosystem grows, $NIGHT will play a key role in powering activity across the network.
A strong step toward privacy-preserving Web3.
#N ight

3
55
Connectez-vous pour découvrir plus de contenu
Rejoignez la communauté mondiale des adeptes de cryptomonnaies sur Binance Square
⚡️ Suviez les dernières informations importantes sur les cryptomonnaies.
💬 Jugé digne de confiance par la plus grande plateforme d’échange de cryptomonnaies au monde.
👍 Découvrez les connaissances que partagent les créateurs vérifiés.
Adresse e-mail/Nº de téléphone