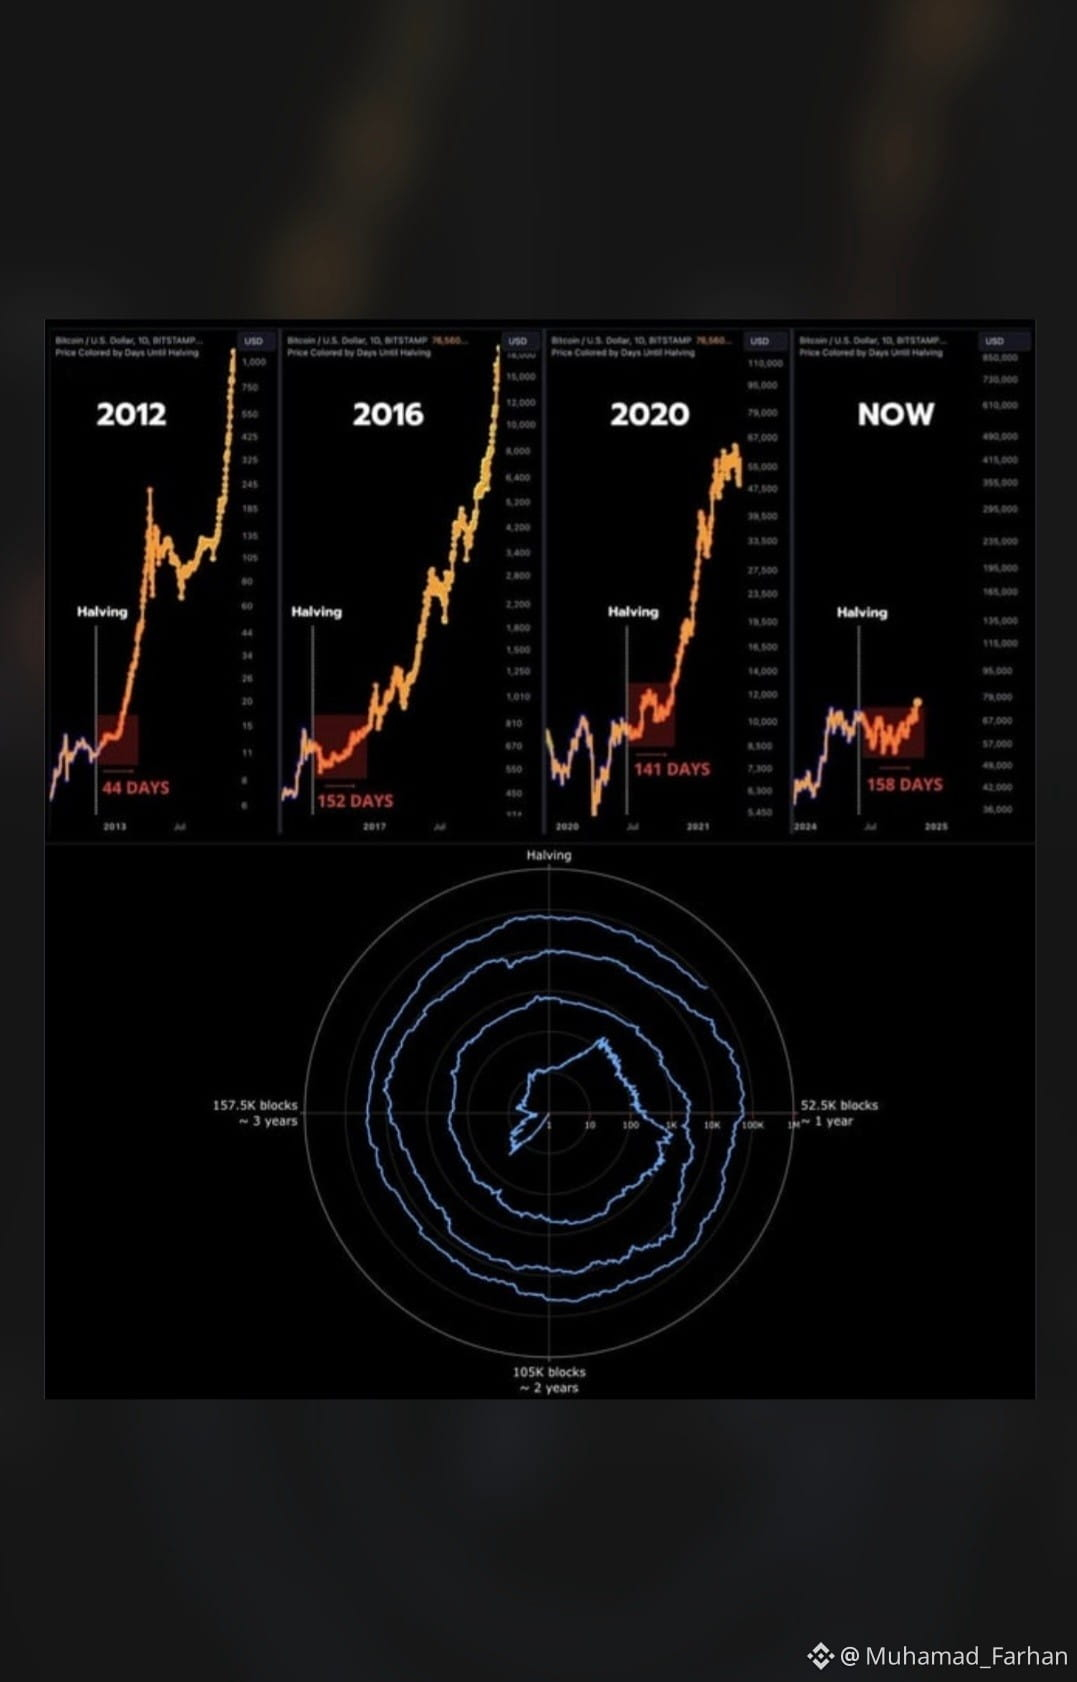
$BTC $ETH $BNB Here is a technical analysis breakdown for Bitcoin (BTC):
Key Price Levels & Market Structure
Primary Resistance: $120,000 – $130,000 (Major psychological and historical overhead liquidity level).
Immediate Support Zone: $100,000 – $107,000 (Former resistance flipped into a strong demand zone).
Secondary Support (Macro Base): $90,000 – $94,350 (Key support boundary to preserve the structural uptrend).
Technical Indicators & Chart Patterns
Trend & Channel Analysis:
Price action shows a clear series of higher highs and higher lows following a breakout from previous consolidation flag patterns.
As long as BTC holds above $100,000, the macro trend remains firmly bullish.
Scenarios to Watch:
Bullish Continuation: A sustained breakout and candle close above immediate resistance opens the path toward targets around $130,000.
Pullback & Retest: A short-term drop toward the $100,000–$107,000 zone would offer strong historical retest support before a potential continuation move upward.
Bearish Risk: Losing the $90,000 level invalidates the local bullish momentum and suggests deeper consolidation toward the $80,000 region.
#EthereumValidatorExitQueueJumps392% #Nikkei225Jumps2.5%ToThreeMonthHigh #FedOctoberHoldOdds82.3% #EthStakingExitQueueHits2026High #ETHUp70%InQ3ButLiquidityFalls
Key Price Levels & Market Structure
Primary Resistance: $120,000 – $130,000 (Major psychological and historical overhead liquidity level).
Immediate Support Zone: $100,000 – $107,000 (Former resistance flipped into a strong demand zone).
Secondary Support (Macro Base): $90,000 – $94,350 (Key support boundary to preserve the structural uptrend).
Technical Indicators & Chart Patterns
Trend & Channel Analysis:
Price action shows a clear series of higher highs and higher lows following a breakout from previous consolidation flag patterns.
As long as BTC holds above $100,000, the macro trend remains firmly bullish.
Scenarios to Watch:
Bullish Continuation: A sustained breakout and candle close above immediate resistance opens the path toward targets around $130,000.
Pullback & Retest: A short-term drop toward the $100,000–$107,000 zone would offer strong historical retest support before a potential continuation move upward.
Bearish Risk: Losing the $90,000 level invalidates the local bullish momentum and suggests deeper consolidation toward the $80,000 region.
#EthereumValidatorExitQueueJumps392% #Nikkei225Jumps2.5%ToThreeMonthHigh #FedOctoberHoldOdds82.3% #EthStakingExitQueueHits2026High #ETHUp70%InQ3ButLiquidityFalls