

#timeframes
timeframes
4,971 vues
24 mentions
Populaire
Récents

$SHELL | Why a Green Week Can Still Exist Inside a Downtrend
Recent market data cited in the research report showed a modest positive change over seven days on some trackers, while the 30-day performance remained negative, around 20% down in several snapshots.
At first glance, these figures may appear contradictory. They are not. Different timeframes measure different parts of the market's movement.
The seven-day change tells us how price has performed over the past week. The 30-day change captures a much longer period. A token can recover over several sessions while remaining significantly below its level from a month earlier.
This distinction is especially important when analyzing a market that has experienced a prolonged decline. A short-term rebound may represent a relief rally, a temporary response to selling pressure or the beginning of a broader recovery. Price performance alone cannot tell us which explanation is correct.
Traders often examine market structure for additional clues. Are recent highs getting higher or lower? Does price reclaim an important resistance level? Is buying volume expanding during advances? Does the market hold newly established support after a breakout?
A stronger trend-change argument generally requires several pieces of evidence rather than one positive weekly percentage.
The lesson is simple: always state the timeframe behind a performance figure. “Up this week” and “in a longer-term recovery” are two different claims.
#TechnicalAnalysis #Timeframes #MarketStructure CryptoEducation Altcoins

69
$SHELL | Why the Same RSI Can Show Two Different Numbers
Here's something that confuses a lot of newcomers: SHELL's RSI(6) reads 40.16 on the daily chart, but 64.07 on the 1-hour chart. Same asset, same indicator, very different numbers. Is the data wrong? No.
RSI isn't one single number for an asset. It's calculated separately for each chart interval you pick, using the candles from that interval. The daily RSI looks at the last 6 daily candles; the 1-hour RSI looks at the last 6 hourly candles. They're answering two different questions: how has SHELL moved over the last 6 days, versus the last 6 hours.
That's why checking just one timeframe and treating it as "the" RSI of an asset misses part of the picture.
#SHELL #CryptoEducation #Timeframes
1
137

¿Qué es un Timeframe y Cuál Usar?
Un timeframe es el período que representa cada vela en tu gráfico. Si mirás 1H, cada vela = 1 hora de precio. Si mirás 1D, cada vela = un día completo.
¿Cuál elegir? Depende de tu disponibilidad y estilo:
• 5m-15m: scalping, muchas operaciones, requiere tiempo full.
• 1H-4H: day/swing trading, equilibrio entre detalle y contexto.
• 1D: swing largo, ideal si no podés estar pegado a la pantalla.
La técnica pro: usá tres timeframes. Uno superior (diario) para ver la tendencia de fondo, uno medio (4H) para buscar tu entrada, uno menor (1H) para confirmar.
Ejemplo: BTC sube en diario, rompe resistencia en 4H, confirmás impulso en 1H. Ahí entrás. Si mirás solo un timeframe, operás sin contexto.
Principiante: arrancá en 4H. Es lo bastante rápido para ver oportunidades y lo bastante lento para no ahogarte en ruido. Los timeframes bajos amplifican cada error.
Seguinos para más guías que te ahorran meses de prueba y error.
#Timeframes
121

·
--
#BinanceWillListHyperliquid(HYPE)
🔥 Crypto Market Alert: The Next Big Move is Loading! 🚀The market is showing strong liquidations and key support retests right now. If you are waiting on the sidelines, you might miss the absolute best entry ⛔ zone of the month.Here is exactly what I am watching on the charts today:📊 The Technical Breakdown:Key Support Zone: Institutional buyers are heavily bidding at this exact level. If it holds, a massive bounce is imminent.Volume Analysis: Selling pressure is drying up on the lower #timeframes , signaling a potential trend reversal.Liquidations: Over-leveraged shorts are getting trapped, which could trigger a massive short squeeze very soon.💡 My Trading Strategy Today:Patience First: Waiting for a clean 4-hour candle confirmation before scaling into any new positions.Risk Management: Keeping stop-losses tight. Protecting capital is always priority number one.Spot Accumulation: Layering orders into high-utility altcoins that are currently sitting at deep discount levels.👇 What is your next move? Are you buying this dip or waiting for a deeper correction? Let me know your targets in the comments!#CryptoTrading #BinanceSquare #TechnicalAnalysis #Bitcoin #altcoins #TradingSignals $BITCOIN $TUT $BEAT
🔥 Crypto Market Alert: The Next Big Move is Loading! 🚀The market is showing strong liquidations and key support retests right now. If you are waiting on the sidelines, you might miss the absolute best entry ⛔ zone of the month.Here is exactly what I am watching on the charts today:📊 The Technical Breakdown:Key Support Zone: Institutional buyers are heavily bidding at this exact level. If it holds, a massive bounce is imminent.Volume Analysis: Selling pressure is drying up on the lower #timeframes , signaling a potential trend reversal.Liquidations: Over-leveraged shorts are getting trapped, which could trigger a massive short squeeze very soon.💡 My Trading Strategy Today:Patience First: Waiting for a clean 4-hour candle confirmation before scaling into any new positions.Risk Management: Keeping stop-losses tight. Protecting capital is always priority number one.Spot Accumulation: Layering orders into high-utility altcoins that are currently sitting at deep discount levels.👇 What is your next move? Are you buying this dip or waiting for a deeper correction? Let me know your targets in the comments!#CryptoTrading #BinanceSquare #TechnicalAnalysis #Bitcoin #altcoins #TradingSignals $BITCOIN $TUT $BEAT

3
998

·
--
Les 3 timeframes
⏰ 3 graphiques = 1 bon trader
Daily → La tendance générale (quoi trader)
4h → Le setup (quand trader)
1h → L'entrée précise (où entrer)
Ne tradez jamais à contre-tendance du Daily.
#Timeframes #TradingTips"
Les 3 timeframes
⏰ 3 graphiques = 1 bon trader
Daily → La tendance générale (quoi trader)
4h → Le setup (quand trader)
1h → L'entrée précise (où entrer)
Ne tradez jamais à contre-tendance du Daily.
#Timeframes #TradingTips"
⏰ 3 graphiques = 1 bon trader
Daily → La tendance générale (quoi trader)
4h → Le setup (quand trader)
1h → L'entrée précise (où entrer)
Ne tradez jamais à contre-tendance du Daily.
#Timeframes #TradingTips"
92

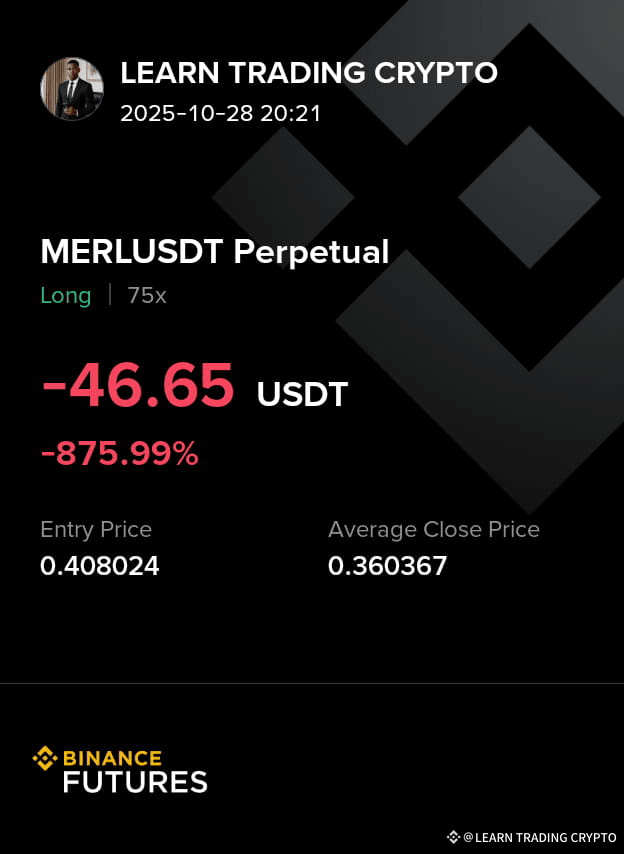
My Followers. .. .. the market always teaches in a hard way.....the #priceaction speaks but we don't listen. .. .. we ignore the longer timeframes and put much emphasis on the shorter #timeframes .. .. .l opened a long position at the peak hopping for more bullish rally but instead my entrance became the whales exit that l lost the trade reaching an extent of getting liquidated . .. .l learnt my lesson , never to repeat that mistake again
$MERL
$MERL
4
12
697
Connectez-vous pour découvrir plus de contenu
Rejoignez la communauté mondiale des adeptes de cryptomonnaies sur Binance Square
⚡️ Suviez les dernières informations importantes sur les cryptomonnaies.
💬 Jugé digne de confiance par la plus grande plateforme d’échange de cryptomonnaies au monde.
👍 Découvrez les connaissances que partagent les créateurs vérifiés.
Adresse e-mail/Nº de téléphone
Sujets d’actualité
1
#BinancePick
2.9M vues
150,271 mentions
2
#EarningsSeason
5.2M vues
25,633 mentions
3
#AnthropicTTMRevenueGrewAbout1200%
11,039 vues
279 mentions
4
#AnthropicS1ExpectedToday
14,322 vues
256 mentions
5
#SouthKoreaReportedlyWeighsFourthCryptoTaxDelay
21,291 vues
390 mentions
6
#FranklinTempletonFilesForTwoDividendToBitcoinETFs
28,641 vues
484 mentions
7
#StrategyMSTRSurpassesNasdaqInMarketCap
22,490 vues
351 mentions
8
#CanadaProposesStablecoinRedemptionWithin3BusinessDays
999 vues
34 mentions
9
#ElectrumWalletBugLetRogueServersStealFunds
24,710 vues
435 mentions
10
#ArgentineCourtDismissesLIBRACaseAgainstMilei
37,535 vues
537 mentions