

#orderbook
orderbook
58,167 vues
425 mentions
Populaire
Récents

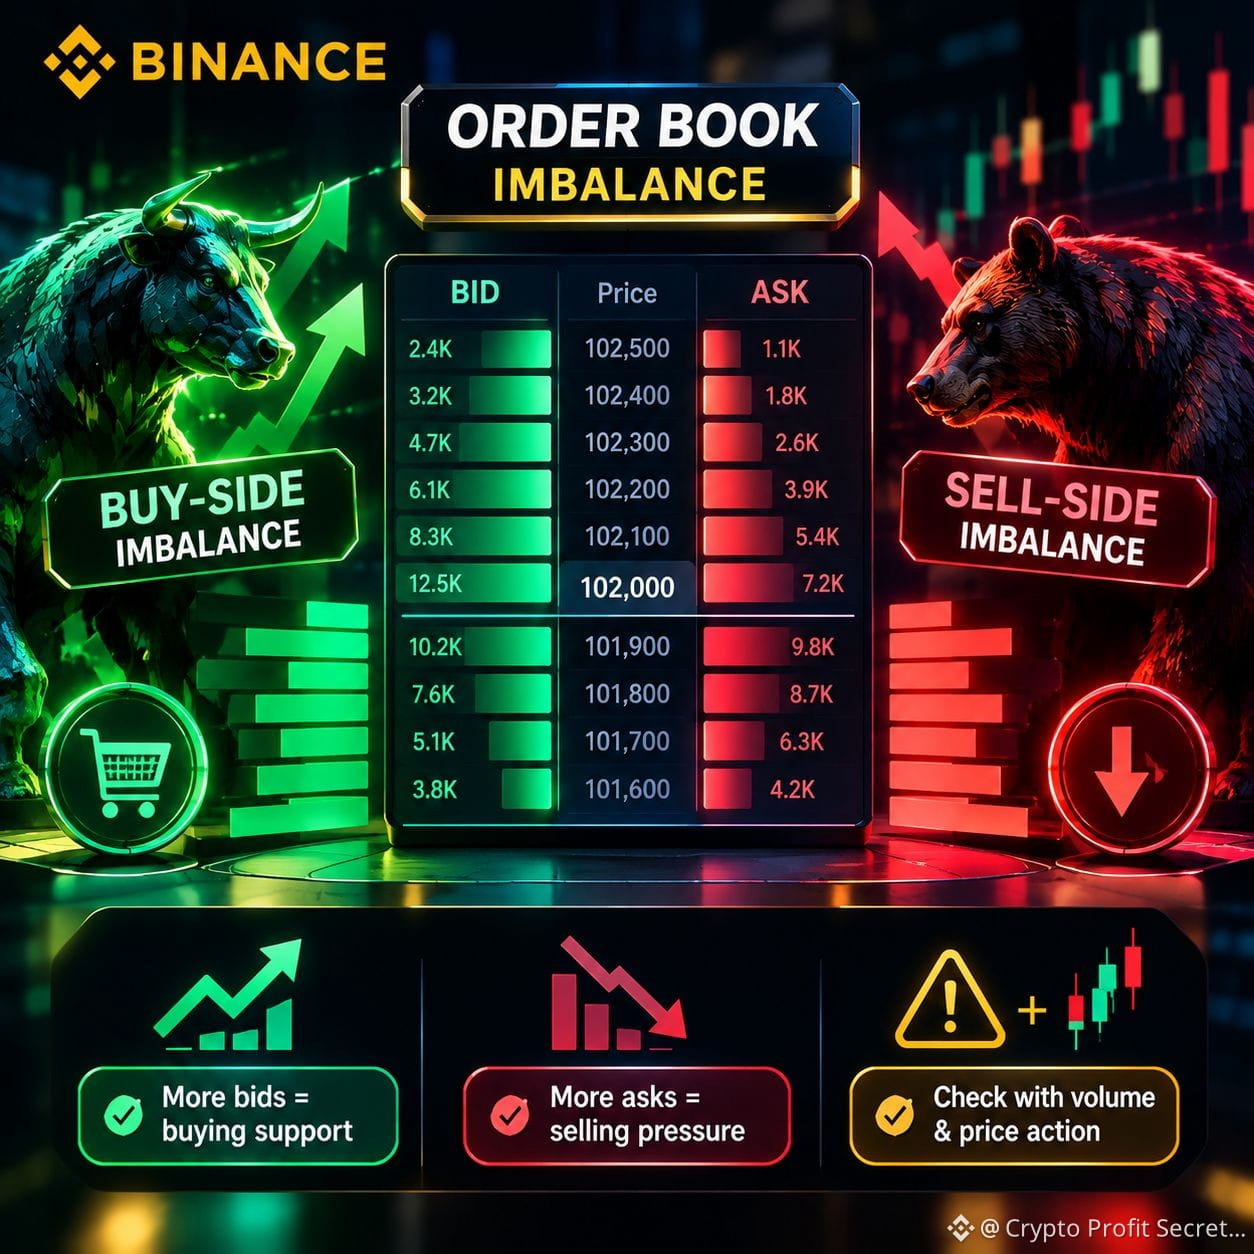
BINANCE CRYPTO LEARNING SERIES — PART 112
🔥 Order Book Imbalance: Buyers Strong Ya Sellers?
Order Book se pata chalta hai ke current price par buyers aur sellers ke orders kis taraf zyada hain.
🟢 More Bids: Buying support ka clue.
🔴 More Asks: Selling pressure ka clue.
⚠️ Yaad Rakho: Orders cancel bhi ho sakte hain. Sirf Order Book dekh kar price direction confirm nahi hoti.
🧠 Golden Rule: Order Book ko Volume aur Price Action ke saath check karo.
#BinanceSquare #OrderBook #cryptotrading #tradingeducation #BTC $BTC
{spot}(BTCUSDT)
BINANCE CRYPTO LEARNING SERIES — PART 112
🔥 Order Book Imbalance: Buyers Strong Ya Sellers?
Order Book se pata chalta hai ke current price par buyers aur sellers ke orders kis taraf zyada hain.
🟢 More Bids: Buying support ka clue.
🔴 More Asks: Selling pressure ka clue.
⚠️ Yaad Rakho: Orders cancel bhi ho sakte hain. Sirf Order Book dekh kar price direction confirm nahi hoti.
🧠 Golden Rule: Order Book ko Volume aur Price Action ke saath check karo.
#BinanceSquare #OrderBook #cryptotrading #tradingeducation #BTC $BTC
🔥 Order Book Imbalance: Buyers Strong Ya Sellers?
Order Book se pata chalta hai ke current price par buyers aur sellers ke orders kis taraf zyada hain.
🟢 More Bids: Buying support ka clue.
🔴 More Asks: Selling pressure ka clue.
⚠️ Yaad Rakho: Orders cancel bhi ho sakte hain. Sirf Order Book dekh kar price direction confirm nahi hoti.
🧠 Golden Rule: Order Book ko Volume aur Price Action ke saath check karo.
#BinanceSquare #OrderBook #cryptotrading #tradingeducation #BTC $BTC
1
56
·
--
USDT/VES: Binance concentra la profundidad y otras plataformas marca la punta de ventaRadar P2P en vivo Captura: 24/10/2026, 2:00:10 a. m.
USDT/VES referencia Bs. 1019.21
Compra USDT Bs. 1019.21
Venta USDT Bs. 977.80
BCV Bs. 887.30
Prima vs BCV 14.87%
Spread P2P 4.23%
Ofertas observadas 182
Verificar datos actuales en Radar P2P
24 de octubre de 2026, 06:00 (hora de captura). El mercado P2P de USDT/VES no tiene un solo precio: tiene una referencia agregada, una punta de compra, una punta de venta y un spread distinto por banco. Esta es la foto de la jornada, con cifras medibles y una advertencia: comparar plataforma y banco cambia el número que ves en pantalla.
📊 Dos mediciones que no dicen lo mismo
Radar P2P registra USDT a Bs. 1.019,21 del lado de compra y Bs. 977,80 del lado de venta, con un spread de Bs. 41,40 (4,23%). Es una referencia de mercado amplia, construida sobre el conjunto de ofertas activas: 203 ofertas y 182 anuncios en el tablero.
El order book, en cambio, muestra la mejor oferta individual disponible en ese instante: mejor ask en Bs. 1.005,12 y mejor bid en Bs. 1.002,70. El spread entre puntas es de Bs. 2,42, es decir 0,24%, con precio medio de Bs. 1.003,91.
Hecho: ambas cifras salen del mismo reporte. Interpretación: no miden lo mismo. La referencia agregada pondera el conjunto del mercado; la punta describe una sola oferta, la más competitiva, que además puede tener límites pequeños. Confundirlas lleva a conclusiones equivocadas sobre cuánto se está pagando realmente.
📈 otras plataformas en la punta de venta, Binance en la profundidad
La mejor punta de venta viene de otras plataformas: Bs. 1.005,12 por USDT, método "Otro método", con 65,62 USDT disponibles en un único anuncio y un límite que va de 6,56 a 65,62 USDT. Es la mejor punta del tablero, pero es delgada.
La mejor punta de compra viene de Binance: Bs. 1.002,70, con 39.545,67 USDT en un solo anuncio que acepta Banco de Venezuela y BANK, con límite de 3.954,57 a 39.545,67 USDT. Ahí no solo hay mejor precio: hay tamaño.
El detalle que explica el título está en la profundidad acumulada del libro:
• Volumen comprador: 721.450,52 USDT en 34 ofertas.
• Volumen vendedor: 164.821,02 USDT en 37 ofertas.
• Desbalance: 62,81% a favor de la presión compradora.
Traducción: en este momento hay más intención de comprar USDT que de venderlo, y esa intención se concentra en Binance. El tablero registra 12 bancos o métodos de pago activos. La presión compradora no anticipa nada: es una foto del libro que puede cambiar en minutos.
🔎 El spread por banco: de 0,62% a 1,44%
El mismo activo, el mismo día y la misma hora muestran spreads distintos según el método de pago. La diferencia entre el precio promedio de compra y el de venta registrado va de 0,62% a 1,44%:
Banco o método Prom. compra Prom. venta Spread Anuncios Exchange
BANK Bs. 1.007,62 Bs. 1.001,37 0,62% 14 Binance
Mercantil Bs. 1.007,35 Bs. 1.000,93 0,64% 11 Binance
Banco de Venezuela Bs. 1.007,59 Bs. 1.001,03 0,66% 24 Binance
Banesco Bs. 1.007,64 Bs. 995,56 1,21% 20 Binance y otras plataformas
Pago Móvil Bs. 1.009,27 Bs. 996,05 1,33% 25 otras plataformas
Otro método Bs. 1.009,78 Bs. 995,41 1,44% 26 otras plataformas
Provincial Bs. 1.007,56 sin dato no calculable 4 Binance
Bancamiga Bs. 1.007,13 sin dato no calculable 2 Binance
Dos lecturas importan. Primero, el banco no es el único factor: en esta muestra BANK, Banco de Venezuela y Mercantil aparecen solo con ofertas de Binance, mientras Pago Móvil y "Otro método" se registran únicamente vía otras plataformas. Segundo, Provincial (4 anuncios) y Bancamiga (2 anuncios) no tienen precio de venta registrado, así que su spread no es calculable: no son mejores ni peores, simplemente no hay dato suficiente.
💰 Semáforo en amarillo con prima de 14,87%
El semáforo P2P marca 69 puntos y estado amarillo, "precaución moderada". Las métricas internas explican el color: liquidez (95), disponibilidad bancaria (95), frescura del dato (100) y salud de exchanges (95) están altas; spread (20) y profundidad (45) son las que pesan en contra.
La prima frente al BCV es de 14,87%: la referencia P2P de Bs. 1.019,21 contra una tasa oficial de Bs. 887,30. Para dimensionarlo, 100 USDT en la referencia de compra equivalen a Bs. 97.780,06. Una prima amplia no es una señal de entrada: es una señal de que el diferencial con la tasa oficial es grande y de que el tipo de cambio del momento manda en cualquier cálculo.
📖 Lee el artículo completo: https://pitbullchain.com/noticias/usdt-ves-binance-concentra-la-profundidad-y-bybit-marca-la-punta-de-venta
📊 Tasas y análisis en vivo en https://pitbullchain.com
$USDT #USDTP2P #BinanceP2P #spreadP2P #orderbook
USDT/VES: Binance concentra la profundidad y otras plataformas marca la punta de venta
Radar P2P en vivo Captura: 24/10/2026, 2:00:10 a. m.
USDT/VES referencia Bs. 1019.21
Compra USDT Bs. 1019.21
Venta USDT Bs. 977.80
BCV Bs. 887.30
Prima vs BCV 14.87%
Spread P2P 4.23%
Ofertas observadas 182
Verificar datos actuales en Radar P2P
24 de octubre de 2026, 06:00 (hora de captura). El mercado P2P de USDT/VES no tiene un solo precio: tiene una referencia agregada, una punta de compra, una punta de venta y un spread distinto por banco. Esta es la foto de la jornada, con cifras medibles y una advertencia: comparar plataforma y banco cambia el número que ves en pantalla.
📊 Dos mediciones que no dicen lo mismo
Radar P2P registra USDT a Bs. 1.019,21 del lado de compra y Bs. 977,80 del lado de venta, con un spread de Bs. 41,40 (4,23%). Es una referencia de mercado amplia, construida sobre el conjunto de ofertas activas: 203 ofertas y 182 anuncios en el tablero.
El order book, en cambio, muestra la mejor oferta individual disponible en ese instante: mejor ask en Bs. 1.005,12 y mejor bid en Bs. 1.002,70. El spread entre puntas es de Bs. 2,42, es decir 0,24%, con precio medio de Bs. 1.003,91.
Hecho: ambas cifras salen del mismo reporte. Interpretación: no miden lo mismo. La referencia agregada pondera el conjunto del mercado; la punta describe una sola oferta, la más competitiva, que además puede tener límites pequeños. Confundirlas lleva a conclusiones equivocadas sobre cuánto se está pagando realmente.
📈 otras plataformas en la punta de venta, Binance en la profundidad
La mejor punta de venta viene de otras plataformas: Bs. 1.005,12 por USDT, método "Otro método", con 65,62 USDT disponibles en un único anuncio y un límite que va de 6,56 a 65,62 USDT. Es la mejor punta del tablero, pero es delgada.
La mejor punta de compra viene de Binance: Bs. 1.002,70, con 39.545,67 USDT en un solo anuncio que acepta Banco de Venezuela y BANK, con límite de 3.954,57 a 39.545,67 USDT. Ahí no solo hay mejor precio: hay tamaño.
El detalle que explica el título está en la profundidad acumulada del libro:
• Volumen comprador: 721.450,52 USDT en 34 ofertas.
• Volumen vendedor: 164.821,02 USDT en 37 ofertas.
• Desbalance: 62,81% a favor de la presión compradora.
Traducción: en este momento hay más intención de comprar USDT que de venderlo, y esa intención se concentra en Binance. El tablero registra 12 bancos o métodos de pago activos. La presión compradora no anticipa nada: es una foto del libro que puede cambiar en minutos.
🔎 El spread por banco: de 0,62% a 1,44%
El mismo activo, el mismo día y la misma hora muestran spreads distintos según el método de pago. La diferencia entre el precio promedio de compra y el de venta registrado va de 0,62% a 1,44%:
Banco o método Prom. compra Prom. venta Spread Anuncios Exchange
BANK Bs. 1.007,62 Bs. 1.001,37 0,62% 14 Binance
Mercantil Bs. 1.007,35 Bs. 1.000,93 0,64% 11 Binance
Banco de Venezuela Bs. 1.007,59 Bs. 1.001,03 0,66% 24 Binance
Banesco Bs. 1.007,64 Bs. 995,56 1,21% 20 Binance y otras plataformas
Pago Móvil Bs. 1.009,27 Bs. 996,05 1,33% 25 otras plataformas
Otro método Bs. 1.009,78 Bs. 995,41 1,44% 26 otras plataformas
Provincial Bs. 1.007,56 sin dato no calculable 4 Binance
Bancamiga Bs. 1.007,13 sin dato no calculable 2 Binance
Dos lecturas importan. Primero, el banco no es el único factor: en esta muestra BANK, Banco de Venezuela y Mercantil aparecen solo con ofertas de Binance, mientras Pago Móvil y "Otro método" se registran únicamente vía otras plataformas. Segundo, Provincial (4 anuncios) y Bancamiga (2 anuncios) no tienen precio de venta registrado, así que su spread no es calculable: no son mejores ni peores, simplemente no hay dato suficiente.
💰 Semáforo en amarillo con prima de 14,87%
El semáforo P2P marca 69 puntos y estado amarillo, "precaución moderada". Las métricas internas explican el color: liquidez (95), disponibilidad bancaria (95), frescura del dato (100) y salud de exchanges (95) están altas; spread (20) y profundidad (45) son las que pesan en contra.
La prima frente al BCV es de 14,87%: la referencia P2P de Bs. 1.019,21 contra una tasa oficial de Bs. 887,30. Para dimensionarlo, 100 USDT en la referencia de compra equivalen a Bs. 97.780,06. Una prima amplia no es una señal de entrada: es una señal de que el diferencial con la tasa oficial es grande y de que el tipo de cambio del momento manda en cualquier cálculo.
📖 Lee el artículo completo: https://pitbullchain.com/noticias/usdt-ves-binance-concentra-la-profundidad-y-bybit-marca-la-punta-de-venta
📊 Tasas y análisis en vivo en https://pitbullchain.com
$USDT #USDTP2P #BinanceP2P #spreadP2P #orderbook
USDT/VES referencia Bs. 1019.21
Compra USDT Bs. 1019.21
Venta USDT Bs. 977.80
BCV Bs. 887.30
Prima vs BCV 14.87%
Spread P2P 4.23%
Ofertas observadas 182
Verificar datos actuales en Radar P2P
24 de octubre de 2026, 06:00 (hora de captura). El mercado P2P de USDT/VES no tiene un solo precio: tiene una referencia agregada, una punta de compra, una punta de venta y un spread distinto por banco. Esta es la foto de la jornada, con cifras medibles y una advertencia: comparar plataforma y banco cambia el número que ves en pantalla.
📊 Dos mediciones que no dicen lo mismo
Radar P2P registra USDT a Bs. 1.019,21 del lado de compra y Bs. 977,80 del lado de venta, con un spread de Bs. 41,40 (4,23%). Es una referencia de mercado amplia, construida sobre el conjunto de ofertas activas: 203 ofertas y 182 anuncios en el tablero.
El order book, en cambio, muestra la mejor oferta individual disponible en ese instante: mejor ask en Bs. 1.005,12 y mejor bid en Bs. 1.002,70. El spread entre puntas es de Bs. 2,42, es decir 0,24%, con precio medio de Bs. 1.003,91.
Hecho: ambas cifras salen del mismo reporte. Interpretación: no miden lo mismo. La referencia agregada pondera el conjunto del mercado; la punta describe una sola oferta, la más competitiva, que además puede tener límites pequeños. Confundirlas lleva a conclusiones equivocadas sobre cuánto se está pagando realmente.
📈 otras plataformas en la punta de venta, Binance en la profundidad
La mejor punta de venta viene de otras plataformas: Bs. 1.005,12 por USDT, método "Otro método", con 65,62 USDT disponibles en un único anuncio y un límite que va de 6,56 a 65,62 USDT. Es la mejor punta del tablero, pero es delgada.
La mejor punta de compra viene de Binance: Bs. 1.002,70, con 39.545,67 USDT en un solo anuncio que acepta Banco de Venezuela y BANK, con límite de 3.954,57 a 39.545,67 USDT. Ahí no solo hay mejor precio: hay tamaño.
El detalle que explica el título está en la profundidad acumulada del libro:
• Volumen comprador: 721.450,52 USDT en 34 ofertas.
• Volumen vendedor: 164.821,02 USDT en 37 ofertas.
• Desbalance: 62,81% a favor de la presión compradora.
Traducción: en este momento hay más intención de comprar USDT que de venderlo, y esa intención se concentra en Binance. El tablero registra 12 bancos o métodos de pago activos. La presión compradora no anticipa nada: es una foto del libro que puede cambiar en minutos.
🔎 El spread por banco: de 0,62% a 1,44%
El mismo activo, el mismo día y la misma hora muestran spreads distintos según el método de pago. La diferencia entre el precio promedio de compra y el de venta registrado va de 0,62% a 1,44%:
Banco o método Prom. compra Prom. venta Spread Anuncios Exchange
BANK Bs. 1.007,62 Bs. 1.001,37 0,62% 14 Binance
Mercantil Bs. 1.007,35 Bs. 1.000,93 0,64% 11 Binance
Banco de Venezuela Bs. 1.007,59 Bs. 1.001,03 0,66% 24 Binance
Banesco Bs. 1.007,64 Bs. 995,56 1,21% 20 Binance y otras plataformas
Pago Móvil Bs. 1.009,27 Bs. 996,05 1,33% 25 otras plataformas
Otro método Bs. 1.009,78 Bs. 995,41 1,44% 26 otras plataformas
Provincial Bs. 1.007,56 sin dato no calculable 4 Binance
Bancamiga Bs. 1.007,13 sin dato no calculable 2 Binance
Dos lecturas importan. Primero, el banco no es el único factor: en esta muestra BANK, Banco de Venezuela y Mercantil aparecen solo con ofertas de Binance, mientras Pago Móvil y "Otro método" se registran únicamente vía otras plataformas. Segundo, Provincial (4 anuncios) y Bancamiga (2 anuncios) no tienen precio de venta registrado, así que su spread no es calculable: no son mejores ni peores, simplemente no hay dato suficiente.
💰 Semáforo en amarillo con prima de 14,87%
El semáforo P2P marca 69 puntos y estado amarillo, "precaución moderada". Las métricas internas explican el color: liquidez (95), disponibilidad bancaria (95), frescura del dato (100) y salud de exchanges (95) están altas; spread (20) y profundidad (45) son las que pesan en contra.
La prima frente al BCV es de 14,87%: la referencia P2P de Bs. 1.019,21 contra una tasa oficial de Bs. 887,30. Para dimensionarlo, 100 USDT en la referencia de compra equivalen a Bs. 97.780,06. Una prima amplia no es una señal de entrada: es una señal de que el diferencial con la tasa oficial es grande y de que el tipo de cambio del momento manda en cualquier cálculo.
📖 Lee el artículo completo: https://pitbullchain.com/noticias/usdt-ves-binance-concentra-la-profundidad-y-bybit-marca-la-punta-de-venta
📊 Tasas y análisis en vivo en https://pitbullchain.com
$USDT #USDTP2P #BinanceP2P #spreadP2P #orderbook
1

·
--
إذا كنت تتداول على منصة بينانس، فستجد دائماً جدولاً
مليئاً بالأرقام المتحركة باللونين الأحمر والأخضر بجانب المخطط. هذا الجدول ليس معقداً، بل هو مفتاح حركتك القادمة:
• القسم الأخضر (طلبات الشراء): يوضح لك الأسعار التي يرغب الناس بالشراء عندها. إذا رأيت رقماً ضخماً جداً عند سعر معين، فاعلم أن هذا السعر يمثل "جدار دعم" قوي يحمي العملة من الهبوط لأسفل منه بسهولة.
• القسم الأحمر (طلبات البيع): يوضح لك الأسعار التي يريد الناس البيع عندها. تجمّع مبالغ ضخمة عند سعر معين يعني "جدار مقاومة"، قد يصعب على العملة تجاوزه والصعود فوقه في نفس اللحظة.
💡 باختصار: قبل أن تشتري أي عملة تداول فوري (Spot)، ألقِ نظرة سريعة على هذا الجدول. إذا وجدت جداراً أحمر ضخماً قريباً من السعر الحالي، انتظر قليلاً ولا تستعجل الشراء، فقد يهبط السعر لتلتقطه بسعر أفضل من القسم الأخضر!
هل تراقب هذه الأرقام قبل الشراء والبيع، أم تشتري مباشرة؟ شاركنا في التعليقات 👇
Binance Academy #crypto Trading ##OrderBook #InvestSmartCrypto
{spot}(BTCUSDT)
{spot}(BNBUSDT)
{spot}(SOLUSDT)
إذا كنت تتداول على منصة بينانس، فستجد دائماً جدولاً
مليئاً بالأرقام المتحركة باللونين الأحمر والأخضر بجانب المخطط. هذا الجدول ليس معقداً، بل هو مفتاح حركتك القادمة:
• القسم الأخضر (طلبات الشراء): يوضح لك الأسعار التي يرغب الناس بالشراء عندها. إذا رأيت رقماً ضخماً جداً عند سعر معين، فاعلم أن هذا السعر يمثل "جدار دعم" قوي يحمي العملة من الهبوط لأسفل منه بسهولة.
• القسم الأحمر (طلبات البيع): يوضح لك الأسعار التي يريد الناس البيع عندها. تجمّع مبالغ ضخمة عند سعر معين يعني "جدار مقاومة"، قد يصعب على العملة تجاوزه والصعود فوقه في نفس اللحظة.
💡 باختصار: قبل أن تشتري أي عملة تداول فوري (Spot)، ألقِ نظرة سريعة على هذا الجدول. إذا وجدت جداراً أحمر ضخماً قريباً من السعر الحالي، انتظر قليلاً ولا تستعجل الشراء، فقد يهبط السعر لتلتقطه بسعر أفضل من القسم الأخضر!
هل تراقب هذه الأرقام قبل الشراء والبيع، أم تشتري مباشرة؟ شاركنا في التعليقات 👇
Binance Academy #crypto Trading ##OrderBook #InvestSmartCrypto
مليئاً بالأرقام المتحركة باللونين الأحمر والأخضر بجانب المخطط. هذا الجدول ليس معقداً، بل هو مفتاح حركتك القادمة:
• القسم الأخضر (طلبات الشراء): يوضح لك الأسعار التي يرغب الناس بالشراء عندها. إذا رأيت رقماً ضخماً جداً عند سعر معين، فاعلم أن هذا السعر يمثل "جدار دعم" قوي يحمي العملة من الهبوط لأسفل منه بسهولة.
• القسم الأحمر (طلبات البيع): يوضح لك الأسعار التي يريد الناس البيع عندها. تجمّع مبالغ ضخمة عند سعر معين يعني "جدار مقاومة"، قد يصعب على العملة تجاوزه والصعود فوقه في نفس اللحظة.
💡 باختصار: قبل أن تشتري أي عملة تداول فوري (Spot)، ألقِ نظرة سريعة على هذا الجدول. إذا وجدت جداراً أحمر ضخماً قريباً من السعر الحالي، انتظر قليلاً ولا تستعجل الشراء، فقد يهبط السعر لتلتقطه بسعر أفضل من القسم الأخضر!
هل تراقب هذه الأرقام قبل الشراء والبيع، أم تشتري مباشرة؟ شاركنا في التعليقات 👇
Binance Academy #crypto Trading ##OrderBook #InvestSmartCrypto
2
126

Why do market participants frequently assume that headline 24-hour volume guarantees uniform execution costs across different digital assets?
Market microstructure reveals that high turnover does not automatically translate to equivalent order-book depth. For instance, Bitcoin currently changes hands at $81,942.44 with a 24-hour quote volume exceeding $1.16 billion, anchoring dense resting liquidity across multiple price tiers that dampens slippage for large blocks. In contrast, Solana trades at $104.15 with a 24-hour quote volume of $209 million, where thinner spacing between resting orders can induce sharper price displacement on equivalent order sizes.
Inspecting intermediate book depth alongside aggregate volume metrics offers a clearer view of potential execution friction.
#MarketLiquidity #OrderBook
Why do market participants frequently assume that headline 24-hour volume guarantees uniform execution costs across different digital assets?
Market microstructure reveals that high turnover does not automatically translate to equivalent order-book depth. For instance, Bitcoin currently changes hands at $81,942.44 with a 24-hour quote volume exceeding $1.16 billion, anchoring dense resting liquidity across multiple price tiers that dampens slippage for large blocks. In contrast, Solana trades at $104.15 with a 24-hour quote volume of $209 million, where thinner spacing between resting orders can induce sharper price displacement on equivalent order sizes.
Inspecting intermediate book depth alongside aggregate volume metrics offers a clearer view of potential execution friction.
#MarketLiquidity #OrderBook
Market microstructure reveals that high turnover does not automatically translate to equivalent order-book depth. For instance, Bitcoin currently changes hands at $81,942.44 with a 24-hour quote volume exceeding $1.16 billion, anchoring dense resting liquidity across multiple price tiers that dampens slippage for large blocks. In contrast, Solana trades at $104.15 with a 24-hour quote volume of $209 million, where thinner spacing between resting orders can induce sharper price displacement on equivalent order sizes.
Inspecting intermediate book depth alongside aggregate volume metrics offers a clearer view of potential execution friction.
#MarketLiquidity #OrderBook
32

·
--
Haussier
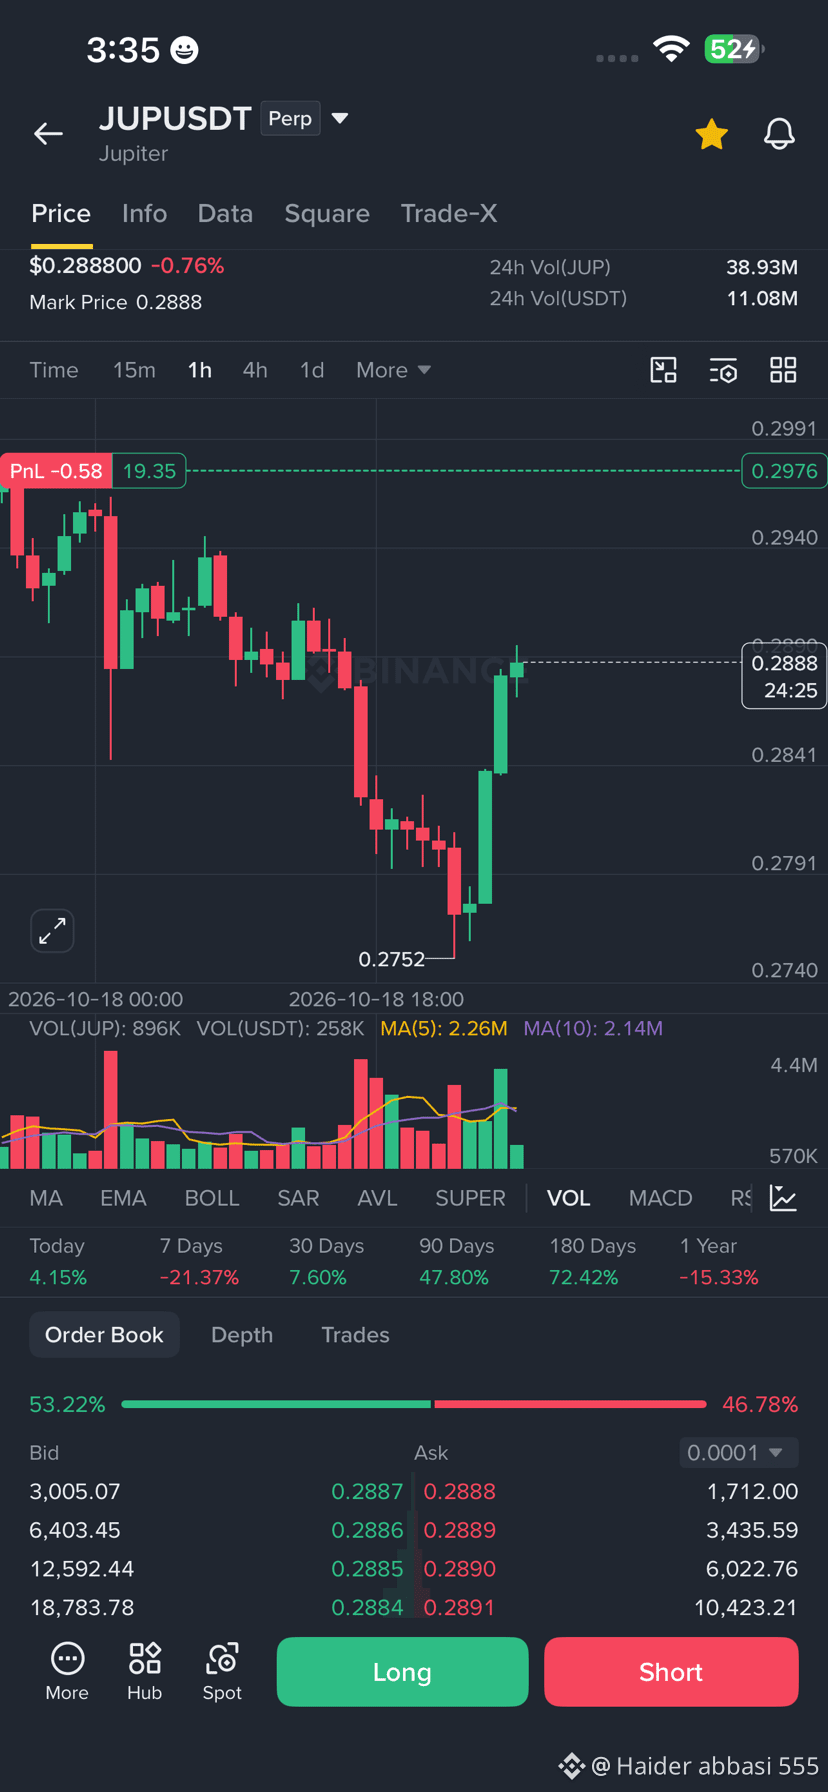
🧠 CRYTPO 101: Who is Buying the Dips and How Do Prices Actually Move? 📈📉
Ever looked at a massive green hourly candle and wondered: Who are these buyers, where do they come from, and what actually forces the price to snap back up? Understanding the human psychology and mechanics behind the chart is the ultimate key to trading like a professional.
👥 1. The Faces Behind the Order Book:
The market isn't just an automated computer script; it is driven by two distinct groups of real-world participants connected instantly via the exchange:
• Retail Traders: Everyday participants like us, managing positions across the globe, executing spot buys from their mobile apps.
• The Whales & Institutions: Large-scale funds and high-net-worth entities holding massive capital reserves. When a fundamentally strong asset hits a heavy discount zone, these whales step in with massive buy orders, creating institutional-grade support blocks.
🔄 2. The Law of Order Flows (Supply vs. Demand):
Every single price tick on your chart is a direct result of an auction tug-of-war.
• How Prices Surge (Demand-Driven): When an asset hits a recognized macro bottom (like $JUP just did at $0.2752), selling momentum dries up. Suddenly, thousands of global buyers want the same limited tokens. To secure their entries, buyers willingly outbid each other, paying higher and higher prices. This aggressive buying pressure forces the price up, printing those beautiful, solid green candles.
• How Prices Drop (Supply-Driven): Conversely, when panic hits the retail sector, everyone rushes to exit at the same time. With a flood of sellers and a scarcity of active buyers, sellers are forced to lower their asking prices continuously just to get filled. This cascade is what causes sharp corrections.
🎯 The Bottom Line for Spot Holders:
The recent 1-Hour bullish reversal candle with high volume confirms that smart money looked at the discounted rates, stepped in aggressively, and absorbed the panic supply.
#cryptoeducation #MarketMechanics #orderbook #SupplyAndDemand $JUP
🧠 CRYTPO 101: Who is Buying the Dips and How Do Prices Actually Move? 📈📉
Ever looked at a massive green hourly candle and wondered: Who are these buyers, where do they come from, and what actually forces the price to snap back up? Understanding the human psychology and mechanics behind the chart is the ultimate key to trading like a professional.
👥 1. The Faces Behind the Order Book:
The market isn't just an automated computer script; it is driven by two distinct groups of real-world participants connected instantly via the exchange:
• Retail Traders: Everyday participants like us, managing positions across the globe, executing spot buys from their mobile apps.
• The Whales & Institutions: Large-scale funds and high-net-worth entities holding massive capital reserves. When a fundamentally strong asset hits a heavy discount zone, these whales step in with massive buy orders, creating institutional-grade support blocks.
🔄 2. The Law of Order Flows (Supply vs. Demand):
Every single price tick on your chart is a direct result of an auction tug-of-war.
• How Prices Surge (Demand-Driven): When an asset hits a recognized macro bottom (like $JUP just did at $0.2752), selling momentum dries up. Suddenly, thousands of global buyers want the same limited tokens. To secure their entries, buyers willingly outbid each other, paying higher and higher prices. This aggressive buying pressure forces the price up, printing those beautiful, solid green candles.
• How Prices Drop (Supply-Driven): Conversely, when panic hits the retail sector, everyone rushes to exit at the same time. With a flood of sellers and a scarcity of active buyers, sellers are forced to lower their asking prices continuously just to get filled. This cascade is what causes sharp corrections.
🎯 The Bottom Line for Spot Holders:
The recent 1-Hour bullish reversal candle with high volume confirms that smart money looked at the discounted rates, stepped in aggressively, and absorbed the panic supply.
#cryptoeducation #MarketMechanics #orderbook #SupplyAndDemand $JUP
Ever looked at a massive green hourly candle and wondered: Who are these buyers, where do they come from, and what actually forces the price to snap back up? Understanding the human psychology and mechanics behind the chart is the ultimate key to trading like a professional.
👥 1. The Faces Behind the Order Book:
The market isn't just an automated computer script; it is driven by two distinct groups of real-world participants connected instantly via the exchange:
• Retail Traders: Everyday participants like us, managing positions across the globe, executing spot buys from their mobile apps.
• The Whales & Institutions: Large-scale funds and high-net-worth entities holding massive capital reserves. When a fundamentally strong asset hits a heavy discount zone, these whales step in with massive buy orders, creating institutional-grade support blocks.
🔄 2. The Law of Order Flows (Supply vs. Demand):
Every single price tick on your chart is a direct result of an auction tug-of-war.
• How Prices Surge (Demand-Driven): When an asset hits a recognized macro bottom (like $JUP just did at $0.2752), selling momentum dries up. Suddenly, thousands of global buyers want the same limited tokens. To secure their entries, buyers willingly outbid each other, paying higher and higher prices. This aggressive buying pressure forces the price up, printing those beautiful, solid green candles.
• How Prices Drop (Supply-Driven): Conversely, when panic hits the retail sector, everyone rushes to exit at the same time. With a flood of sellers and a scarcity of active buyers, sellers are forced to lower their asking prices continuously just to get filled. This cascade is what causes sharp corrections.
🎯 The Bottom Line for Spot Holders:
The recent 1-Hour bullish reversal candle with high volume confirms that smart money looked at the discounted rates, stepped in aggressively, and absorbed the panic supply.
#cryptoeducation #MarketMechanics #orderbook #SupplyAndDemand $JUP
94

Oque eu vi no livro do par BTC/USDT agora a pouco foi bizarro, kk, como alguém me faz uma ordem de compra pra pagar 30 dólares a mais no valor original do token? kk, ou quer ter mais riscos de perca ou alguém mandou, pois não tem lógica inflar o preço com isso e comprar menos unidades da criptomoeda em questão, 🤣🤣
#Binance #Bitcoin #orderbook #trading #BinanceSquareTalks
Oque eu vi no livro do par BTC/USDT agora a pouco foi bizarro, kk, como alguém me faz uma ordem de compra pra pagar 30 dólares a mais no valor original do token? kk, ou quer ter mais riscos de perca ou alguém mandou, pois não tem lógica inflar o preço com isso e comprar menos unidades da criptomoeda em questão, 🤣🤣
#Binance #Bitcoin #orderbook #trading #BinanceSquareTalks
#Binance #Bitcoin #orderbook #trading #BinanceSquareTalks
1
170

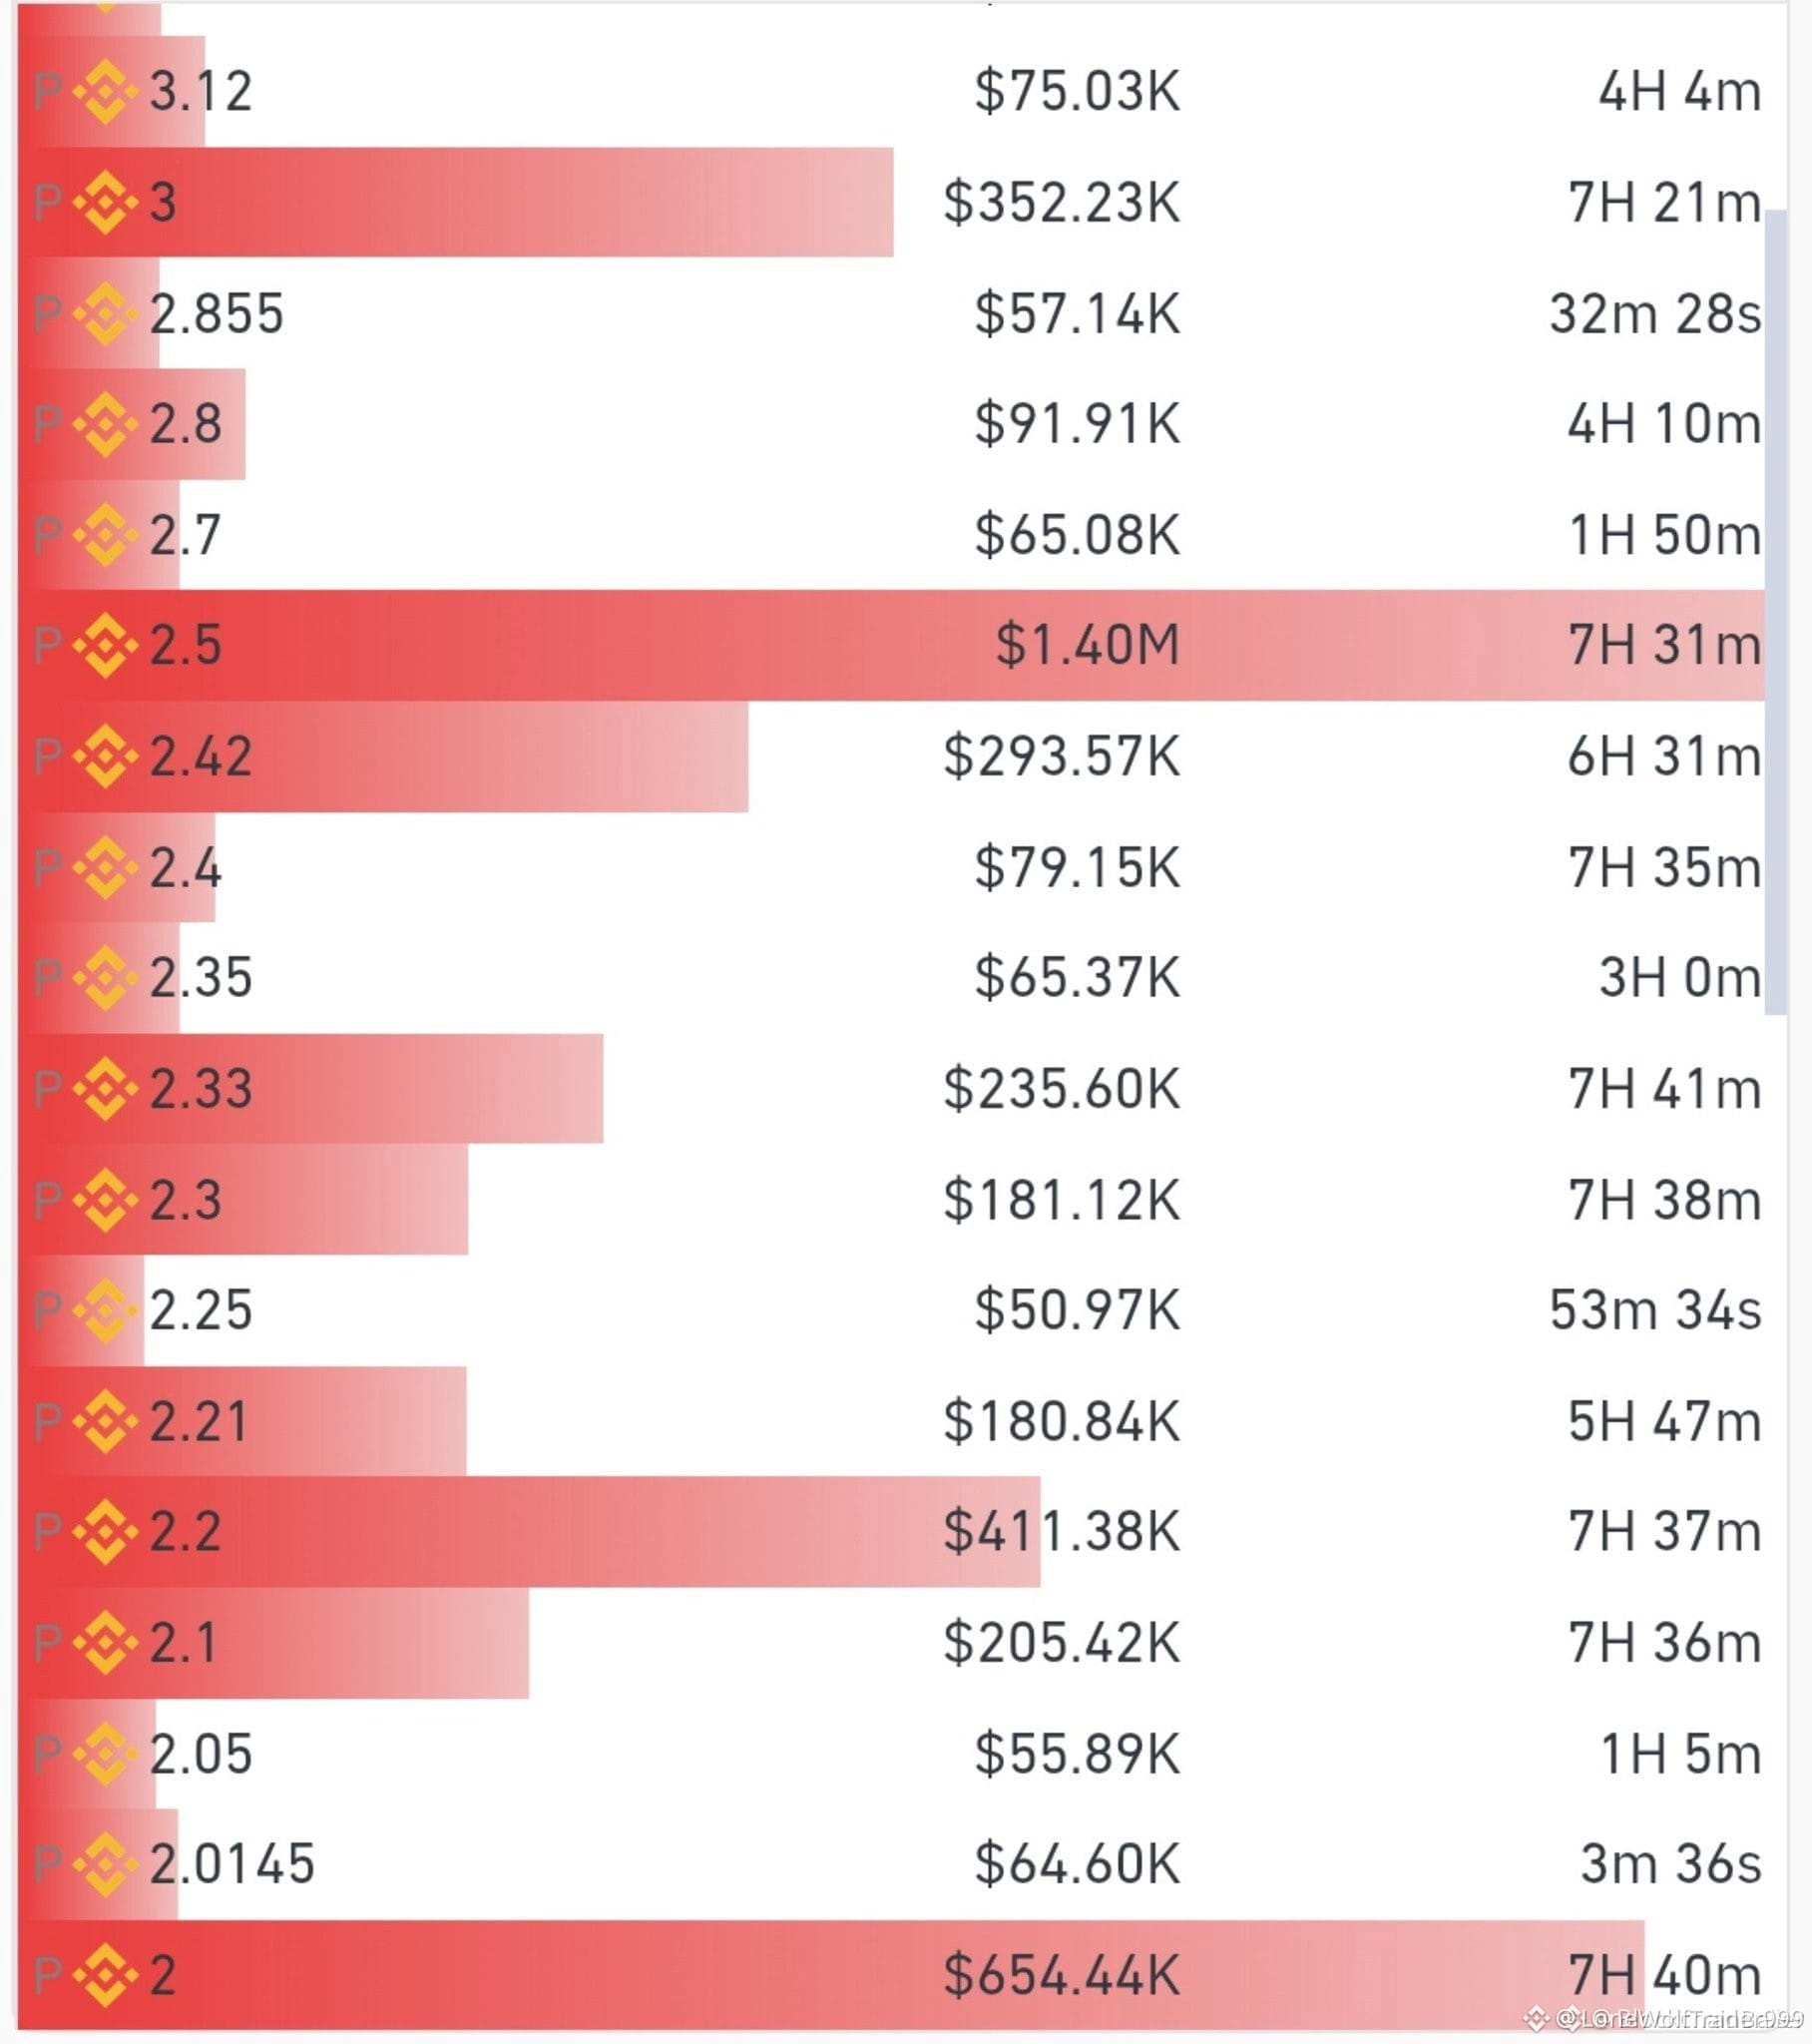
🚨 MASSIVE $BTW SELL WALL SPOTTED AS BEARS DIG IN THEIR HEELS! 💣
A formidable supply block just materialized on the order book for $BTW , drawing a battle line right in front of eager buyers. 🔍 Sellers are flashing heavy size to cap the upside, but high-density walls often serve as magnet liquidity before an aggressive absorption phase kicks off.
Watch the tape closely as spot volume presses directly into this resistance cluster. ⚡ If bidders aggressively chew through this stacked ask depth instead of retreating, the resulting squeeze could catch overconfident sellers completely off-guard. 🤔 Do you see this wall holding firm, or are buyers about to tear straight through it? 👇
⚠️ Not financial advice. Always manage your risk. 🛡️
🏷️ #BTW #OrderBook #CryptoTrading #Altcoins
🎯 🦈
🚨 MASSIVE $BTW SELL WALL SPOTTED AS BEARS DIG IN THEIR HEELS! 💣
A formidable supply block just materialized on the order book for $BTW , drawing a battle line right in front of eager buyers. 🔍 Sellers are flashing heavy size to cap the upside, but high-density walls often serve as magnet liquidity before an aggressive absorption phase kicks off.
Watch the tape closely as spot volume presses directly into this resistance cluster. ⚡ If bidders aggressively chew through this stacked ask depth instead of retreating, the resulting squeeze could catch overconfident sellers completely off-guard. 🤔 Do you see this wall holding firm, or are buyers about to tear straight through it? 👇
⚠️ Not financial advice. Always manage your risk. 🛡️
🏷️ #BTW #OrderBook #CryptoTrading #Altcoins
🎯 🦈
A formidable supply block just materialized on the order book for $BTW , drawing a battle line right in front of eager buyers. 🔍 Sellers are flashing heavy size to cap the upside, but high-density walls often serve as magnet liquidity before an aggressive absorption phase kicks off.
Watch the tape closely as spot volume presses directly into this resistance cluster. ⚡ If bidders aggressively chew through this stacked ask depth instead of retreating, the resulting squeeze could catch overconfident sellers completely off-guard. 🤔 Do you see this wall holding firm, or are buyers about to tear straight through it? 👇
⚠️ Not financial advice. Always manage your risk. 🛡️
🏷️ #BTW #OrderBook #CryptoTrading #Altcoins
🎯 🦈
12

·
--
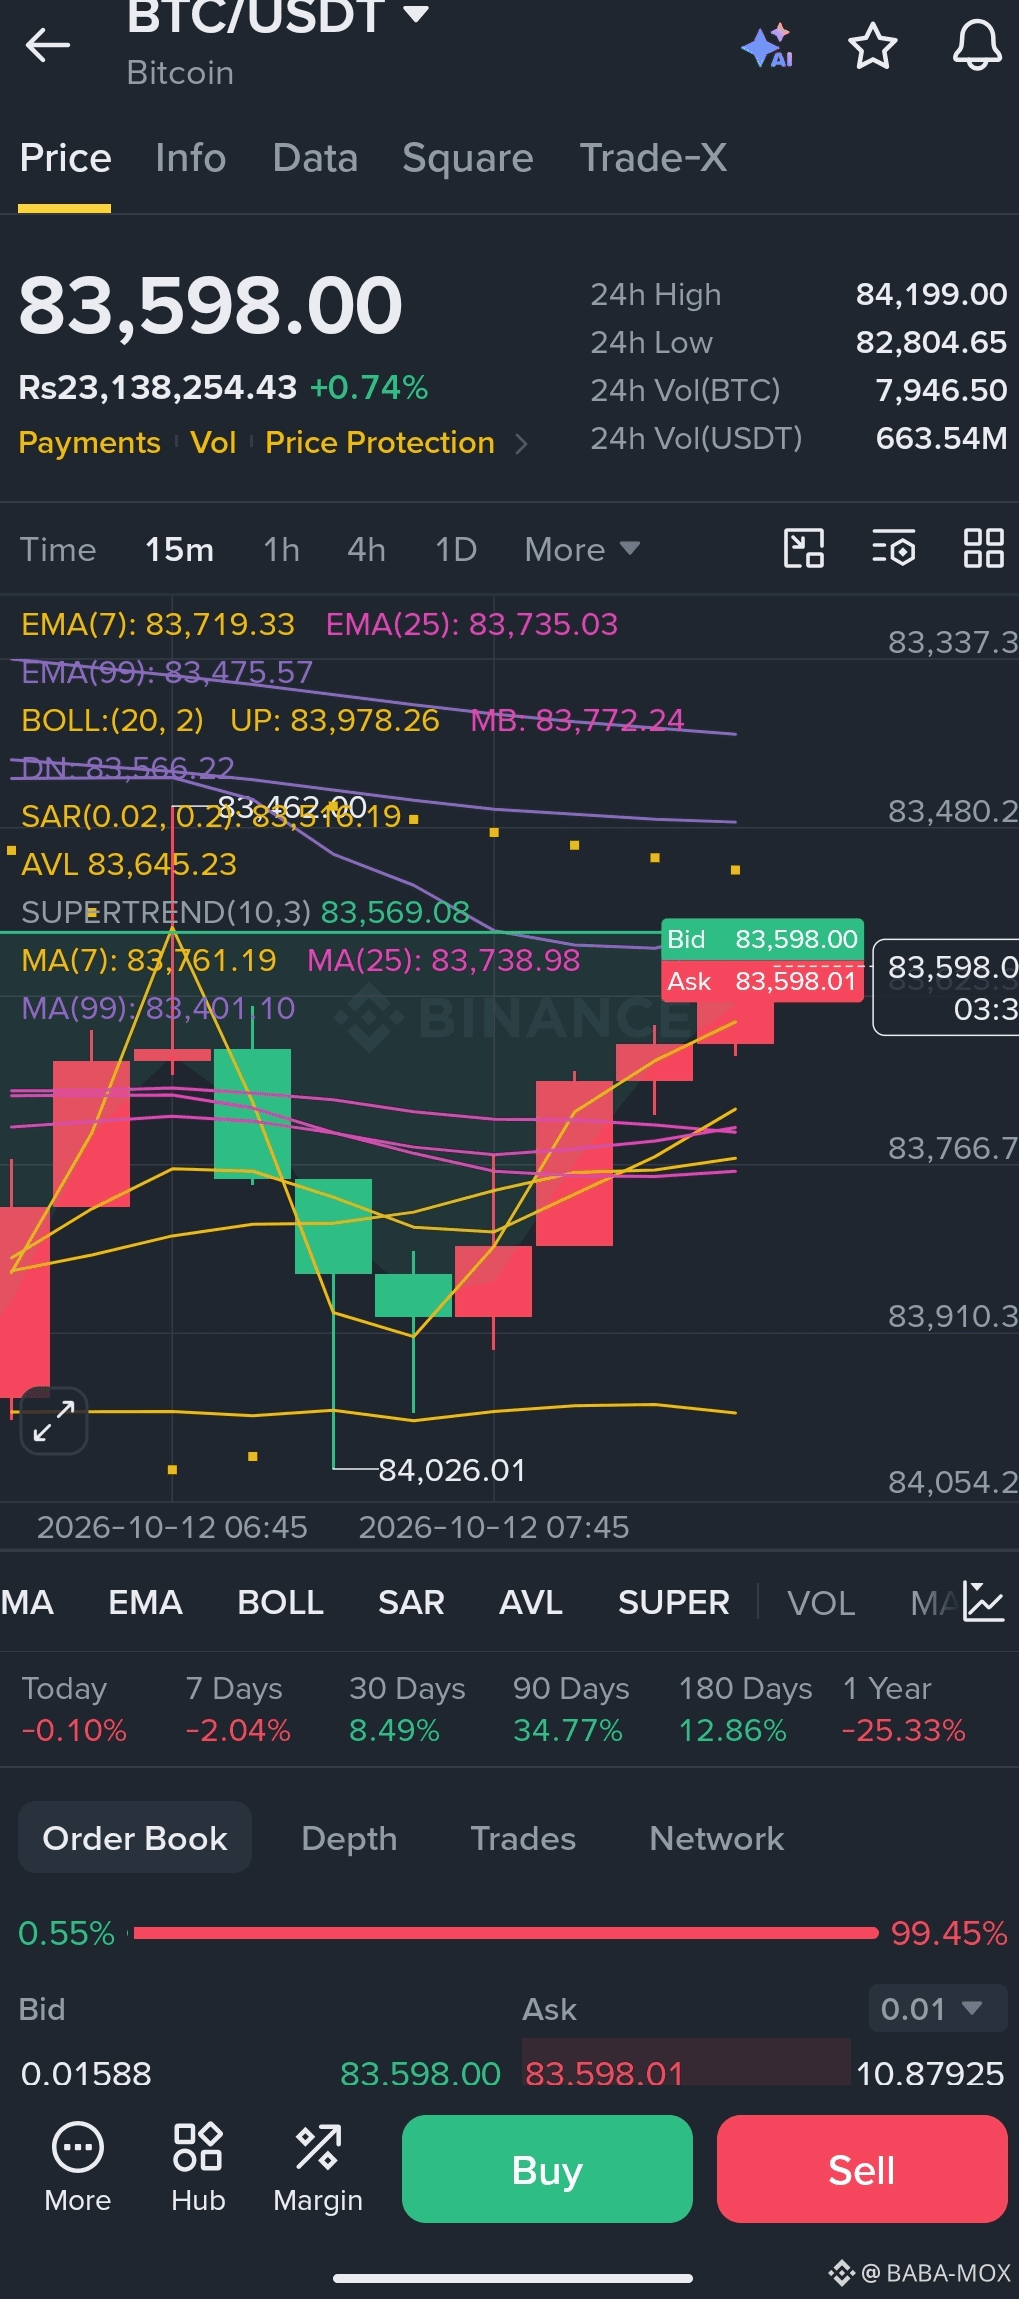
BTC $83,595 - 91% ASK = CAUTION ⚠️
Orderbook: 8.31% BID vs 91.69% ASK
Everyone selling at top
What I'm doing: WAITING
Not buying FOMO here
Real buy zone = when BID back to 30%+
#BTC #bitcoin #orderbook
BTC $83,595 - 91% ASK = CAUTION ⚠️
Orderbook: 8.31% BID vs 91.69% ASK
Everyone selling at top
What I'm doing: WAITING
Not buying FOMO here
Real buy zone = when BID back to 30%+
#BTC #bitcoin #orderbook
Orderbook: 8.31% BID vs 91.69% ASK
Everyone selling at top
What I'm doing: WAITING
Not buying FOMO here
Real buy zone = when BID back to 30%+
#BTC #bitcoin #orderbook
1
70
·
--
Article
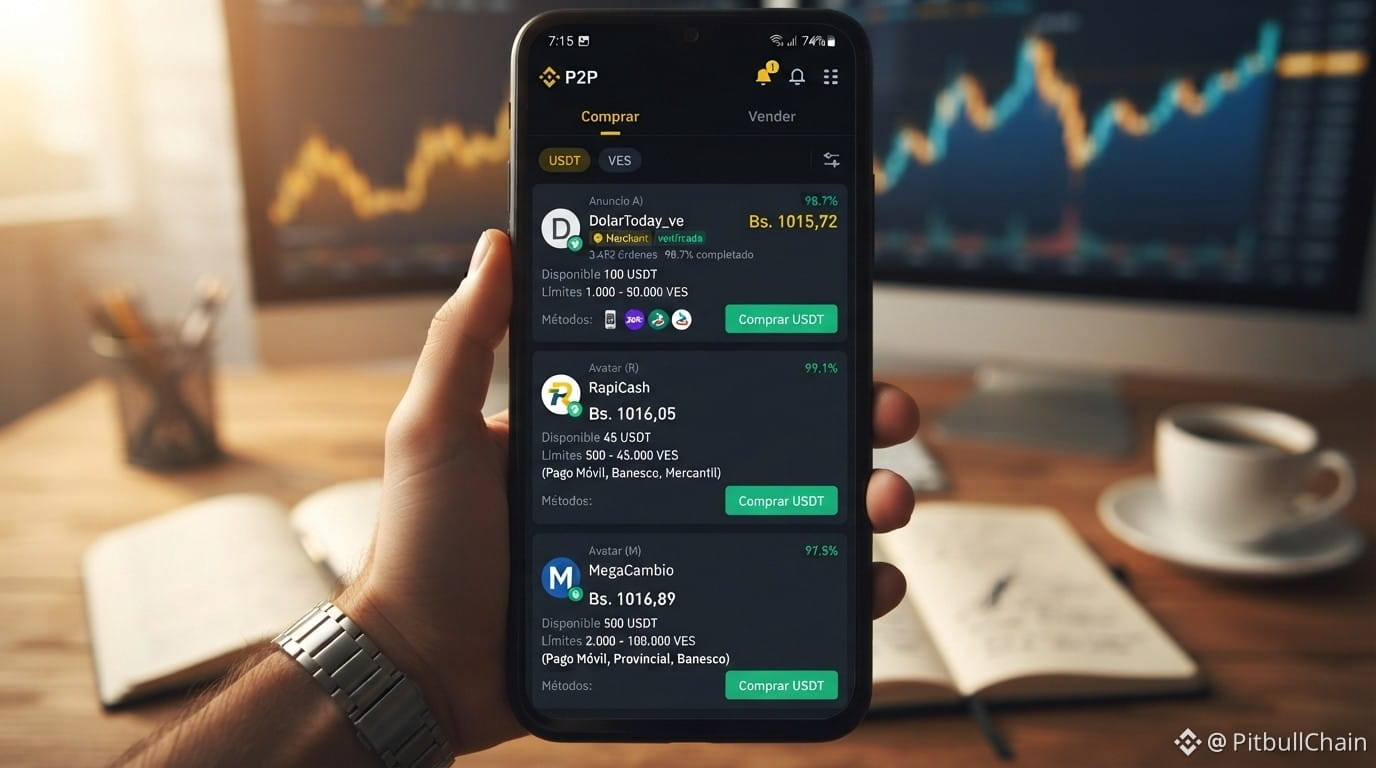
Binance y otras plataformas en P2P USDT/VES: profundidad por banco y spread realRadar P2P en vivo Captura: 12/10/2026, 6:00:09 a. m.
USDT/VES referencia Bs. 1032.24
Compra USDT Bs. 1032.24
Venta USDT Bs. 962.28
BCV Bs. 876.80
Prima vs BCV 17.73%
Spread P2P 7.27%
Ofertas observadas 192
Verificar datos actuales en Radar P2P
El mercado P2P de USDT/VES amaneció el 12 de octubre de 2026 con dos relatos distintos sobre el mismo mercado. Según la captura de Radar P2P de las 10:00 UTC, la referencia de compra quedó en 1.032,24 Bs y la de venta en 962,28 Bs, con un spread de 69,96 Bs (7,27%) y una prima de 17,73% sobre la tasa BCV de 876,7976 Bs. El semáforo del mercado marcó 71 puntos, estado amarillo, etiqueta de precaución moderada.
El order book de esa misma hora cuenta otra cosa, más concreta: el mejor ask (precio al que se ofrece USDT) estaba en 1.013,05 Bs y el mejor bid (precio al que se demanda) en 1.010,20 Bs. Spread de punta a punta: 2,85 Bs, equivalente a 0,28%. La distancia entre 7,27% y 0,28% no es un error de cálculo. Son dos mediciones diferentes: la referencia de Radar resume anuncios dispersos de todo el tablero; el libro muestra la punta ejecutable. Confundir una con otra es la fuente más común de expectativas infladas antes de operar.
📊 Binance concentra la oferta; otras plataformas marca la punta del libro
Del volumen total en oferta registrado en el libro (97.801,20 USDT), Binance aporta en solitario 70.568,21 USDT (72,2%), otras plataformas en solitario 12.790,88 USDT (13,1%) y los niveles donde aparecen ambos exchanges suman 14.442,11 USDT (14,8%). En otras palabras: quien necesita comprar USDT con bolívares encuentra casi tres cuartas partes del papel disponible en un solo exchange.
Pero la punta del libro pertenece a otras plataformas. Su mejor ask está en 1.013,05 Bs, con apenas 120,87 USDT en un solo anuncio pagando vía Pago Móvil. El siguiente nivel, 1.013,50 Bs, suma 373 USDT. Por debajo de 1.015 Bs, otras plataformas apenas reúne unos 569 USDT. Binance, en cambio, arranca más arriba: su mejor ask aparece en 1.015,24 Bs (mediana de 1.015 Bs en su feed propio), pero sostiene miles de USDT por nivel desde 1.015,40 Bs en adelante, con picos de 14.443,28 USDT y 13.998,69 USDT.
En el lado de la demanda el reparto se invierte. De los 290.450,82 USDT en bids, Binance concentra 143.313,72 USDT (49,3%) y otras plataformas 147.137,10 USDT (50,7%). La diferencia no está en el volumen, sino en la cercanía al precio medio: Binance pone 128.634 USDT entre 1.009,20 y 1.010,20 Bs, mientras el mejor bid de otras plataformas está en 1.006,13 Bs. Son 4,07 Bs de brecha (0,40%) entre plataformas para quien quiere vender USDT al mejor postor del libro.
📈 Banco por banco: dónde está la profundidad real
El agregado de bancos del Radar muestra 192 a 204 anuncios activos según la ventana que se consulte, con 25 anuncios en Banesco y en la etiqueta “Otro método”, 22 en Pago Móvil, 20 en Banco de Venezuela, 17 en BANK, 10 en Mercantil y apenas 4 en Bancamiga. El detalle:
Banco / método Anuncios Precio prom. compra Precio prom. venta Spread Exchange Part. liquidez Banesco 25 1.017,85 1.002,88 14,98 Bs (1,49%) Binance y otras plataformas 19,1% Otro método 25 1.024,63 1.004,47 20,16 Bs (2,01%) otras plataformas 19,1% Pago Móvil 22 1.017,93 1.000,98 16,96 Bs (1,69%) otras plataformas 16,8% Banco de Venezuela 20 1.015,61 1.009,29 6,32 Bs (0,63%) Binance 15,3% BANK 17 1.015,69 1.009,29 6,39 Bs (0,63%) Binance 13,0% Mercantil 10 1.015,84 1.008,28 7,56 Bs (0,75%) Binance 7,6% Bancamiga 4 1.015,42 1.009,30 6,12 Bs (0,61%) Binance 3,1% Aclaratoria importante: ese “spread” por banco no es un margen disponible ni una ganancia potencial. Es la dispersión entre el promedio de anuncios de compra y el promedio de anuncios de venta dentro del mismo método de pago. Un valor alto indica que los comerciantes de ese banco publican precios muy separados entre sí; un valor bajo indica un rango más compacto.
🔎 Cómo cambia el spread según el método de pago
El patrón que emerge del libro es claro. Los métodos donde Binance concentra la liquidez muestran dispersión estrecha: Banco de Venezuela (6,32 Bs, 0,63%), BANK (6,39 Bs, 0,63%), Bancamiga (6,12 Bs, 0,61%) y Mercantil (7,56 Bs, 0,75%). En los métodos donde el peso recae en otras plataformas o en etiquetas agregadas, la dispersión se abre: Banesco 14,98 Bs (1,49%), Pago Móvil 16,96 Bs (1,69%) y “Otro método” 20,16 Bs (2,01%).
📖 Lee el artículo completo: https://pitbullchain.com/noticias/binance-y-otras plataformas-en-p2p-usdt-ves-profundidad-por-banco-y-spread-real
https://public.bnbstatic.com/image/pgc/20261012/74dddd95c42246dfafe5e10066c8925c.jpg
📊 Tasas y análisis en vivo en https://pitbullchain.com
$USDT #USDTVES #P2PVenezuela #Binance #orderbook
Binance y otras plataformas en P2P USDT/VES: profundidad por banco y spread real
Radar P2P en vivo Captura: 12/10/2026, 6:00:09 a. m.
USDT/VES referencia Bs. 1032.24
Compra USDT Bs. 1032.24
Venta USDT Bs. 962.28
BCV Bs. 876.80
Prima vs BCV 17.73%
Spread P2P 7.27%
Ofertas observadas 192
Verificar datos actuales en Radar P2P
El mercado P2P de USDT/VES amaneció el 12 de octubre de 2026 con dos relatos distintos sobre el mismo mercado. Según la captura de Radar P2P de las 10:00 UTC, la referencia de compra quedó en 1.032,24 Bs y la de venta en 962,28 Bs, con un spread de 69,96 Bs (7,27%) y una prima de 17,73% sobre la tasa BCV de 876,7976 Bs. El semáforo del mercado marcó 71 puntos, estado amarillo, etiqueta de precaución moderada.
El order book de esa misma hora cuenta otra cosa, más concreta: el mejor ask (precio al que se ofrece USDT) estaba en 1.013,05 Bs y el mejor bid (precio al que se demanda) en 1.010,20 Bs. Spread de punta a punta: 2,85 Bs, equivalente a 0,28%. La distancia entre 7,27% y 0,28% no es un error de cálculo. Son dos mediciones diferentes: la referencia de Radar resume anuncios dispersos de todo el tablero; el libro muestra la punta ejecutable. Confundir una con otra es la fuente más común de expectativas infladas antes de operar.
📊 Binance concentra la oferta; otras plataformas marca la punta del libro
Del volumen total en oferta registrado en el libro (97.801,20 USDT), Binance aporta en solitario 70.568,21 USDT (72,2%), otras plataformas en solitario 12.790,88 USDT (13,1%) y los niveles donde aparecen ambos exchanges suman 14.442,11 USDT (14,8%). En otras palabras: quien necesita comprar USDT con bolívares encuentra casi tres cuartas partes del papel disponible en un solo exchange.
Pero la punta del libro pertenece a otras plataformas. Su mejor ask está en 1.013,05 Bs, con apenas 120,87 USDT en un solo anuncio pagando vía Pago Móvil. El siguiente nivel, 1.013,50 Bs, suma 373 USDT. Por debajo de 1.015 Bs, otras plataformas apenas reúne unos 569 USDT. Binance, en cambio, arranca más arriba: su mejor ask aparece en 1.015,24 Bs (mediana de 1.015 Bs en su feed propio), pero sostiene miles de USDT por nivel desde 1.015,40 Bs en adelante, con picos de 14.443,28 USDT y 13.998,69 USDT.
En el lado de la demanda el reparto se invierte. De los 290.450,82 USDT en bids, Binance concentra 143.313,72 USDT (49,3%) y otras plataformas 147.137,10 USDT (50,7%). La diferencia no está en el volumen, sino en la cercanía al precio medio: Binance pone 128.634 USDT entre 1.009,20 y 1.010,20 Bs, mientras el mejor bid de otras plataformas está en 1.006,13 Bs. Son 4,07 Bs de brecha (0,40%) entre plataformas para quien quiere vender USDT al mejor postor del libro.
📈 Banco por banco: dónde está la profundidad real
El agregado de bancos del Radar muestra 192 a 204 anuncios activos según la ventana que se consulte, con 25 anuncios en Banesco y en la etiqueta “Otro método”, 22 en Pago Móvil, 20 en Banco de Venezuela, 17 en BANK, 10 en Mercantil y apenas 4 en Bancamiga. El detalle:
Banco / método Anuncios Precio prom. compra Precio prom. venta Spread Exchange Part. liquidez Banesco 25 1.017,85 1.002,88 14,98 Bs (1,49%) Binance y otras plataformas 19,1% Otro método 25 1.024,63 1.004,47 20,16 Bs (2,01%) otras plataformas 19,1% Pago Móvil 22 1.017,93 1.000,98 16,96 Bs (1,69%) otras plataformas 16,8% Banco de Venezuela 20 1.015,61 1.009,29 6,32 Bs (0,63%) Binance 15,3% BANK 17 1.015,69 1.009,29 6,39 Bs (0,63%) Binance 13,0% Mercantil 10 1.015,84 1.008,28 7,56 Bs (0,75%) Binance 7,6% Bancamiga 4 1.015,42 1.009,30 6,12 Bs (0,61%) Binance 3,1% Aclaratoria importante: ese “spread” por banco no es un margen disponible ni una ganancia potencial. Es la dispersión entre el promedio de anuncios de compra y el promedio de anuncios de venta dentro del mismo método de pago. Un valor alto indica que los comerciantes de ese banco publican precios muy separados entre sí; un valor bajo indica un rango más compacto.
🔎 Cómo cambia el spread según el método de pago
El patrón que emerge del libro es claro. Los métodos donde Binance concentra la liquidez muestran dispersión estrecha: Banco de Venezuela (6,32 Bs, 0,63%), BANK (6,39 Bs, 0,63%), Bancamiga (6,12 Bs, 0,61%) y Mercantil (7,56 Bs, 0,75%). En los métodos donde el peso recae en otras plataformas o en etiquetas agregadas, la dispersión se abre: Banesco 14,98 Bs (1,49%), Pago Móvil 16,96 Bs (1,69%) y “Otro método” 20,16 Bs (2,01%).
📖 Lee el artículo completo: https://pitbullchain.com/noticias/binance-y-otras plataformas-en-p2p-usdt-ves-profundidad-por-banco-y-spread-real
https://public.bnbstatic.com/image/pgc/20261012/74dddd95c42246dfafe5e10066c8925c.jpg
📊 Tasas y análisis en vivo en https://pitbullchain.com
$USDT #USDTVES #P2PVenezuela #Binance #orderbook
USDT/VES referencia Bs. 1032.24
Compra USDT Bs. 1032.24
Venta USDT Bs. 962.28
BCV Bs. 876.80
Prima vs BCV 17.73%
Spread P2P 7.27%
Ofertas observadas 192
Verificar datos actuales en Radar P2P
El mercado P2P de USDT/VES amaneció el 12 de octubre de 2026 con dos relatos distintos sobre el mismo mercado. Según la captura de Radar P2P de las 10:00 UTC, la referencia de compra quedó en 1.032,24 Bs y la de venta en 962,28 Bs, con un spread de 69,96 Bs (7,27%) y una prima de 17,73% sobre la tasa BCV de 876,7976 Bs. El semáforo del mercado marcó 71 puntos, estado amarillo, etiqueta de precaución moderada.
El order book de esa misma hora cuenta otra cosa, más concreta: el mejor ask (precio al que se ofrece USDT) estaba en 1.013,05 Bs y el mejor bid (precio al que se demanda) en 1.010,20 Bs. Spread de punta a punta: 2,85 Bs, equivalente a 0,28%. La distancia entre 7,27% y 0,28% no es un error de cálculo. Son dos mediciones diferentes: la referencia de Radar resume anuncios dispersos de todo el tablero; el libro muestra la punta ejecutable. Confundir una con otra es la fuente más común de expectativas infladas antes de operar.
📊 Binance concentra la oferta; otras plataformas marca la punta del libro
Del volumen total en oferta registrado en el libro (97.801,20 USDT), Binance aporta en solitario 70.568,21 USDT (72,2%), otras plataformas en solitario 12.790,88 USDT (13,1%) y los niveles donde aparecen ambos exchanges suman 14.442,11 USDT (14,8%). En otras palabras: quien necesita comprar USDT con bolívares encuentra casi tres cuartas partes del papel disponible en un solo exchange.
Pero la punta del libro pertenece a otras plataformas. Su mejor ask está en 1.013,05 Bs, con apenas 120,87 USDT en un solo anuncio pagando vía Pago Móvil. El siguiente nivel, 1.013,50 Bs, suma 373 USDT. Por debajo de 1.015 Bs, otras plataformas apenas reúne unos 569 USDT. Binance, en cambio, arranca más arriba: su mejor ask aparece en 1.015,24 Bs (mediana de 1.015 Bs en su feed propio), pero sostiene miles de USDT por nivel desde 1.015,40 Bs en adelante, con picos de 14.443,28 USDT y 13.998,69 USDT.
En el lado de la demanda el reparto se invierte. De los 290.450,82 USDT en bids, Binance concentra 143.313,72 USDT (49,3%) y otras plataformas 147.137,10 USDT (50,7%). La diferencia no está en el volumen, sino en la cercanía al precio medio: Binance pone 128.634 USDT entre 1.009,20 y 1.010,20 Bs, mientras el mejor bid de otras plataformas está en 1.006,13 Bs. Son 4,07 Bs de brecha (0,40%) entre plataformas para quien quiere vender USDT al mejor postor del libro.
📈 Banco por banco: dónde está la profundidad real
El agregado de bancos del Radar muestra 192 a 204 anuncios activos según la ventana que se consulte, con 25 anuncios en Banesco y en la etiqueta “Otro método”, 22 en Pago Móvil, 20 en Banco de Venezuela, 17 en BANK, 10 en Mercantil y apenas 4 en Bancamiga. El detalle:
Banco / método Anuncios Precio prom. compra Precio prom. venta Spread Exchange Part. liquidez Banesco 25 1.017,85 1.002,88 14,98 Bs (1,49%) Binance y otras plataformas 19,1% Otro método 25 1.024,63 1.004,47 20,16 Bs (2,01%) otras plataformas 19,1% Pago Móvil 22 1.017,93 1.000,98 16,96 Bs (1,69%) otras plataformas 16,8% Banco de Venezuela 20 1.015,61 1.009,29 6,32 Bs (0,63%) Binance 15,3% BANK 17 1.015,69 1.009,29 6,39 Bs (0,63%) Binance 13,0% Mercantil 10 1.015,84 1.008,28 7,56 Bs (0,75%) Binance 7,6% Bancamiga 4 1.015,42 1.009,30 6,12 Bs (0,61%) Binance 3,1% Aclaratoria importante: ese “spread” por banco no es un margen disponible ni una ganancia potencial. Es la dispersión entre el promedio de anuncios de compra y el promedio de anuncios de venta dentro del mismo método de pago. Un valor alto indica que los comerciantes de ese banco publican precios muy separados entre sí; un valor bajo indica un rango más compacto.
🔎 Cómo cambia el spread según el método de pago
El patrón que emerge del libro es claro. Los métodos donde Binance concentra la liquidez muestran dispersión estrecha: Banco de Venezuela (6,32 Bs, 0,63%), BANK (6,39 Bs, 0,63%), Bancamiga (6,12 Bs, 0,61%) y Mercantil (7,56 Bs, 0,75%). En los métodos donde el peso recae en otras plataformas o en etiquetas agregadas, la dispersión se abre: Banesco 14,98 Bs (1,49%), Pago Móvil 16,96 Bs (1,69%) y “Otro método” 20,16 Bs (2,01%).
📖 Lee el artículo completo: https://pitbullchain.com/noticias/binance-y-otras plataformas-en-p2p-usdt-ves-profundidad-por-banco-y-spread-real
https://public.bnbstatic.com/image/pgc/20261012/74dddd95c42246dfafe5e10066c8925c.jpg
📊 Tasas y análisis en vivo en https://pitbullchain.com
$USDT #USDTVES #P2PVenezuela #Binance #orderbook
28

If you are still treating a calm order book as guaranteed liquidity, stop now.
Most traders realize this only after a market order slips straight through three price levels, turning a routine exit into an unexpected loss during sudden volatility.
On the surface, looking at order books on a quiet Tuesday feels reassuring. You see stacked bids, thick ask walls, and razor-thin spreads across pairs like $BTC and $ETH, which makes retail assume the market is deep enough to absorb size without moving. Some argue this resting liquidity is proof of healthy market making and stable pricing.
I disagree. The reality is that much of that resting depth is passive algorithmic spoofing designed to pull the millisecond real volume hits. When momentum shifts, those walls vanish instantly, leaving anyone trading large positions or altcoins like $SOL exposed to massive slippage.
Do you trust the order book depth during quiet hours, or do you wait for active volume before entering size?
#CryptoTrading #OrderBook #Liquidity
If you are still treating a calm order book as guaranteed liquidity, stop now.
Most traders realize this only after a market order slips straight through three price levels, turning a routine exit into an unexpected loss during sudden volatility.
On the surface, looking at order books on a quiet Tuesday feels reassuring. You see stacked bids, thick ask walls, and razor-thin spreads across pairs like $BTC and $ETH , which makes retail assume the market is deep enough to absorb size without moving. Some argue this resting liquidity is proof of healthy market making and stable pricing.
I disagree. The reality is that much of that resting depth is passive algorithmic spoofing designed to pull the millisecond real volume hits. When momentum shifts, those walls vanish instantly, leaving anyone trading large positions or altcoins like $SOL exposed to massive slippage.
Do you trust the order book depth during quiet hours, or do you wait for active volume before entering size?
#CryptoTrading #OrderBook #Liquidity
Most traders realize this only after a market order slips straight through three price levels, turning a routine exit into an unexpected loss during sudden volatility.
On the surface, looking at order books on a quiet Tuesday feels reassuring. You see stacked bids, thick ask walls, and razor-thin spreads across pairs like $BTC and $ETH , which makes retail assume the market is deep enough to absorb size without moving. Some argue this resting liquidity is proof of healthy market making and stable pricing.
I disagree. The reality is that much of that resting depth is passive algorithmic spoofing designed to pull the millisecond real volume hits. When momentum shifts, those walls vanish instantly, leaving anyone trading large positions or altcoins like $SOL exposed to massive slippage.
Do you trust the order book depth during quiet hours, or do you wait for active volume before entering size?
#CryptoTrading #OrderBook #Liquidity

53

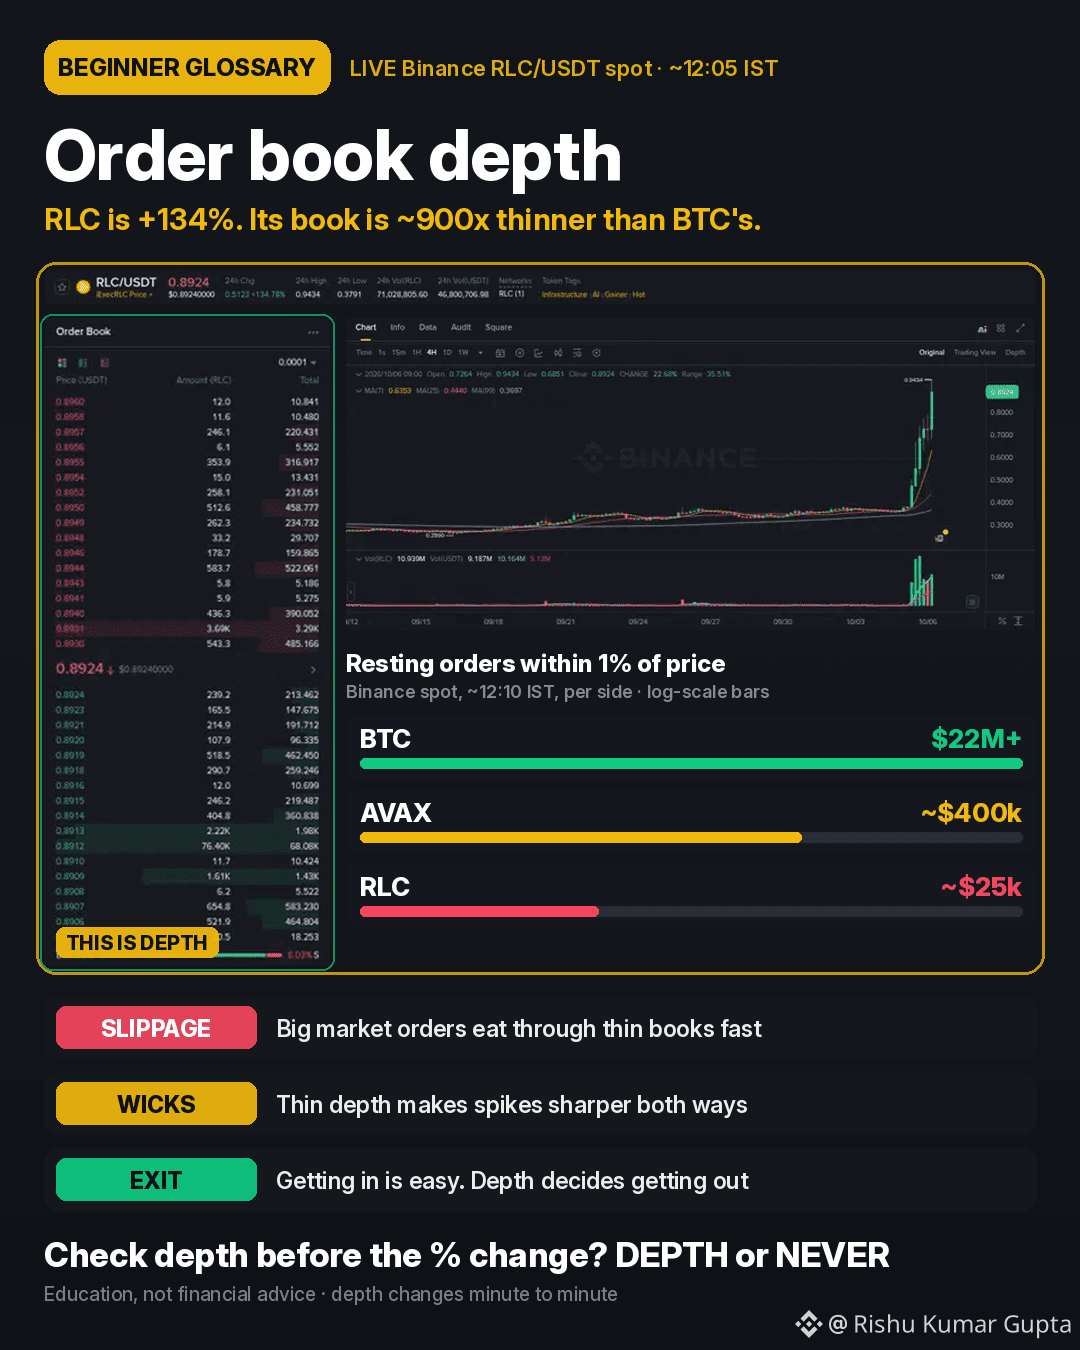
$RLC is up ~134% in 24h. Before the % change on any mover, I look at the order book.
Beginner glossary: ORDER BOOK DEPTH
Depth is how much money sits in resting buy and sell orders near the current price. It tells you how much size the market can absorb before price moves against you.
Binance spot books, ~12:10 IST, resting orders within 1% of price (per side):
• RLC/USDT ~$0.90: about $25k
• $AVAX ~$11.35: about $400k+
• $BTC ~$85.3k: over $22M
That's roughly 900x less depth on RLC than BTC.
Why it matters:
1. SLIPPAGE: a $30k market buy on RLC would clear more than 1% of the asks. On BTC it barely registers.
2. WICKS: thin books make spikes and dumps sharper in both directions. RLC's last 4H candle alone ran ~$0.69 to $0.94.
3. EXIT: getting in is easy. Depth decides how cleanly you get out.
Habit: order book and 24h volume first, % change last. Depth changes minute to minute, so check it live.
Education, not financial advice.
Do you check depth before trading a mover? Reply DEPTH or NEVER.
#OrderBook #CryptoBasics #BinanceSquare
$RLC is up ~134% in 24h. Before the % change on any mover, I look at the order book.
Beginner glossary: ORDER BOOK DEPTH
Depth is how much money sits in resting buy and sell orders near the current price. It tells you how much size the market can absorb before price moves against you.
Binance spot books, ~12:10 IST, resting orders within 1% of price (per side):
• RLC/USDT ~$0.90: about $25k
• $AVAX ~$11.35: about $400k+
• $BTC ~$85.3k: over $22M
That's roughly 900x less depth on RLC than BTC.
Why it matters:
1. SLIPPAGE: a $30k market buy on RLC would clear more than 1% of the asks. On BTC it barely registers.
2. WICKS: thin books make spikes and dumps sharper in both directions. RLC's last 4H candle alone ran ~$0.69 to $0.94.
3. EXIT: getting in is easy. Depth decides how cleanly you get out.
Habit: order book and 24h volume first, % change last. Depth changes minute to minute, so check it live.
Education, not financial advice.
Do you check depth before trading a mover? Reply DEPTH or NEVER.
#OrderBook #CryptoBasics #BinanceSquare
Beginner glossary: ORDER BOOK DEPTH
Depth is how much money sits in resting buy and sell orders near the current price. It tells you how much size the market can absorb before price moves against you.
Binance spot books, ~12:10 IST, resting orders within 1% of price (per side):
• RLC/USDT ~$0.90: about $25k
• $AVAX ~$11.35: about $400k+
• $BTC ~$85.3k: over $22M
That's roughly 900x less depth on RLC than BTC.
Why it matters:
1. SLIPPAGE: a $30k market buy on RLC would clear more than 1% of the asks. On BTC it barely registers.
2. WICKS: thin books make spikes and dumps sharper in both directions. RLC's last 4H candle alone ran ~$0.69 to $0.94.
3. EXIT: getting in is easy. Depth decides how cleanly you get out.
Habit: order book and 24h volume first, % change last. Depth changes minute to minute, so check it live.
Education, not financial advice.
Do you check depth before trading a mover? Reply DEPTH or NEVER.
#OrderBook #CryptoBasics #BinanceSquare
428

·
--
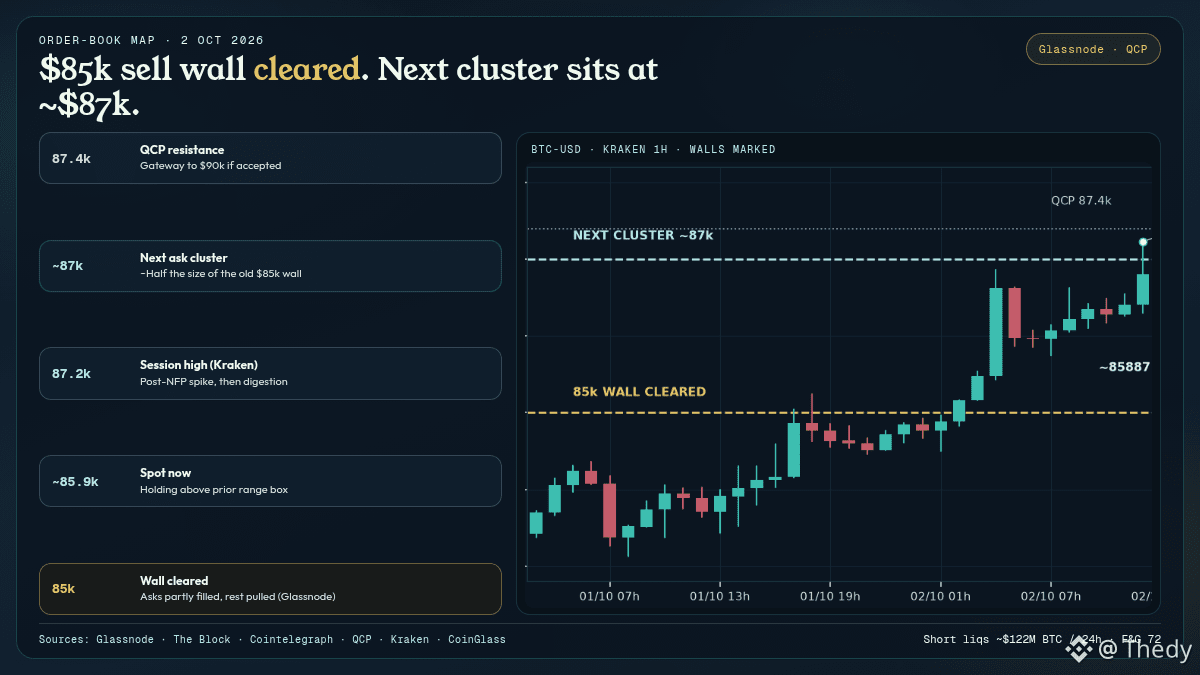
Mur $85k levé. Prochain cluster: $87k.
Glassnode (The Block / Cointelegraph): les asks autour de $85k ont été en partie exécutés, le reste retiré. Au-dessus, la liquidité vendeuse s'allège. Le prochain regroupement d'ordres se situe vers $87k, environ moitié moins dense que l'ancien mur.
Spot Kraken (~14:51 UTC): plus haut session 87 229 $, puis digestion vers ~85,9k. QCP place la résistance à 87,4k (porte vers 90k) et le support à 82,5k, tenu trois fois cette semaine.
En parallèle, liquidations shorts $BTC ~122 M$ sur 24h (CoinGlass / Cointelegraph), total crypto ~210 M$. Le squeeze a aidé le break; la question, c'est la tenue au-dessus de l'ancienne box 82k-85k.
Scénarios:
• Hold >85k puis retest 87k / 87,4k: le mur suivant devient le vrai test
• Perte nette de 85k: retour dans le range de la semaine
• Invalidation soft: flush sous 84k avec OI en chute
Le prochain mur à $87k est-il un aimant, ou un plafond pour $BTC ?
#Bitcoin #Crypto #OrderBook
Mur $85k levé. Prochain cluster: $87k.
Glassnode (The Block / Cointelegraph): les asks autour de $85k ont été en partie exécutés, le reste retiré. Au-dessus, la liquidité vendeuse s'allège. Le prochain regroupement d'ordres se situe vers $87k, environ moitié moins dense que l'ancien mur.
Spot Kraken (~14:51 UTC): plus haut session 87 229 $, puis digestion vers ~85,9k. QCP place la résistance à 87,4k (porte vers 90k) et le support à 82,5k, tenu trois fois cette semaine.
En parallèle, liquidations shorts $BTC ~122 M$ sur 24h (CoinGlass / Cointelegraph), total crypto ~210 M$. Le squeeze a aidé le break; la question, c'est la tenue au-dessus de l'ancienne box 82k-85k.
Scénarios:
• Hold >85k puis retest 87k / 87,4k: le mur suivant devient le vrai test
• Perte nette de 85k: retour dans le range de la semaine
• Invalidation soft: flush sous 84k avec OI en chute
Le prochain mur à $87k est-il un aimant, ou un plafond pour $BTC ?
#Bitcoin #Crypto #OrderBook
Glassnode (The Block / Cointelegraph): les asks autour de $85k ont été en partie exécutés, le reste retiré. Au-dessus, la liquidité vendeuse s'allège. Le prochain regroupement d'ordres se situe vers $87k, environ moitié moins dense que l'ancien mur.
Spot Kraken (~14:51 UTC): plus haut session 87 229 $, puis digestion vers ~85,9k. QCP place la résistance à 87,4k (porte vers 90k) et le support à 82,5k, tenu trois fois cette semaine.
En parallèle, liquidations shorts $BTC ~122 M$ sur 24h (CoinGlass / Cointelegraph), total crypto ~210 M$. Le squeeze a aidé le break; la question, c'est la tenue au-dessus de l'ancienne box 82k-85k.
Scénarios:
• Hold >85k puis retest 87k / 87,4k: le mur suivant devient le vrai test
• Perte nette de 85k: retour dans le range de la semaine
• Invalidation soft: flush sous 84k avec OI en chute
Le prochain mur à $87k est-il un aimant, ou un plafond pour $BTC ?
#Bitcoin #Crypto #OrderBook
118

Understanding Market Depth: How Order Books Shape Crypto Liquidity and Price ActionWhen transitioning from a beginner to an intermediate crypto trader, one of the most significant mindset shifts involves moving away from basic candlestick charts and looking directly at the engine driving market movements: the order book and its corresponding market depth.
While historical price charts tell you where an asset has been, market depth offers a real-time window into where supply and demand currently sit. Understanding how market depth works, how to read order books, and how market participants interact with liquidity is essential for reducing trading costs, managing risk, and avoiding common execution traps.
---
### What Is Market Depth?
At its core, market depth refers to the market’s ability to absorb relatively large market orders without causing significant price fluctuations. It represents the total volume of open buy and sell limit orders at various price levels surrounding the current spot price.
Market depth is visualized through two primary interface elements on centralized crypto exchanges:
1. **The Order Book:** A real-time, continuously updated list of pending buy orders (bids) and sell orders (asks).
2. **The Depth Chart:** A graphical representation of cumulative bids and asks stacked on either side of the current market price.
To understand market depth, one must first understand the fundamental divide in order execution: limit orders versus market orders. Limit orders provide liquidity to the market by sitting in the order book, waiting to be filled at a specific price or better. Market orders consume liquidity by executing instantly against the best available limit orders in the order book.
---
### Deconstructing the Order Book: Bids, Asks, and the Spread
An order book is split into two main sections:
* **Bids (Buy Side):** Located below the current market price, listed in descending order. The highest bid represents the highest price anyone is currently willing to pay for the asset.
* **Asks or Offers (Sell Side):** Located above the current market price, listed in ascending order. The lowest ask represents the cheapest price at which anyone is currently willing to sell the asset.
The gap between the highest bid and the lowest ask is known as the **bid-ask spread**.
In highly liquid markets—such as major trading pairs for Bitcoin or Ethereum on high-volume exchanges—the bid-ask spread is typically negligible, often a fraction of a cent or a single basis point. In contrast, illiquid markets or low-cap altcoin markets frequently feature wide bid-ask spreads. A wide spread means immediate entry and exit carry an implicit cost, as buying at the market price and instantly selling at the market price results in an immediate loss equal to the spread distance.
---
### Reading the Depth Chart
The depth chart visualizes the order book by plotting price along the horizontal axis (X-axis) and cumulative volume along the vertical axis (Y-axis).
* **The Buy Wall (Green Side):** Represents the cumulative sum of buy limit orders from the current price downward.
* **The Sell Wall (Red Side):** Represents the cumulative sum of sell limit orders from the current price upward.
When a visual "steep wall" appears on a depth chart, it indicates that a massive concentration of limit orders exists at a specific price point. For instance, if a large participant places a limit order to buy 1,000 units of an asset at $100, a steep green wall forms at $100.
To lower the market price below $100, market sellers must first sell enough volume to completely consume that 1,000-unit buy order. Consequently, significant buy walls often act as temporary psychological or structural support levels, while large sell walls act as resistance levels.
---
### Practical Example: Slippage and Order Sweeping
Understanding market depth is practical when executing trades above standard retail sizes. Suppose an trader wishes to buy $100,000 worth of a mid-cap digital asset using a market order.
Imagine the order book currently looks like this:
* **Best Ask:** $10.00 (Available Volume: $20,000)
* **Second Ask:** $10.10 (Available Volume: $30,000)
* **Third Ask:** $10.30 (Available Volume: $50,000)
If the trader submits a market buy order for $100,000, the exchange matching engine sweeps through the order book sequentially:
1. Fills $20,000 at $10.00
2. Fills $30,000 at $10.10
3. Fills $50,000 at $10.30
The trader’s expected purchase price was $10.00, but their **average execution price** ends up being approximately $10.18. The difference between the expected price and the actual execution price is known as **slippage**.
Slippage occurs precisely because the market depth at the top of the book was insufficient to fill the entire order at a single price point. Intermediate traders analyze market depth prior to execution to decide whether to split large orders into smaller tranches, use limit orders, or utilize automated algorithms like TWAP (Time-Weighted Average Price) to minimize market impact.
---
### Hidden Realities and Market Depth Manipulations
While market depth provides valuable insight, taking the order book at face value can be dangerous. Institutional participants, quantitative funds, and market makers use sophisticated strategies that alter how true liquidity is displayed.
#### 1. Phantom Liquidity and Spoofing
Not all visible orders are intended to be executed. "Spoofing" is a deceptive practice where a market actor places large limit orders (e.g., a massive buy wall) to create the false impression of strong support, enticing retail traders to buy. Once price approaches the fake wall, the actor cancels the order in milliseconds. Because limit orders can be canceled at any time prior to execution, displayed depth is never a guaranteed contract.
#### 2. Iceberg Orders
Large traders often wish to hide their true size to avoid moving the market against themselves. They utilize "iceberg orders," which divide a large order into small displayed segments. A trader might place an order to sell 50,000 units of BNB, but set the order book to display only 500 units at a time. As soon as one 500-unit tranche is filled, the next automatically appears. As a result, the visible order book may look thin, while hidden depth remains substantial.
#### 3. Off-Book Liquidity (OTC and Dark Pools)
A significant portion of global crypto volume takes place outside public order books through Over-the-Counter (OTC) desks or off-exchange liquidity venues. Highly capitalized entities routinely execute large block trades off-book precisely to avoid disrupting visible market depth on public exchanges.
---
### Incorporating Market Depth into Your Strategy
To effectively utilize market depth without falling victim to market noise:
* **Combine Depth with Volume Delta:** Do not rely on order book walls alone. Watch trade feeds (the time and sales tape) to verify whether orders at key depth levels are actually being executed or continuously canceled.
* **Assess Liquidity Across Venues:** Market depth varies significantly between exchanges. An asset may have deep liquidity on a tier-one venue while remaining extremely thin on smaller platforms.
* **Use Limit Orders for Position Entry:** To minimize execution drag from bid-ask spreads and slippage, default to patient limit orders when fast execution is not strictly required.
* **Practice Strict Risk Management:** Market conditions shift rapidly during periods of extreme volatility. During market-wide deleveraging events, liquidity providers often pull their limit orders entirely to mitigate their own risk, causing market depth to evaporate quickly and spreads to blow out wide.
---
### Conclusion
Market depth offers a dynamic view of supply and demand that raw price charts simply cannot capture. By learning to read order books, calculate potential slippage, and recognize the limitations of static order depth, intermediate traders gain a critical advantage in trade execution and risk assessment. However, because order books are volatile and subject to rapid cancellation, market depth analysis should always be integrated with disciplined position sizing, strict stop-loss rules, and a broader understanding of market context.
#CryptoTrading #MarketDepth #OrderBook
Understanding Market Depth: How Order Books Shape Crypto Liquidity and Price Action
When transitioning from a beginner to an intermediate crypto trader, one of the most significant mindset shifts involves moving away from basic candlestick charts and looking directly at the engine driving market movements: the order book and its corresponding market depth.
While historical price charts tell you where an asset has been, market depth offers a real-time window into where supply and demand currently sit. Understanding how market depth works, how to read order books, and how market participants interact with liquidity is essential for reducing trading costs, managing risk, and avoiding common execution traps.
---
### What Is Market Depth?
At its core, market depth refers to the market’s ability to absorb relatively large market orders without causing significant price fluctuations. It represents the total volume of open buy and sell limit orders at various price levels surrounding the current spot price.
Market depth is visualized through two primary interface elements on centralized crypto exchanges:
1. **The Order Book:** A real-time, continuously updated list of pending buy orders (bids) and sell orders (asks).
2. **The Depth Chart:** A graphical representation of cumulative bids and asks stacked on either side of the current market price.
To understand market depth, one must first understand the fundamental divide in order execution: limit orders versus market orders. Limit orders provide liquidity to the market by sitting in the order book, waiting to be filled at a specific price or better. Market orders consume liquidity by executing instantly against the best available limit orders in the order book.
---
### Deconstructing the Order Book: Bids, Asks, and the Spread
An order book is split into two main sections:
* **Bids (Buy Side):** Located below the current market price, listed in descending order. The highest bid represents the highest price anyone is currently willing to pay for the asset.
* **Asks or Offers (Sell Side):** Located above the current market price, listed in ascending order. The lowest ask represents the cheapest price at which anyone is currently willing to sell the asset.
The gap between the highest bid and the lowest ask is known as the **bid-ask spread**.
In highly liquid markets—such as major trading pairs for Bitcoin or Ethereum on high-volume exchanges—the bid-ask spread is typically negligible, often a fraction of a cent or a single basis point. In contrast, illiquid markets or low-cap altcoin markets frequently feature wide bid-ask spreads. A wide spread means immediate entry and exit carry an implicit cost, as buying at the market price and instantly selling at the market price results in an immediate loss equal to the spread distance.
---
### Reading the Depth Chart
The depth chart visualizes the order book by plotting price along the horizontal axis (X-axis) and cumulative volume along the vertical axis (Y-axis).
* **The Buy Wall (Green Side):** Represents the cumulative sum of buy limit orders from the current price downward.
* **The Sell Wall (Red Side):** Represents the cumulative sum of sell limit orders from the current price upward.
When a visual "steep wall" appears on a depth chart, it indicates that a massive concentration of limit orders exists at a specific price point. For instance, if a large participant places a limit order to buy 1,000 units of an asset at $100, a steep green wall forms at $100.
To lower the market price below $100, market sellers must first sell enough volume to completely consume that 1,000-unit buy order. Consequently, significant buy walls often act as temporary psychological or structural support levels, while large sell walls act as resistance levels.
---
### Practical Example: Slippage and Order Sweeping
Understanding market depth is practical when executing trades above standard retail sizes. Suppose an trader wishes to buy $100,000 worth of a mid-cap digital asset using a market order.
Imagine the order book currently looks like this:
* **Best Ask:** $10.00 (Available Volume: $20,000)
* **Second Ask:** $10.10 (Available Volume: $30,000)
* **Third Ask:** $10.30 (Available Volume: $50,000)
If the trader submits a market buy order for $100,000, the exchange matching engine sweeps through the order book sequentially:
1. Fills $20,000 at $10.00
2. Fills $30,000 at $10.10
3. Fills $50,000 at $10.30
The trader’s expected purchase price was $10.00, but their **average execution price** ends up being approximately $10.18. The difference between the expected price and the actual execution price is known as **slippage**.
Slippage occurs precisely because the market depth at the top of the book was insufficient to fill the entire order at a single price point. Intermediate traders analyze market depth prior to execution to decide whether to split large orders into smaller tranches, use limit orders, or utilize automated algorithms like TWAP (Time-Weighted Average Price) to minimize market impact.
---
### Hidden Realities and Market Depth Manipulations
While market depth provides valuable insight, taking the order book at face value can be dangerous. Institutional participants, quantitative funds, and market makers use sophisticated strategies that alter how true liquidity is displayed.
#### 1. Phantom Liquidity and Spoofing
Not all visible orders are intended to be executed. "Spoofing" is a deceptive practice where a market actor places large limit orders (e.g., a massive buy wall) to create the false impression of strong support, enticing retail traders to buy. Once price approaches the fake wall, the actor cancels the order in milliseconds. Because limit orders can be canceled at any time prior to execution, displayed depth is never a guaranteed contract.
#### 2. Iceberg Orders
Large traders often wish to hide their true size to avoid moving the market against themselves. They utilize "iceberg orders," which divide a large order into small displayed segments. A trader might place an order to sell 50,000 units of BNB, but set the order book to display only 500 units at a time. As soon as one 500-unit tranche is filled, the next automatically appears. As a result, the visible order book may look thin, while hidden depth remains substantial.
#### 3. Off-Book Liquidity (OTC and Dark Pools)
A significant portion of global crypto volume takes place outside public order books through Over-the-Counter (OTC) desks or off-exchange liquidity venues. Highly capitalized entities routinely execute large block trades off-book precisely to avoid disrupting visible market depth on public exchanges.
---
### Incorporating Market Depth into Your Strategy
To effectively utilize market depth without falling victim to market noise:
* **Combine Depth with Volume Delta:** Do not rely on order book walls alone. Watch trade feeds (the time and sales tape) to verify whether orders at key depth levels are actually being executed or continuously canceled.
* **Assess Liquidity Across Venues:** Market depth varies significantly between exchanges. An asset may have deep liquidity on a tier-one venue while remaining extremely thin on smaller platforms.
* **Use Limit Orders for Position Entry:** To minimize execution drag from bid-ask spreads and slippage, default to patient limit orders when fast execution is not strictly required.
* **Practice Strict Risk Management:** Market conditions shift rapidly during periods of extreme volatility. During market-wide deleveraging events, liquidity providers often pull their limit orders entirely to mitigate their own risk, causing market depth to evaporate quickly and spreads to blow out wide.
---
### Conclusion
Market depth offers a dynamic view of supply and demand that raw price charts simply cannot capture. By learning to read order books, calculate potential slippage, and recognize the limitations of static order depth, intermediate traders gain a critical advantage in trade execution and risk assessment. However, because order books are volatile and subject to rapid cancellation, market depth analysis should always be integrated with disciplined position sizing, strict stop-loss rules, and a broader understanding of market context.
#CryptoTrading #MarketDepth #OrderBook
While historical price charts tell you where an asset has been, market depth offers a real-time window into where supply and demand currently sit. Understanding how market depth works, how to read order books, and how market participants interact with liquidity is essential for reducing trading costs, managing risk, and avoiding common execution traps.
---
### What Is Market Depth?
At its core, market depth refers to the market’s ability to absorb relatively large market orders without causing significant price fluctuations. It represents the total volume of open buy and sell limit orders at various price levels surrounding the current spot price.
Market depth is visualized through two primary interface elements on centralized crypto exchanges:
1. **The Order Book:** A real-time, continuously updated list of pending buy orders (bids) and sell orders (asks).
2. **The Depth Chart:** A graphical representation of cumulative bids and asks stacked on either side of the current market price.
To understand market depth, one must first understand the fundamental divide in order execution: limit orders versus market orders. Limit orders provide liquidity to the market by sitting in the order book, waiting to be filled at a specific price or better. Market orders consume liquidity by executing instantly against the best available limit orders in the order book.
---
### Deconstructing the Order Book: Bids, Asks, and the Spread
An order book is split into two main sections:
* **Bids (Buy Side):** Located below the current market price, listed in descending order. The highest bid represents the highest price anyone is currently willing to pay for the asset.
* **Asks or Offers (Sell Side):** Located above the current market price, listed in ascending order. The lowest ask represents the cheapest price at which anyone is currently willing to sell the asset.
The gap between the highest bid and the lowest ask is known as the **bid-ask spread**.
In highly liquid markets—such as major trading pairs for Bitcoin or Ethereum on high-volume exchanges—the bid-ask spread is typically negligible, often a fraction of a cent or a single basis point. In contrast, illiquid markets or low-cap altcoin markets frequently feature wide bid-ask spreads. A wide spread means immediate entry and exit carry an implicit cost, as buying at the market price and instantly selling at the market price results in an immediate loss equal to the spread distance.
---
### Reading the Depth Chart
The depth chart visualizes the order book by plotting price along the horizontal axis (X-axis) and cumulative volume along the vertical axis (Y-axis).
* **The Buy Wall (Green Side):** Represents the cumulative sum of buy limit orders from the current price downward.
* **The Sell Wall (Red Side):** Represents the cumulative sum of sell limit orders from the current price upward.
When a visual "steep wall" appears on a depth chart, it indicates that a massive concentration of limit orders exists at a specific price point. For instance, if a large participant places a limit order to buy 1,000 units of an asset at $100, a steep green wall forms at $100.
To lower the market price below $100, market sellers must first sell enough volume to completely consume that 1,000-unit buy order. Consequently, significant buy walls often act as temporary psychological or structural support levels, while large sell walls act as resistance levels.
---
### Practical Example: Slippage and Order Sweeping
Understanding market depth is practical when executing trades above standard retail sizes. Suppose an trader wishes to buy $100,000 worth of a mid-cap digital asset using a market order.
Imagine the order book currently looks like this:
* **Best Ask:** $10.00 (Available Volume: $20,000)
* **Second Ask:** $10.10 (Available Volume: $30,000)
* **Third Ask:** $10.30 (Available Volume: $50,000)
If the trader submits a market buy order for $100,000, the exchange matching engine sweeps through the order book sequentially:
1. Fills $20,000 at $10.00
2. Fills $30,000 at $10.10
3. Fills $50,000 at $10.30
The trader’s expected purchase price was $10.00, but their **average execution price** ends up being approximately $10.18. The difference between the expected price and the actual execution price is known as **slippage**.
Slippage occurs precisely because the market depth at the top of the book was insufficient to fill the entire order at a single price point. Intermediate traders analyze market depth prior to execution to decide whether to split large orders into smaller tranches, use limit orders, or utilize automated algorithms like TWAP (Time-Weighted Average Price) to minimize market impact.
---
### Hidden Realities and Market Depth Manipulations
While market depth provides valuable insight, taking the order book at face value can be dangerous. Institutional participants, quantitative funds, and market makers use sophisticated strategies that alter how true liquidity is displayed.
#### 1. Phantom Liquidity and Spoofing
Not all visible orders are intended to be executed. "Spoofing" is a deceptive practice where a market actor places large limit orders (e.g., a massive buy wall) to create the false impression of strong support, enticing retail traders to buy. Once price approaches the fake wall, the actor cancels the order in milliseconds. Because limit orders can be canceled at any time prior to execution, displayed depth is never a guaranteed contract.
#### 2. Iceberg Orders
Large traders often wish to hide their true size to avoid moving the market against themselves. They utilize "iceberg orders," which divide a large order into small displayed segments. A trader might place an order to sell 50,000 units of BNB, but set the order book to display only 500 units at a time. As soon as one 500-unit tranche is filled, the next automatically appears. As a result, the visible order book may look thin, while hidden depth remains substantial.
#### 3. Off-Book Liquidity (OTC and Dark Pools)
A significant portion of global crypto volume takes place outside public order books through Over-the-Counter (OTC) desks or off-exchange liquidity venues. Highly capitalized entities routinely execute large block trades off-book precisely to avoid disrupting visible market depth on public exchanges.
---
### Incorporating Market Depth into Your Strategy
To effectively utilize market depth without falling victim to market noise:
* **Combine Depth with Volume Delta:** Do not rely on order book walls alone. Watch trade feeds (the time and sales tape) to verify whether orders at key depth levels are actually being executed or continuously canceled.
* **Assess Liquidity Across Venues:** Market depth varies significantly between exchanges. An asset may have deep liquidity on a tier-one venue while remaining extremely thin on smaller platforms.
* **Use Limit Orders for Position Entry:** To minimize execution drag from bid-ask spreads and slippage, default to patient limit orders when fast execution is not strictly required.
* **Practice Strict Risk Management:** Market conditions shift rapidly during periods of extreme volatility. During market-wide deleveraging events, liquidity providers often pull their limit orders entirely to mitigate their own risk, causing market depth to evaporate quickly and spreads to blow out wide.
---
### Conclusion
Market depth offers a dynamic view of supply and demand that raw price charts simply cannot capture. By learning to read order books, calculate potential slippage, and recognize the limitations of static order depth, intermediate traders gain a critical advantage in trade execution and risk assessment. However, because order books are volatile and subject to rapid cancellation, market depth analysis should always be integrated with disciplined position sizing, strict stop-loss rules, and a broader understanding of market context.
#CryptoTrading #MarketDepth #OrderBook
1
114

·
--
THE REALITY BEHIND $SHIB AT $1 AND WHY GLITCHES ARE NOT REAL LIQUIDITY 🚨 📉
Phantom price spikes or interface display glitches do not represent actionable market liquidity. 📉 Institutional execution requires actual counterparty depth, and under $SHIB circulating supply metrics, a one-dollar valuation creates a structural market cap anomaly that no order book can absorb.
Realized fills only clear where bid-ask spreads find true equilibrium. 🔍 Smart money tracks order book depth and total market valuation rather than chasing localized feed anomalies. 💡
💬 How do you evaluate execution quality when sudden price anomalies appear on your chart? 👇
⚠️ Not financial advice. Always manage your risk. 🛡️
🏷️ #SHIB #Crypto #MarketStructure #OrderBook
🦈 🛡️
THE REALITY BEHIND $SHIB AT $1 AND WHY GLITCHES ARE NOT REAL LIQUIDITY 🚨 📉
Phantom price spikes or interface display glitches do not represent actionable market liquidity. 📉 Institutional execution requires actual counterparty depth, and under $SHIB circulating supply metrics, a one-dollar valuation creates a structural market cap anomaly that no order book can absorb.
Realized fills only clear where bid-ask spreads find true equilibrium. 🔍 Smart money tracks order book depth and total market valuation rather than chasing localized feed anomalies. 💡
💬 How do you evaluate execution quality when sudden price anomalies appear on your chart? 👇
⚠️ Not financial advice. Always manage your risk. 🛡️
🏷️ #SHIB #Crypto #MarketStructure #OrderBook
🦈 🛡️
Phantom price spikes or interface display glitches do not represent actionable market liquidity. 📉 Institutional execution requires actual counterparty depth, and under $SHIB circulating supply metrics, a one-dollar valuation creates a structural market cap anomaly that no order book can absorb.
Realized fills only clear where bid-ask spreads find true equilibrium. 🔍 Smart money tracks order book depth and total market valuation rather than chasing localized feed anomalies. 💡
💬 How do you evaluate execution quality when sudden price anomalies appear on your chart? 👇
⚠️ Not financial advice. Always manage your risk. 🛡️
🏷️ #SHIB #Crypto #MarketStructure #OrderBook
🦈 🛡️
66

·
--
$BTC’s drop below the $84.2K–$85K liquidity cluster puts the order book in focus: after rejecting $87.3K and more than $3B in reported liquidations, the key question is whether bids absorb remaining forced supply or pull as price falls.
BTC is trading at $83,054, down 2.13% over 24 hours. Funding remains slightly positive at 0.0036%, while sentiment is still Greed at 74. That combination suggests positioning may not be fully reset, even after the wipeouts. Watch how price behaves on any retest of $84.2K–$85K: repeated offers and weak bid replenishment would favor continued drift lower; firm absorption and a reclaim could point to a leverage purge rather than a broader breakdown.
Key level: a sustained reclaim of $85K would weaken the immediate bearish read; failure to recover it keeps lower liquidity in play. Keep size conservative and define invalidation before entry; liquidation-driven moves can reverse quickly.
#Bitcoin #BTC #CryptoMarkets #OrderBook
$BTC ’s drop below the $84.2K–$85K liquidity cluster puts the order book in focus: after rejecting $87.3K and more than $3B in reported liquidations, the key question is whether bids absorb remaining forced supply or pull as price falls.
BTC is trading at $83,054, down 2.13% over 24 hours. Funding remains slightly positive at 0.0036%, while sentiment is still Greed at 74. That combination suggests positioning may not be fully reset, even after the wipeouts. Watch how price behaves on any retest of $84.2K–$85K: repeated offers and weak bid replenishment would favor continued drift lower; firm absorption and a reclaim could point to a leverage purge rather than a broader breakdown.
Key level: a sustained reclaim of $85K would weaken the immediate bearish read; failure to recover it keeps lower liquidity in play. Keep size conservative and define invalidation before entry; liquidation-driven moves can reverse quickly.
#Bitcoin #BTC #CryptoMarkets #OrderBook
BTC is trading at $83,054, down 2.13% over 24 hours. Funding remains slightly positive at 0.0036%, while sentiment is still Greed at 74. That combination suggests positioning may not be fully reset, even after the wipeouts. Watch how price behaves on any retest of $84.2K–$85K: repeated offers and weak bid replenishment would favor continued drift lower; firm absorption and a reclaim could point to a leverage purge rather than a broader breakdown.
Key level: a sustained reclaim of $85K would weaken the immediate bearish read; failure to recover it keeps lower liquidity in play. Keep size conservative and define invalidation before entry; liquidation-driven moves can reverse quickly.
#Bitcoin #BTC #CryptoMarkets #OrderBook
74
·
--
$BTC $ETH $SOL 30亿美元强平过后,资金费率给出了比K线更诚实的信号——BTC +0.0043%、ETH +0.0053%仍微正,SOL -0.0044%已翻负。同一场清洗,三条曲线的分化本身就是信息。
订单簿角度:强平潮会把杠杆仓位和挂单一起卷走。之后如果费率归零甚至转负、同时未平仓量(OI)大幅回落,说明市场完成了一次"减重",而不是单纯恐慌。此时盘口深度通常变薄,上下几档的挂单量比平时少,价格对边际订单更敏感——这既是机会,也是滑点陷阱。反过来,若价格反弹但OI不增、费率仍平,说明是空头回补而非新多进场,持续性存疑。
用法是逆向的:不追红绿柱子,而是看费率+OI的"重置"是否到位。当前情绪74(Greed),但资金面已中性化,属于杠杆出清后的观察窗口。$SOL今日+2.69%,是三个主流中唯一走强且费率转负的,若OI同步下降,属健康换手;若OI上升而费率转负,则是空头在加码,需警惕。
关键技术位:$BTC 84,000一线为多空分界,跌破且OI再升,说明新一轮杠杆空头进场,失效位上移至83,000下方止损参考。$ETH 2,650、$SOL 115为各自结构支撑。
风险管理:薄订单簿下用限价单、控制单笔规模,把失效位当纪律而非赌注,不因费率转负就盲目放大仓位。加密市场波动剧烈,以上仅为盘面观察,非投资建议。#BTC #FundingRate #OrderBook #LeverageReset
$BTC $ETH $SOL 30亿美元强平过后,资金费率给出了比K线更诚实的信号——BTC +0.0043%、ETH +0.0053%仍微正,SOL -0.0044%已翻负。同一场清洗,三条曲线的分化本身就是信息。
订单簿角度:强平潮会把杠杆仓位和挂单一起卷走。之后如果费率归零甚至转负、同时未平仓量(OI)大幅回落,说明市场完成了一次"减重",而不是单纯恐慌。此时盘口深度通常变薄,上下几档的挂单量比平时少,价格对边际订单更敏感——这既是机会,也是滑点陷阱。反过来,若价格反弹但OI不增、费率仍平,说明是空头回补而非新多进场,持续性存疑。
用法是逆向的:不追红绿柱子,而是看费率+OI的"重置"是否到位。当前情绪74(Greed),但资金面已中性化,属于杠杆出清后的观察窗口。$SOL 今日+2.69%,是三个主流中唯一走强且费率转负的,若OI同步下降,属健康换手;若OI上升而费率转负,则是空头在加码,需警惕。
关键技术位:$BTC 84,000一线为多空分界,跌破且OI再升,说明新一轮杠杆空头进场,失效位上移至83,000下方止损参考。$ETH 2,650、$SOL 115为各自结构支撑。
风险管理:薄订单簿下用限价单、控制单笔规模,把失效位当纪律而非赌注,不因费率转负就盲目放大仓位。加密市场波动剧烈,以上仅为盘面观察,非投资建议。#BTC #FundingRate #OrderBook #LeverageReset
订单簿角度:强平潮会把杠杆仓位和挂单一起卷走。之后如果费率归零甚至转负、同时未平仓量(OI)大幅回落,说明市场完成了一次"减重",而不是单纯恐慌。此时盘口深度通常变薄,上下几档的挂单量比平时少,价格对边际订单更敏感——这既是机会,也是滑点陷阱。反过来,若价格反弹但OI不增、费率仍平,说明是空头回补而非新多进场,持续性存疑。
用法是逆向的:不追红绿柱子,而是看费率+OI的"重置"是否到位。当前情绪74(Greed),但资金面已中性化,属于杠杆出清后的观察窗口。$SOL 今日+2.69%,是三个主流中唯一走强且费率转负的,若OI同步下降,属健康换手;若OI上升而费率转负,则是空头在加码,需警惕。
关键技术位:$BTC 84,000一线为多空分界,跌破且OI再升,说明新一轮杠杆空头进场,失效位上移至83,000下方止损参考。$ETH 2,650、$SOL 115为各自结构支撑。
风险管理:薄订单簿下用限价单、控制单笔规模,把失效位当纪律而非赌注,不因费率转负就盲目放大仓位。加密市场波动剧烈,以上仅为盘面观察,非投资建议。#BTC #FundingRate #OrderBook #LeverageReset
314


Heavy sell walls for $TLM at 0.60x. This tells me a push above the entry zone will face resistance. I plan my targets accordingly, ready to trim quickly.
🎯 $TLM QUANT SETUP 📊
💎 Entry Zone: 0.001361 - 0.001382
💎 🎯 Target 1: 0.001407
💎 🎯 Target 2: 0.001432
💎 🎯 Target 3: 0.001463
💎 🛑 Invalidation (SL): 0.001331
🔥 Deep Market Intel
💎 Order Book: Heavy Sell Walls (0.60x)
💎 1H Open Interest: Declining (-)
💎 Whales L/S: 54.0% Long
💎 Taker Flow: 0.67x 📊
#TLMScalp #OrderBook
Heavy sell walls for $TLM at 0.60x. This tells me a push above the entry zone will face resistance. I plan my targets accordingly, ready to trim quickly.
🎯 $TLM QUANT SETUP 📊
💎 Entry Zone: 0.001361 - 0.001382
💎 🎯 Target 1: 0.001407
💎 🎯 Target 2: 0.001432
💎 🎯 Target 3: 0.001463
💎 🛑 Invalidation (SL): 0.001331
🔥 Deep Market Intel
💎 Order Book: Heavy Sell Walls (0.60x)
💎 1H Open Interest: Declining (-)
💎 Whales L/S: 54.0% Long
💎 Taker Flow: 0.67x 📊
#TLMScalp #OrderBook
🎯 $TLM QUANT SETUP 📊
💎 Entry Zone: 0.001361 - 0.001382
💎 🎯 Target 1: 0.001407
💎 🎯 Target 2: 0.001432
💎 🎯 Target 3: 0.001463
💎 🛑 Invalidation (SL): 0.001331
🔥 Deep Market Intel
💎 Order Book: Heavy Sell Walls (0.60x)
💎 1H Open Interest: Declining (-)
💎 Whales L/S: 54.0% Long
💎 Taker Flow: 0.67x 📊
#TLMScalp #OrderBook
1
352
Understanding the Order Book is paramount. $ETH and $VET both show "Heavy Buy Walls," which means significant demand is waiting at lower prices, acting as a cushion. This offers a higher probability of bounces from dips. In contrast, $U 's "Balanced DOM" requires a more nimble approach, as support might not be as concentrated.
#OrderBook #MarketDepth
Understanding the Order Book is paramount. $ETH and $VET both show "Heavy Buy Walls," which means significant demand is waiting at lower prices, acting as a cushion. This offers a higher probability of bounces from dips. In contrast, $U 's "Balanced DOM" requires a more nimble approach, as support might not be as concentrated.
#OrderBook #MarketDepth
#OrderBook #MarketDepth
300

🧱 #NEX – Chart Mechanics: Visual Suppression vs. Real Market Cap (DYOR)An advanced observation regarding order book mechanics and visual chart manipulation. Have you noticed how an asset can print a long, aggressive red candle downward, yet the Market Cap metrics remain completely unchanged or even increase slightly, while the price stabilizes right at the baseline?This phenomenon reveals the exact difference between emotional market theater and cold data:The Illusion of the Red Line: When sell-side liquidity is engineered to look thin, automated algorithms can trigger localized trades far below the current bid to force the chart to draw a dramatic red line. It is a calculated tactical scare tactic. However, because the actual volume behind these micro-dumps is mathematically insignificant, the overall Market Cap barely moves.The Capital Reality: If an asset experienced this type of selling pressure at a highly inflated top, millions in valuation would vanish instantly. But at a semented macro floor, expending massive corporate resources to manipulate the visual trend fails to shift the true underlying value. The line moves, but the capital foundation stays locked.The Accumulation Framework: For disciplined participants who monitor market cap footprints rather than reacting to visual candle shapes, these engineered red streaks don't signal risk. They represent a prime, highly anticipated secondary opportunity to expand positions at the absolute bottom 🤠This update represents a personal analysis of public chart telemetry and execution theory. Every investor must conduct independent research, evaluate their own capital setup, and take full responsibility for their own decisions. Keep absolute ice in your veins. 🧊🚂#Binance #crypto #Trading #Discipline #NEX #RiskManagement #DYOR #MarketCap #OrderBook
🧱 #NEX – Chart Mechanics: Visual Suppression vs. Real Market Cap (DYOR)An advanced observation regarding order book mechanics and visual chart manipulation. Have you noticed how an asset can print a long, aggressive red candle downward, yet the Market Cap metrics remain completely unchanged or even increase slightly, while the price stabilizes right at the baseline?This phenomenon reveals the exact difference between emotional market theater and cold data:The Illusion of the Red Line: When sell-side liquidity is engineered to look thin, automated algorithms can trigger localized trades far below the current bid to force the chart to draw a dramatic red line. It is a calculated tactical scare tactic. However, because the actual volume behind these micro-dumps is mathematically insignificant, the overall Market Cap barely moves.The Capital Reality: If an asset experienced this type of selling pressure at a highly inflated top, millions in valuation would vanish instantly. But at a semented macro floor, expending massive corporate resources to manipulate the visual trend fails to shift the true underlying value. The line moves, but the capital foundation stays locked.The Accumulation Framework: For disciplined participants who monitor market cap footprints rather than reacting to visual candle shapes, these engineered red streaks don't signal risk. They represent a prime, highly anticipated secondary opportunity to expand positions at the absolute bottom 🤠This update represents a personal analysis of public chart telemetry and execution theory. Every investor must conduct independent research, evaluate their own capital setup, and take full responsibility for their own decisions. Keep absolute ice in your veins. 🧊🚂#Binance #crypto #Trading #Discipline #NEX #RiskManagement #DYOR #MarketCap #OrderBook
322
🚨 #SKYAI: Analyzing the Order Books | The Whale is Holding the Line! 🧱🐋🎬Take a close look at the recent selling activity, fam! This was absolutely not a whale dump. Instead, the data shows that the main whale is actively steping in and holding the price up right here. This major player is absorbing the selling pressure to protect our momentum.This is the exact moment where our floor needs to stand rock-solid. When the whale is fighting to maintain these levels, the community must show its strength by refusing to panic. We lock in this foundation together, creating the ultimate stability needed before the next leg up.Stay disciplined, watch the order books closely, and let the facts guide your strategy! 🌍#SKYAI #Binance #crypto #HODL #orderbook #RiskManagement
🚨 #SKYAI: Analyzing the Order Books | The Whale is Holding the Line! 🧱🐋🎬Take a close look at the recent selling activity, fam! This was absolutely not a whale dump. Instead, the data shows that the main whale is actively steping in and holding the price up right here. This major player is absorbing the selling pressure to protect our momentum.This is the exact moment where our floor needs to stand rock-solid. When the whale is fighting to maintain these levels, the community must show its strength by refusing to panic. We lock in this foundation together, creating the ultimate stability needed before the next leg up.Stay disciplined, watch the order books closely, and let the facts guide your strategy! 🌍#SKYAI #Binance #crypto #HODL #orderbook #RiskManagement
162
Connectez-vous pour découvrir plus de contenu
Rejoignez la communauté mondiale des adeptes de cryptomonnaies sur Binance Square
⚡️ Suviez les dernières informations importantes sur les cryptomonnaies.
💬 Jugé digne de confiance par la plus grande plateforme d’échange de cryptomonnaies au monde.
👍 Découvrez les connaissances que partagent les créateurs vérifiés.
Adresse e-mail/Nº de téléphone
Sujets d’actualité
1
#BinancePick
2.6M vues
141,866 mentions
2
#EarningsSeason
5M vues
24,385 mentions
3
#FranklinTempletonFilesForTwoDividendToBitcoinETFs
2,034 vues
111 mentions
4
#StrategyMSTRSurpassesNasdaqInMarketCap
2,387 vues
104 mentions
5
#CanadaProposesStablecoinRedemptionWithin3BusinessDays
103 vues
13 mentions
6
#ElectrumWalletBugLetRogueServersStealFunds
8,951 vues
240 mentions
7
#ArgentineCourtDismissesLIBRACaseAgainstMilei
19,084 vues
320 mentions
8
#SKHynixReportedlyPlansSpecialDividendFromKioxiaStakeSale
3,158 vues
48 mentions
9
#KeystoneWebsiteBreachExposesBuyersShippingAddresses
1,688 vues
41 mentions
10
#USQ3GDPAndSeptemberPCEDueNextWeek
96,688 vues
1,138 mentions