

#marketanalysis
marketanalysis
10.6M vues
65,210 mentions
Populaire
Récents

⚡ $BTC SWEEPS INTO DEMAND ZONE AS BUYERS STEP UP FOR THE NEXT LEG UP! 🚀
Entry: 78279.8 - 78351.0 ⚡
Target: 78999.2 🚀
Stop Loss: 77973.5 ⚠️
📌 Price hit the exact demand block I mapped out earlier, absorbing sell-side pressure cleanly as institutional bids take over. 🌊 With liquidity swept right at local support, momentum is building toward higher expansion levels with tight, defined risk.
💡 Order flow shows clear seller exhaustion near this key structural pivot, setting up a sharp risk-to-reward window. 💬 Are you taking the bid inside this demand zone, or waiting for full confirmation above resistance? 👇
⚠️ Not financial advice. Always manage your risk. 🛡️
🏷️ #BTC #LongSetup #Crypto #MarketAnalysis
🔥 💎
2

💥 $BTC PRESSING INTO THE CRITICAL $83,000 MAKE-OR-BREAK LIQUIDITY WALL! ⚡
Target: 90,000 🚀
Stop Loss: 75,674 ⚠️
$BTC closed out August with a fierce 25% expansion, tearing back above $80,000 on the back of falling yields and dovish Federal Reserve commentary. 📊 Institutional momentum reclaimed key moving averages, but price action has now slammed directly into a heavy supply zone at $82,000–$83,000.
A clean, decisive breakout opens the runway toward $90,000, yet historical September seasonality demands tactical patience. 💡 If sellers defend this resistance, a swift retest of underlying support at $75,674 or even $71,781 remains on the table to sweep weak hands.
💬 Are you positioning for an immediate breakout push past $83,000, or waiting for a dip to buy support lower? 👇
⚠️ Not financial advice. Always manage your risk. 🛡️
🏷️ #BTC #Crypto #MarketAnalysis #Trading
🔥 ⚡
3

·
--
$BTC
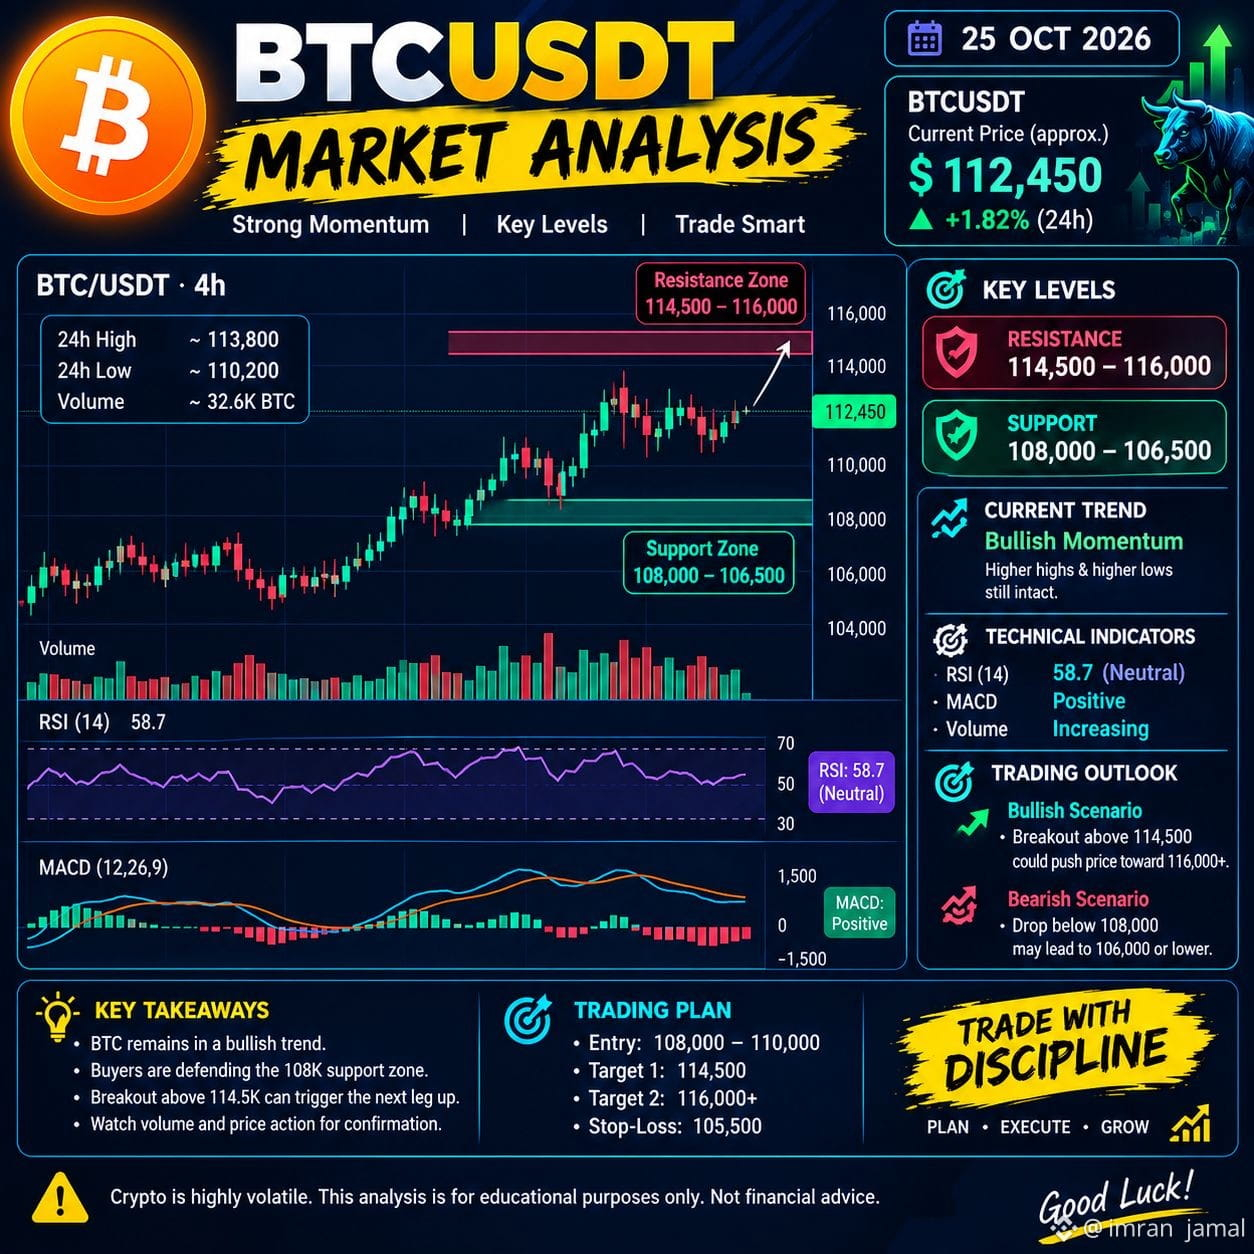
📊 BTC Market Analysis Today | October 25, 2026
₿ Bitcoin (BTC/USDT): Short-Term Bearish Pressure ⚠️
Bitcoin is trading around $80,700–$80,900 after recovering from a weekend sell-off. Short-term momentum remains weak, while the broader trend needs further confirmation. �
Coinotag +1
🔑 Key Technical Levels
Current price: ~$80,800
Resistance 1: $81,467
Resistance 2: $82,400
Support 1: $80,100
Support 2: $78,100 �
Coinotag
📈 Bullish Scenario
If BTC breaks above $81,467 and holds, a move toward $82,400 could follow.
📉 Bearish Scenario
If BTC breaks below $80,100, further downside toward $78,100 is possible.
🎯 Trading Strategy
Buy: Only after a confirmed breakout and successful retest.
Sell: Watch for a confirmed breakdown below support.
Risk management: Always use a stop-loss and avoid excessive leverage.
📰 Fundamental Factor: Traders are watching the US Federal Reserve meeting scheduled for October 27–28, which could influence Bitcoin's volatility. �
Investing.com India
⚠️ Conclusion: BTC is at a critical
#BTC☀️ #MarketAnalysis #TechnicalAnalysiss
{spot}(BTCUSDT)
$BTC
📊 BTC Market Analysis Today | October 25, 2026
₿ Bitcoin (BTC/USDT): Short-Term Bearish Pressure ⚠️
Bitcoin is trading around $80,700–$80,900 after recovering from a weekend sell-off. Short-term momentum remains weak, while the broader trend needs further confirmation. �
Coinotag +1
🔑 Key Technical Levels
Current price: ~$80,800
Resistance 1: $81,467
Resistance 2: $82,400
Support 1: $80,100
Support 2: $78,100 �
Coinotag
📈 Bullish Scenario
If BTC breaks above $81,467 and holds, a move toward $82,400 could follow.
📉 Bearish Scenario
If BTC breaks below $80,100, further downside toward $78,100 is possible.
🎯 Trading Strategy
Buy: Only after a confirmed breakout and successful retest.
Sell: Watch for a confirmed breakdown below support.
Risk management: Always use a stop-loss and avoid excessive leverage.
📰 Fundamental Factor: Traders are watching the US Federal Reserve meeting scheduled for October 27–28, which could influence Bitcoin's volatility. �
Investing.com India
⚠️ Conclusion: BTC is at a critical
#BTC☀️ #MarketAnalysis #TechnicalAnalysiss
36

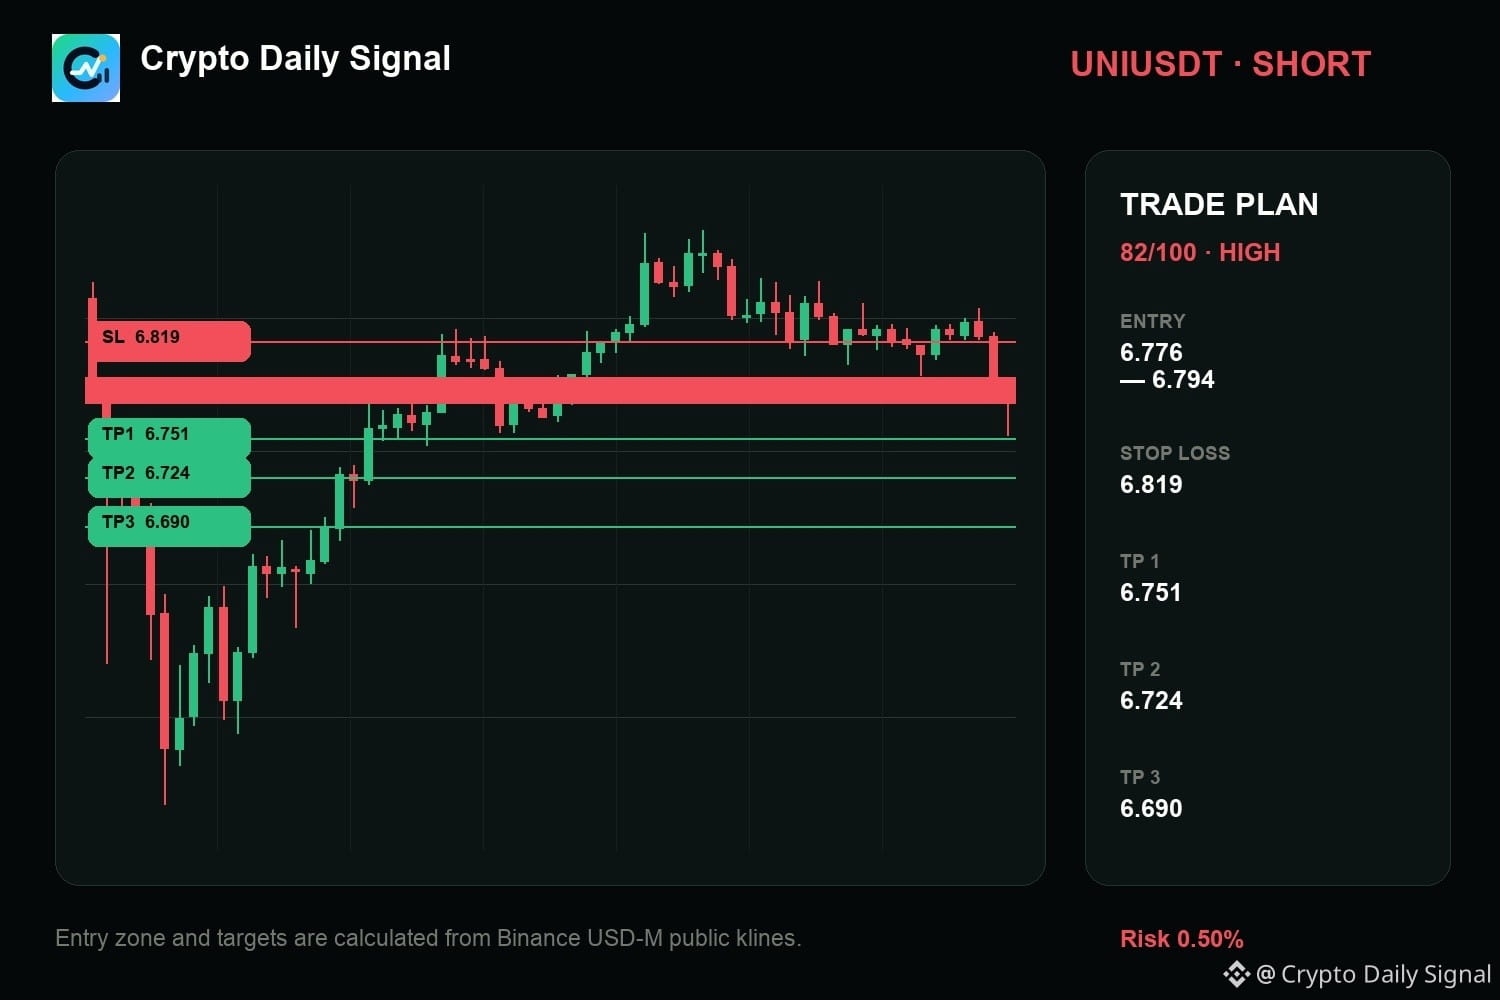
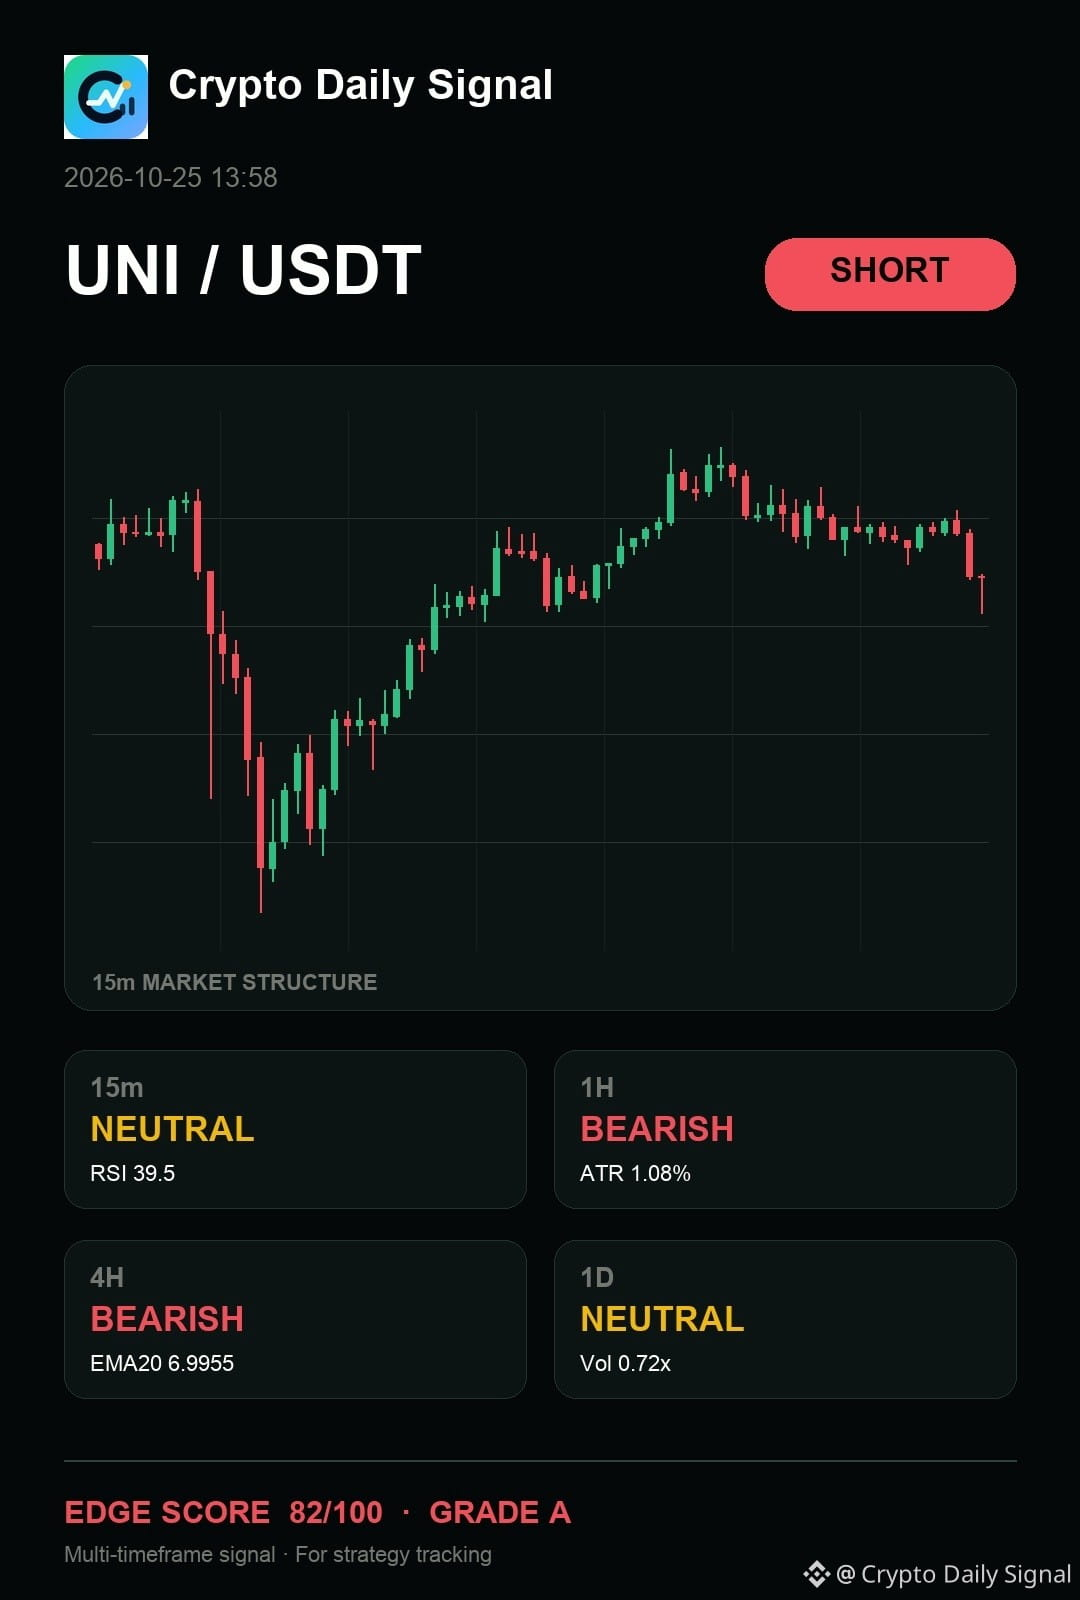
$UNI keeps me focused on the downside response as the tight range shows clear rejection at the upper boundary. The higher timeframes suggest bearish pressure despite the daily backdrop remaining neutral. For this to hold as a short, I need to see a decisive close below the range's low. A strong push over the recent local high would change my mind.
Worth tracking from here, or does the range still need more time?
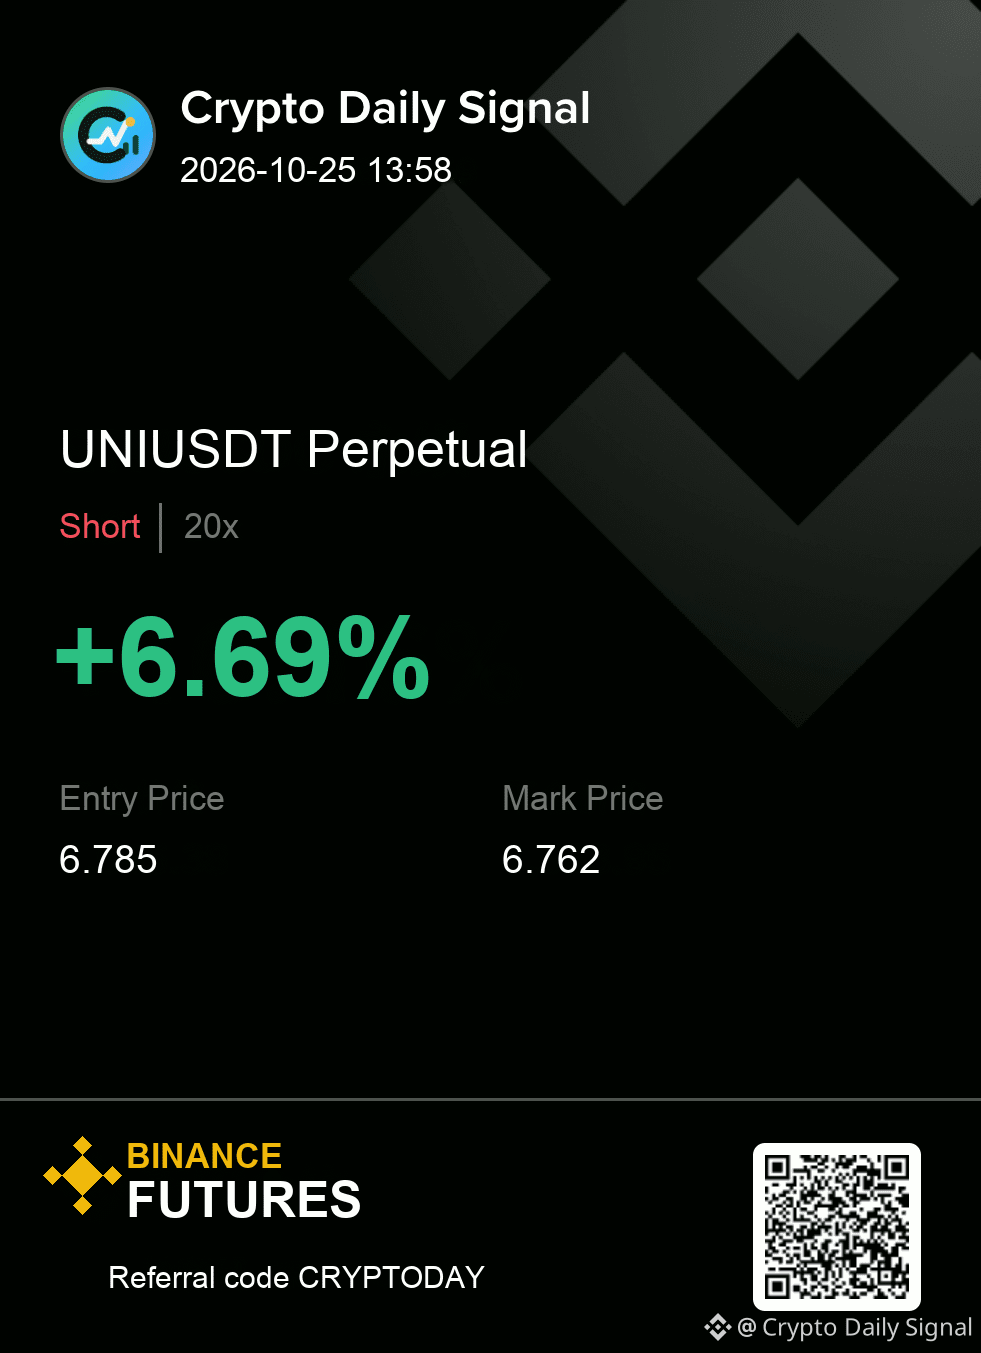
UNIUSDT SHORT map
Entry → 6.776 - 6.794
SL → 6.819
TP → 6.751 · 6.724 · 6.690
#MarketAnalysis
{future}(UNIUSDT)
$UNI keeps me focused on the downside response as the tight range shows clear rejection at the upper boundary. The higher timeframes suggest bearish pressure despite the daily backdrop remaining neutral. For this to hold as a short, I need to see a decisive close below the range's low. A strong push over the recent local high would change my mind.
Worth tracking from here, or does the range still need more time?
UNIUSDT SHORT map
Entry → 6.776 - 6.794
SL → 6.819
TP → 6.751 · 6.724 · 6.690
#MarketAnalysis
Worth tracking from here, or does the range still need more time?
UNIUSDT SHORT map
Entry → 6.776 - 6.794
SL → 6.819
TP → 6.751 · 6.724 · 6.690
#MarketAnalysis
10

·
--
Haussier
🚀 $ORDER — The Next $IRYS -Style Move?
IRYS showed how quickly momentum can build. Now ORDER is catching attention:
📈 +160.61% in 24H
💰 Price: $0.08309
📊 24H Volume: $129.9M
🔥 Open Interest rising alongside price
🧲 Liquidity building around key levels
But here’s the catch 👀
Funding is deeply negative (-0.8353%), while price keeps pushing higher. That can create squeeze potential — but also means volatility is extreme.
The question now: Can $ORDER sustain this momentum, or will profit-taking hit after the sharp rally?
Watching price action, volume, and liquidity before making any move. No chasing green candles.
#ORDERUSDT #İRYS #Irys #Altcoins #MarketAnalysis
451

·
--
Haussier
#metrics #bitcoin #MarketAnalysis
📉 $BTC Market Analysis: Local Correction or Reversal?
Bitcoin tested the zone above $85,000–$86,000 before correcting to the $81,000–$82,000 range. What is happening under the hood of the market right now? Key metrics from Coinglass:
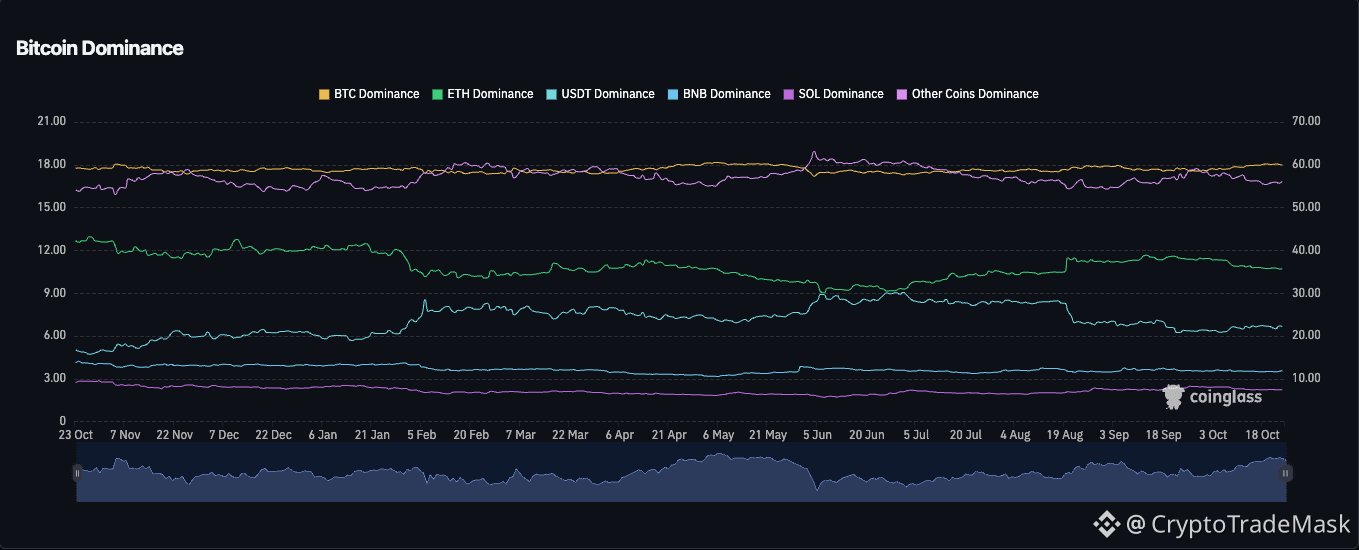
➡️ BTC Dominance: Remains at a consistently high level (around 58–60%). Capital is concentrated in the leading cryptocurrency; there is no "altseason" at the moment.
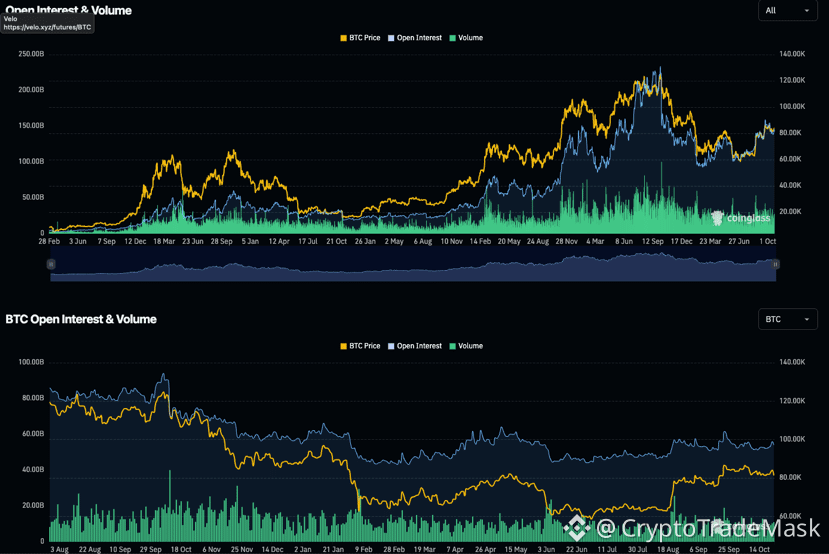
➡️ Open Interest: Following a sharp price drop, we are seeing a mass closure of positions and a decline in speculative appetite. This represents a healthy "cleansing" of the market, removing excessive leverage.
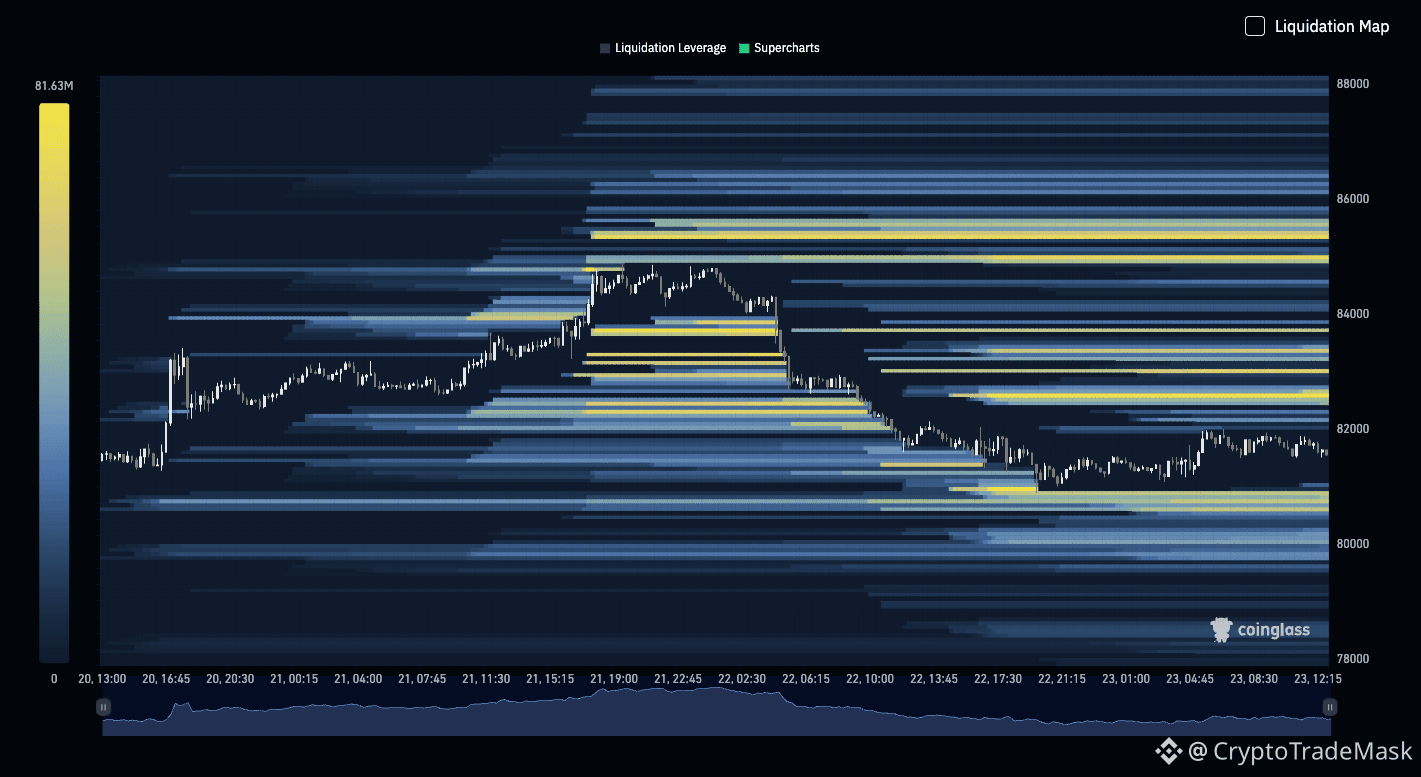
➡️ Liquidation Map: The price is actively sweeping liquidity via stop-loss orders. Currently, major clusters of interest are concentrated lower, near $80,000, and higher, in the $84,000–$85,500 zone.
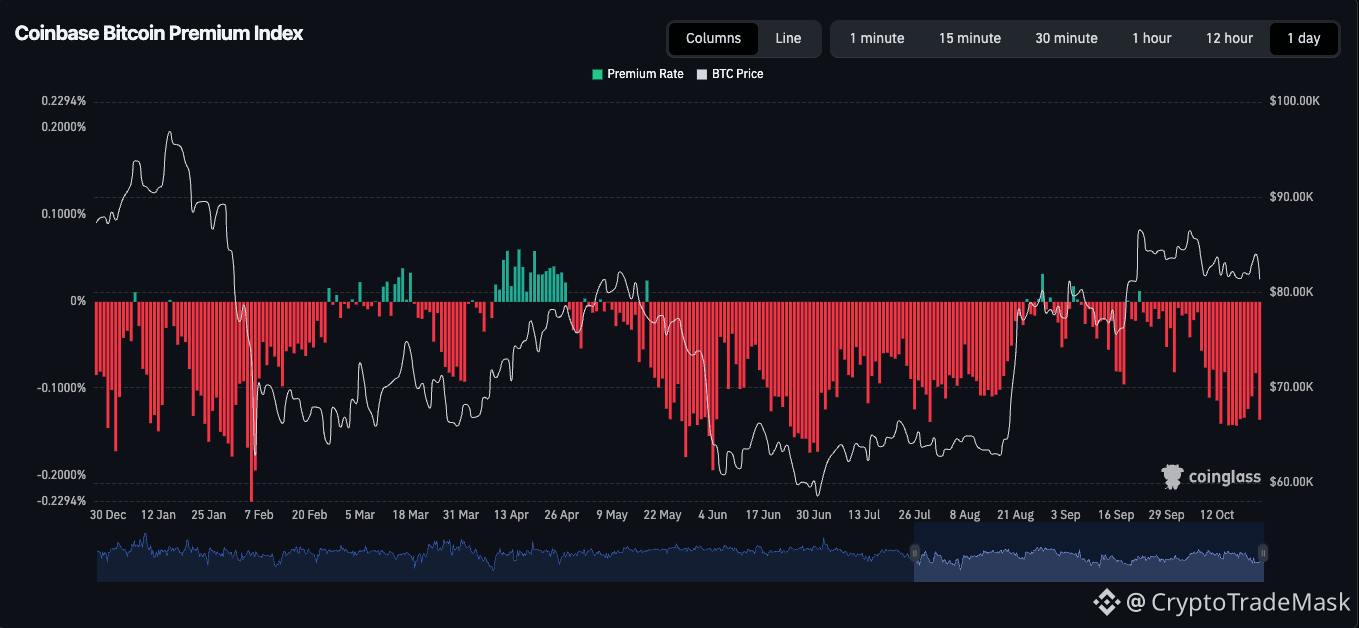
➡️ Coinbase Premium: This indicator is in the red zone, signaling a lack of aggressive institutional demand from the U.S. spot market at this stage.
🎯 Conclusion:
We are witnessing a healthy phase of consolidation and a cooling-off period.
Key Support: $80,000 – $81,000 (holding this level is critical for the trend).
Resistance Zone: $84,000 – $85,500 (a breakout here would pave the way for new local highs).
⚠️ Tip: Due to weak institutional demand and instability, one should exercise caution when opening high-leverage long positions. We are waiting to see the reaction at key levels.
Lyle Cohan qlSv:
🚨🚨لا تفتح صعود ، لقد فاتتك فتح صفقة بيع من 84,800 ، استعد لفتح صفقة بيع على المكشوف من مستوى 83,000 ، الايام القادمه سوف تشاهد البيتكوين عند 74,000 لا تجعل الفرصه الاخيره تضيع منك ، استعد للهبوط
2
57

🎯 Bitcoin Consolidates Above $81.5K: Solana ($SOL) Holding Key Demand Zone!
Good afternoon, Traders! 🔍
Bitcoin ($BTC ) is holding firm in the $81,300–$82,000 range, keeping broader market volatility compressed. Historically, sideways BTC price action near range lows creates strategic entry setups for key Layer-1 ecosystems.
Solana ($SOL ) is testing key demand retest levels in the $102–$105 corridor, presenting high probability swing setups for disciplined traders.
📊 Market Key Observations:
1️⃣ BTC Range: $81,300 - $82,000
2️⃣ SOL Retest Zone: $102 - $105
3️⃣ Strategy: Focus on confirmed 1H candle retests; avoid impulse trades.
💬 Question: Which altcoin structure is looking cleanest on your 4H chart today? Drop your picks! 👇
{future}(BTCUSDT)
{future}(SOLUSDT)
#bitcoin #Solana #CryptoNews #MarketAnalysis #BinanceSquare
🎯 Bitcoin Consolidates Above $81.5K: Solana ($SOL ) Holding Key Demand Zone!
Good afternoon, Traders! 🔍
Bitcoin ($BTC ) is holding firm in the $81,300–$82,000 range, keeping broader market volatility compressed. Historically, sideways BTC price action near range lows creates strategic entry setups for key Layer-1 ecosystems.
Solana ($SOL ) is testing key demand retest levels in the $102–$105 corridor, presenting high probability swing setups for disciplined traders.
📊 Market Key Observations:
1️⃣ BTC Range: $81,300 - $82,000
2️⃣ SOL Retest Zone: $102 - $105
3️⃣ Strategy: Focus on confirmed 1H candle retests; avoid impulse trades.
💬 Question: Which altcoin structure is looking cleanest on your 4H chart today? Drop your picks! 👇
#bitcoin #Solana #CryptoNews #MarketAnalysis #BinanceSquare

50

·
--
Haussier
🚨 CRYPTO MARKET ALERT: THE NEXT BIG MOVE COULD SURPRISE EVERYONE! 📈🔥
🐂 BULLS OR BEARS? WHO WILL WIN THE NEXT BATTLE? 🐻
The crypto market is full of opportunities, but one wrong move can change everything. 👀
🔍 My Market Outlook:
🟢 If BTC breaks above a key resistance with strong volume, we could see a powerful bullish move across the market.
🔴 If BTC loses key support, expect increased volatility and possible downside for altcoins.
⚡ Coins on My Watchlist:
₿ BTC — Market direction
💎 ETH — Altcoin momentum
🚀 XRP — Breakout potential
🔥 SOL — Momentum watch
🎯 My prediction: The next major move will depend on Bitcoin's breakout or breakdown. Don't blindly chase green candles—watch volume, support, and resistance.
💬 LET'S TEST YOUR MARKET INSTINCTS!
Where do you think BTC is heading next?
🐂 BULLISH — New highs incoming!
🐻 BEARISH — A correction is coming!
🦀 SIDEWAYS — More consolidation first!
👇 COMMENT YOUR BTC TARGET BELOW! Let's see which side gets it right.
$
♻️ Share this with a trader who needs to see it!
⚠️ Crypto is highly volatile. This is market speculation, not financial advice. Always DYOR.
#bitcoin #BinanceSquare #altcoins #cryptotrading #MarketAnalysis

53

·
--
#KOSPISinks3.52%ToLowestCloseSinceApril 📉 **KOSPI SINKS 3.52% — LOWEST CLOSE SINCE APRIL! 🇰🇷**
South Korea's benchmark KOSPI index faced another major sell-off on October 22, 2026.
📊 **MARKET SNAPSHOT**
🔻 Closing level: 5,533.77
🔻 Daily loss: 3.52%
🔻 Points lost: 201.89
📉 Lowest close since April 7, 2026
**🔥 WHAT IS DRIVING THE SELL-OFF?**
1️⃣ **AI Investment Concerns:** Investors are questioning whether massive AI infrastructure spending can deliver sufficient returns.
2️⃣ **Semiconductor Weakness:** Samsung Electronics fell 4.03%, while SK hynix declined 5.49%.
3️⃣ **Weak Market Demand:** Reduced buying power has made the market more vulnerable to selling pressure.
4️⃣ **Interest-Rate Uncertainty:** Concerns about future monetary tightening are adding pressure to growth stocks.
**📈 BULLISH SCENARIO**
A sustained recovery above 5,600 could improve sentiment. A move toward 5,700–5,735 would be worth monitoring if buying momentum strengthens.
**📉 BEARISH SCENARIO**
If the index breaks below the psychological 5,500 level and fails to recover, further downside risk could emerge.
These levels are monitoring zones, not confirmed technical signals.
**🎯 MY MARKET VIEW**
The KOSPI remains under pressure, especially as investors reassess semiconductor valuations and the profitability of AI spending. The next direction may depend on foreign investor flows, chip-sector performance and interest-rate expectations.
⚠️ **RISK DISCLAIMER:** This post is for educational purposes only, not financial advice. Markets can move sharply in either direction. Always conduct your own research before investing.
What do you think? 🇰🇷
**Is this a buying opportunity or the beginning of another bearish move?**
#KOSPISinks352Percent #KOSPI #SouthKorea #StockMarket #SamsungElectronics #SKHynix #AIStocks #MarketAnalysis
43

$XAU
{future}(XAUUSDT)
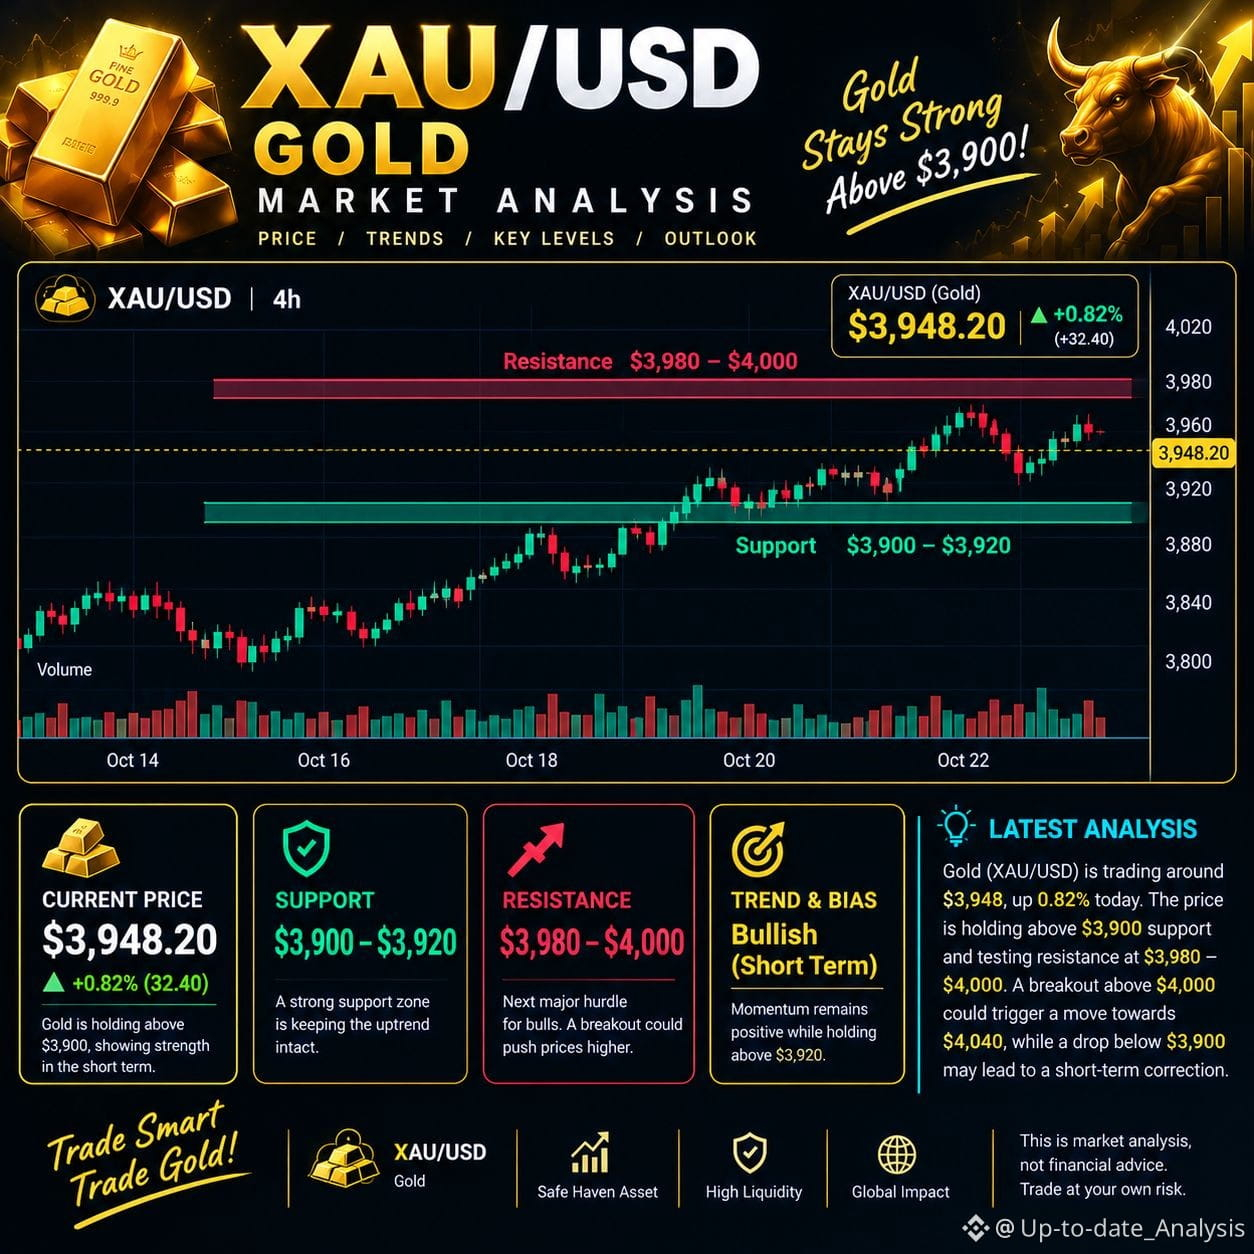
🥇 XAU/USD — Latest Gold Market Analysis
📉 Gold is facing selling pressure, trading near $4,116/oz on October 22. Key support lies at $4,104–$4,113, while resistance stands at $4,150–$4,159. A breakout above resistance could spark a recovery, but a breakdown below support may extend the decline.
📊 Trend: Short-term bearish
🎯 Watch: Support reaction and resistance breakout
⚠️ Confirm live price action before trading.
#XAU #Gold #XAUUSD #KOSPISinks3.52%ToLowestCloseSinceApril #MarketAnalysis
$XAU
🥇 XAU/USD — Latest Gold Market Analysis
📉 Gold is facing selling pressure, trading near $4,116/oz on October 22. Key support lies at $4,104–$4,113, while resistance stands at $4,150–$4,159. A breakout above resistance could spark a recovery, but a breakdown below support may extend the decline.
📊 Trend: Short-term bearish
🎯 Watch: Support reaction and resistance breakout
⚠️ Confirm live price action before trading.
#XAU #Gold #XAUUSD #KOSPISinks3.52%ToLowestCloseSinceApril #MarketAnalysis
49
🎯 Bitcoin Consolidates At $82.7K: Solana ($SOL) Holding Key Demand!
Good afternoon, Traders! 🔍
Bitcoin ($BTC ) continues to trade steadily in the $82,000–$83,000 corridor, keeping market volatility tightly compressed.
Meanwhile, Solana ($SOL ) is defending the critical $102–$105 retest region. As BTC dominance holds flat, major Layer-1 ecosystems are setting up high-probability swing retests for disciplined traders.
📊 Market Key Observations:
1️⃣ BTC Range: $82,000 - $83,000
2️⃣ SOL Retest Zone: $102 - $106
3️⃣ Strategy: Focus on confirmed 1H breakout retests; avoid chasing green pumps.
💬 Question: Which altcoin structure looks cleanest on your charts today? Drop your picks below! 👇
{future}(BTCUSDT)
{future}(SOLUSDT)
#bitcoin #solana #CryptoNews #MarketAnalysis #BinanceSquare
🎯 Bitcoin Consolidates At $82.7K: Solana ($SOL ) Holding Key Demand!
Good afternoon, Traders! 🔍
Bitcoin ($BTC ) continues to trade steadily in the $82,000–$83,000 corridor, keeping market volatility tightly compressed.
Meanwhile, Solana ($SOL ) is defending the critical $102–$105 retest region. As BTC dominance holds flat, major Layer-1 ecosystems are setting up high-probability swing retests for disciplined traders.
📊 Market Key Observations:
1️⃣ BTC Range: $82,000 - $83,000
2️⃣ SOL Retest Zone: $102 - $106
3️⃣ Strategy: Focus on confirmed 1H breakout retests; avoid chasing green pumps.
💬 Question: Which altcoin structure looks cleanest on your charts today? Drop your picks below! 👇
#bitcoin #solana #CryptoNews #MarketAnalysis #BinanceSquare

94

Рынок под давлением: 15/20 пар снижаются | BTC +0.11%📊 ЕЖЕДНЕВНЫЙ АНАЛИЗ КРИПТОРЫНКА | 22.10.2026 10:00 (UTC+5)
Снижение преобладает: 15 из 20 выбранных пар в минусе. BTC +0.11%, ETH +0.10% за 24 часа. Это срез рынка, а не готовый сигнал на сделку.
🔎 ШИРИНА РЫНКА
В выборке из 20 выбранных USDT-пар 5 активов растут, 15 снижаются, 0 почти не изменились. Снижение преобладает. Это описывает только данную выборку, а не весь крипторынок.
Простое среднее изменение составляет -0.97%. Если учитывать вес каждой пары по её 24-часовому обороту, показатель равен +0.02%. Эти метрики отвечают на разные вопросы: простое среднее считает все пары одинаково, а взвешенное сильнее учитывает активы с большим оборотом.
₿ BTC И ETH — ОСНОВНЫЕ ОРИЕНТИРЫ
• BTC: 82,909.99 USDT (+0.11% за 24 часа).
• ETH: 2,447.50 USDT (+0.10% за 24 часа).
Динамика этих двух активов помогает оценить общий фон, но не гарантирует одинакового движения альткоинов.
📈 СИЛЬНЕЕ ВЫБОРКИ
• NEAR: +1.32% за 24 часа.
• XRP: +1.15% за 24 часа.
• ETC: +0.25% за 24 часа.
📉 СЛАБЕЕ ВЫБОРКИ
• APT: -3.67% за 24 часа.
• UNI: -3.45% за 24 часа.
• DOT: -2.76% за 24 часа.
💧 ЛИДЕРЫ ПО 24-ЧАСОВОМУ ОБОРОТУ
• BTC: оборот 1,654,361,180 USDT; изменение +0.11%.
• ETH: оборот 887,543,328 USDT; изменение +0.10%.
• SOL: оборот 215,932,560 USDT; изменение -0.27%.
🧭 НА ЧТО СМОТРЕТЬ ДАЛЬШЕ
Один срез за 24 часа не подтверждает разворот. Для оценки стабилизации нужно следить, замедляется ли снижение, перестают ли обновляться минимумы, формируется ли более высокий минимум и пробивается ли ближайший локальный максимум. Дополнительный контекст дают объём торгов и поведение BTC и ETH. Эти признаки следует оценивать вместе, а не по отдельности.
🎯 ИТОГ
На момент среза: снижение преобладает. Сохраняйте осторожность и проверяйте подтверждения на графике — это не готовый сигнал на покупку или продажу. Следующие данные могут изменить картину.
Источник: публичный Binance Spot API, 24-часовые тикеры. Данные относятся к указанному времени и быстро меняются. Материал информационный, не финансовая рекомендация. Всегда учитывайте риск.
💬 Какой признак стабилизации вы проверите первым: серию более высоких минимумов BTC или рост объёма на отскоке?
#BinanceSquare #BTC #ETH #Crypto #MarketAnalysis
Рынок под давлением: 15/20 пар снижаются | BTC +0.11%
📊 ЕЖЕДНЕВНЫЙ АНАЛИЗ КРИПТОРЫНКА | 22.10.2026 10:00 (UTC+5)
Снижение преобладает: 15 из 20 выбранных пар в минусе. BTC +0.11%, ETH +0.10% за 24 часа. Это срез рынка, а не готовый сигнал на сделку.
🔎 ШИРИНА РЫНКА
В выборке из 20 выбранных USDT-пар 5 активов растут, 15 снижаются, 0 почти не изменились. Снижение преобладает. Это описывает только данную выборку, а не весь крипторынок.
Простое среднее изменение составляет -0.97%. Если учитывать вес каждой пары по её 24-часовому обороту, показатель равен +0.02%. Эти метрики отвечают на разные вопросы: простое среднее считает все пары одинаково, а взвешенное сильнее учитывает активы с большим оборотом.
₿ BTC И ETH — ОСНОВНЫЕ ОРИЕНТИРЫ
• BTC: 82,909.99 USDT (+0.11% за 24 часа).
• ETH: 2,447.50 USDT (+0.10% за 24 часа).
Динамика этих двух активов помогает оценить общий фон, но не гарантирует одинакового движения альткоинов.
📈 СИЛЬНЕЕ ВЫБОРКИ
• NEAR: +1.32% за 24 часа.
• XRP: +1.15% за 24 часа.
• ETC: +0.25% за 24 часа.
📉 СЛАБЕЕ ВЫБОРКИ
• APT: -3.67% за 24 часа.
• UNI: -3.45% за 24 часа.
• DOT: -2.76% за 24 часа.
💧 ЛИДЕРЫ ПО 24-ЧАСОВОМУ ОБОРОТУ
• BTC: оборот 1,654,361,180 USDT; изменение +0.11%.
• ETH: оборот 887,543,328 USDT; изменение +0.10%.
• SOL: оборот 215,932,560 USDT; изменение -0.27%.
🧭 НА ЧТО СМОТРЕТЬ ДАЛЬШЕ
Один срез за 24 часа не подтверждает разворот. Для оценки стабилизации нужно следить, замедляется ли снижение, перестают ли обновляться минимумы, формируется ли более высокий минимум и пробивается ли ближайший локальный максимум. Дополнительный контекст дают объём торгов и поведение BTC и ETH. Эти признаки следует оценивать вместе, а не по отдельности.
🎯 ИТОГ
На момент среза: снижение преобладает. Сохраняйте осторожность и проверяйте подтверждения на графике — это не готовый сигнал на покупку или продажу. Следующие данные могут изменить картину.
Источник: публичный Binance Spot API, 24-часовые тикеры. Данные относятся к указанному времени и быстро меняются. Материал информационный, не финансовая рекомендация. Всегда учитывайте риск.
💬 Какой признак стабилизации вы проверите первым: серию более высоких минимумов BTC или рост объёма на отскоке?
#BinanceSquare #BTC #ETH #Crypto #MarketAnalysis
107
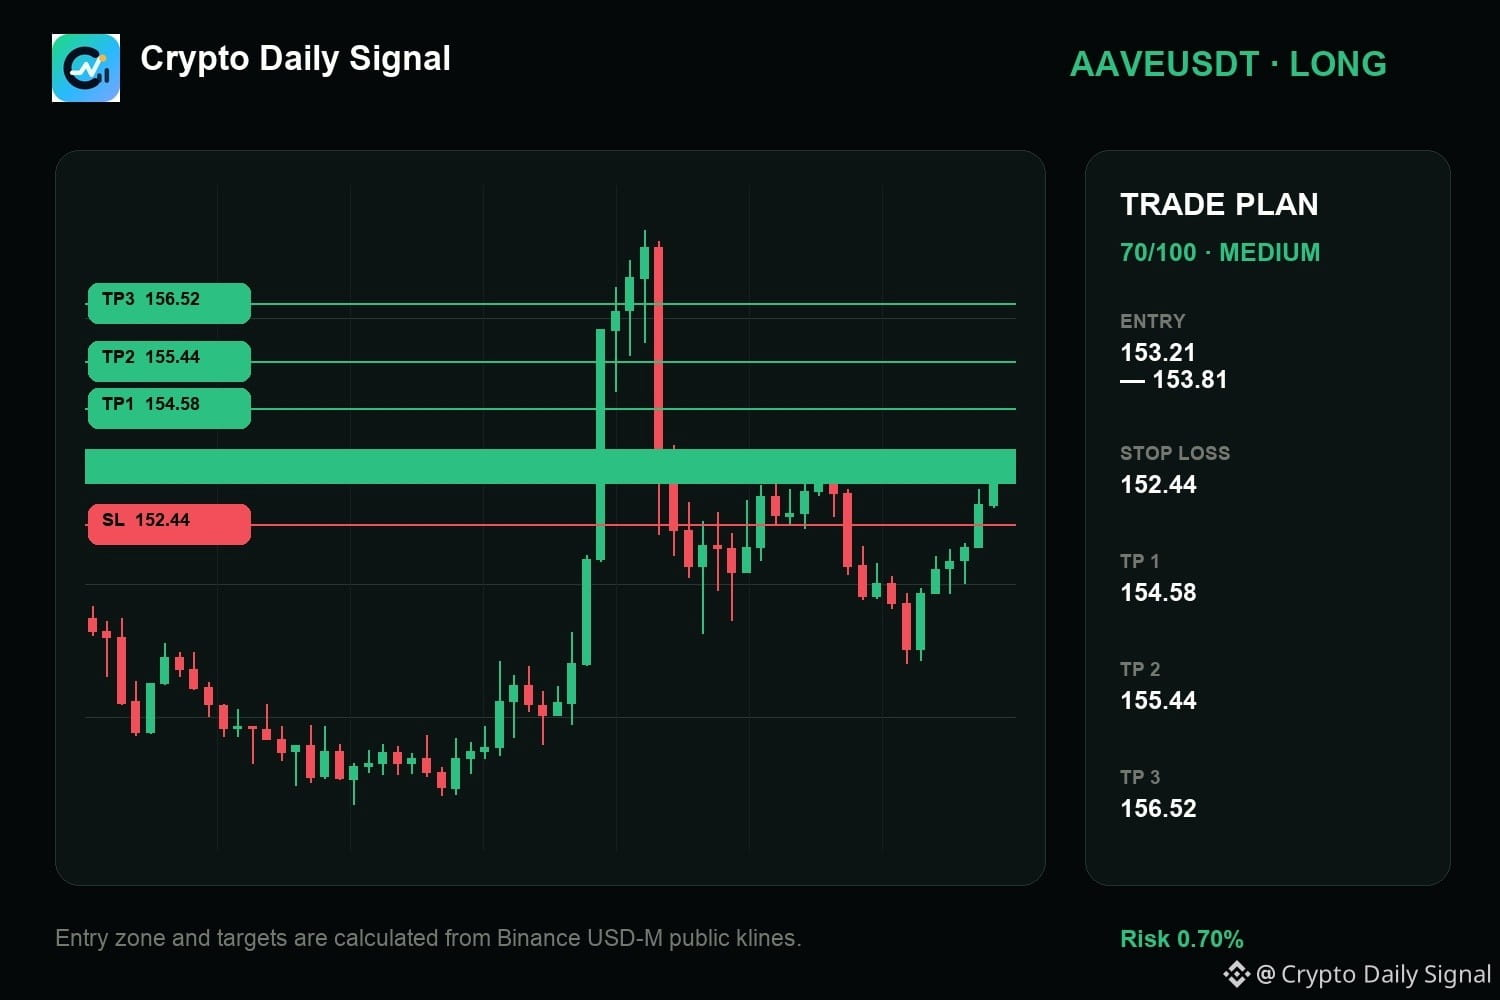
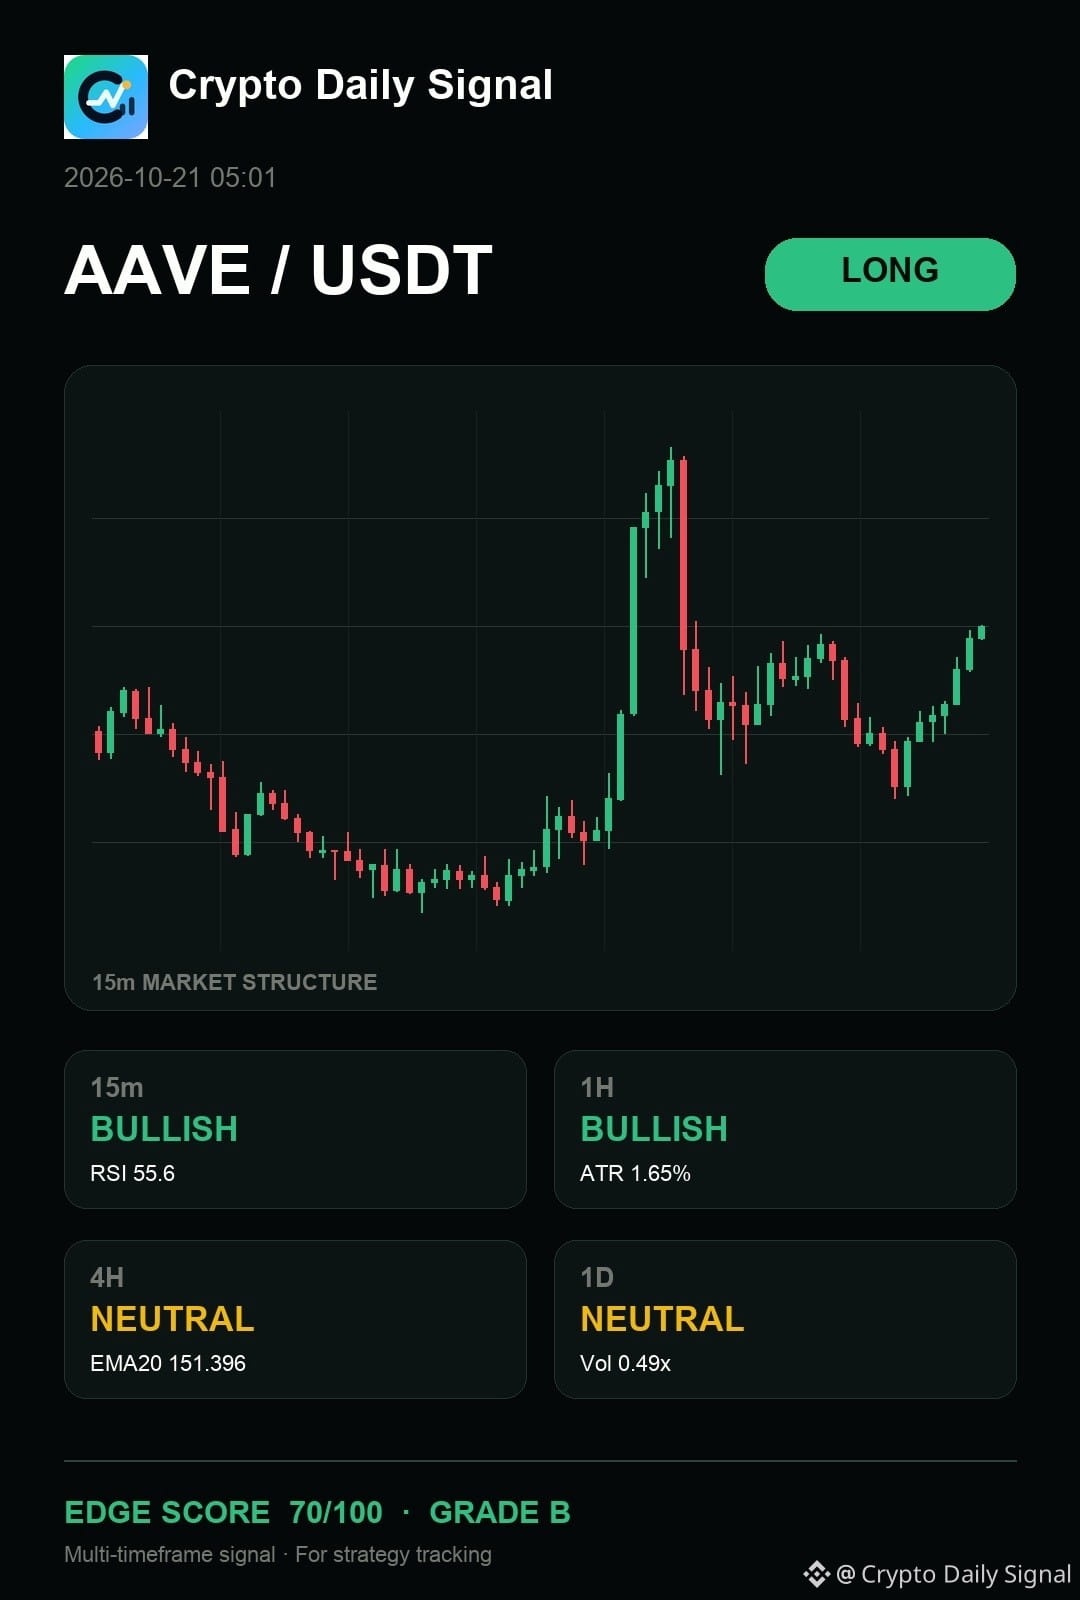
$AAVE has my attention on the buy side because the price is holding above the recent range floor, keeping the immediate bias on the upside. We're seeing a steady build of higher lows on the short-term timeframe. The idea gets stronger if we see a confirmed close above that recent local peak; a close below the established floor would immediately kill the setup.
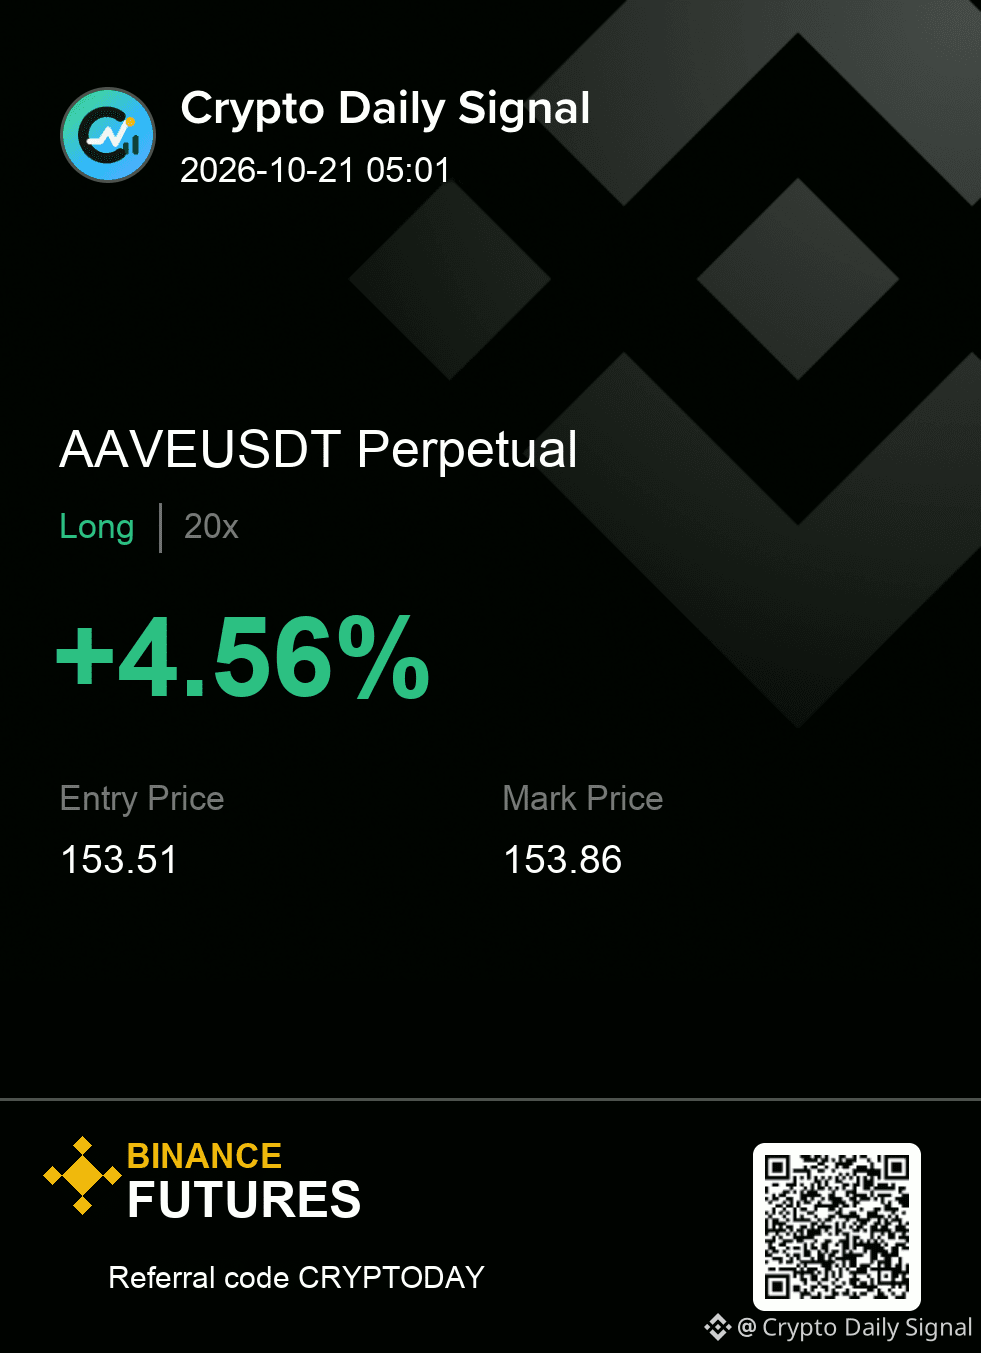
LONG plan for AAVEUSDT
153.21 - 153.81 entry | 152.44 stop
154.58 → 155.44 → 156.52
#MarketAnalysis
{future}(AAVEUSDT)
$AAVE has my attention on the buy side because the price is holding above the recent range floor, keeping the immediate bias on the upside. We're seeing a steady build of higher lows on the short-term timeframe. The idea gets stronger if we see a confirmed close above that recent local peak; a close below the established floor would immediately kill the setup.
LONG plan for AAVEUSDT
153.21 - 153.81 entry | 152.44 stop
154.58 → 155.44 → 156.52
#MarketAnalysis
LONG plan for AAVEUSDT
153.21 - 153.81 entry | 152.44 stop
154.58 → 155.44 → 156.52
#MarketAnalysis
19

·
--
🚨 CRYPTO MARKET UPDATE — OCTOBER 20, 2026 📉
🐻 BTC Under Pressure! Is a Rebound Coming?
Bitcoin slipped below $82,000 as rising oil prices and uncertainty around the Federal Reserve outlook weighed on market sentiment.
📊 Key Market Signals:
🔹 BTC is struggling to maintain bullish momentum.
🔹 ETH and major altcoins are also facing selling pressure.
🔹 Traders are watching the Fed meeting on October 27–28.
🔹 A strong BTC recovery could support altcoins, while further weakness may trigger more volatility.
🎯 My Market View: Stay cautious, watch key support and resistance levels, and wait for confirmation before entering a trade.
⚠️ Don't FOMO. Manage your risk and protect your capital.
What’s next for BTC? 🚀 Bullish rebound or another dip? 👇
#Crypto #Bitcoin #BTC #BinanceSquare #MarketAnalysis

67
Рынок шире растёт: 18/20 пар в плюсе | BTC +0.88%📊 ЕЖЕДНЕВНЫЙ АНАЛИЗ КРИПТОРЫНКА | 21.10.2026 10:00 (UTC+5)
Рост охватывает больше выбранных пар: 18 из 20 в плюсе. BTC +0.88%, ETH +1.36% за 24 часа. Проверим, подтверждается ли движение объёмом.
🔎 ШИРИНА РЫНКА
В выборке из 20 выбранных USDT-пар 18 активов растут, 2 снижаются, 0 почти не изменились. Рост преобладает. Это описывает только данную выборку, а не весь крипторынок.
Простое среднее изменение составляет +1.93%. Если учитывать вес каждой пары по её 24-часовому обороту, показатель равен +1.43%. Эти метрики отвечают на разные вопросы: простое среднее считает все пары одинаково, а взвешенное сильнее учитывает активы с большим оборотом.
₿ BTC И ETH — ОСНОВНЫЕ ОРИЕНТИРЫ
• BTC: 82,816.01 USDT (+0.88% за 24 часа).
• ETH: 2,445.15 USDT (+1.36% за 24 часа).
Динамика этих двух активов помогает оценить общий фон, но не гарантирует одинакового движения альткоинов.
📈 СИЛЬНЕЕ ВЫБОРКИ
• APT: +7.37% за 24 часа.
• NEAR: +4.43% за 24 часа.
• UNI: +2.60% за 24 часа.
📉 СЛАБЕЕ ВЫБОРКИ
• ATOM: -1.47% за 24 часа.
• TRX: -0.12% за 24 часа.
💧 ЛИДЕРЫ ПО 24-ЧАСОВОМУ ОБОРОТУ
• BTC: оборот 1,087,337,738 USDT; изменение +0.88%.
• ETH: оборот 578,928,213 USDT; изменение +1.36%.
• SOL: оборот 212,408,003 USDT; изменение +0.62%.
🧭 НА ЧТО СМОТРЕТЬ ДАЛЬШЕ
Один срез за 24 часа не подтверждает разворот. Для оценки стабилизации нужно следить, замедляется ли снижение, перестают ли обновляться минимумы, формируется ли более высокий минимум и пробивается ли ближайший локальный максимум. Дополнительный контекст дают объём торгов и поведение BTC и ETH. Эти признаки следует оценивать вместе, а не по отдельности.
🎯 ИТОГ
На момент среза: рост преобладает. Сохраняйте осторожность и проверяйте подтверждения на графике — это не готовый сигнал на покупку или продажу. Следующие данные могут изменить картину.
Источник: публичный Binance Spot API, 24-часовые тикеры. Данные относятся к указанному времени и быстро меняются. Материал информационный, не финансовая рекомендация. Всегда учитывайте риск.
💬 Что для вас подтвердит продолжение роста: удержание BTC или увеличение объёма у альткоинов?
#BinanceSquare #BTC #ETH #Crypto #MarketAnalysis
Рынок шире растёт: 18/20 пар в плюсе | BTC +0.88%
📊 ЕЖЕДНЕВНЫЙ АНАЛИЗ КРИПТОРЫНКА | 21.10.2026 10:00 (UTC+5)
Рост охватывает больше выбранных пар: 18 из 20 в плюсе. BTC +0.88%, ETH +1.36% за 24 часа. Проверим, подтверждается ли движение объёмом.
🔎 ШИРИНА РЫНКА
В выборке из 20 выбранных USDT-пар 18 активов растут, 2 снижаются, 0 почти не изменились. Рост преобладает. Это описывает только данную выборку, а не весь крипторынок.
Простое среднее изменение составляет +1.93%. Если учитывать вес каждой пары по её 24-часовому обороту, показатель равен +1.43%. Эти метрики отвечают на разные вопросы: простое среднее считает все пары одинаково, а взвешенное сильнее учитывает активы с большим оборотом.
₿ BTC И ETH — ОСНОВНЫЕ ОРИЕНТИРЫ
• BTC: 82,816.01 USDT (+0.88% за 24 часа).
• ETH: 2,445.15 USDT (+1.36% за 24 часа).
Динамика этих двух активов помогает оценить общий фон, но не гарантирует одинакового движения альткоинов.
📈 СИЛЬНЕЕ ВЫБОРКИ
• APT: +7.37% за 24 часа.
• NEAR: +4.43% за 24 часа.
• UNI: +2.60% за 24 часа.
📉 СЛАБЕЕ ВЫБОРКИ
• ATOM: -1.47% за 24 часа.
• TRX: -0.12% за 24 часа.
💧 ЛИДЕРЫ ПО 24-ЧАСОВОМУ ОБОРОТУ
• BTC: оборот 1,087,337,738 USDT; изменение +0.88%.
• ETH: оборот 578,928,213 USDT; изменение +1.36%.
• SOL: оборот 212,408,003 USDT; изменение +0.62%.
🧭 НА ЧТО СМОТРЕТЬ ДАЛЬШЕ
Один срез за 24 часа не подтверждает разворот. Для оценки стабилизации нужно следить, замедляется ли снижение, перестают ли обновляться минимумы, формируется ли более высокий минимум и пробивается ли ближайший локальный максимум. Дополнительный контекст дают объём торгов и поведение BTC и ETH. Эти признаки следует оценивать вместе, а не по отдельности.
🎯 ИТОГ
На момент среза: рост преобладает. Сохраняйте осторожность и проверяйте подтверждения на графике — это не готовый сигнал на покупку или продажу. Следующие данные могут изменить картину.
Источник: публичный Binance Spot API, 24-часовые тикеры. Данные относятся к указанному времени и быстро меняются. Материал информационный, не финансовая рекомендация. Всегда учитывайте риск.
💬 Что для вас подтвердит продолжение роста: удержание BTC или увеличение объёма у альткоинов?
#BinanceSquare #BTC #ETH #Crypto #MarketAnalysis
98

·
--
Baissier
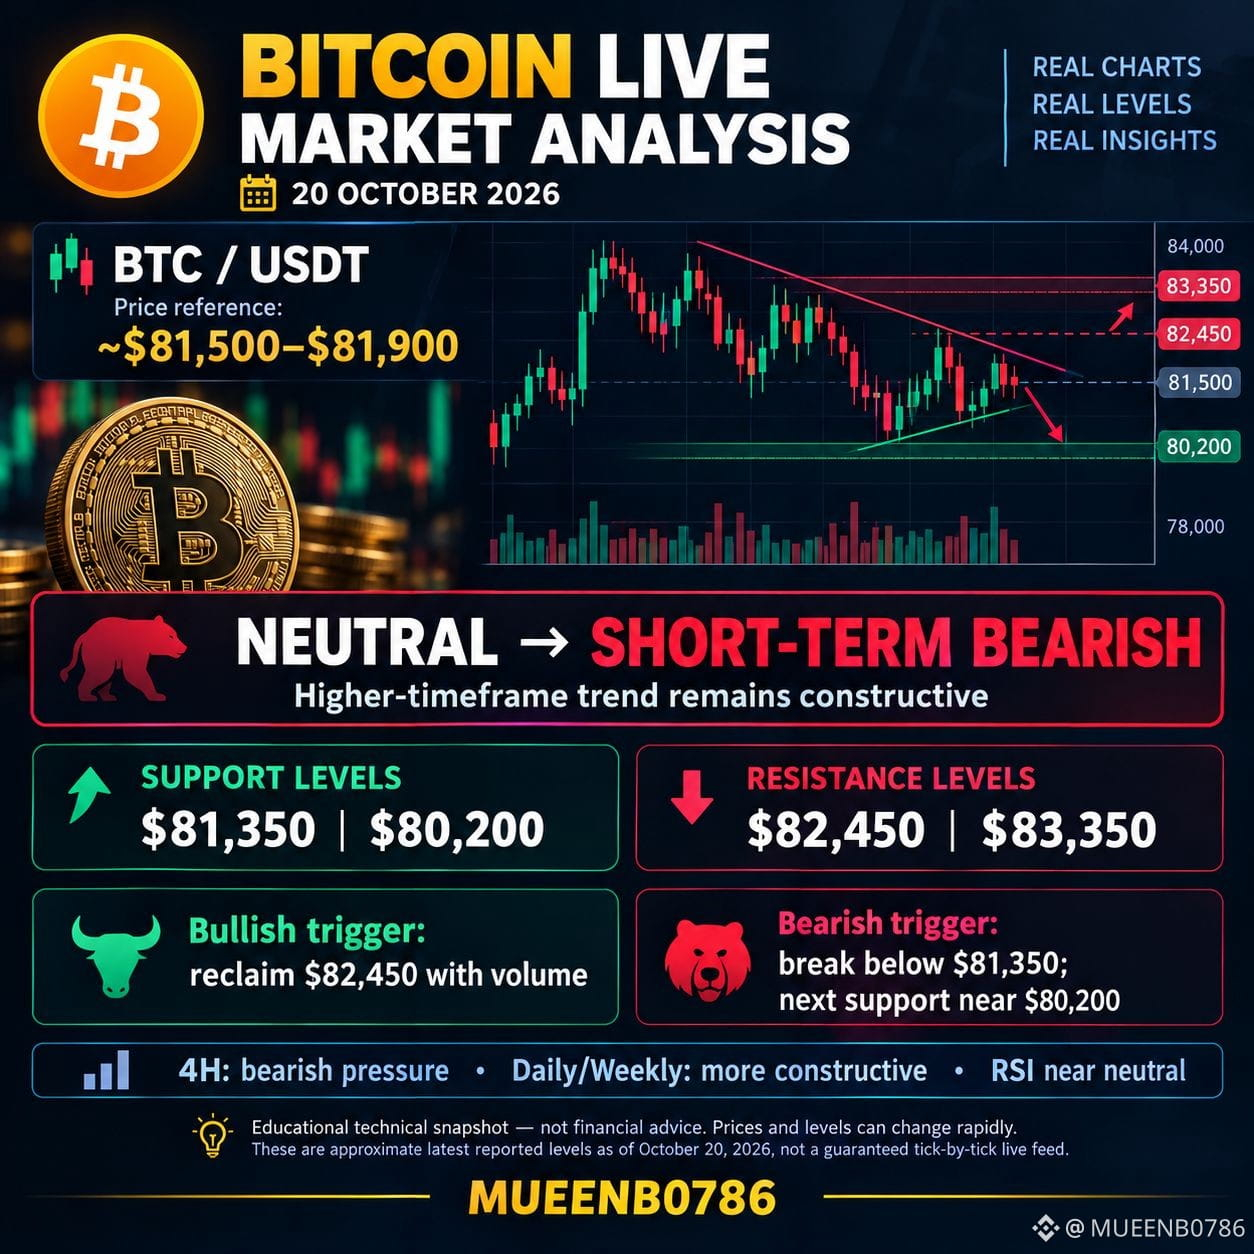
#ShareYourThoughtOnBTC
$BITCOIN Live Market Analysis — 20 October 2026
Latest available market data • $BTC /USDT • USD price reference
Current bias: NEUTRAL to SHORT-TERM BEARISH, with a bullish longer-term trend still possible.
$BTC is trading around $81,500–$81,900 in the latest available reports. Technical indicators disagree: the 4-hour chart shows bearish pressure, while the daily and weekly outlooks remain more bullish.
#BTC #MarketAnalysis
{spot}(BTCUSDT)
#ShareYourThoughtOnBTC
$BITCOIN Live Market Analysis — 20 October 2026
Latest available market data • $BTC /USDT • USD price reference
Current bias: NEUTRAL to SHORT-TERM BEARISH, with a bullish longer-term trend still possible.
$BTC is trading around $81,500–$81,900 in the latest available reports. Technical indicators disagree: the 4-hour chart shows bearish pressure, while the daily and weekly outlooks remain more bullish.
#BTC #MarketAnalysis
1
97
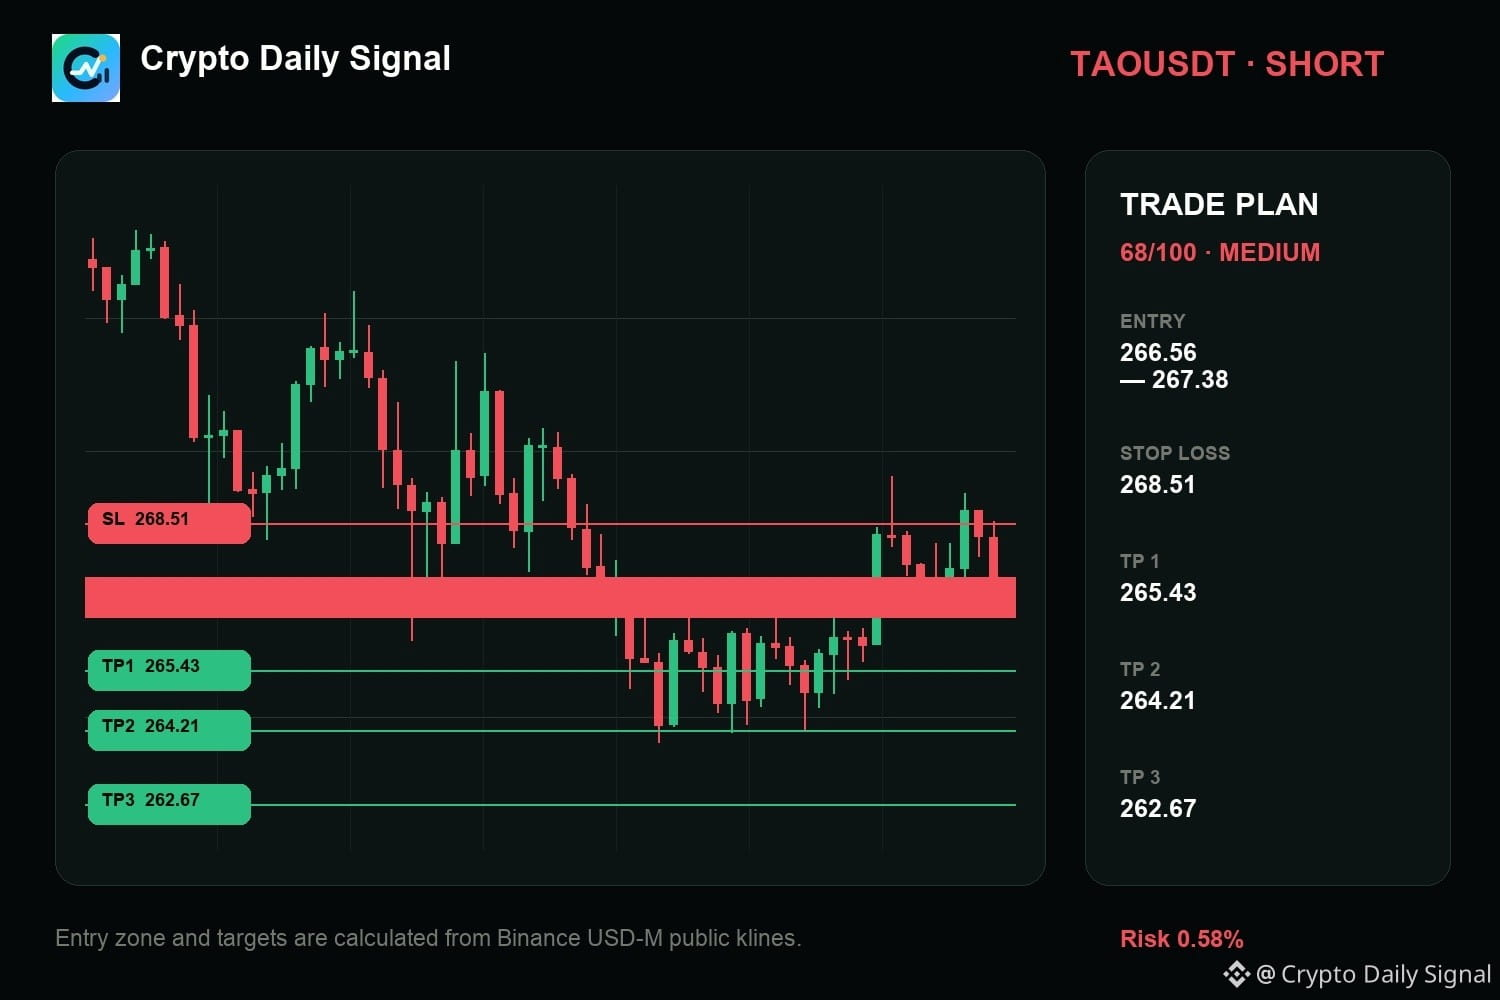
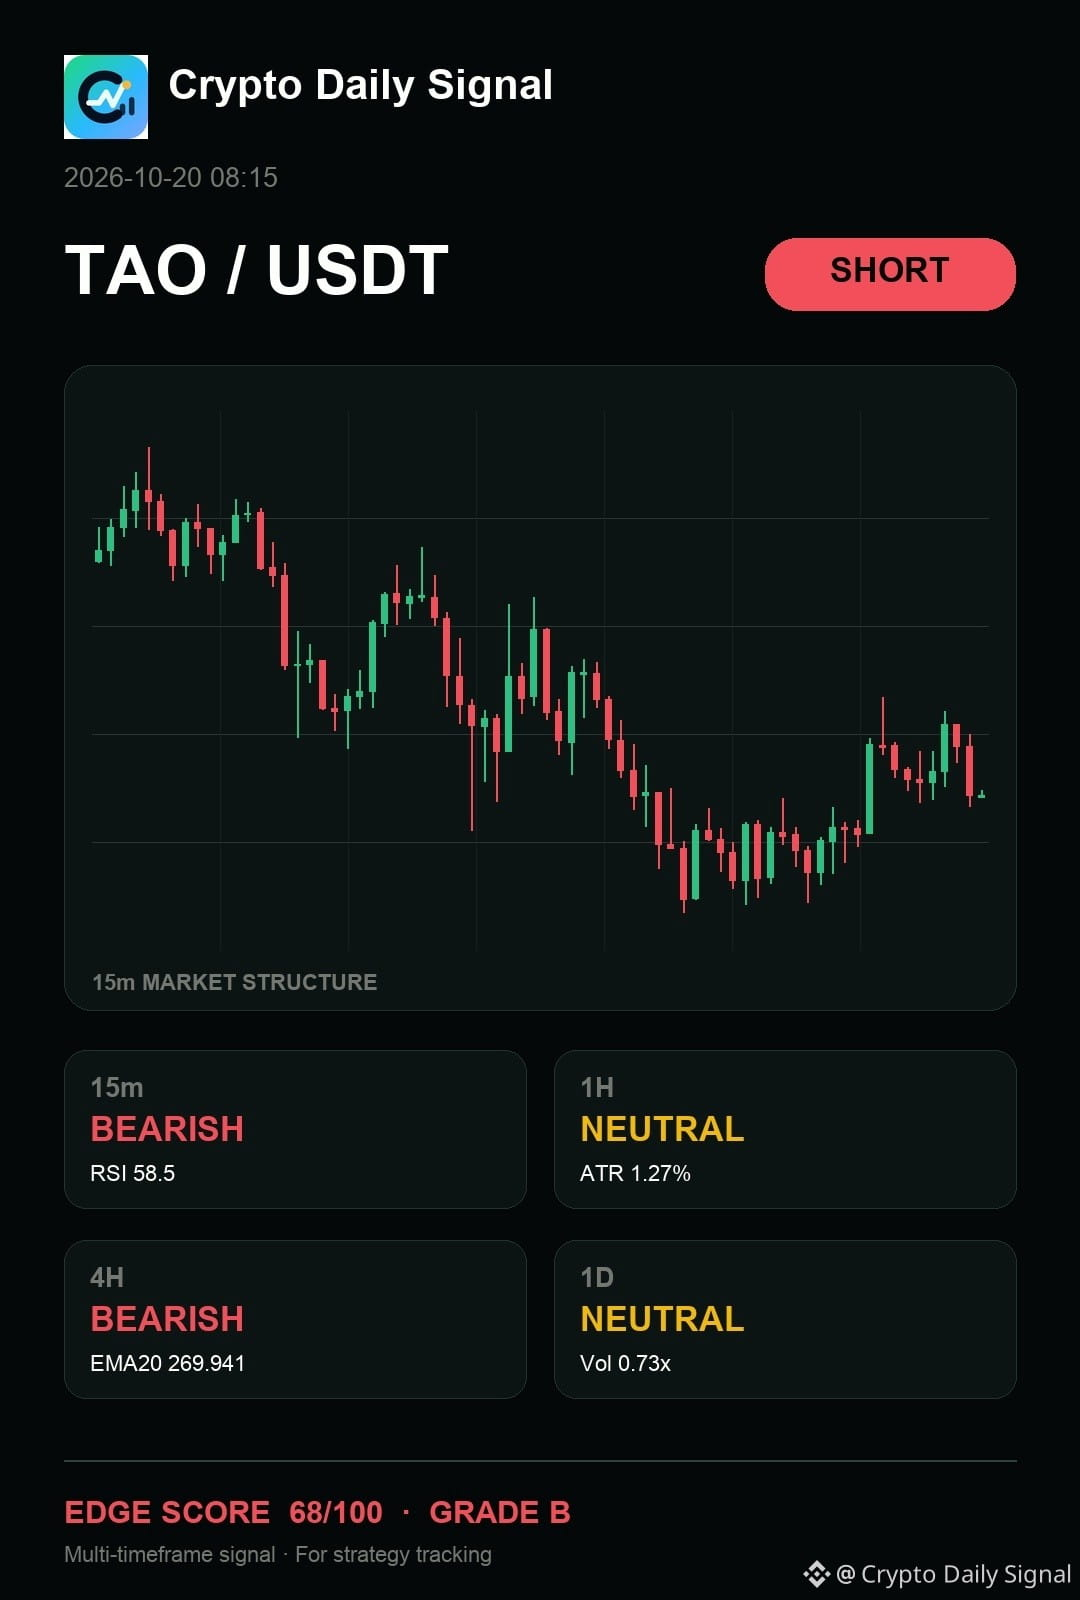
$TAO keeps the short case alive. The daily read is neutral, with the four-hour view still bearish. I care more about the reaction at the planned zone than the first burst away from it. Break the invalidation and there is nothing left to defend.
My levels for TAOUSDT — SHORT
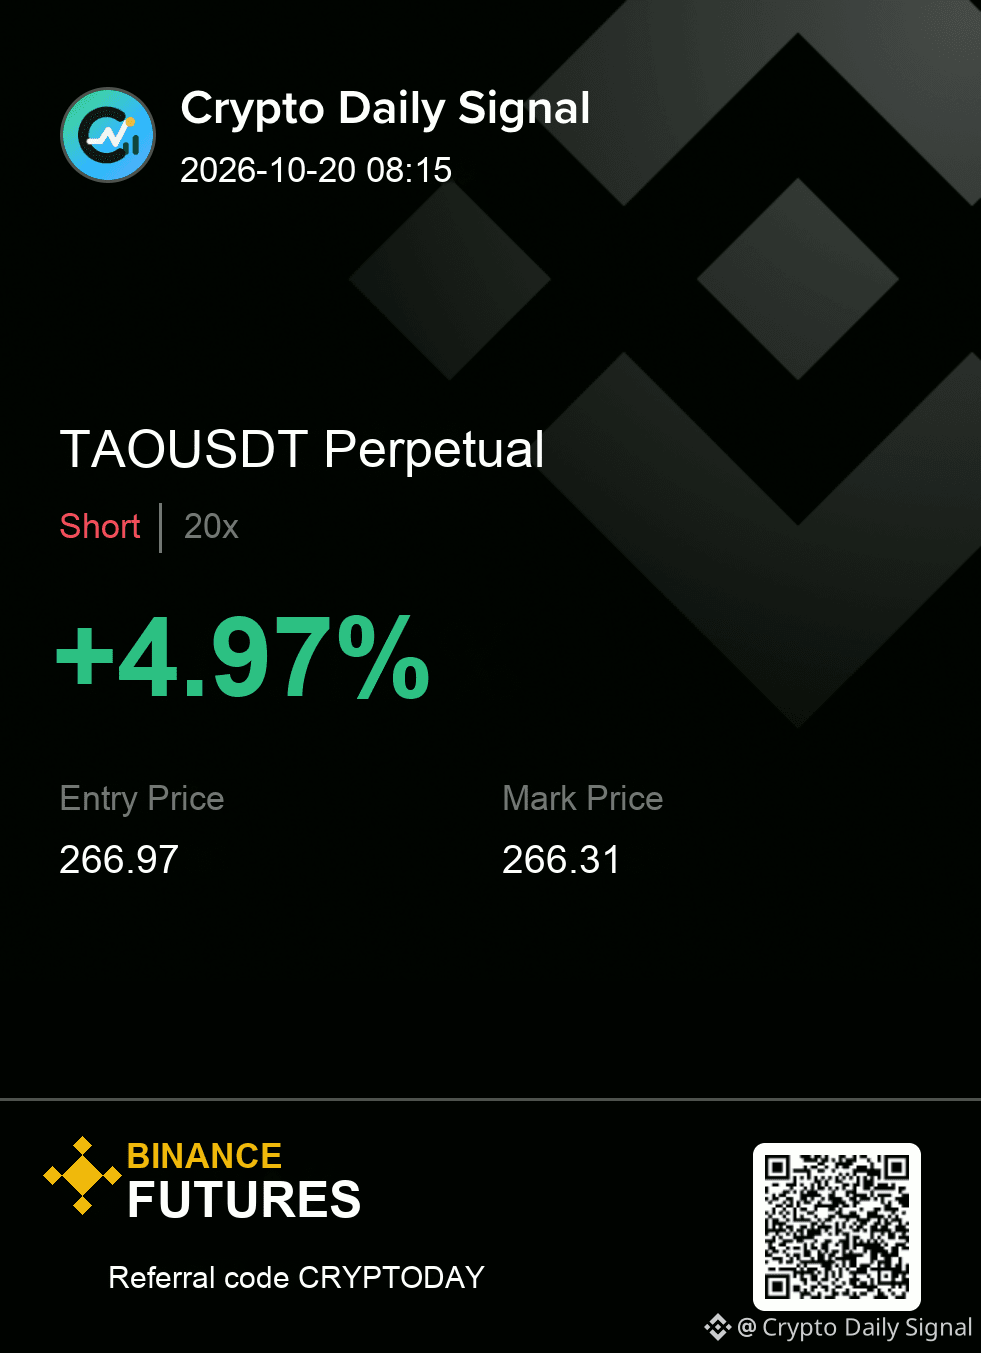
Entry zone 266.56 - 267.38
Risk line 268.51
Targets 265.43 / 264.21 / 262.67
#MarketAnalysis
{future}(TAOUSDT)
$TAO keeps the short case alive. The daily read is neutral, with the four-hour view still bearish. I care more about the reaction at the planned zone than the first burst away from it. Break the invalidation and there is nothing left to defend.
My levels for TAOUSDT — SHORT
Entry zone 266.56 - 267.38
Risk line 268.51
Targets 265.43 / 264.21 / 262.67
#MarketAnalysis
My levels for TAOUSDT — SHORT
Entry zone 266.56 - 267.38
Risk line 268.51
Targets 265.43 / 264.21 / 262.67
#MarketAnalysis
19

·
--
$BTC Bitcoin is trading at $80,180.70, experiencing short-term consolidation after encountering intense resistance near the $85,000 mark. The recent pullback was primarily driven by a heavy wave of leveraged long liquidations and a slowdown in spot ETF inflows. Despite these macro headwinds and broader stock market volatility, Bitcoin continues to form a solid structural base right above its psychologically crucial support level.
The Bullish Case: If buyers manage to defend the $80,000 baseline and secure a daily close above $82,900, it will invalidate the current bearish pressure. This breakout would renew momentum toward retesting $85,000, potentially opening up a clear runway toward $90,000.
The Bearish Case: A decisive drop below the $79,700 floor would confirm that short-term sellers have taken control. This breakdown could trigger a deeper correction into the mid-to-low $70,000 zone.
#BTC☀️ #RealWork #MarketAnalysis
{spot}(BTCUSDT)
$BTC Bitcoin is trading at $80,180.70, experiencing short-term consolidation after encountering intense resistance near the $85,000 mark. The recent pullback was primarily driven by a heavy wave of leveraged long liquidations and a slowdown in spot ETF inflows. Despite these macro headwinds and broader stock market volatility, Bitcoin continues to form a solid structural base right above its psychologically crucial support level.
The Bullish Case: If buyers manage to defend the $80,000 baseline and secure a daily close above $82,900, it will invalidate the current bearish pressure. This breakout would renew momentum toward retesting $85,000, potentially opening up a clear runway toward $90,000.
The Bearish Case: A decisive drop below the $79,700 floor would confirm that short-term sellers have taken control. This breakdown could trigger a deeper correction into the mid-to-low $70,000 zone.
#BTC☀️ #RealWork #MarketAnalysis

89
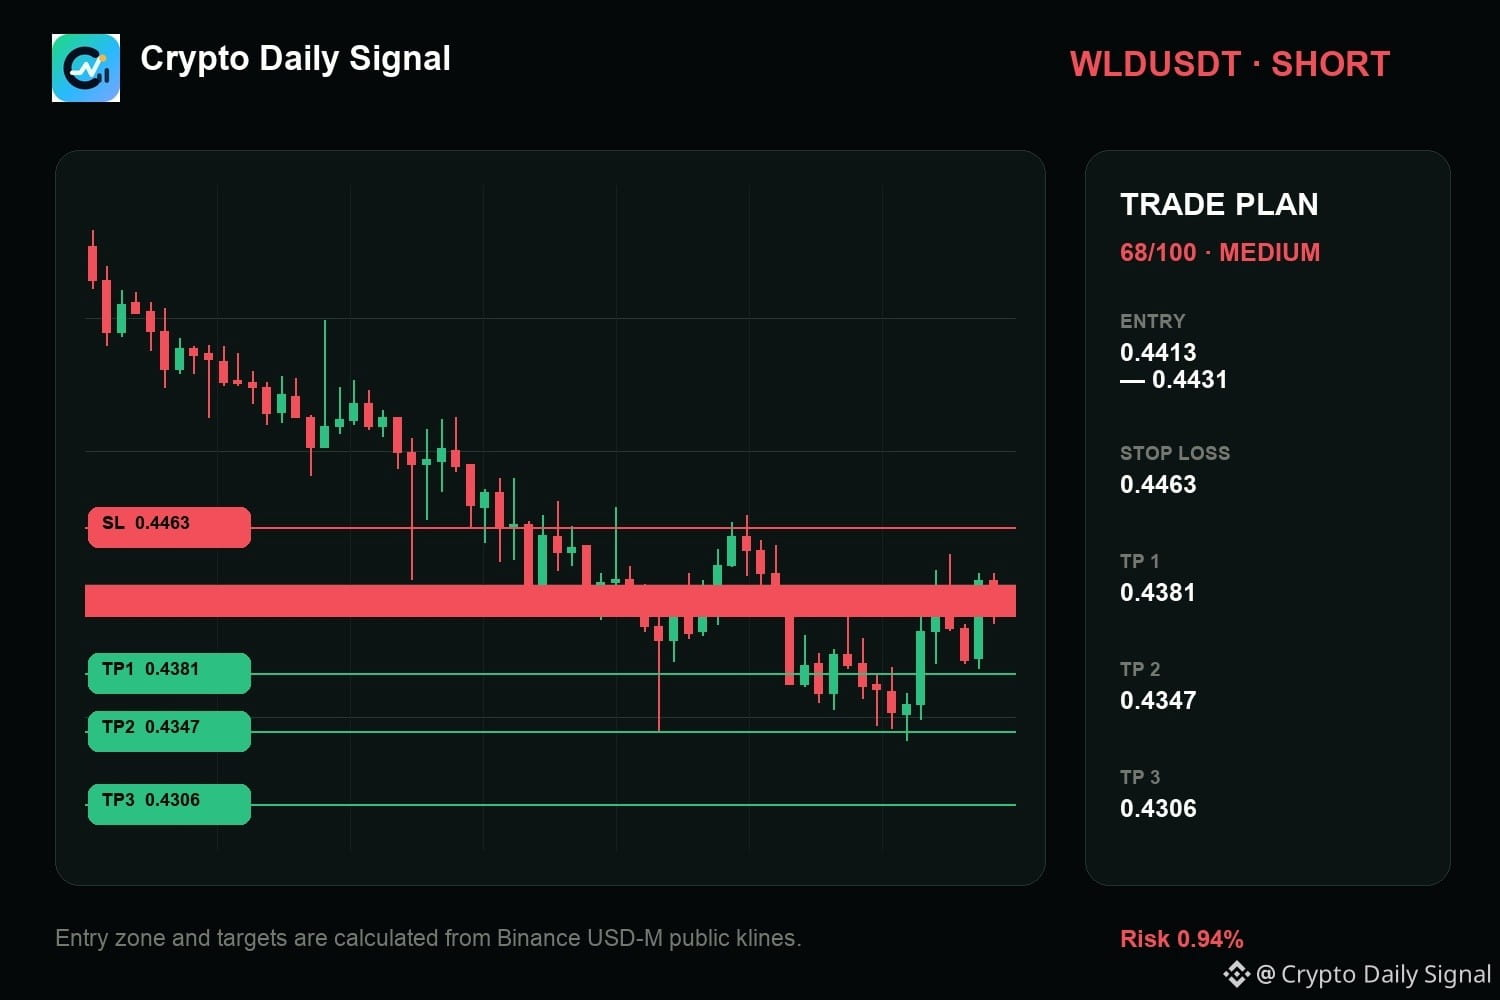
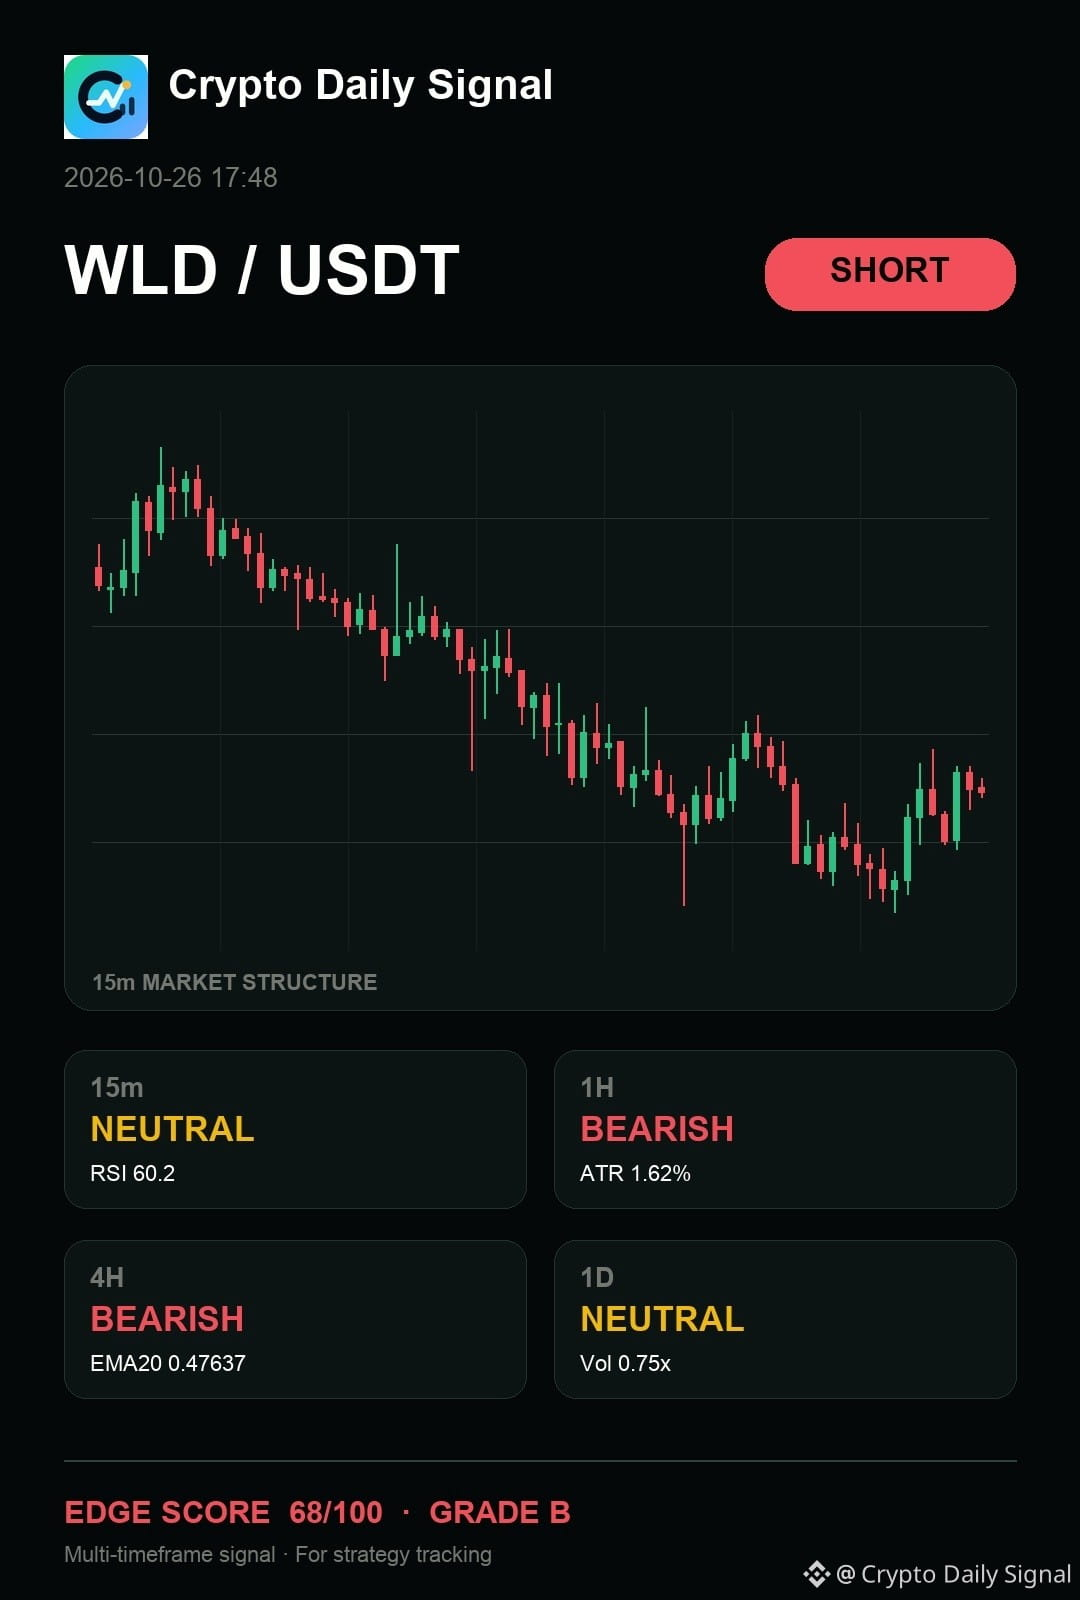
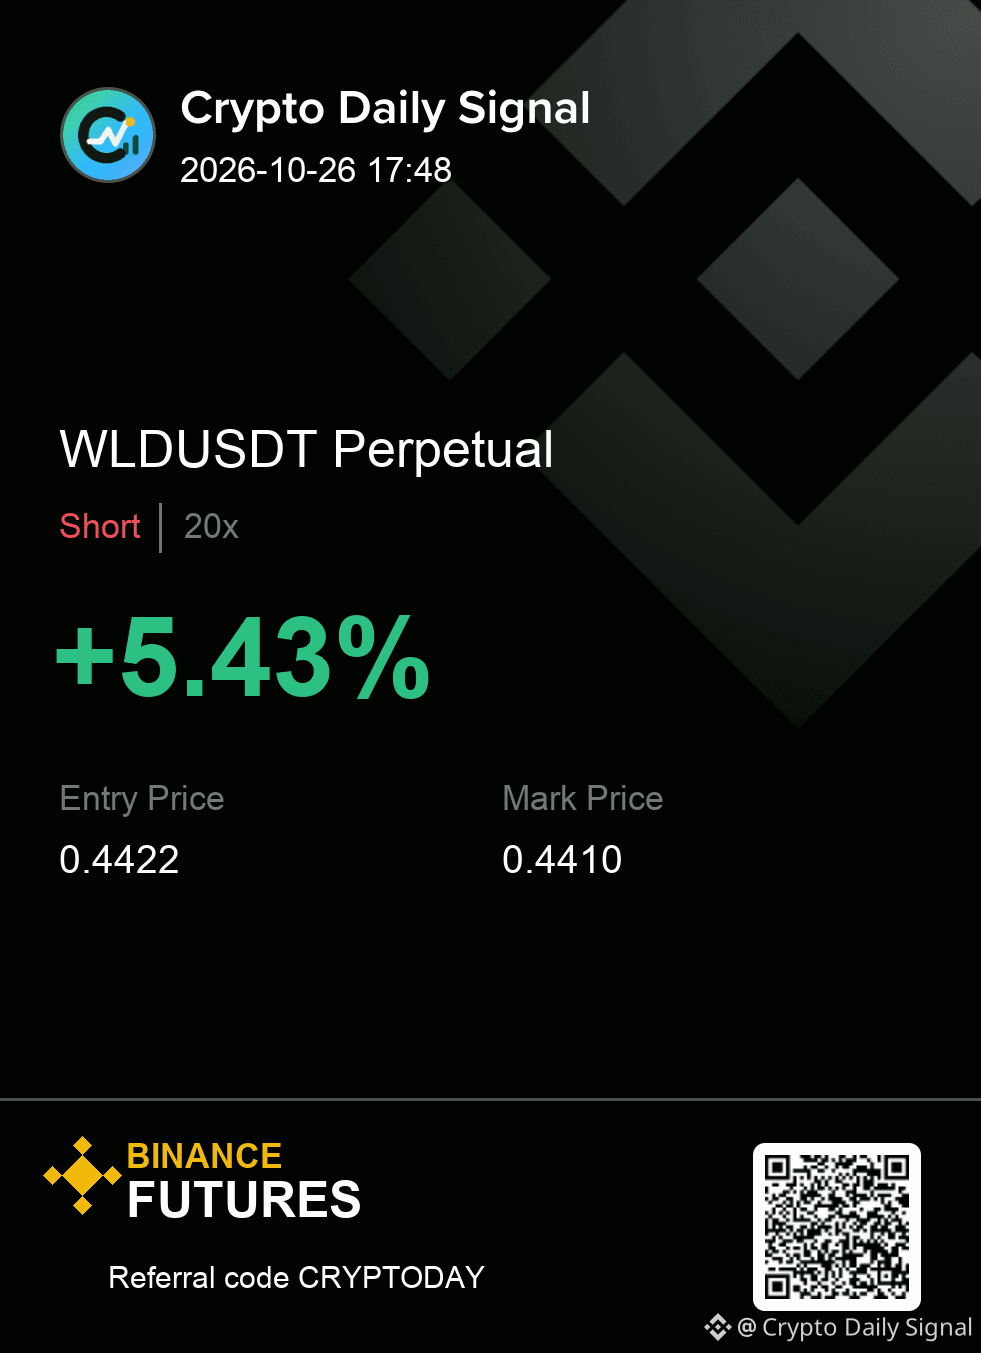
$WLD — right now, I would say it has not invalidated the short case; the bearish momentum is still holding up across the short-term structure. We are seeing that consistent pattern of lower highs and lower lows playing out on the four-hour and hourly charts, despite some choppiness on the fifteen-minute timeframe. The current weakness holds up until a real push back above the most recent peak appears.
A clean invalidation ends the thesis — no averaging into it.
Levels — WLDUSDT
Zone: 0.4413 - 0.4431
Cut: 0.4463
Scale: 0.4381 | 0.4347 | 0.4306
#MarketAnalysis
{future}(WLDUSDT)
$WLD — right now, I would say it has not invalidated the short case; the bearish momentum is still holding up across the short-term structure. We are seeing that consistent pattern of lower highs and lower lows playing out on the four-hour and hourly charts, despite some choppiness on the fifteen-minute timeframe. The current weakness holds up until a real push back above the most recent peak appears.
A clean invalidation ends the thesis — no averaging into it.
Levels — WLDUSDT
Zone: 0.4413 - 0.4431
Cut: 0.4463
Scale: 0.4381 | 0.4347 | 0.4306
#MarketAnalysis
A clean invalidation ends the thesis — no averaging into it.
Levels — WLDUSDT
Zone: 0.4413 - 0.4431
Cut: 0.4463
Scale: 0.4381 | 0.4347 | 0.4306
#MarketAnalysis
8

·
--
$ZEC 🚀 $ZEC LONG SETUP 🟢
The bulls are showing significant strength as $ZEC breaks above recent consolidation levels with strong momentum. With a solid 3.73% gain in the last 24 hours, $ZEC is demonstrating a clear upward trend that warrants attention.
📊 24h: +3.73% | Vol: $151,322,565.40
📈 TRADE PLAN
🔹 Entry: 1229.25
🛑 Stop Loss: 1209.25
🎯 TP1: 1259.25
🎯 TP2: 1289.25
🎯 TP3: 1319.25
⚖️ Risk:Reward (TP1): 1:1.50
🔔 Trigger: A sustained hourly candle close above the 1238.96 resistance level would confirm further bullish continuation for $ZEC.
⚠️ Risk Note: High volatility is common during upward breakouts; manage your position size accordingly and ensure your stop loss is strictly honored.
Always wait for a clear breakout confirmation before finalizing your entry into $ZEC.
Click below 👇🏻 to trade
$ZEC
Follow @TZX_Crypto for more updates...
#ZEC #CryptoTrading #MarketAnalysis #BinanceSquare
$ZEC 🚀 $ZEC LONG SETUP 🟢
The bulls are showing significant strength as $ZEC breaks above recent consolidation levels with strong momentum. With a solid 3.73% gain in the last 24 hours, $ZEC is demonstrating a clear upward trend that warrants attention.
📊 24h: +3.73% | Vol: $151,322,565.40
📈 TRADE PLAN
🔹 Entry: 1229.25
🛑 Stop Loss: 1209.25
🎯 TP1: 1259.25
🎯 TP2: 1289.25
🎯 TP3: 1319.25
⚖️ Risk:Reward (TP1): 1:1.50
🔔 Trigger: A sustained hourly candle close above the 1238.96 resistance level would confirm further bullish continuation for $ZEC .
⚠️ Risk Note: High volatility is common during upward breakouts; manage your position size accordingly and ensure your stop loss is strictly honored.
Always wait for a clear breakout confirmation before finalizing your entry into $ZEC .
Click below 👇🏻 to trade
$ZEC
Follow @TZX_Crypto for more updates...
#ZEC #CryptoTrading #MarketAnalysis #BinanceSquare
13
Connectez-vous pour découvrir plus de contenu
Rejoignez la communauté mondiale des adeptes de cryptomonnaies sur Binance Square
⚡️ Suviez les dernières informations importantes sur les cryptomonnaies.
💬 Jugé digne de confiance par la plus grande plateforme d’échange de cryptomonnaies au monde.
👍 Découvrez les connaissances que partagent les créateurs vérifiés.
Adresse e-mail/Nº de téléphone
Sujets d’actualité
1
#BinancePick
2.6M vues
140,561 mentions
2
#EarningsSeason
5M vues
24,253 mentions
3
#FranklinTempletonFilesForTwoDividendToBitcoinETFs
427 vues
46 mentions
4
#StrategyMSTRSurpassesNasdaqInMarketCap
607 vues
59 mentions
5
#CanadaProposesStablecoinRedemptionWithin3BusinessDays
63 vues
9 mentions
6
#ElectrumWalletBugLetRogueServersStealFunds
7,034 vues
214 mentions
7
#ArgentineCourtDismissesLIBRACaseAgainstMilei
16,066 vues
294 mentions
8
#SKHynixReportedlyPlansSpecialDividendFromKioxiaStakeSale
2,989 vues
48 mentions
9
#KeystoneWebsiteBreachExposesBuyersShippingAddresses
1,614 vues
40 mentions
10
#USQ3GDPAndSeptemberPCEDueNextWeek
92,514 vues
1,109 mentions