

#bitcoinslipsbelow$80kagain
bitcoinslipsbelow$80kagain
Populaire
Récents

·
--
Baissier
BTC Is Bleeding While the Whale W Move Out — Stacked Against a Corporate Bid
Seven days of downside, and it wasn't retail that drove.
The: BTC closed ~79,796 on Oct27, down ~2.6% over 7 days and ~5.2% over 30 days. Daily RSI(12) sits at 39.8. The week's range: high ~84,377 (Oct 22), low ~79,220 (Oct 24). No capitulation candle. No reclaim of 84K. Just grind.
The supply side is doing the talking. Dormant wallets moved 2,571 BTC (~$206.5M) toward institutional exchanges. That is supply arriving at the venue, not leaving it. Treasury appetite also cooled — Strategy redirected $204.9M into share buybacks instead of BTC.
The bid underneath is corporate, not speculative. Strive acquired 6,182 BTC (~$511.4M); public firms added 6,200+ BTC combined. That is a real floor argument near $79.7K — but it is a floor, not a breakout catalyst.
Momentum is not on the bulls' side. MACD histogram at −23.99, price under the 99 EMA. Upside is capped below ~$80.5K until that structure fl.
Positioning is mildly bullish, not euphoric. Square community poll: 2,116 bullish vs 1,714 bearish of 3,830 votes A limited sample — worth knowing, not worth trading on alone.
My read: this is distribution into a corporate bid. The floor is real; the momentum is not there. Watching whether the 79.2K–79.7K zone absorbs the exchange inflow is the whole story this week.
{spot}(BTCUSDT)
#BitcoinSlipsBelow$80KAgain
BTC Is Bleeding While the Whale W Move Out — Stacked Against a Corporate Bid
Seven days of downside, and it wasn't retail that drove.
The: BTC closed ~79,796 on Oct27, down ~2.6% over 7 days and ~5.2% over 30 days. Daily RSI(12) sits at 39.8. The week's range: high ~84,377 (Oct 22), low ~79,220 (Oct 24). No capitulation candle. No reclaim of 84K. Just grind.
The supply side is doing the talking. Dormant wallets moved 2,571 BTC (~$206.5M) toward institutional exchanges. That is supply arriving at the venue, not leaving it. Treasury appetite also cooled — Strategy redirected $204.9M into share buybacks instead of BTC.
The bid underneath is corporate, not speculative. Strive acquired 6,182 BTC (~$511.4M); public firms added 6,200+ BTC combined. That is a real floor argument near $79.7K — but it is a floor, not a breakout catalyst.
Momentum is not on the bulls' side. MACD histogram at −23.99, price under the 99 EMA. Upside is capped below ~$80.5K until that structure fl.
Positioning is mildly bullish, not euphoric. Square community poll: 2,116 bullish vs 1,714 bearish of 3,830 votes A limited sample — worth knowing, not worth trading on alone.
My read: this is distribution into a corporate bid. The floor is real; the momentum is not there. Watching whether the 79.2K–79.7K zone absorbs the exchange inflow is the whole story this week.
#BitcoinSlipsBelow$80KAgain
ABO3ZAM:
تحليل واقعي يا صديقي، 79 ألف منطقة مفصلية للمضارب. إذا ما تماسك السعر فوقها، السيولة بتسحبنا لمناطق أعمق تحت، خلنا نراقب إغلاق الشمعة الحالية بحذر 🤝
1
1
844

Article
🚨 THE CORRECTION EQUATION: $BTC LOSES $80K 🚨#bitcoinslipsbelow$80kagain
The bulls have officially lost the psychological line in the sand! Let’s break down the latest Bitcoin breakdown using pure math 🧮👇
(Moving Average Loss) + (Risk-Off Selling) = Key Support Test 📉
Here is the exact technical formula driving the market today:
The Price Input:
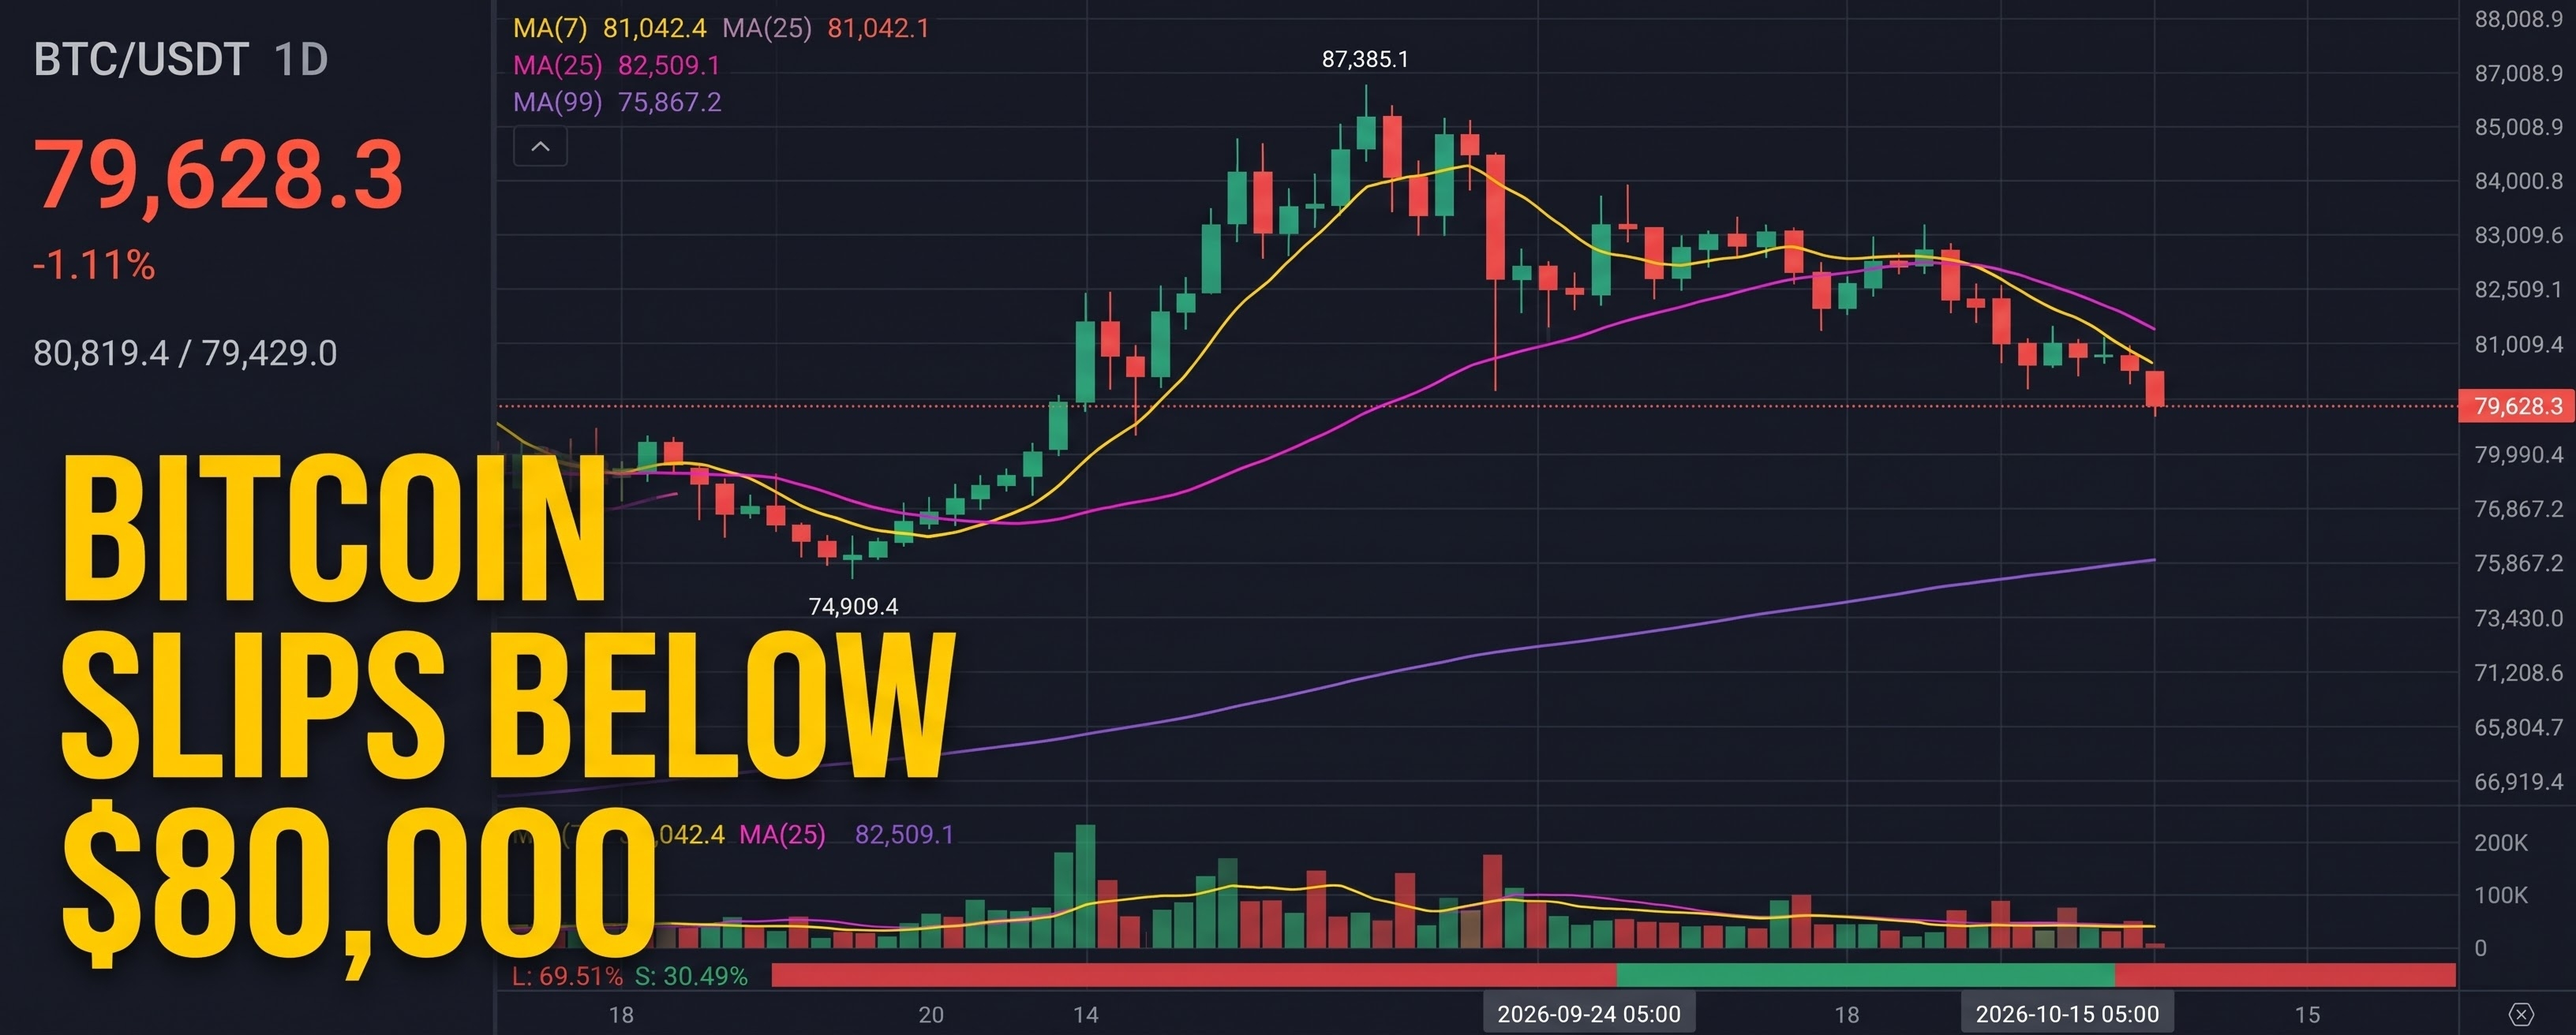
(The Breakdown) = Bitcoin has officially slipped below the critical $80,000 level, currently trading at $79,628 on the Binance Perpetual chart.
The Chart Reality:
(Technical Damage) ➔ Based on the chart data, BTC has decisively lost its short-term momentum indicators, falling below both the MA(7) at $81,042 and the MA(25) at $82,509.
The Breakdown:
With the 24-hour low tagging $79,429, the bears are firmly in control of the immediate trend. The price is now trapped in a downward trajectory, making the longer-term MA(99) sitting all the way down at $75,867 the next major structural defense line for the bulls. If buyers cannot rapidly reclaim the $81K zone, a deeper flush becomes highly probable.
Are you buying this dip or waiting for lower levels? Let's debate! 👇💬
$BTC $AIN $HUMA
{future}(HUMAUSDT)
{future}(BTCUSDT)
{future}(AINUSDT)
#BTC #cryptotrading #Binance #TechnicalAnalysis
🚨 THE CORRECTION EQUATION: $BTC LOSES $80K 🚨
#bitcoinslipsbelow$80kagain
The bulls have officially lost the psychological line in the sand! Let’s break down the latest Bitcoin breakdown using pure math 🧮👇
(Moving Average Loss) + (Risk-Off Selling) = Key Support Test 📉
Here is the exact technical formula driving the market today:
The Price Input:
(The Breakdown) = Bitcoin has officially slipped below the critical $80,000 level, currently trading at $79,628 on the Binance Perpetual chart.
The Chart Reality:
(Technical Damage) ➔ Based on the chart data, BTC has decisively lost its short-term momentum indicators, falling below both the MA(7) at $81,042 and the MA(25) at $82,509.
The Breakdown:
With the 24-hour low tagging $79,429, the bears are firmly in control of the immediate trend. The price is now trapped in a downward trajectory, making the longer-term MA(99) sitting all the way down at $75,867 the next major structural defense line for the bulls. If buyers cannot rapidly reclaim the $81K zone, a deeper flush becomes highly probable.
Are you buying this dip or waiting for lower levels? Let's debate! 👇💬
$BTC $AIN $HUMA
#BTC #cryptotrading #Binance #TechnicalAnalysis
Capital Codex:
Good read. I'm watching $74.9K–$76.3K for spot, but only after a 4H higher high. The Fed tomorrow can shake both sides.
13
17
42.9k

·
--
Haussier
🚨 Bitcoin is heading for a red October.
Our thesis: the bear-market bottom is behind us.
Are sellers exhausted—or are bulls ignoring a weak chart?
THE MARKET FILE — RED MONTH, BULLISH THESIS
October 27, 2026
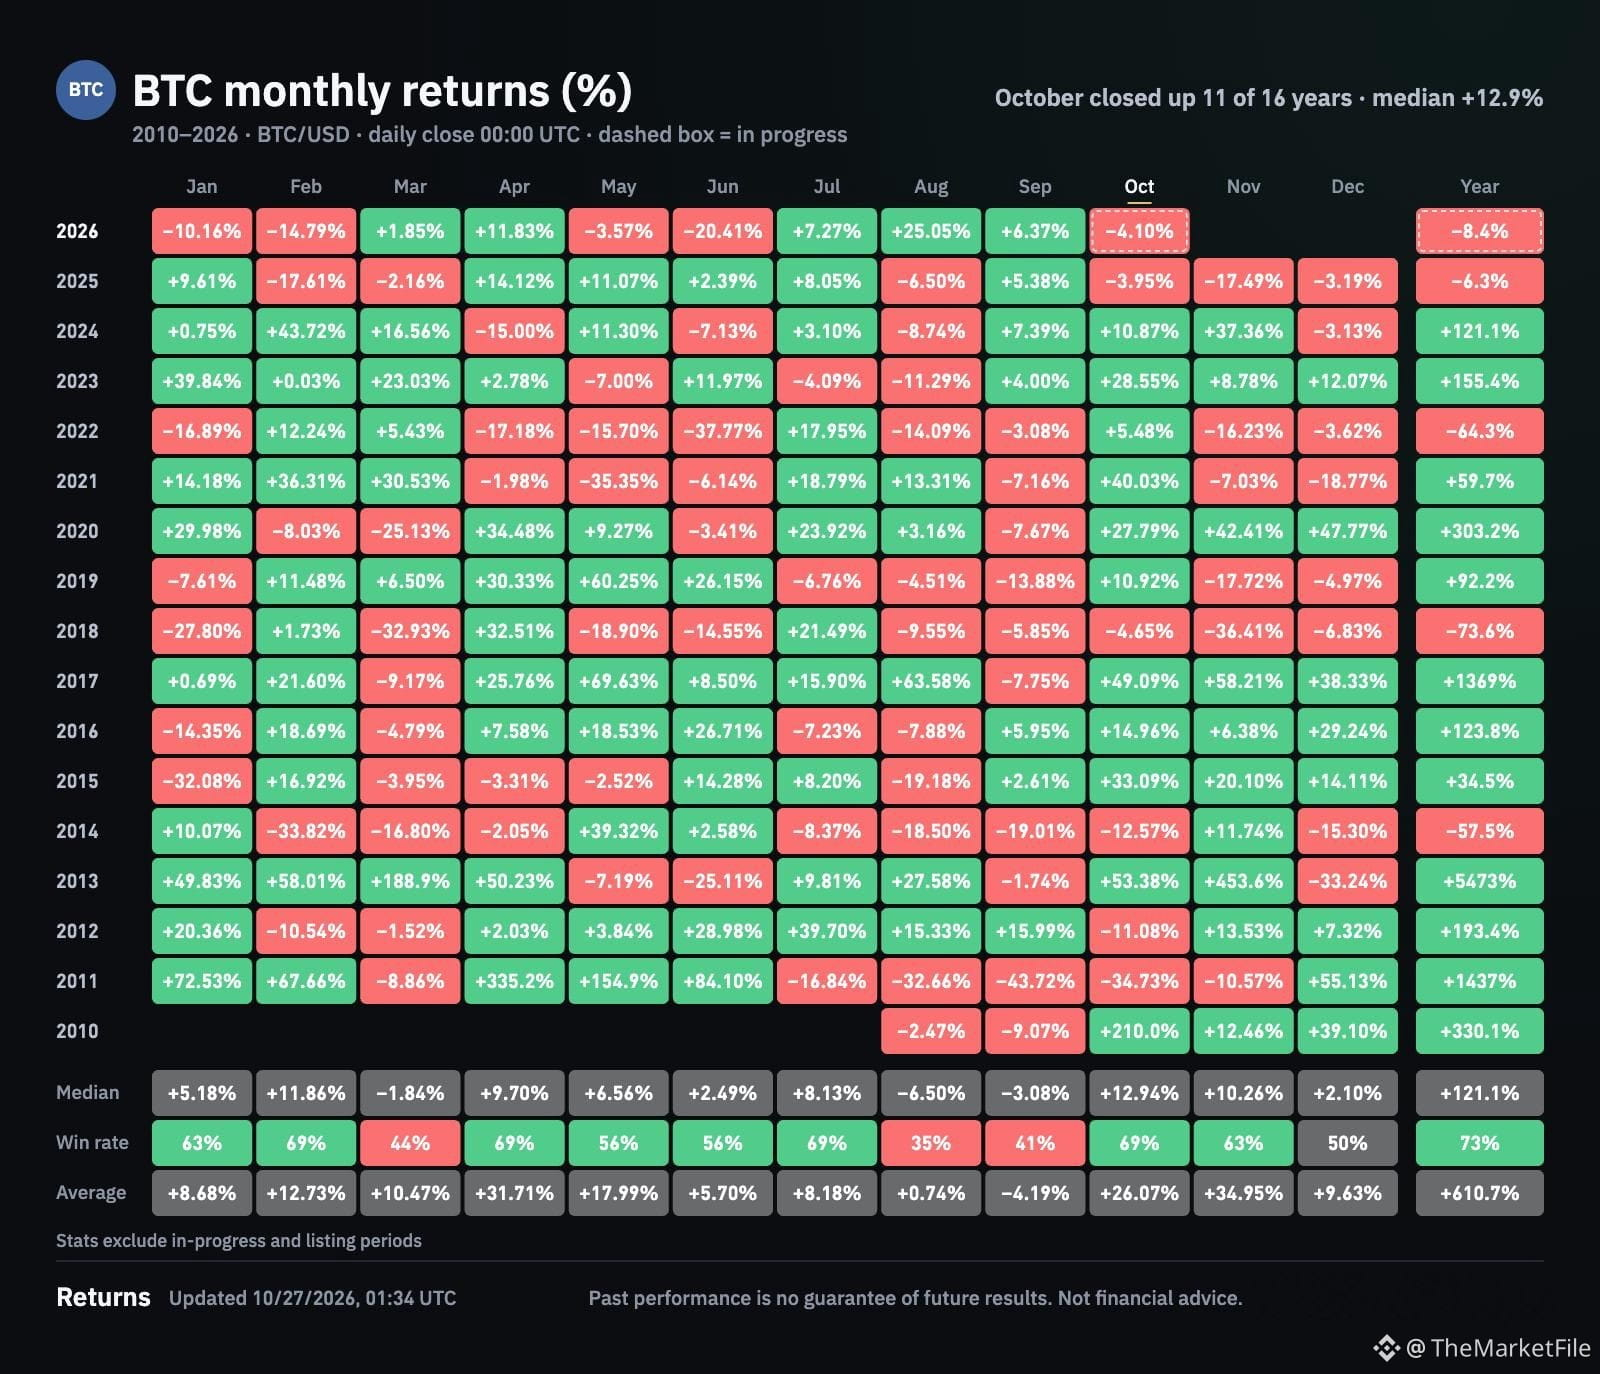
BTC is down roughly 4.1% this month. October hasn’t closed yet.
Four arguments support the bullish case. Each has limits. 👇
📊 1️⃣ LONG-TERM STRUCTURE
BTC reclaimed its 50-week moving average after 44 weeks below it, then posted five weekly closes above it through October 18.
Four comparable historical cases support the thesis—but remain a small sample.
🏦 2️⃣ POSITIONING RESET
Asset managers’ net long exposure in CME BTC futures fell 57% from the all-time-high week.
U.S. spot ETFs added about 87,000 BTC from the June low through the report’s cutoff.
Demand persisted as speculative positions unwound. That doesn’t prove selling is over.
👥 3️⃣ POSSIBLE CAPITULATION
Roughly 30,000 fewer addresses held BTC balances since October 16.
A potential contrarian bottom signal—but addresses aren’t individual investors. Transfers and consolidation also affect the count.
💵 4️⃣ MACRO SUPPORT
High U.S. debt and persistent deficits strengthen the long-term case for a scarce asset.
This thesis plays out over years, not days.
⚠️ HISTORY ISN’T A PROMISE
October was positive in 10 of 13 years from 2013–2025. Yet October 2025 lost 3.95%.
Seasonality won’t save a weak trade.
👀 THE MARKET FILE’S TEST
• Hold $80K and reclaim ~$82.5K: stronger bottom case.
• Sustained break below $79K: weaker case.
These are conditions, not guaranteed floors or targets.
📖 MY READ:
A bullish thesis needs to explain what would prove it wrong.
💬 Accumulation—or a bullish story to justify falling prices?
Name ONE signal that would change your mind.
$BTC
{future}(BTCUSDT)
#bitcoin #BTCanalysis #CryptoMarket #BitcoinSlipsBelow$80KAgain
🚨 Bitcoin is heading for a red October.
Our thesis: the bear-market bottom is behind us.
Are sellers exhausted—or are bulls ignoring a weak chart?
THE MARKET FILE — RED MONTH, BULLISH THESIS
October 27, 2026
BTC is down roughly 4.1% this month. October hasn’t closed yet.
Four arguments support the bullish case. Each has limits. 👇
📊 1️⃣ LONG-TERM STRUCTURE
BTC reclaimed its 50-week moving average after 44 weeks below it, then posted five weekly closes above it through October 18.
Four comparable historical cases support the thesis—but remain a small sample.
🏦 2️⃣ POSITIONING RESET
Asset managers’ net long exposure in CME BTC futures fell 57% from the all-time-high week.
U.S. spot ETFs added about 87,000 BTC from the June low through the report’s cutoff.
Demand persisted as speculative positions unwound. That doesn’t prove selling is over.
👥 3️⃣ POSSIBLE CAPITULATION
Roughly 30,000 fewer addresses held BTC balances since October 16.
A potential contrarian bottom signal—but addresses aren’t individual investors. Transfers and consolidation also affect the count.
💵 4️⃣ MACRO SUPPORT
High U.S. debt and persistent deficits strengthen the long-term case for a scarce asset.
This thesis plays out over years, not days.
⚠️ HISTORY ISN’T A PROMISE
October was positive in 10 of 13 years from 2013–2025. Yet October 2025 lost 3.95%.
Seasonality won’t save a weak trade.
👀 THE MARKET FILE’S TEST
• Hold $80K and reclaim ~$82.5K: stronger bottom case.
• Sustained break below $79K: weaker case.
These are conditions, not guaranteed floors or targets.
📖 MY READ:
A bullish thesis needs to explain what would prove it wrong.
💬 Accumulation—or a bullish story to justify falling prices?
Name ONE signal that would change your mind.
$BTC
#bitcoin #BTCanalysis #CryptoMarket #BitcoinSlipsBelow$80KAgain
2
389


·
--
Bitcoin Slips Below $80K Again: Is $79K the Level That Decides the Next Move?#BitcoinSlipsBelow$80KAgain
$BTC
{spot}(BTCUSDT)
Bitcoin slipped below $80K again, dipping to around $79.3K on Monday, its lowest level in over a month. Three things are weighing on the price: roughly $770M left US spot Bitcoin ETFs on Thursday and Friday, leveraged longs were flushed over the weekend, and traders are cutting risk ahead of Wednesday's Fed decision. Strategy also paused its buying after five straight weeks of additions.
My take: this looks more like cautious positioning than panic. The $80K level has been tested several times, and $79K is the key support I'm watching on the daily close. A sustained break below it could open the door to $75K, while reclaiming $82K would ease the selling pressure. Until the Fed decision is out, I expect choppy, range-bound price action, and I'd rather wait for confirmation than chase a move in either direction.
What's your view: bounce from $79K or a deeper drop? Tell me below 👇
Follow me for more trading content and market updates.
#BTC #CryptoMarkets #BinanceSquare
Bitcoin Slips Below $80K Again: Is $79K the Level That Decides the Next Move?
#BitcoinSlipsBelow$80KAgain
$BTC
Bitcoin slipped below $80K again, dipping to around $79.3K on Monday, its lowest level in over a month. Three things are weighing on the price: roughly $770M left US spot Bitcoin ETFs on Thursday and Friday, leveraged longs were flushed over the weekend, and traders are cutting risk ahead of Wednesday's Fed decision. Strategy also paused its buying after five straight weeks of additions.
My take: this looks more like cautious positioning than panic. The $80K level has been tested several times, and $79K is the key support I'm watching on the daily close. A sustained break below it could open the door to $75K, while reclaiming $82K would ease the selling pressure. Until the Fed decision is out, I expect choppy, range-bound price action, and I'd rather wait for confirmation than chase a move in either direction.
What's your view: bounce from $79K or a deeper drop? Tell me below 👇
Follow me for more trading content and market updates.
#BTC #CryptoMarkets #BinanceSquare
1
8.7k

·
--
is Bitcoin breaking $80,000 or just chewing on it? I'm on "chewing", for now
#BitcoinSlipsBelow$80KAgain is true. read the $BTC
{future}(BTCUSDT)
candles though:
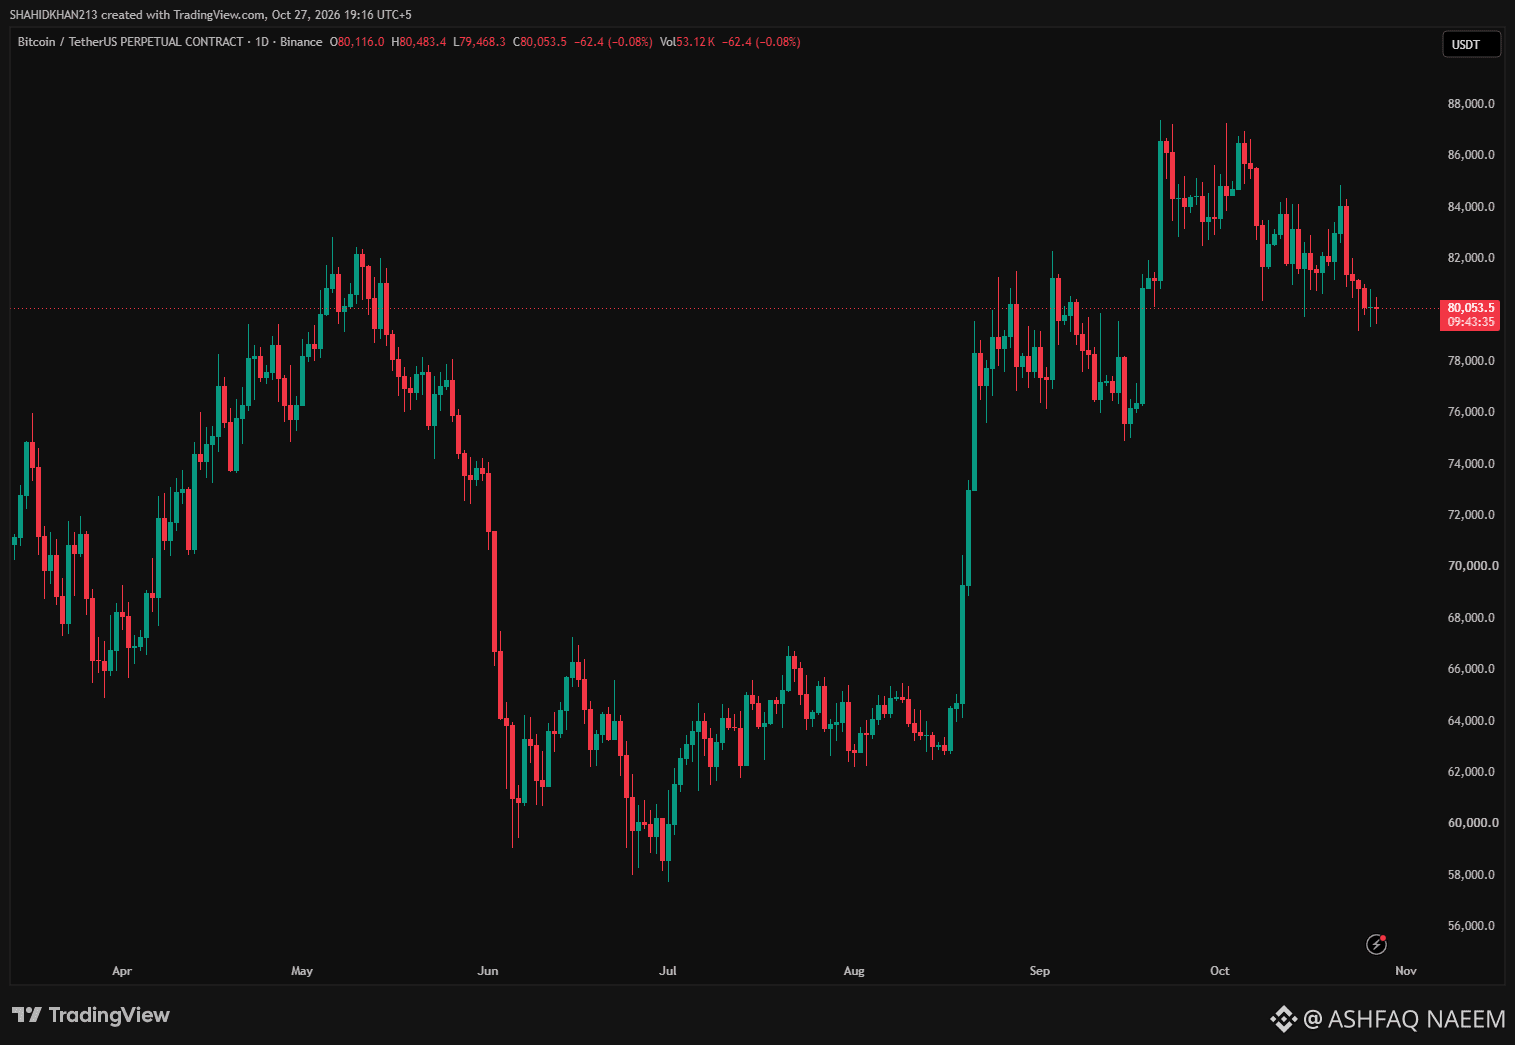
🔸 first trade under $80,000: October 24, 14:00 UTC hour
🔸 deepest point: 79,220.74, same Saturday
🔸 daily closes since: 80,888.16, 80,154.09, 80,150.56
every close held. that's why I don't call it a breakdown
the Saturday flush was the real event: $436.44 million liquidated across crypto in four hours, $404.15 million of it longs. Monday's 24h was $154.23 million. the panic already happened
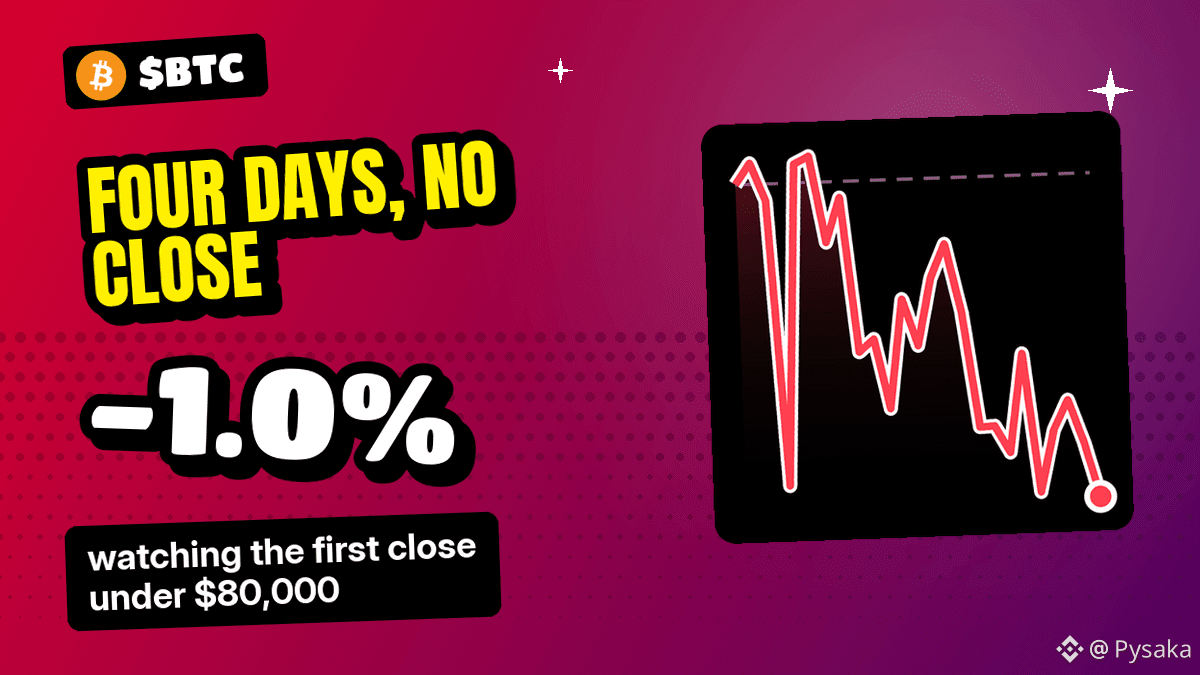
the line that changes my mind: the first daily close below $80,000 since September 17
I don't hold BTC, just watching. Fed on October 28, an estimated $11 billion of options expiring October 30, I'll write up whichever way it closes, follow if you want it
is Bitcoin breaking $80,000 or just chewing on it? I'm on "chewing", for now
#BitcoinSlipsBelow$80KAgain is true. read the $BTC
candles though:
🔸 first trade under $80,000: October 24, 14:00 UTC hour
🔸 deepest point: 79,220.74, same Saturday
🔸 daily closes since: 80,888.16, 80,154.09, 80,150.56
every close held. that's why I don't call it a breakdown
the Saturday flush was the real event: $436.44 million liquidated across crypto in four hours, $404.15 million of it longs. Monday's 24h was $154.23 million. the panic already happened
the line that changes my mind: the first daily close below $80,000 since September 17
I don't hold BTC, just watching. Fed on October 28, an estimated $11 billion of options expiring October 30, I'll write up whichever way it closes, follow if you want it
82

·
--
Haussier
#BitcoinSlipsBelow$80KAgain Bitcoin has slipped below the $80,000 threshold again, signaling a notable shift in short-term market momentum. This recent price pullback highlights the ongoing battle between buyers and sellers at these elevated price levels. For traders, breaching this key psychological barrier reflects underlying liquidity dynamics and shifting risk appetite across the broader digital asset ecosystem.
The drop below $80k matters because it tests critical technical support zones. When a major round number fails to hold, it often triggers automated stop-losses, accelerating downward price pressure. However, it also presents a potential accumulation opportunity for long-term investors who view these dips as strategic entry points. Overall market sentiment is currently transitioning from exuberance to caution, with traders closely monitoring order books for signs of a definitive bottom.
Looking ahead, market participants should watch trading volume and spot ETF flows to gauge the true strength of this correction. If Bitcoin can reclaim $80,000 with strong volume, the broader bullish structure remains intact. Conversely, a sustained break could open the path toward the $75,000 support region. Navigating this current market volatility requires strict risk management and patience.
#Bitcoin #CryptoMarket #BTC #Trading
$HUMA $BANK $BTC
{future}(BTCUSDT)
{future}(BANKUSDT)
{future}(HUMAUSDT)
#BitcoinSlipsBelow$80KAgain Bitcoin has slipped below the $80,000 threshold again, signaling a notable shift in short-term market momentum. This recent price pullback highlights the ongoing battle between buyers and sellers at these elevated price levels. For traders, breaching this key psychological barrier reflects underlying liquidity dynamics and shifting risk appetite across the broader digital asset ecosystem.
The drop below $80k matters because it tests critical technical support zones. When a major round number fails to hold, it often triggers automated stop-losses, accelerating downward price pressure. However, it also presents a potential accumulation opportunity for long-term investors who view these dips as strategic entry points. Overall market sentiment is currently transitioning from exuberance to caution, with traders closely monitoring order books for signs of a definitive bottom.
Looking ahead, market participants should watch trading volume and spot ETF flows to gauge the true strength of this correction. If Bitcoin can reclaim $80,000 with strong volume, the broader bullish structure remains intact. Conversely, a sustained break could open the path toward the $75,000 support region. Navigating this current market volatility requires strict risk management and patience.
#Bitcoin #CryptoMarket #BTC #Trading
$HUMA $BANK $BTC

465

#BitcoinSlipsBelow$80KAgain
🚨 THE $80K BATTLE Is Bitcoin Shaking Out Longs or Preparing for a Deeper Drop? 📉
Bitcoin ($BTC) has officially slipped below the psychological $80,000 threshold again, currently grinding around the $79,600 – $79,800 zone. The short-term momentum indicators are flashing red as BTC fell below its MA(7) and MA(25) lines, leaving traders wondering: Is this a trap, or the perfect buy-the-dip window?
Here is the exact market breakdown you need to know today:
🔍 Technical Reality Check: Key Support & Resistance
• The Floor to Watch: Buyers urgently need to defend the $79,000 – $79,200 support zone. A clean breakdown below this could accelerate selling pressure down to the next major demand area near $75,800 (MA(99)).
• The Bullish Reclaim: To completely invalidate this immediate bearish structure, bulls must reclaim the $80,800 – $82,500 area with high volume.
📊 Behind the Scenes: What's Driving the Move?
• Macro Caution: Traders are actively cutting risk ahead of the upcoming Fed interest rate decision.
• Liquidation Wave: Over $400M+ in over-leveraged long positions were flushed out recently, wiping out speculative froth and cooling down funding rates.
• The Corporate Bid vs. AI Rotation: While institutional whales and public firms continue to bid and set a solid long-term floor, massive liquidity is temporarily rotating into massive tech AI capital plays.
💡 The Strategy
This looks more like a healthy macro-driven consolidation and risk-off positioning rather than absolute panic. Avoid chasing high-leverage trades in this volatility and focus on spot accumulation zones.
💬 Let's Debate Below:
Are you aggressively buying this $79K dip, or are you sitting on cash waiting for lower levels? Drop your strategy in the comments! 👇
#BTC #cryptotrading #Binance #TechnicalAnalysis
$BTC $HUMA $AIN
{future}(AINUSDT)
{future}(HUMAUSDT)
{future}(BTCUSDT)
#BitcoinSlipsBelow$80KAgain
🚨 THE $80K BATTLE Is Bitcoin Shaking Out Longs or Preparing for a Deeper Drop? 📉
Bitcoin ($BTC ) has officially slipped below the psychological $80,000 threshold again, currently grinding around the $79,600 – $79,800 zone. The short-term momentum indicators are flashing red as BTC fell below its MA(7) and MA(25) lines, leaving traders wondering: Is this a trap, or the perfect buy-the-dip window?
Here is the exact market breakdown you need to know today:
🔍 Technical Reality Check: Key Support & Resistance
• The Floor to Watch: Buyers urgently need to defend the $79,000 – $79,200 support zone. A clean breakdown below this could accelerate selling pressure down to the next major demand area near $75,800 (MA(99)).
• The Bullish Reclaim: To completely invalidate this immediate bearish structure, bulls must reclaim the $80,800 – $82,500 area with high volume.
📊 Behind the Scenes: What's Driving the Move?
• Macro Caution: Traders are actively cutting risk ahead of the upcoming Fed interest rate decision.
• Liquidation Wave: Over $400M+ in over-leveraged long positions were flushed out recently, wiping out speculative froth and cooling down funding rates.
• The Corporate Bid vs. AI Rotation: While institutional whales and public firms continue to bid and set a solid long-term floor, massive liquidity is temporarily rotating into massive tech AI capital plays.
💡 The Strategy
This looks more like a healthy macro-driven consolidation and risk-off positioning rather than absolute panic. Avoid chasing high-leverage trades in this volatility and focus on spot accumulation zones.
💬 Let's Debate Below:
Are you aggressively buying this $79K dip, or are you sitting on cash waiting for lower levels? Drop your strategy in the comments! 👇
#BTC #cryptotrading #Binance #TechnicalAnalysis
$BTC $HUMA $AIN

116

·
--
🚨 BITCOIN BELOW $80K — THESE SUPPORT ZONES MATTER NOW
Bitcoin has slipped below the psychological $80,000 level, and traders are watching the next key support areas closely.
📉 BTC SUPPORT BREAKDOWN
🔹 $79,400–$79,000 — Immediate support zone. Buyers need to defend this area to prevent further weakness
🔹 $78,000–$78,600 — Next important support. A breakdown below this zone could accelerate selling pressure
🔹 $75,500–$76,000 — Major downside area if BTC loses the $78K region
🔹 $74,800–$75,000 — Deeper support zone that could become important during a stronger correction
📊 What Traders Should Watch
If Bitcoin reclaims $80K and holds above it, a recovery toward $80,800–$82,000 becomes possible
However, a sustained breakdown below $78K could expose BTC to the $75.5K region
Remember, support zones are areas of potential buying interest, not guaranteed reversal points
Will Bitcoin defend $78K, or are bears targeting $75K next?
These are technical reference zones, not guaranteed price targets. Recent market analysis places immediate support near $79.4K and the next major zone around $77.8K–$78.1K, with $75.5K as a broader downside area.
#BitcoinSlipsBelow$80KAgain $BTC
{future}(BTCUSDT)
🚨 BITCOIN BELOW $80K — THESE SUPPORT ZONES MATTER NOW
Bitcoin has slipped below the psychological $80,000 level, and traders are watching the next key support areas closely.
📉 BTC SUPPORT BREAKDOWN
🔹 $79,400–$79,000 — Immediate support zone. Buyers need to defend this area to prevent further weakness
🔹 $78,000–$78,600 — Next important support. A breakdown below this zone could accelerate selling pressure
🔹 $75,500–$76,000 — Major downside area if BTC loses the $78K region
🔹 $74,800–$75,000 — Deeper support zone that could become important during a stronger correction
📊 What Traders Should Watch
If Bitcoin reclaims $80K and holds above it, a recovery toward $80,800–$82,000 becomes possible
However, a sustained breakdown below $78K could expose BTC to the $75.5K region
Remember, support zones are areas of potential buying interest, not guaranteed reversal points
Will Bitcoin defend $78K, or are bears targeting $75K next?
These are technical reference zones, not guaranteed price targets. Recent market analysis places immediate support near $79.4K and the next major zone around $77.8K–$78.1K, with $75.5K as a broader downside area.
#BitcoinSlipsBelow$80KAgain $BTC
8


Article
Bitcoin Analysis Today - October 27, 2026Price: ∼$79,700 - $80,000
BTC is trading below the psychological $80K level today. Down ∼0.4% since midnight UTC.
Today's range: $79,468 - $80,364
Current: Around $80,084 / $79,760 on other exchanges
Weekly trend: Down 2.5% over past week and down 2.10% on the 7-day c996f722ef1e51cb1e6f
Technical Levels:
Support: $79,278 and $79,145, with a major bid wall at $79,000 (401 BTC)
Resistance: $80,710 and $80,925, ask wall at $80,800 - $80,900
Momentum: Daily MACD at -588 (weak short-term), Weekly MACD at 2,130 (firmer long-term)
Sentiment: Fear & Greed 48 - Neutral, down from 50 yesterday 3447c996ef1eeacf
Market Drivers Today:
Fed Meeting: The Fed begins 2-day meeting today, decision Wednesday. Market pricing 90% chance of no change. Traders cautious ahead of it.
AI vs Crypto: Capital rotating to AI. Meta announced $95B capital raise and Anthropic filed for IPO aiming up to $100B - nearly $200B going to AI, not crypto. Asian tech stocks rallied (Kospi +3.1%) but crypto didn't follow.
ETF Flows: Spot BTC ETFs took in $110M on Monday after 2 days of outflows, but had seen $635.6M outflows on Oct 22.
Liquidations: Last 24h - $13.9M longs and $8.0M shorts liquidated. de0662ff0599c996
Short-term Outlook:
Consolidation below $80K with max pain at $80,000 for tomorrow's expiry. Volume is up 36% to $25.7B despite price decline - shows increased participation but no clear direction. Need to hold $79K or risk drop to $78K. Break above $80,800 wall needed for bullish continuation.$BTC #EthereumDropsBelow$2300 #FOMCWatch #BitcoinSlipsBelow$80KAgain
{future}(BTCUSDT)
Bitcoin Analysis Today - October 27, 2026
Price: ∼$79,700 - $80,000
BTC is trading below the psychological $80K level today. Down ∼0.4% since midnight UTC.
Today's range: $79,468 - $80,364
Current: Around $80,084 / $79,760 on other exchanges
Weekly trend: Down 2.5% over past week and down 2.10% on the 7-day c996f722ef1e51cb1e6f
Technical Levels:
Support: $79,278 and $79,145, with a major bid wall at $79,000 (401 BTC)
Resistance: $80,710 and $80,925, ask wall at $80,800 - $80,900
Momentum: Daily MACD at -588 (weak short-term), Weekly MACD at 2,130 (firmer long-term)
Sentiment: Fear & Greed 48 - Neutral, down from 50 yesterday 3447c996ef1eeacf
Market Drivers Today:
Fed Meeting: The Fed begins 2-day meeting today, decision Wednesday. Market pricing 90% chance of no change. Traders cautious ahead of it.
AI vs Crypto: Capital rotating to AI. Meta announced $95B capital raise and Anthropic filed for IPO aiming up to $100B - nearly $200B going to AI, not crypto. Asian tech stocks rallied (Kospi +3.1%) but crypto didn't follow.
ETF Flows: Spot BTC ETFs took in $110M on Monday after 2 days of outflows, but had seen $635.6M outflows on Oct 22.
Liquidations: Last 24h - $13.9M longs and $8.0M shorts liquidated. de0662ff0599c996
Short-term Outlook:
Consolidation below $80K with max pain at $80,000 for tomorrow's expiry. Volume is up 36% to $25.7B despite price decline - shows increased participation but no clear direction. Need to hold $79K or risk drop to $78K. Break above $80,800 wall needed for bullish continuation.$BTC #EthereumDropsBelow$2300 #FOMCWatch #BitcoinSlipsBelow$80KAgain
68

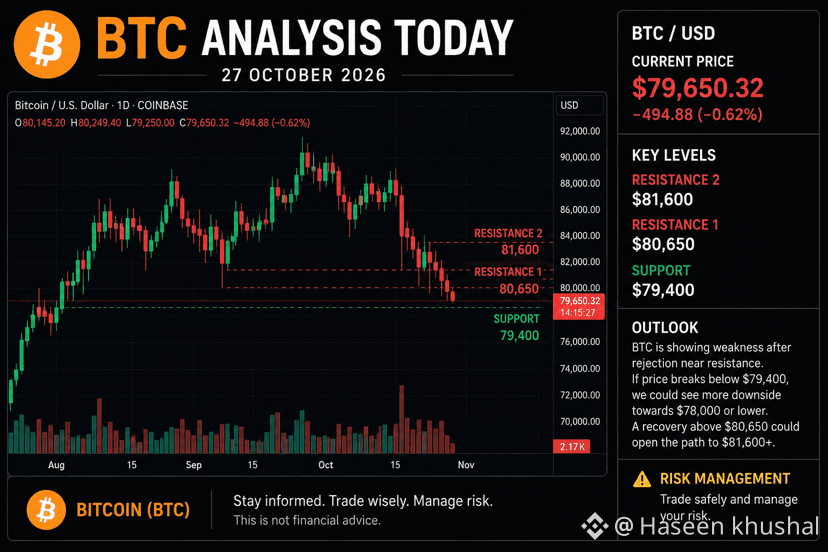
📊 Bitcoin $BTC (BTC) Analysis — October 27, 2026
₿ Current Price: Around $79,500–$80,000.
📉 Market Trend: BTC is facing short-term selling pressure, with the market showing mixed signals.
🟢 Support: $79,400
🔴 Resistance: $80,650–$81,600
📈 My Outlook: A breakout above $80,650 could support further gains, while a drop below $79,400 may trigger more downside.#BitcoinSlipsBelow$80KAgain #BitmineAdds10452ETH #BitcoinSlipsBelow$80KAgain #BitcoinSlipsBelow$80KAgain
⚠️ Stay cautious and manage your risk. This is market analysis, not financial advice.
68

·
--
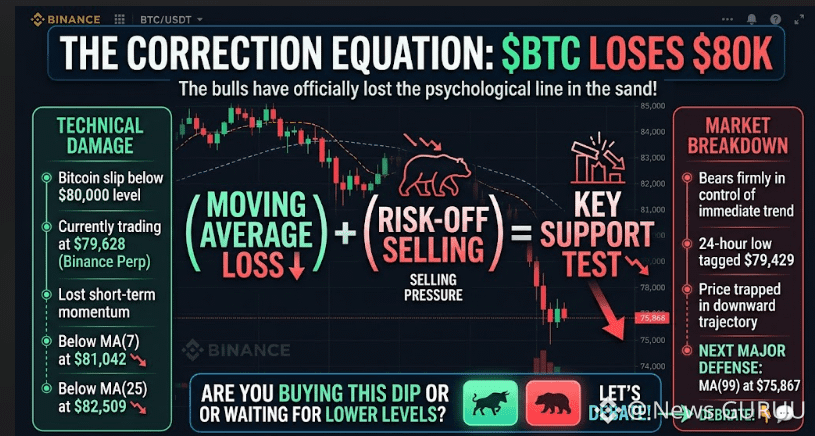
#BitcoinSlipsBelow$80KAgain #CryptoMarket #BTC
🚨 BITCOIN DROPS BELOW $80K! 📉
BTC is trading at $79,628, below MA(7) at $81,042 and MA(25) at $82,509. Bears are gaining control!
🎯 Key Support: $75,867
📈 Recovery Zone: $81K+
Will Bitcoin bounce back or drop further? 👇."CLICK ON THE BELOW YELLOW COIN TAG TO GO TO DESIRED TRADING PAGE TO GET BENEFIT TRADE"$BTC $AIN $HUMA
{spot}(HUMAUSDT)
{future}(AINUSDT)
{spot}(BTCUSDT)
#BitcoinSlipsBelow$80KAgain #CryptoMarket #BTC
🚨 BITCOIN DROPS BELOW $80K! 📉
BTC is trading at $79,628, below MA(7) at $81,042 and MA(25) at $82,509. Bears are gaining control!
🎯 Key Support: $75,867
📈 Recovery Zone: $81K+
Will Bitcoin bounce back or drop further? 👇."CLICK ON THE BELOW YELLOW COIN TAG TO GO TO DESIRED TRADING PAGE TO GET BENEFIT TRADE"$BTC $AIN $HUMA
1
70

·
--
Haussier
#BitcoinSlipsBelow$80KAgain Bitcoin Retraces Below $80K: Key Market Levels and Ecosystem Impact 📉
Bitcoin has once again dipped below the $80,000 threshold, prompting renewed attention from traders and analysts monitoring key psychological support levels in the current market cycle.
📰 Core News
BTC recently experienced a downward retracement, slipping back under the $80K mark. Such movements are a natural part of market dynamics and are often driven by a combination of factors, including macroeconomic data shifts, routine profit-taking after prior rallies, or the liquidation of over-leveraged positions in the derivatives market.
📊 Market Impact
• Bitcoin (BTC) The $80K level acts as a major psychological pivot. A sustained hold below this zone may lead to increased short-term volatility as the market searches for the next robust support level.
• Altcoin Market Historically, when Bitcoin tests or loses key support levels, altcoins can experience amplified price swings. Liquidity may temporarily rotate or pause as traders reassess risk exposure.
• Derivatives & Funding Watch for noticeable shifts in open interest and funding rates. A cooldown in leverage often indicates a healthier, more sustainable market structure forming after a correction.
💡 What’s Next?
Market participants are closely observing on-chain metrics, such as exchange net flows and whale accumulation patterns, to gauge whether this is a brief consolidation or the start of a deeper correction.
Let’s Discuss
What key support level are you watching next, and how do you think this retracement will shape the broader market narrative over the coming weeks? Share your thoughts below! 👇
#Bitcoin #CryptoMarket #BTCAnalysis #MarketUpdate #CryptoNews
This is for educational purposes only. Not Financial Advice (NFA). Always Do Your Own Research (DYOR).
$BTC $PARTI $OSMO
{spot}(OSMOUSDT)
{future}(PARTIUSDT)
{future}(BTCUSDT)
#BitcoinSlipsBelow$80KAgain Bitcoin Retraces Below $80K: Key Market Levels and Ecosystem Impact 📉
Bitcoin has once again dipped below the $80,000 threshold, prompting renewed attention from traders and analysts monitoring key psychological support levels in the current market cycle.
📰 Core News
BTC recently experienced a downward retracement, slipping back under the $80K mark. Such movements are a natural part of market dynamics and are often driven by a combination of factors, including macroeconomic data shifts, routine profit-taking after prior rallies, or the liquidation of over-leveraged positions in the derivatives market.
📊 Market Impact
• Bitcoin (BTC) The $80K level acts as a major psychological pivot. A sustained hold below this zone may lead to increased short-term volatility as the market searches for the next robust support level.
• Altcoin Market Historically, when Bitcoin tests or loses key support levels, altcoins can experience amplified price swings. Liquidity may temporarily rotate or pause as traders reassess risk exposure.
• Derivatives & Funding Watch for noticeable shifts in open interest and funding rates. A cooldown in leverage often indicates a healthier, more sustainable market structure forming after a correction.
💡 What’s Next?
Market participants are closely observing on-chain metrics, such as exchange net flows and whale accumulation patterns, to gauge whether this is a brief consolidation or the start of a deeper correction.
Let’s Discuss
What key support level are you watching next, and how do you think this retracement will shape the broader market narrative over the coming weeks? Share your thoughts below! 👇
#Bitcoin #CryptoMarket #BTCAnalysis #MarketUpdate #CryptoNews
This is for educational purposes only. Not Financial Advice (NFA). Always Do Your Own Research (DYOR).
$BTC $PARTI $OSMO

78

·
--

Article
BitcoinSlipsBelow$80KAgain: Market Reality, Liquidation Waves, and What Lies Ahead#BitcoinSlipsBelow$80KAgain
The cryptocurrency market has once again found itself gripped by intense volatility. Bitcoin (BTC) has faced heavy downward pressure, slipping beneath the crucial psychological and structural milestone of $80,000.
For months, $80K served as a closely watched psychological floor—and notably, it aligns close to the average cost basis for several corporate treasuries holding Bitcoin on their balance sheets. With prices dipping underneath this threshold, market participants are left scrambling to assess whether this is a temporary shakeout or the beginning of a deeper correction.
📉 The Reality Check: What Triggered the Drop?
Recent market downturns were not driven by a single catalyst, but rather a combination of macroeconomic headwinds, geopolitical tensions, and structural leverage unwinding:
Massive Long Liquidations: According to data from CoinGlass, the sudden slide triggered massive waves of liquidations. Over $800 million in leveraged positions were wiped out in a single 24-hour period, with overly optimistic long traders absorbing the vast majority of the losses as prices broke key supports.Macro & Geopolitical Pressures: Escalating geopolitical tensions in the Middle East and rising crude oil prices have severely dampened global risk appetite. With energy costs climbing, inflation fears have resurfaced, causing institutional investors to pull back from risk-on assets like crypto ahead of upcoming central bank decisions.Corporate Treasuries Underwater: Glassnode estimates indicate that Bitcoin slipping below $80,000 places the average corporate treasury position at an unrealized loss, adding psychological weight to the current market sentiment.📊 Bitcoin ($BTC ) Trade Plan{spot}(BTCUSDT)Note: The market is experiencing heightened volatility due to macroeconomic triggers and geopolitical tension. Focus on spot trading or use strict risk management for leveraged positions.
🟢 Scenario 1: Bullish Reclaim (Long Setup)
Trigger: BTC reclaims and closes a 4-hour candle above the $81,500 – $82,000 resistance zone.Entry Zone: $81,200 – $82,000Target 1: $84,500Target 2: $87,000Target 3: $92,000 – $94,000Stop Loss: $79,500 (Strict SL)
🔴 Scenario 2: Bearish Breakdown (Short Setup)
Trigger: Price breaks below the key $79,000 support level and closes a 1-hour/4-hour candle beneath it.Entry Zone: $78,800 – $79,200Target 1: $76,500Target 2: $74,200 (Liquidity gap fill)Target 3: $71,000 – $72,500Stop Loss: $80,800
🟡 Scenario 3: Demand Zone Accumulation (Spot Buying)
Strategy: Look for DCA (Dollar-Cost Averaging) spot buying opportunities if price drops into the key demand zone.Buy Zone: $74,000 – $76,500Long-Term Target: $88,000+Invalidation / Cut-Loss: Daily close below $72,000
🔍 Technical Outlook: Support and Resistance Zones
Analysts are closely monitoring key technical levels to gauge the next market direction:
Immediate Resistance: Bitcoin must reclaim and hold $83,000 to invalidate current bearish momentum and signal a return to stability.Downside Support: If selling continues, analysts point to immediate support around $77,876, with a broader, more substantial demand zone sitting between $72,500 and $76,700.
💡 Summary: Navigating the Volatility
Cover images capturing this moment—such as a stressed investor checking charts in a dimly lit diner—reflect the raw emotional reality of crypto trading during sudden flash crashes. However, seasoned market participants view these phases as a test of risk management rather than panic.
As leverage is flushed out of the system, the market ultimately purges excess speculation. Whether Bitcoin builds a base to bounce back or tests lower supports will depend heavily on macro developments and institutional capital flows in the coming days.
#bitcoin #BTC #CryptoMarket #CryptoNews
BitcoinSlipsBelow$80KAgain: Market Reality, Liquidation Waves, and What Lies Ahead
#BitcoinSlipsBelow$80KAgain
The cryptocurrency market has once again found itself gripped by intense volatility. Bitcoin (BTC) has faced heavy downward pressure, slipping beneath the crucial psychological and structural milestone of $80,000.
For months, $80K served as a closely watched psychological floor—and notably, it aligns close to the average cost basis for several corporate treasuries holding Bitcoin on their balance sheets. With prices dipping underneath this threshold, market participants are left scrambling to assess whether this is a temporary shakeout or the beginning of a deeper correction.
📉 The Reality Check: What Triggered the Drop?
Recent market downturns were not driven by a single catalyst, but rather a combination of macroeconomic headwinds, geopolitical tensions, and structural leverage unwinding:
Massive Long Liquidations: According to data from CoinGlass, the sudden slide triggered massive waves of liquidations. Over $800 million in leveraged positions were wiped out in a single 24-hour period, with overly optimistic long traders absorbing the vast majority of the losses as prices broke key supports.Macro & Geopolitical Pressures: Escalating geopolitical tensions in the Middle East and rising crude oil prices have severely dampened global risk appetite. With energy costs climbing, inflation fears have resurfaced, causing institutional investors to pull back from risk-on assets like crypto ahead of upcoming central bank decisions.Corporate Treasuries Underwater: Glassnode estimates indicate that Bitcoin slipping below $80,000 places the average corporate treasury position at an unrealized loss, adding psychological weight to the current market sentiment.📊 Bitcoin ($BTC ) Trade PlanNote: The market is experiencing heightened volatility due to macroeconomic triggers and geopolitical tension. Focus on spot trading or use strict risk management for leveraged positions.
🟢 Scenario 1: Bullish Reclaim (Long Setup)
Trigger: BTC reclaims and closes a 4-hour candle above the $81,500 – $82,000 resistance zone.Entry Zone: $81,200 – $82,000Target 1: $84,500Target 2: $87,000Target 3: $92,000 – $94,000Stop Loss: $79,500 (Strict SL)
🔴 Scenario 2: Bearish Breakdown (Short Setup)
Trigger: Price breaks below the key $79,000 support level and closes a 1-hour/4-hour candle beneath it.Entry Zone: $78,800 – $79,200Target 1: $76,500Target 2: $74,200 (Liquidity gap fill)Target 3: $71,000 – $72,500Stop Loss: $80,800
🟡 Scenario 3: Demand Zone Accumulation (Spot Buying)
Strategy: Look for DCA (Dollar-Cost Averaging) spot buying opportunities if price drops into the key demand zone.Buy Zone: $74,000 – $76,500Long-Term Target: $88,000+Invalidation / Cut-Loss: Daily close below $72,000
🔍 Technical Outlook: Support and Resistance Zones
Analysts are closely monitoring key technical levels to gauge the next market direction:
Immediate Resistance: Bitcoin must reclaim and hold $83,000 to invalidate current bearish momentum and signal a return to stability.Downside Support: If selling continues, analysts point to immediate support around $77,876, with a broader, more substantial demand zone sitting between $72,500 and $76,700.
💡 Summary: Navigating the Volatility
Cover images capturing this moment—such as a stressed investor checking charts in a dimly lit diner—reflect the raw emotional reality of crypto trading during sudden flash crashes. However, seasoned market participants view these phases as a test of risk management rather than panic.
As leverage is flushed out of the system, the market ultimately purges excess speculation. Whether Bitcoin builds a base to bounce back or tests lower supports will depend heavily on macro developments and institutional capital flows in the coming days.
#bitcoin #BTC #CryptoMarket #CryptoNews
56
·
--
#BitcoinSlipsBelow$80KAgain
Bitcoin ($BTC) briefly slipped below the psychological $80,000 baseline to test lower demand zones around $79,840. Increased cross-asset risk-off sentiment—driven by upcoming macro catalysts, corporate earnings volatility, and institutional portfolio rebalancing—triggered brief liquidation flushes across perpetual swap order books. However, high-frequency spot buying quickly emerged at lower support boundaries, driving a rapid price stabilization back into key horizontal trading ranges.
Market Analysis & Structural Liquidity
The brief dip below $80,000 cleared over-leveraged long positions, resetting funding rates across major exchanges.
Quantitative institutional desks on Binance Square are monitoring high-timeframe demand zones. While macro uncertainty keeps market participants cautious, sustained spot ETF demand and strong structural support along the $80,000 floor continue to prevent deeper structural breakdowns.
Core Structural Demand Zone ($BTC): $79,800–$80,200 serves as the primary institutional defense line defending high-timeframe market structure.
Highlighted Tradeable Asset (Digital Reserve Benchmark)
$BTC (Bitcoin): Dominant store-of-value asset; primary proxy for global macro liquidity and cross-market risk sentiment.
Current Spot Price: ~$82,680
Target 1 (Immediate Resistance): $84,200 – Primary horizontal overhead supply barrier.
Target 2 (Mid-Term Expansion): $87,500 – Structural momentum expansion boundary.
Key Support / Invalidation: $80,200 – Critical lower timeframe demand floor.
Will Bitcoin defend the $80,000 support floor for a push toward $85,000, or will macro volatility cause a deeper retest? Share your strategy below! 👇
Disclaimer: This post is for informational and educational purposes only and does not constitute financial advice. Digital assets carry high market risk; always conduct your own research (DYOR) before trading.
{spot}(BTCUSDT)
#bitcoin #BTC #cryptotrading #MarketAnalysis
#BitcoinSlipsBelow$80KAgain
Bitcoin ($BTC ) briefly slipped below the psychological $80,000 baseline to test lower demand zones around $79,840. Increased cross-asset risk-off sentiment—driven by upcoming macro catalysts, corporate earnings volatility, and institutional portfolio rebalancing—triggered brief liquidation flushes across perpetual swap order books. However, high-frequency spot buying quickly emerged at lower support boundaries, driving a rapid price stabilization back into key horizontal trading ranges.
Market Analysis & Structural Liquidity
The brief dip below $80,000 cleared over-leveraged long positions, resetting funding rates across major exchanges.
Quantitative institutional desks on Binance Square are monitoring high-timeframe demand zones. While macro uncertainty keeps market participants cautious, sustained spot ETF demand and strong structural support along the $80,000 floor continue to prevent deeper structural breakdowns.
Core Structural Demand Zone ($BTC ): $79,800–$80,200 serves as the primary institutional defense line defending high-timeframe market structure.
Highlighted Tradeable Asset (Digital Reserve Benchmark)
$BTC (Bitcoin): Dominant store-of-value asset; primary proxy for global macro liquidity and cross-market risk sentiment.
Current Spot Price: ~$82,680
Target 1 (Immediate Resistance): $84,200 – Primary horizontal overhead supply barrier.
Target 2 (Mid-Term Expansion): $87,500 – Structural momentum expansion boundary.
Key Support / Invalidation: $80,200 – Critical lower timeframe demand floor.
Will Bitcoin defend the $80,000 support floor for a push toward $85,000, or will macro volatility cause a deeper retest? Share your strategy below! 👇
Disclaimer: This post is for informational and educational purposes only and does not constitute financial advice. Digital assets carry high market risk; always conduct your own research (DYOR) before trading.
#bitcoin #BTC #cryptotrading #MarketAnalysis
119

·
--

Article
Bitcoin Flashes a Rare Signal vs Nasdaq: BTC Might Reach $100K as Earnings and the Fed Hit ?#FOMCWatch $BTC
BITCOIN VS NASDAQ: A BULLISH SIGNAL MEETS THE BIGGEST WEEK OF EARNINGS SEASON
Yes, that's me on the cover - because behind the charts and the market breakdowns, there’s a real trader watching every candle. Now that we’ve cleared that up, let's talk about what matters: Bitcoin has slipped under $80,000 heading into Fed week and Big Tech earnings. Yet one chart watched by long-term analysts is flashing a signal that has historically preceded big moves: the Bitcoin-to-Nasdaq ratio. Is this a trap or the early stage of a recovery? Here is the full picture.
1️⃣ THE SIGNAL: BTC/NASDAQ RECLAIMS ITS 200-DAY AVERAGE
According to Bitcoin Magazine analyst Sean Hagan (as reported by Benzinga):
🔹 The Bitcoin-to-Nasdaq Composite ratio reclaimed its 200-day moving average on Sept. 18, after 235 consecutive trading sessions below it. It has held above that level despite the recent equity sell-off.
🔹 In five of six comparable signals since 2015, Bitcoin gained over the following year, with a median return of about 84%.
🔹 The ratio fell 62% through June 30. Earlier cycle drawdowns were 87% (2015), 83% (2019) and 69% (2022), so this one was shallower.
🔹 Bitcoin's 90-day beta to the Nasdaq is now 0.75, versus 1.43 before the failed 2021 signal. Lower beta suggests BTC is starting to move more independently of tech.
🔹 Since the Nasdaq's Oct. 6 record high, the index is down 5.8% while Bitcoin is down about 5%.
🔹 The analyst sees a possible move to $100,000 by year-end.
⚠️ THE INVALIDATION LEVEL: A close below the ratio's 200-day average, equal to roughly $76,000-$77,000 for Bitcoin, would cancel the bullish setup.
2️⃣ REALITY CHECK: WHERE BTC TRADES RIGHT NOW
The signal is encouraging, but price action is still shaky:
• BTC dipped under $80,000 on Monday, touching about $79,300, its lowest level since mid-September. It is down more than 3% on the week.
• U.S. spot Bitcoin ETFs saw about $773M in net outflows last week.
• Analysts want BTC to reclaim about $82,500 (the level lost last Thursday) before calling this dip a pause.
• Ether and XRP fell about 3% in the same session, a sign of broad de-risking.
📐 THE MATH: From about $80,000, $100,000 by year-end needs roughly a 25% gain in about nine weeks. The distance to the $76,000-$77,000 invalidation zone is only about 4-5%. Risk and reward are both large, so position sizing matters.
3️⃣ THIS WEEK'S CATALYSTS
Wed, Oct 28: Fed decision, then Microsoft and Alphabet earnings after the close
Thu, Oct 29: Amazon earnings, plus Coinbase after the close (Confirm times on each company's investor relations page.)
THE FED
• CME FedWatch showed about a 90.6% chance of a hold at 3.75%-4% and about a 9.4% chance of a hike.
• The real question is the tone of Chair Warsh's press conference. Traders are watching for hints of a December hike.
• Brent crude is near $114, a six-month high, which keeps inflation worries alive.
BIG TECH
• Meta fell about 7% last Thursday after its free cash flow turned negative on heavy AI spending. That triggered a Nasdaq sell-off.
• Microsoft is guided to about 45% Azure growth. Amazon's AWS grew 37% last quarter. Alphabet's cloud and AI search commentary is in focus.
• The market now wants proof that AI spending produces returns, not just bigger budgets.
4️⃣ HOW EARNINGS COULD MOVE BITCOIN
🟢 SCENARIO A: Strong cloud numbers, calm Fed Tech rebounds, risk appetite improves, and BTC could reclaim $82,500. This would support the bullish ratio signal.
🟡 SCENARIO B: Mixed results, hawkish Fed tone Volatility rises and BTC chops around $76,000-$82,000 while traders wait for clarity.
🔴 SCENARIO C: Capex fears return, rate-hike worries build A broader risk-off move could push BTC toward the $76,000-$77,000 zone. A daily close below it would weaken the bullish case.
The key point is that Bitcoin's falling beta to tech is a hopeful sign, but it has not proven independence yet. Both stocks and BTC are reacting to the same macro forces: rates, oil and AI sentiment.
5️⃣ TRADER'S CHECKLIST
✅ Watch the $82,500 reclaim and the $76,000-$77,000 invalidation zone.
✅ Expect volatility around the Fed press conference and after-hours earnings.
✅ Historical signals show a tendency, not a guarantee. Sample sizes are small, and a failed breakout remains possible.
✅ Track spot ETF flows for confirmation.
✅ Use defined risk. Gaps can skip stop-loss levels.
✅ If you trade tokenized stocks around earnings, check each product's rights, trading hours and liquidity first.
🎯 MY TAKE
The relative-strength signal is a genuine positive and the history is encouraging. But with BTC below $80K, ETF outflows, a possible hawkish Fed and shaky tech sentiment, $100K by year-end is an upside scenario, not a base case. This week gives us the first real evidence either way.
💬 YOUR TURN: Will Bitcoin hold above the $76K-$77K zone this week? Bullish or bearish, and what's your year-end target?
Drop your view below 👇 and test your earnings calls in the Finance Earnings section of Binance Pick.
Not financial advice. Always DYOR.
Like & Follow for Daily Trade Analytics & Insider News. @SarwatAK
#BTC #BitcoinSlipsBelow$80KAgain #EthereumDropsBelow$2300
{spot}(BTCUSDT)
Bitcoin Flashes a Rare Signal vs Nasdaq: BTC Might Reach $100K as Earnings and the Fed Hit ?
#FOMCWatch $BTC
BITCOIN VS NASDAQ: A BULLISH SIGNAL MEETS THE BIGGEST WEEK OF EARNINGS SEASON
Yes, that's me on the cover - because behind the charts and the market breakdowns, there’s a real trader watching every candle. Now that we’ve cleared that up, let's talk about what matters: Bitcoin has slipped under $80,000 heading into Fed week and Big Tech earnings. Yet one chart watched by long-term analysts is flashing a signal that has historically preceded big moves: the Bitcoin-to-Nasdaq ratio. Is this a trap or the early stage of a recovery? Here is the full picture.
1️⃣ THE SIGNAL: BTC/NASDAQ RECLAIMS ITS 200-DAY AVERAGE
According to Bitcoin Magazine analyst Sean Hagan (as reported by Benzinga):
🔹 The Bitcoin-to-Nasdaq Composite ratio reclaimed its 200-day moving average on Sept. 18, after 235 consecutive trading sessions below it. It has held above that level despite the recent equity sell-off.
🔹 In five of six comparable signals since 2015, Bitcoin gained over the following year, with a median return of about 84%.
🔹 The ratio fell 62% through June 30. Earlier cycle drawdowns were 87% (2015), 83% (2019) and 69% (2022), so this one was shallower.
🔹 Bitcoin's 90-day beta to the Nasdaq is now 0.75, versus 1.43 before the failed 2021 signal. Lower beta suggests BTC is starting to move more independently of tech.
🔹 Since the Nasdaq's Oct. 6 record high, the index is down 5.8% while Bitcoin is down about 5%.
🔹 The analyst sees a possible move to $100,000 by year-end.
⚠️ THE INVALIDATION LEVEL: A close below the ratio's 200-day average, equal to roughly $76,000-$77,000 for Bitcoin, would cancel the bullish setup.
2️⃣ REALITY CHECK: WHERE BTC TRADES RIGHT NOW
The signal is encouraging, but price action is still shaky:
• BTC dipped under $80,000 on Monday, touching about $79,300, its lowest level since mid-September. It is down more than 3% on the week.
• U.S. spot Bitcoin ETFs saw about $773M in net outflows last week.
• Analysts want BTC to reclaim about $82,500 (the level lost last Thursday) before calling this dip a pause.
• Ether and XRP fell about 3% in the same session, a sign of broad de-risking.
📐 THE MATH: From about $80,000, $100,000 by year-end needs roughly a 25% gain in about nine weeks. The distance to the $76,000-$77,000 invalidation zone is only about 4-5%. Risk and reward are both large, so position sizing matters.
3️⃣ THIS WEEK'S CATALYSTS
Wed, Oct 28: Fed decision, then Microsoft and Alphabet earnings after the close
Thu, Oct 29: Amazon earnings, plus Coinbase after the close (Confirm times on each company's investor relations page.)
THE FED
• CME FedWatch showed about a 90.6% chance of a hold at 3.75%-4% and about a 9.4% chance of a hike.
• The real question is the tone of Chair Warsh's press conference. Traders are watching for hints of a December hike.
• Brent crude is near $114, a six-month high, which keeps inflation worries alive.
BIG TECH
• Meta fell about 7% last Thursday after its free cash flow turned negative on heavy AI spending. That triggered a Nasdaq sell-off.
• Microsoft is guided to about 45% Azure growth. Amazon's AWS grew 37% last quarter. Alphabet's cloud and AI search commentary is in focus.
• The market now wants proof that AI spending produces returns, not just bigger budgets.
4️⃣ HOW EARNINGS COULD MOVE BITCOIN
🟢 SCENARIO A: Strong cloud numbers, calm Fed Tech rebounds, risk appetite improves, and BTC could reclaim $82,500. This would support the bullish ratio signal.
🟡 SCENARIO B: Mixed results, hawkish Fed tone Volatility rises and BTC chops around $76,000-$82,000 while traders wait for clarity.
🔴 SCENARIO C: Capex fears return, rate-hike worries build A broader risk-off move could push BTC toward the $76,000-$77,000 zone. A daily close below it would weaken the bullish case.
The key point is that Bitcoin's falling beta to tech is a hopeful sign, but it has not proven independence yet. Both stocks and BTC are reacting to the same macro forces: rates, oil and AI sentiment.
5️⃣ TRADER'S CHECKLIST
✅ Watch the $82,500 reclaim and the $76,000-$77,000 invalidation zone.
✅ Expect volatility around the Fed press conference and after-hours earnings.
✅ Historical signals show a tendency, not a guarantee. Sample sizes are small, and a failed breakout remains possible.
✅ Track spot ETF flows for confirmation.
✅ Use defined risk. Gaps can skip stop-loss levels.
✅ If you trade tokenized stocks around earnings, check each product's rights, trading hours and liquidity first.
🎯 MY TAKE
The relative-strength signal is a genuine positive and the history is encouraging. But with BTC below $80K, ETF outflows, a possible hawkish Fed and shaky tech sentiment, $100K by year-end is an upside scenario, not a base case. This week gives us the first real evidence either way.
💬 YOUR TURN: Will Bitcoin hold above the $76K-$77K zone this week? Bullish or bearish, and what's your year-end target?
Drop your view below 👇 and test your earnings calls in the Finance Earnings section of Binance Pick.
Not financial advice. Always DYOR.
Like & Follow for Daily Trade Analytics & Insider News. @SarwatAK
#BTC #BitcoinSlipsBelow$80KAgain #EthereumDropsBelow$2300
1
41


Article
LA ECUACIÓN DE LA CORRECCIÓN: $BTC PIERDE LOS $80K 🚨#bitcoinslipsbelow$80kagain
¡Los alcistas han perdido oficialmente la línea psicológica que no debían cruzar! Analicemos la última caída de Bitcoin usando matemáticas puras 🧮👇
(Pérdida de la media móvil) + (Ventas por aversión al riesgo) = Prueba de soporte clave 📉
Esta es la fórmula técnica exacta que impulsa el mercado hoy:
El precio:
(La ruptura) = Bitcoin ha caído oficialmente por debajo del nivel crítico de $80,000 y actualmente cotiza a $79,628 en el gráfico de perpetuos de Binance.
La realidad del gráfico:
(Daño técnico) ➔ Según los datos del gráfico, BTC ha perdido de forma decisiva sus indicadores de impulso a corto plazo, cayendo por debajo tanto de la MA(7), en $81,042, como de la MA(25), en $82,509.
El análisis:
Con el mínimo de las últimas 24 horas tocando los $79,429, los bajistas tienen firmemente el control de la tendencia inmediata. El precio está ahora atrapado en una trayectoria descendente, lo que convierte a la MA(99) de largo plazo, situada en $75,867, en la próxima línea de defensa estructural importante para los alcistas. Si los compradores no logran recuperar rápidamente la zona de los $81K, es muy probable que se produzca una caída más profunda.
¿Estás comprando esta caída o esperando a que baje más? ¡Debatamos! 👇💬
LA ECUACIÓN DE LA CORRECCIÓN: $BTC PIERDE LOS $80K 🚨
#bitcoinslipsbelow$80kagain
¡Los alcistas han perdido oficialmente la línea psicológica que no debían cruzar! Analicemos la última caída de Bitcoin usando matemáticas puras 🧮👇
(Pérdida de la media móvil) + (Ventas por aversión al riesgo) = Prueba de soporte clave 📉
Esta es la fórmula técnica exacta que impulsa el mercado hoy:
El precio:
(La ruptura) = Bitcoin ha caído oficialmente por debajo del nivel crítico de $80,000 y actualmente cotiza a $79,628 en el gráfico de perpetuos de Binance.
La realidad del gráfico:
(Daño técnico) ➔ Según los datos del gráfico, BTC ha perdido de forma decisiva sus indicadores de impulso a corto plazo, cayendo por debajo tanto de la MA(7), en $81,042, como de la MA(25), en $82,509.
El análisis:
Con el mínimo de las últimas 24 horas tocando los $79,429, los bajistas tienen firmemente el control de la tendencia inmediata. El precio está ahora atrapado en una trayectoria descendente, lo que convierte a la MA(99) de largo plazo, situada en $75,867, en la próxima línea de defensa estructural importante para los alcistas. Si los compradores no logran recuperar rápidamente la zona de los $81K, es muy probable que se produzca una caída más profunda.
¿Estás comprando esta caída o esperando a que baje más? ¡Debatamos! 👇💬
86

·
--
Haussier
Bitcoin vừa làm một cú "quay xe" nhẹ về đầu 79k, khiến dân tình nháo nhào hô hào #BitcoinSlipsBelow$80KAgain ! Phân tích chi tiết cho thấy: 24h qua cụ tăng có 0.42%, lẹt đẹt như thể hết xăng. Thêm quả bầu cử giữa nhiệm kỳ Mỹ khiến nến chạy giật cục, rồi mô phỏng 10.000 kịch bản của Willy Woo bảo 2033 lên 1 triệu đô làm anh em "bán tín bán nghi".
Trader phải làm gì lúc này?
1️⃣ Đừng hoảng loạn: Glassnode bảo áp lực bán giảm rồi, vị thế này ngon hơn tháng trước.
2️⃣ Tắt app đi ngủ, chờ cụ tích lũy hoặc "về bờ".
3️⃣ Thắt dây an toàn, chuẩn bị cho đỉnh 2028!
Đây không phải lời khuyên tài chính! Đăng ký Binance ngay để bắt đáy: [binance.com](https://www.binance.com/register?ref=VINHTOCDO) (Mã giới thiệu: VINHTOCDO).
Click giao dịch bên dưới để ủng hộ tôi:
$BTC
{spot}(BTCUSDT)
$ETH
{spot}(ETHUSDT)
$BNB
{spot}(BNBUSDT)
#VINHTOCDO #CryptoTrading #BitcoinUpdate #CryptoNews #BullRun #Altcoins
Bitcoin vừa làm một cú "quay xe" nhẹ về đầu 79k, khiến dân tình nháo nhào hô hào #BitcoinSlipsBelow$80KAgain ! Phân tích chi tiết cho thấy: 24h qua cụ tăng có 0.42%, lẹt đẹt như thể hết xăng. Thêm quả bầu cử giữa nhiệm kỳ Mỹ khiến nến chạy giật cục, rồi mô phỏng 10.000 kịch bản của Willy Woo bảo 2033 lên 1 triệu đô làm anh em "bán tín bán nghi".
Trader phải làm gì lúc này?
1️⃣ Đừng hoảng loạn: Glassnode bảo áp lực bán giảm rồi, vị thế này ngon hơn tháng trước.
2️⃣ Tắt app đi ngủ, chờ cụ tích lũy hoặc "về bờ".
3️⃣ Thắt dây an toàn, chuẩn bị cho đỉnh 2028!
Đây không phải lời khuyên tài chính! Đăng ký Binance ngay để bắt đáy: binance.com (Mã giới thiệu: VINHTOCDO).
Click giao dịch bên dưới để ủng hộ tôi:
$BTC
$ETH
$BNB
#VINHTOCDO #CryptoTrading #BitcoinUpdate #CryptoNews #BullRun #Altcoins

5
315

·
--
Haussier
#BitcoinSlipsBelow$80KAgain bitcoinslipsbelow$80kagain Bitcoin vuelve a caer por debajo de los $80K. La volatilidad regresa al mercado mientras los inversores evalúan las condiciones macroeconómicas y los flujos de los ETF. ¿Corrección temporal o inicio de una nueva fase? 👀📉 #Bitcoin #BTC $BTC
{spot}(BTCUSDT)
#BitcoinSlipsBelow$80KAgain bitcoinslipsbelow$80kagain Bitcoin vuelve a caer por debajo de los $80K. La volatilidad regresa al mercado mientras los inversores evalúan las condiciones macroeconómicas y los flujos de los ETF. ¿Corrección temporal o inicio de una nueva fase? 👀📉 #Bitcoin #BTC $BTC
2

#BitcoinSlipsBelow$80KAgain
A batalha entre compradores e vendedores continua intensa.
O Bitcoin voltou a perder o suporte dos 80.000 dólares.
Para uns, a quebra deste nível é um sinal de alerta que aciona ordens automáticas de stop-loss. Para os investidores de longo prazo, representa uma janela de acumulação estratégica em zonas de suporte fundamentais.
A grande questão é separar o ruído da tendência. O mercado mudou de humor: da euforia para a cautela. Fique atento aos dados reais:
1. Volume de negociação.
2. Entradas e saídas nos ETFs à vista.
Recuperar os 80.000 dólares com força valida a estrutura altista mais ampla. Caso contrário, o próximo grande suporte técnico é na zona dos 75.000 dólares.
Neste cenário, a gestão de risco rigorosa e a paciência são os seus maiores ativos.
$HUMA $BANK $BTC
#Bitcoin #BTC #Trading
{spot}(HUMAUSDT)
{spot}(BANKUSDT)
{spot}(BTCUSDT)
#BitcoinSlipsBelow$80KAgain
A batalha entre compradores e vendedores continua intensa.
O Bitcoin voltou a perder o suporte dos 80.000 dólares.
Para uns, a quebra deste nível é um sinal de alerta que aciona ordens automáticas de stop-loss. Para os investidores de longo prazo, representa uma janela de acumulação estratégica em zonas de suporte fundamentais.
A grande questão é separar o ruído da tendência. O mercado mudou de humor: da euforia para a cautela. Fique atento aos dados reais:
1. Volume de negociação.
2. Entradas e saídas nos ETFs à vista.
Recuperar os 80.000 dólares com força valida a estrutura altista mais ampla. Caso contrário, o próximo grande suporte técnico é na zona dos 75.000 dólares.
Neste cenário, a gestão de risco rigorosa e a paciência são os seus maiores ativos.
$HUMA $BANK $BTC
#Bitcoin #BTC #Trading

82

·
--
#BitcoinSlipsBelow$80KAgain
Bitcoin fiyatı yeniden 80.000$ seviyesinin altına geriledi
📉 Sert Düşüş: Kripto para piyasalarında satış baskısı arttı.₿ Bitcoin (BTC): Önemli bir psikolojik destek seviyesi olan 80.000$ sınırını koruyamadı.🔻 Geri Çekilme: Ayıların baskısıyla fiyatlar kırmızı bölgeye doğru kaydı.💸 Yatırımcı Tedirgin: Piyasada kısa vadeli kar realizasyonları ve panik satışları gözleniyor.
$BTC $BR $ZEC
{future}(ZECUSDT)
{alpha}(560xff7d6a96ae471bbcd7713af9cb1feeb16cf56b41)
{future}(BTCUSDT)
#BitcoinSlipsBelow$80KAgain
Bitcoin fiyatı yeniden 80.000$ seviyesinin altına geriledi
📉 Sert Düşüş: Kripto para piyasalarında satış baskısı arttı.₿ Bitcoin (BTC): Önemli bir psikolojik destek seviyesi olan 80.000$ sınırını koruyamadı.🔻 Geri Çekilme: Ayıların baskısıyla fiyatlar kırmızı bölgeye doğru kaydı.💸 Yatırımcı Tedirgin: Piyasada kısa vadeli kar realizasyonları ve panik satışları gözleniyor.
$BTC $BR $ZEC

148
Connectez-vous pour découvrir plus de contenu
Rejoignez la communauté mondiale des adeptes de cryptomonnaies sur Binance Square
⚡️ Suviez les dernières informations importantes sur les cryptomonnaies.
💬 Jugé digne de confiance par la plus grande plateforme d’échange de cryptomonnaies au monde.
👍 Découvrez les connaissances que partagent les créateurs vérifiés.
Adresse e-mail/Nº de téléphone
Sujets d’actualité
1
#CanMicrosoftDeliverOnAI
3,005 vues
145 mentions
2
#CanGoogleDefindItsCore
2,342 vues
138 mentions
3
#FOMCWatch
9M vues
27,312 mentions
4
#EthereumDropsBelow$2300
5,763 vues
117 mentions
5
#BitcoinSlipsBelow$80KAgain
18,957 vues
85 mentions
6
#ThailandLaunchesWORPTStablecoinToQRPaymentApp
33,518 vues
562 mentions
7
#StrategySkipsBitcoinPurchasesSpends$205MOnSTRCBuybacks
8,285 vues
85 mentions
8
#BitmineAdds10452ETH
72,026 vues
955 mentions
9
#SouthKoreaConsidersEducationTaxOnCryptoExchanges
38,551 vues
713 mentions
10
#OCCUrgesCommunityBanksToEnterStablecoinPayments
29,948 vues
505 mentions