

#bubblemaps
bubblemaps
5.9M vues
30,768 mentions
Populaire
Récents

·
--

Article
I Tested the New Bubblemaps — Here’s What Actually ChangedI Tested the New Bubblemaps — Here’s What Actually Changed 🔍
When I receive a new tool for traders, I prefer to test it myself before talking about it.
So today I spent time exploring the revamped @bubblemaps platform and testing its new features with real tokens.
And I think the biggest change is simple:
Bubblemaps is no longer just a place where you look at bubbles. It is becoming a complete token discovery and research platform.
You can discover a token, investigate its holder structure, check wallet connections, analyze historical distribution and even swap — without leaving the platform.
Here is what I tested personally.
1. Trending & Fresh Token Discovery
I started from the new token feed.
Instead of searching for a specific project, I could browse tokens currently gaining activity and immediately see important market information such as:
Market Cap | Price | Price Change | Volume | Liquidity | Bubblemaps Score
The feed can also be filtered by blockchain and launchpad.
I tested the chain filter with BNB Chain, then combined it with the Fourmeme launchpad filter.
The platform supports many networks including Solana, Ethereum, BNB Chain, Base, Arbitrum, Polygon, Avalanche, Tron, TON and Arc, among others.
For traders hunting for new opportunities, having discovery and preliminary analysis in the same interface saves a lot of unnecessary switching between platforms.
2. Instant Bubble Map Before Opening a Token
This was one of the simplest features, but also one of my favorites.
I hovered my mouse over a token in the feed and Bubblemaps immediately displayed a miniature Bubble Map.
No need to open another page.
You can get an immediate visual impression of the holder structure before deciding whether the project deserves deeper research.
For someone scanning many projects every day, this is useful.
3. Bubblemaps Score
The feed also gives every analyzed token a Bubblemaps Score.
During my test I found projects with relatively high scores and others with significantly lower scores — for example, one token in my feed showed 58 while others were above 80.
This gives you another quick screening layer before opening the full analysis.
The score is designed to help flag potentially concerning structures such as insider clusters and bundled wallets.
I would still never make a trading decision based on one score alone — but as a first filter, it gives me another piece of information to investigate.
4. Wallet Clusters Become Immediately Visible
After opening a token, the full Bubble Map shows how major wallets are distributed and connected.
During my testing I could see separate clusters containing multiple connected addresses and the percentage of supply associated with each cluster.
I could then select individual bubbles and inspect information such as:
wallet balance, percentage of supply, transfers, wallet type and known labels.
Some addresses were automatically labeled by Bubblemaps — including exchange, liquidity and creator-related addresses.
This is where the visualization becomes much more useful than simply looking at a traditional holder list.
5. This Was Probably My Favorite Feature
I clicked an older candle on the price chart.
Bubblemaps asked whether I wanted to move the Bubble Map to that exact point in time.
I selected Yes.
And the holder map changed to the historical distribution from that moment.
That means I could compare:
What was the price doing?
with:
How was the token supply distributed at exactly that time?
I tested this again by moving to the earliest available date of another token. The difference between its initial holder structure and its current distribution was immediately visible.
For research, I find this considerably more useful than seeing only today's holder distribution.
6. Wallet Labels
Another feature I tested was wallet labeling.
Instead of showing only long blockchain addresses, Bubblemaps identified some wallets and contracts with recognizable labels.
This makes the map much easier to investigate because you can distinguish known entities from unidentified wallets.
According to Bubblemaps, wallet labels are reviewed by professional on-chain sleuths.
Of course, a label or wallet connection should not automatically be interpreted as proof of wrongdoing. It is information that can help you decide what deserves further investigation.
7. Powerful Filters
I also tested the filtering system.
You can narrow the token feed using blockchain, launchpad and additional criteria, while market columns allow you to organize projects using information such as price, volume and liquidity.
I tested combinations such as:
BNB Chain → Fourmeme → additional token filters
The feed updated immediately based on my selections.
This can be particularly useful when you don't want to search through hundreds of unrelated tokens.
8. Token Boosting Is Built Into the Platform
Bubblemaps also has its own token boosting system.
I opened it during my test.
Projects can purchase Bolts ⚡ to increase their visibility in the feed. The interface showed different Bolt packages, a 24-hour boost period and a discount when paying with $BMT .
This means discovery and project promotion are also becoming part of the same ecosystem.
9. You Can Even Swap Without Leaving Bubblemaps
Finally, I tested the integrated swap interface — without executing a transaction.
The interface allows users to Buy / Sell directly inside Bubblemaps.
I opened the transaction settings and confirmed a displayed:
Platform fee: 0.5%
The interface also provides slippage settings, transaction priority and MEV protection.
This completes the idea behind the new platform:
Find → Vet → Analyze → Buy
without having to leave Bubblemaps.
My Experience After Testing It
For me, the most interesting part of this update isn't one individual feature.
It's the fact that everything is being brought together.
Previously, a trader might discover a token on one platform, check holders somewhere else, investigate wallets with another tool and finally move to a DEX to trade it.
Bubblemaps is trying to compress that process into one workflow.
And when dealing with new or highly speculative tokens, having more information before pressing Buy matters.
No analytics platform can make a token automatically safe, and tools should never replace your own risk management.
But giving traders faster access to holder concentration, wallet relationships, historical distribution and on-chain context can help them identify risks they otherwise might never notice.
After testing the revamped platform myself, I can say that Bubblemaps has moved significantly beyond the simple bubble visualization I originally associated with it.
Discover the token.
Check the structure.
Investigate the wallets.
Compare the history.
Then make your own decision.
That is the workflow that makes sense to me.
🔍 @bubblemaps
🫧 $BMT
#Bubblemaps
{spot}(BMTUSDT)
Always DYOR.
I Tested the New Bubblemaps — Here’s What Actually Changed
I Tested the New Bubblemaps — Here’s What Actually Changed 🔍
When I receive a new tool for traders, I prefer to test it myself before talking about it.
So today I spent time exploring the revamped @Bubblemaps.io platform and testing its new features with real tokens.
And I think the biggest change is simple:
Bubblemaps is no longer just a place where you look at bubbles. It is becoming a complete token discovery and research platform.
You can discover a token, investigate its holder structure, check wallet connections, analyze historical distribution and even swap — without leaving the platform.
Here is what I tested personally.
1. Trending & Fresh Token Discovery
I started from the new token feed.
Instead of searching for a specific project, I could browse tokens currently gaining activity and immediately see important market information such as:
Market Cap | Price | Price Change | Volume | Liquidity | Bubblemaps Score
The feed can also be filtered by blockchain and launchpad.
I tested the chain filter with BNB Chain, then combined it with the Fourmeme launchpad filter.
The platform supports many networks including Solana, Ethereum, BNB Chain, Base, Arbitrum, Polygon, Avalanche, Tron, TON and Arc, among others.
For traders hunting for new opportunities, having discovery and preliminary analysis in the same interface saves a lot of unnecessary switching between platforms.
2. Instant Bubble Map Before Opening a Token
This was one of the simplest features, but also one of my favorites.
I hovered my mouse over a token in the feed and Bubblemaps immediately displayed a miniature Bubble Map.
No need to open another page.
You can get an immediate visual impression of the holder structure before deciding whether the project deserves deeper research.
For someone scanning many projects every day, this is useful.
3. Bubblemaps Score
The feed also gives every analyzed token a Bubblemaps Score.
During my test I found projects with relatively high scores and others with significantly lower scores — for example, one token in my feed showed 58 while others were above 80.
This gives you another quick screening layer before opening the full analysis.
The score is designed to help flag potentially concerning structures such as insider clusters and bundled wallets.
I would still never make a trading decision based on one score alone — but as a first filter, it gives me another piece of information to investigate.
4. Wallet Clusters Become Immediately Visible
After opening a token, the full Bubble Map shows how major wallets are distributed and connected.
During my testing I could see separate clusters containing multiple connected addresses and the percentage of supply associated with each cluster.
I could then select individual bubbles and inspect information such as:
wallet balance, percentage of supply, transfers, wallet type and known labels.
Some addresses were automatically labeled by Bubblemaps — including exchange, liquidity and creator-related addresses.
This is where the visualization becomes much more useful than simply looking at a traditional holder list.
5. This Was Probably My Favorite Feature
I clicked an older candle on the price chart.
Bubblemaps asked whether I wanted to move the Bubble Map to that exact point in time.
I selected Yes.
And the holder map changed to the historical distribution from that moment.
That means I could compare:
What was the price doing?
with:
How was the token supply distributed at exactly that time?
I tested this again by moving to the earliest available date of another token. The difference between its initial holder structure and its current distribution was immediately visible.
For research, I find this considerably more useful than seeing only today's holder distribution.
6. Wallet Labels
Another feature I tested was wallet labeling.
Instead of showing only long blockchain addresses, Bubblemaps identified some wallets and contracts with recognizable labels.
This makes the map much easier to investigate because you can distinguish known entities from unidentified wallets.
According to Bubblemaps, wallet labels are reviewed by professional on-chain sleuths.
Of course, a label or wallet connection should not automatically be interpreted as proof of wrongdoing. It is information that can help you decide what deserves further investigation.
7. Powerful Filters
I also tested the filtering system.
You can narrow the token feed using blockchain, launchpad and additional criteria, while market columns allow you to organize projects using information such as price, volume and liquidity.
I tested combinations such as:
BNB Chain → Fourmeme → additional token filters
The feed updated immediately based on my selections.
This can be particularly useful when you don't want to search through hundreds of unrelated tokens.
8. Token Boosting Is Built Into the Platform
Bubblemaps also has its own token boosting system.
I opened it during my test.
Projects can purchase Bolts ⚡ to increase their visibility in the feed. The interface showed different Bolt packages, a 24-hour boost period and a discount when paying with $BMT .
This means discovery and project promotion are also becoming part of the same ecosystem.
9. You Can Even Swap Without Leaving Bubblemaps
Finally, I tested the integrated swap interface — without executing a transaction.
The interface allows users to Buy / Sell directly inside Bubblemaps.
I opened the transaction settings and confirmed a displayed:
Platform fee: 0.5%
The interface also provides slippage settings, transaction priority and MEV protection.
This completes the idea behind the new platform:
Find → Vet → Analyze → Buy
without having to leave Bubblemaps.
My Experience After Testing It
For me, the most interesting part of this update isn't one individual feature.
It's the fact that everything is being brought together.
Previously, a trader might discover a token on one platform, check holders somewhere else, investigate wallets with another tool and finally move to a DEX to trade it.
Bubblemaps is trying to compress that process into one workflow.
And when dealing with new or highly speculative tokens, having more information before pressing Buy matters.
No analytics platform can make a token automatically safe, and tools should never replace your own risk management.
But giving traders faster access to holder concentration, wallet relationships, historical distribution and on-chain context can help them identify risks they otherwise might never notice.
After testing the revamped platform myself, I can say that Bubblemaps has moved significantly beyond the simple bubble visualization I originally associated with it.
Discover the token.
Check the structure.
Investigate the wallets.
Compare the history.
Then make your own decision.
That is the workflow that makes sense to me.
🔍 @Bubblemaps.io
🫧 $BMT
#Bubblemaps
Always DYOR.
When I receive a new tool for traders, I prefer to test it myself before talking about it.
So today I spent time exploring the revamped @Bubblemaps.io platform and testing its new features with real tokens.
And I think the biggest change is simple:
Bubblemaps is no longer just a place where you look at bubbles. It is becoming a complete token discovery and research platform.
You can discover a token, investigate its holder structure, check wallet connections, analyze historical distribution and even swap — without leaving the platform.
Here is what I tested personally.
1. Trending & Fresh Token Discovery
I started from the new token feed.
Instead of searching for a specific project, I could browse tokens currently gaining activity and immediately see important market information such as:
Market Cap | Price | Price Change | Volume | Liquidity | Bubblemaps Score
The feed can also be filtered by blockchain and launchpad.
I tested the chain filter with BNB Chain, then combined it with the Fourmeme launchpad filter.
The platform supports many networks including Solana, Ethereum, BNB Chain, Base, Arbitrum, Polygon, Avalanche, Tron, TON and Arc, among others.
For traders hunting for new opportunities, having discovery and preliminary analysis in the same interface saves a lot of unnecessary switching between platforms.
2. Instant Bubble Map Before Opening a Token
This was one of the simplest features, but also one of my favorites.
I hovered my mouse over a token in the feed and Bubblemaps immediately displayed a miniature Bubble Map.
No need to open another page.
You can get an immediate visual impression of the holder structure before deciding whether the project deserves deeper research.
For someone scanning many projects every day, this is useful.
3. Bubblemaps Score
The feed also gives every analyzed token a Bubblemaps Score.
During my test I found projects with relatively high scores and others with significantly lower scores — for example, one token in my feed showed 58 while others were above 80.
This gives you another quick screening layer before opening the full analysis.
The score is designed to help flag potentially concerning structures such as insider clusters and bundled wallets.
I would still never make a trading decision based on one score alone — but as a first filter, it gives me another piece of information to investigate.
4. Wallet Clusters Become Immediately Visible
After opening a token, the full Bubble Map shows how major wallets are distributed and connected.
During my testing I could see separate clusters containing multiple connected addresses and the percentage of supply associated with each cluster.
I could then select individual bubbles and inspect information such as:
wallet balance, percentage of supply, transfers, wallet type and known labels.
Some addresses were automatically labeled by Bubblemaps — including exchange, liquidity and creator-related addresses.
This is where the visualization becomes much more useful than simply looking at a traditional holder list.
5. This Was Probably My Favorite Feature
I clicked an older candle on the price chart.
Bubblemaps asked whether I wanted to move the Bubble Map to that exact point in time.
I selected Yes.
And the holder map changed to the historical distribution from that moment.
That means I could compare:
What was the price doing?
with:
How was the token supply distributed at exactly that time?
I tested this again by moving to the earliest available date of another token. The difference between its initial holder structure and its current distribution was immediately visible.
For research, I find this considerably more useful than seeing only today's holder distribution.
6. Wallet Labels
Another feature I tested was wallet labeling.
Instead of showing only long blockchain addresses, Bubblemaps identified some wallets and contracts with recognizable labels.
This makes the map much easier to investigate because you can distinguish known entities from unidentified wallets.
According to Bubblemaps, wallet labels are reviewed by professional on-chain sleuths.
Of course, a label or wallet connection should not automatically be interpreted as proof of wrongdoing. It is information that can help you decide what deserves further investigation.
7. Powerful Filters
I also tested the filtering system.
You can narrow the token feed using blockchain, launchpad and additional criteria, while market columns allow you to organize projects using information such as price, volume and liquidity.
I tested combinations such as:
BNB Chain → Fourmeme → additional token filters
The feed updated immediately based on my selections.
This can be particularly useful when you don't want to search through hundreds of unrelated tokens.
8. Token Boosting Is Built Into the Platform
Bubblemaps also has its own token boosting system.
I opened it during my test.
Projects can purchase Bolts ⚡ to increase their visibility in the feed. The interface showed different Bolt packages, a 24-hour boost period and a discount when paying with $BMT .
This means discovery and project promotion are also becoming part of the same ecosystem.
9. You Can Even Swap Without Leaving Bubblemaps
Finally, I tested the integrated swap interface — without executing a transaction.
The interface allows users to Buy / Sell directly inside Bubblemaps.
I opened the transaction settings and confirmed a displayed:
Platform fee: 0.5%
The interface also provides slippage settings, transaction priority and MEV protection.
This completes the idea behind the new platform:
Find → Vet → Analyze → Buy
without having to leave Bubblemaps.
My Experience After Testing It
For me, the most interesting part of this update isn't one individual feature.
It's the fact that everything is being brought together.
Previously, a trader might discover a token on one platform, check holders somewhere else, investigate wallets with another tool and finally move to a DEX to trade it.
Bubblemaps is trying to compress that process into one workflow.
And when dealing with new or highly speculative tokens, having more information before pressing Buy matters.
No analytics platform can make a token automatically safe, and tools should never replace your own risk management.
But giving traders faster access to holder concentration, wallet relationships, historical distribution and on-chain context can help them identify risks they otherwise might never notice.
After testing the revamped platform myself, I can say that Bubblemaps has moved significantly beyond the simple bubble visualization I originally associated with it.
Discover the token.
Check the structure.
Investigate the wallets.
Compare the history.
Then make your own decision.
That is the workflow that makes sense to me.
🔍 @Bubblemaps.io
🫧 $BMT
#Bubblemaps
Always DYOR.
AngelOfCrypto_-:
nice
5
2
10
20.2k

·
--
Vérifié
Bubblemaps V2 Makes Token Research Much More Practical
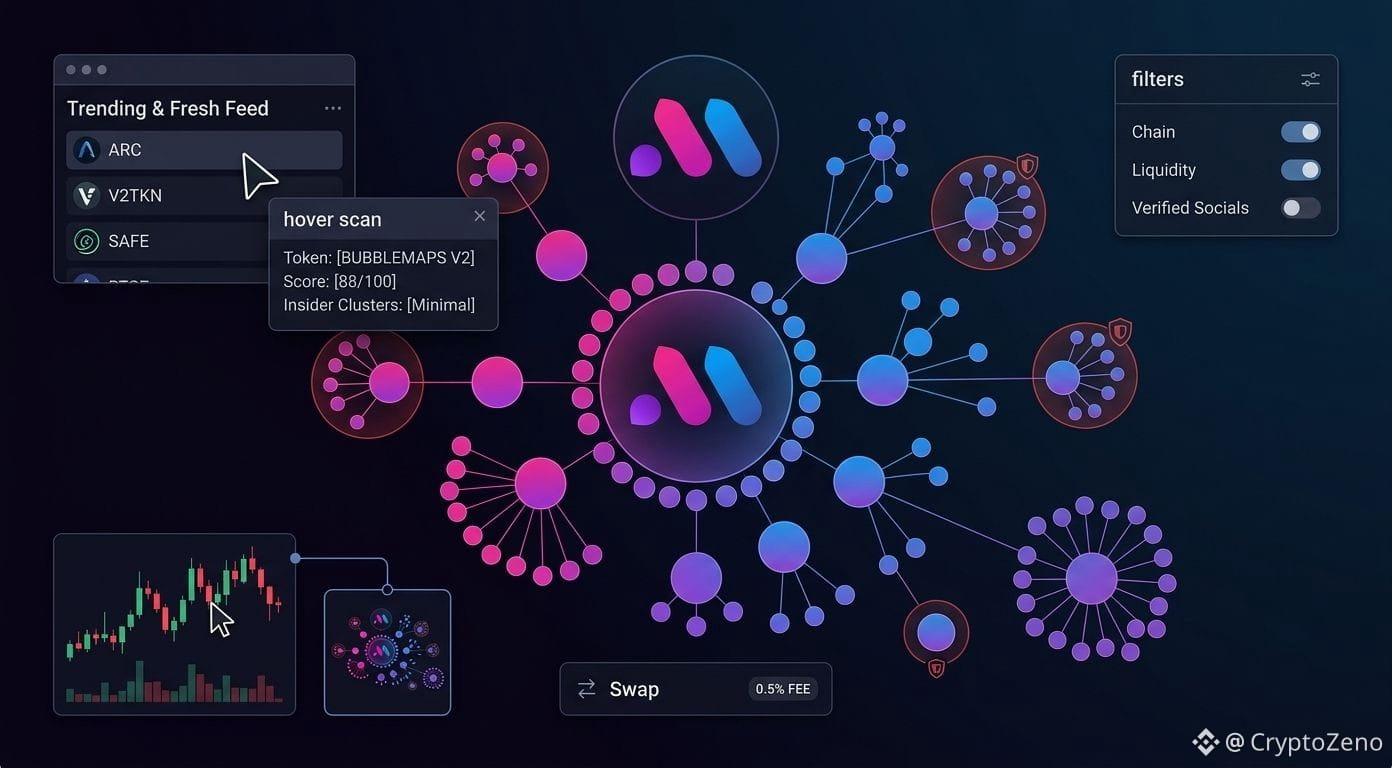
I spent some time testing the new Bubblemaps platform, and the biggest change for me is how much earlier I can check risk before making a trade. The new Trending and Fresh feed brings tokens from different chains into one place, with Arc supported from day one. Instead of finding a token first and researching it somewhere else, I can start here and filter what I actually want to explore.
The hover scan is one feature I kept coming back to. Moving over a token instantly opens its bubble map, while the Bubblemaps Score helps flag insider clusters and bundled wallets. I also tested the historical chart and liked being able to click on a specific candle to see holder distribution at that exact moment. It gives me a much clearer picture of how ownership changed over time.
I can narrow the feed by chain, launchpad, price, volume, liquidity and more, then check verified and reviewed project socials without jumping between multiple platforms. Wallet labels reviewed by professional on chain sleuths add another useful layer when I want to understand who is actually behind a cluster.
Once I find and vet a token, I can swap directly inside @bubblemaps at 0.5%, positioned as the lowest fee on the market. There is also in app token boosting, so discovery, analysis and execution are connected instead of being separate steps.
For me, this makes the trading process safer by putting the research before the purchase rather than after it. I can find a token, inspect its wallet structure, check its history, verify the project and buy without leaving the platform. After testing the new workflow myself, I can see myself using Bubblemaps as a first stop whenever I come across a new token worth researching. If you are already trading new launches, the updated platform is worth trying before making that next purchase. With $BMT sitting within the broader ecosystem.
#Bubblemaps @bubblemaps
Bubblemaps V2 Makes Token Research Much More Practical
I spent some time testing the new Bubblemaps platform, and the biggest change for me is how much earlier I can check risk before making a trade. The new Trending and Fresh feed brings tokens from different chains into one place, with Arc supported from day one. Instead of finding a token first and researching it somewhere else, I can start here and filter what I actually want to explore.
The hover scan is one feature I kept coming back to. Moving over a token instantly opens its bubble map, while the Bubblemaps Score helps flag insider clusters and bundled wallets. I also tested the historical chart and liked being able to click on a specific candle to see holder distribution at that exact moment. It gives me a much clearer picture of how ownership changed over time.
I can narrow the feed by chain, launchpad, price, volume, liquidity and more, then check verified and reviewed project socials without jumping between multiple platforms. Wallet labels reviewed by professional on chain sleuths add another useful layer when I want to understand who is actually behind a cluster.
Once I find and vet a token, I can swap directly inside @Bubblemaps.io at 0.5%, positioned as the lowest fee on the market. There is also in app token boosting, so discovery, analysis and execution are connected instead of being separate steps.
For me, this makes the trading process safer by putting the research before the purchase rather than after it. I can find a token, inspect its wallet structure, check its history, verify the project and buy without leaving the platform. After testing the new workflow myself, I can see myself using Bubblemaps as a first stop whenever I come across a new token worth researching. If you are already trading new launches, the updated platform is worth trying before making that next purchase. With $BMT sitting within the broader ecosystem.
#Bubblemaps @Bubblemaps.io
I spent some time testing the new Bubblemaps platform, and the biggest change for me is how much earlier I can check risk before making a trade. The new Trending and Fresh feed brings tokens from different chains into one place, with Arc supported from day one. Instead of finding a token first and researching it somewhere else, I can start here and filter what I actually want to explore.
The hover scan is one feature I kept coming back to. Moving over a token instantly opens its bubble map, while the Bubblemaps Score helps flag insider clusters and bundled wallets. I also tested the historical chart and liked being able to click on a specific candle to see holder distribution at that exact moment. It gives me a much clearer picture of how ownership changed over time.
I can narrow the feed by chain, launchpad, price, volume, liquidity and more, then check verified and reviewed project socials without jumping between multiple platforms. Wallet labels reviewed by professional on chain sleuths add another useful layer when I want to understand who is actually behind a cluster.
Once I find and vet a token, I can swap directly inside @Bubblemaps.io at 0.5%, positioned as the lowest fee on the market. There is also in app token boosting, so discovery, analysis and execution are connected instead of being separate steps.
For me, this makes the trading process safer by putting the research before the purchase rather than after it. I can find a token, inspect its wallet structure, check its history, verify the project and buy without leaving the platform. After testing the new workflow myself, I can see myself using Bubblemaps as a first stop whenever I come across a new token worth researching. If you are already trading new launches, the updated platform is worth trying before making that next purchase. With $BMT sitting within the broader ecosystem.
#Bubblemaps @Bubblemaps.io
AngelOfCrypto_-:
nice
7
8
8.3k

链上持仓结构正在给 $BMT 降温。Bubblemaps 现价约 0.01786 美元,24 小时成交约 594 万美元,市值约 1294 万美元,但资金流信号偏弱:近期追高的交易者普遍浮亏,持仓地址又集中在缺少历史记录的新钱包。
这类筹码通常意味着短线博弈占主导,真实长期持仓意愿不足。一旦买盘放缓,新钱包集中止损可能放大价格波动。与其只看 K 线,不如继续观察新钱包持仓占比、老地址增减持,以及成交量能否有效放大。若价格无法重新站稳,反弹或许更像减仓窗口,注意控制仓位。
#Bubblemaps #链上数据 #加密货币
链上持仓结构正在给 $BMT 降温。Bubblemaps 现价约 0.01786 美元,24 小时成交约 594 万美元,市值约 1294 万美元,但资金流信号偏弱:近期追高的交易者普遍浮亏,持仓地址又集中在缺少历史记录的新钱包。
这类筹码通常意味着短线博弈占主导,真实长期持仓意愿不足。一旦买盘放缓,新钱包集中止损可能放大价格波动。与其只看 K 线,不如继续观察新钱包持仓占比、老地址增减持,以及成交量能否有效放大。若价格无法重新站稳,反弹或许更像减仓窗口,注意控制仓位。
#Bubblemaps #链上数据 #加密货币
这类筹码通常意味着短线博弈占主导,真实长期持仓意愿不足。一旦买盘放缓,新钱包集中止损可能放大价格波动。与其只看 K 线,不如继续观察新钱包持仓占比、老地址增减持,以及成交量能否有效放大。若价格无法重新站稳,反弹或许更像减仓窗口,注意控制仓位。
#Bubblemaps #链上数据 #加密货币
92

·
--
链上持仓结构正在给 $BMT 敲响警钟。Bubblemaps 数据显示,近期入场地址普遍缺少历史交易记录,多为新钱包;筹码向短线投机者集中,而非长期持有者。当前价格约 0.01786 美元,24 小时成交量约 594 万美元,市值约 1294 万美元,但活跃换手难掩多数参与者浮亏较重的事实。新钱包承接、真实持有意愿不足,一旦波动加剧,抛压可能被放大。短线别只看成交量,更应跟踪老钱包动向、新增持币地址质量和买盘承接力度。#BMT #Bubblemaps #链上数据
链上持仓结构正在给 $BMT 敲响警钟。Bubblemaps 数据显示,近期入场地址普遍缺少历史交易记录,多为新钱包;筹码向短线投机者集中,而非长期持有者。当前价格约 0.01786 美元,24 小时成交量约 594 万美元,市值约 1294 万美元,但活跃换手难掩多数参与者浮亏较重的事实。新钱包承接、真实持有意愿不足,一旦波动加剧,抛压可能被放大。短线别只看成交量,更应跟踪老钱包动向、新增持币地址质量和买盘承接力度。#BMT #Bubblemaps #链上数据
71

·
--
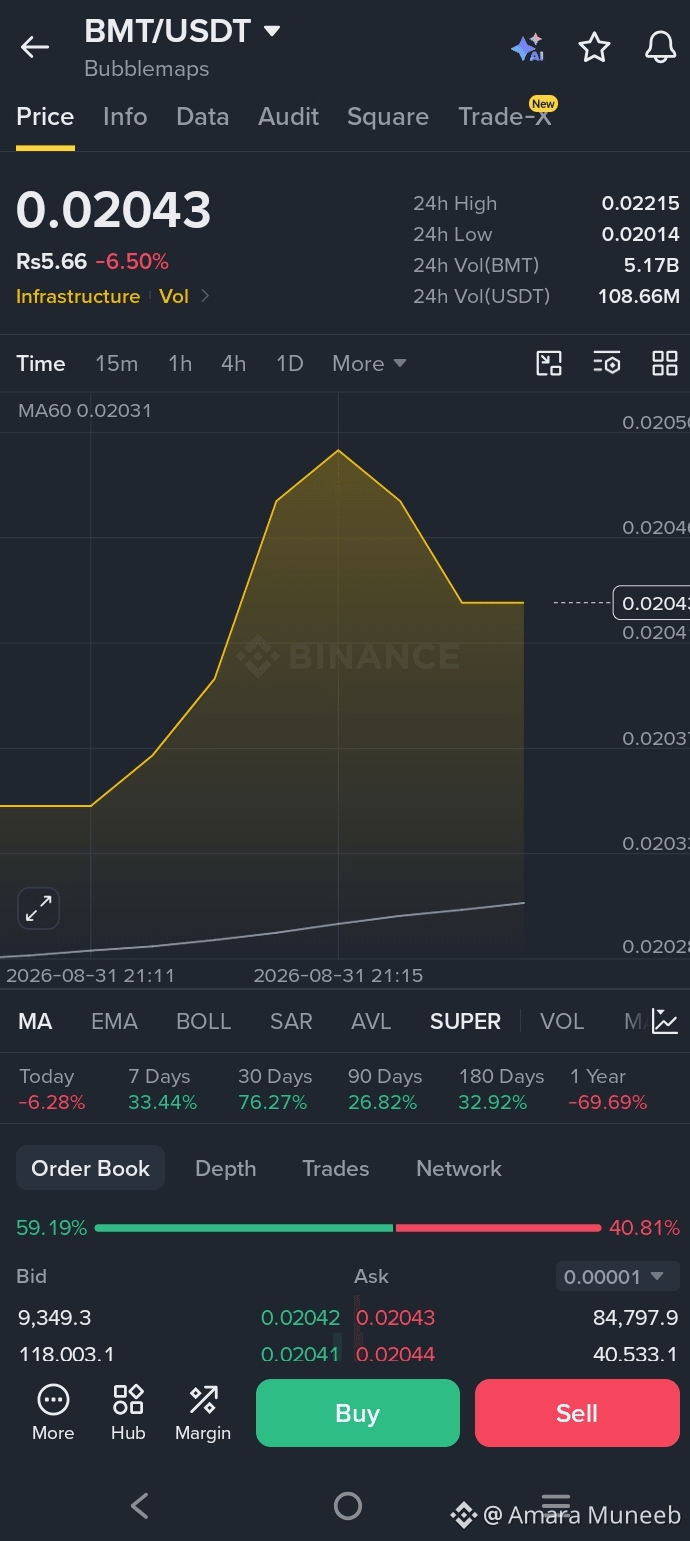
$BMT Network & Market Update: Price Action Breakdown 🚀✨
Pair: BMT/USDT 🪙
Asset Name: Bubblemaps 🌐
Current Price: 0.02043 (-6.50%) 🔴
24h High / Low: 0.02215 / 0.02014 📊
24h Volume: 5.17B BMT / 108.66M USDT 💰
Moving Average (MA60): 0.02031 📈
Network & Market Analysis 🔍
Bubblemaps (BMT/USDT) has experienced a temporary pull-back of 6.50% today, trading near $0.02043 📉. Despite short-term selling pressure, price action remains steady above its 60-period moving average (MA60 at 0.02031), showing signs of local support 🟢. Order book depth reflects strong buying interest, with Bid volume holding at 59.19% 🟢 dominating Ask volume at 40.81% 🔴. Medium to long-term performance remains robust, with a +76.27% gain over 30 days and +33.44% over the last week ⚡.
Question for the Community 💬
Will BMT hold the MA60 support and push back toward the $0.022 resistance level, or consolidate further in this zone 🤔? Share your market targets below! 👇
#BMT #Bubblemaps #Crypto #Trading #BinanceSquare #CryptoMarket
{future}(BMTUSDT)
$BMT Network & Market Update: Price Action Breakdown 🚀✨
Pair: BMT/USDT 🪙
Asset Name: Bubblemaps 🌐
Current Price: 0.02043 (-6.50%) 🔴
24h High / Low: 0.02215 / 0.02014 📊
24h Volume: 5.17B BMT / 108.66M USDT 💰
Moving Average (MA60): 0.02031 📈
Network & Market Analysis 🔍
Bubblemaps (BMT/USDT) has experienced a temporary pull-back of 6.50% today, trading near $0.02043 📉. Despite short-term selling pressure, price action remains steady above its 60-period moving average (MA60 at 0.02031), showing signs of local support 🟢. Order book depth reflects strong buying interest, with Bid volume holding at 59.19% 🟢 dominating Ask volume at 40.81% 🔴. Medium to long-term performance remains robust, with a +76.27% gain over 30 days and +33.44% over the last week ⚡.
Question for the Community 💬
Will BMT hold the MA60 support and push back toward the $0.022 resistance level, or consolidate further in this zone 🤔? Share your market targets below! 👇
#BMT #Bubblemaps #Crypto #Trading #BinanceSquare #CryptoMarket
Pair: BMT/USDT 🪙
Asset Name: Bubblemaps 🌐
Current Price: 0.02043 (-6.50%) 🔴
24h High / Low: 0.02215 / 0.02014 📊
24h Volume: 5.17B BMT / 108.66M USDT 💰
Moving Average (MA60): 0.02031 📈
Network & Market Analysis 🔍
Bubblemaps (BMT/USDT) has experienced a temporary pull-back of 6.50% today, trading near $0.02043 📉. Despite short-term selling pressure, price action remains steady above its 60-period moving average (MA60 at 0.02031), showing signs of local support 🟢. Order book depth reflects strong buying interest, with Bid volume holding at 59.19% 🟢 dominating Ask volume at 40.81% 🔴. Medium to long-term performance remains robust, with a +76.27% gain over 30 days and +33.44% over the last week ⚡.
Question for the Community 💬
Will BMT hold the MA60 support and push back toward the $0.022 resistance level, or consolidate further in this zone 🤔? Share your market targets below! 👇
#BMT #Bubblemaps #Crypto #Trading #BinanceSquare #CryptoMarket
118
·
--
BMT 合约量 24 小时暴涨超 55%,币安交易热度直线拉升
最近盯盘的朋友应该注意到了 Bubblemaps 代币 $BMT 的异动。短短 24 小时内,其合约交易量增幅直接突破 55%,在币安平台上迅速点燃了多头的情绪。
这次量能放大有几个值得关注的信号:
第一,合约量增幅远超现货,说明本轮行情主要由衍生品市场驱动,资金博弈属性更强,波动也会更剧烈。
第二,触发位置发生在币安这一主流交易平台,流动性深度足够,意味着参与者范围更广,散户和量化资金可能同时在入场。
第三,结合 Bubblemaps 本身的项目定位——链上数据可视化与代币分布追踪工具,量价异动往往与社区关注度提升、新链上发现或大户调仓有关,值得后续跟踪链上数据变化。
操作层面提醒一句:合约量异动往往伴随短期拉升,但回撤幅度也常常超出预期。追高务必控制仓位,设置好止损,避免在 FOMO 情绪中盲目加码。
接下来重点关注两点:一是币安永续费率是否同步走高,二是链上 $BMT 持有地址分布是否出现新的大户集中迹象。这两个指标可以帮我们判断这波行情是短暂炒作还是中期启动。
链上侦探工具代币的爆发往往不是偶然,紧盯数据,别被情绪带着走。
#BMT#Bubblemaps#altcoin
BMT 合约量 24 小时暴涨超 55%,币安交易热度直线拉升
最近盯盘的朋友应该注意到了 Bubblemaps 代币 $BMT 的异动。短短 24 小时内,其合约交易量增幅直接突破 55%,在币安平台上迅速点燃了多头的情绪。
这次量能放大有几个值得关注的信号:
第一,合约量增幅远超现货,说明本轮行情主要由衍生品市场驱动,资金博弈属性更强,波动也会更剧烈。
第二,触发位置发生在币安这一主流交易平台,流动性深度足够,意味着参与者范围更广,散户和量化资金可能同时在入场。
第三,结合 Bubblemaps 本身的项目定位——链上数据可视化与代币分布追踪工具,量价异动往往与社区关注度提升、新链上发现或大户调仓有关,值得后续跟踪链上数据变化。
操作层面提醒一句:合约量异动往往伴随短期拉升,但回撤幅度也常常超出预期。追高务必控制仓位,设置好止损,避免在 FOMO 情绪中盲目加码。
接下来重点关注两点:一是币安永续费率是否同步走高,二是链上 $BMT 持有地址分布是否出现新的大户集中迹象。这两个指标可以帮我们判断这波行情是短暂炒作还是中期启动。
链上侦探工具代币的爆发往往不是偶然,紧盯数据,别被情绪带着走。
#BMT#Bubblemaps#altcoin
最近盯盘的朋友应该注意到了 Bubblemaps 代币 $BMT 的异动。短短 24 小时内,其合约交易量增幅直接突破 55%,在币安平台上迅速点燃了多头的情绪。
这次量能放大有几个值得关注的信号:
第一,合约量增幅远超现货,说明本轮行情主要由衍生品市场驱动,资金博弈属性更强,波动也会更剧烈。
第二,触发位置发生在币安这一主流交易平台,流动性深度足够,意味着参与者范围更广,散户和量化资金可能同时在入场。
第三,结合 Bubblemaps 本身的项目定位——链上数据可视化与代币分布追踪工具,量价异动往往与社区关注度提升、新链上发现或大户调仓有关,值得后续跟踪链上数据变化。
操作层面提醒一句:合约量异动往往伴随短期拉升,但回撤幅度也常常超出预期。追高务必控制仓位,设置好止损,避免在 FOMO 情绪中盲目加码。
接下来重点关注两点:一是币安永续费率是否同步走高,二是链上 $BMT 持有地址分布是否出现新的大户集中迹象。这两个指标可以帮我们判断这波行情是短暂炒作还是中期启动。
链上侦探工具代币的爆发往往不是偶然,紧盯数据,别被情绪带着走。
#BMT#Bubblemaps#altcoin
9

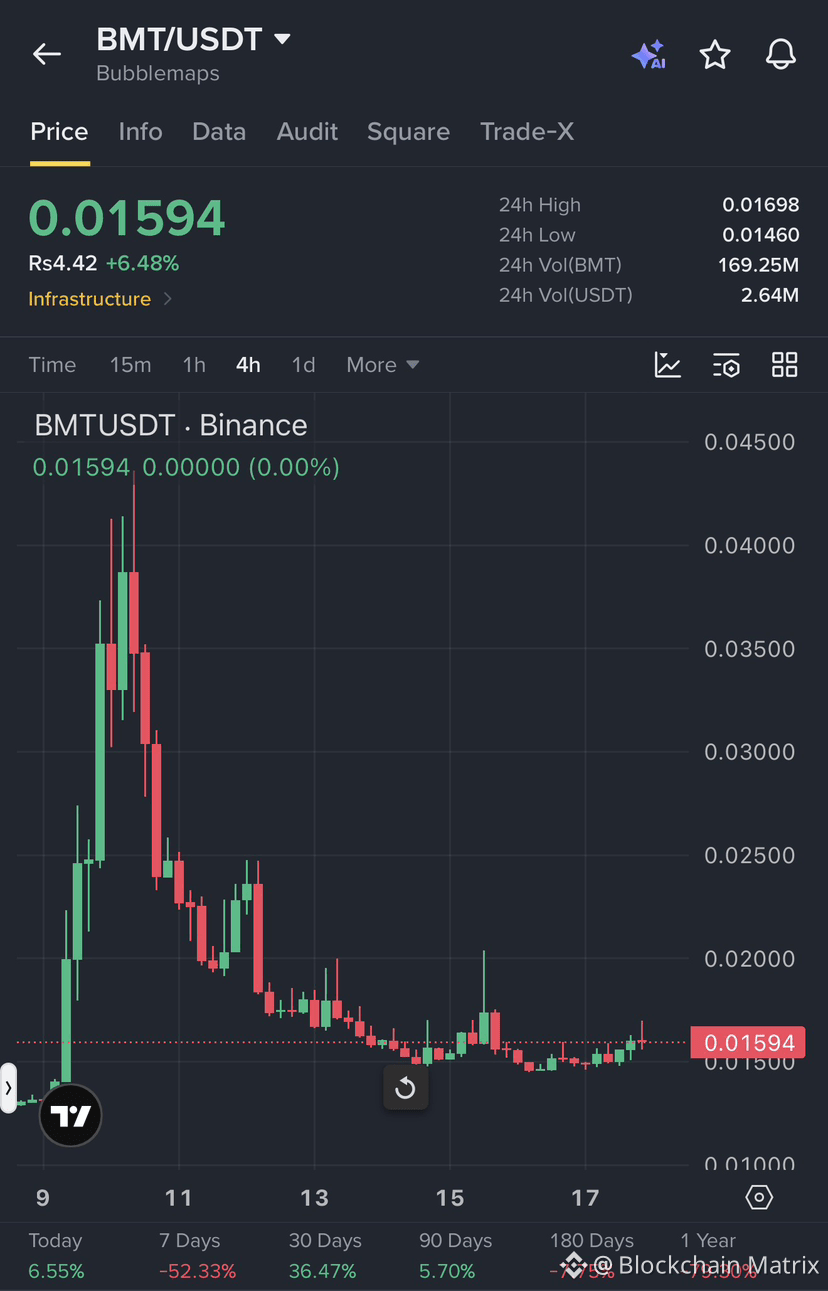
Bubblemaps: On-Chain Intelligence With a Bigger Purpose
$BMT powers Bubblemaps, an on-chain analytics platform designed to make blockchain activity easier to understand. Its visual wallet maps can reveal whale clusters, insider connections, token concentration and suspicious fund movements.
With products like Bubblemaps V2 and Intel Desk, the project is building a stronger layer of transparency for the crypto ecosystem.
At around $0.016, $BMT remains highly volatile, but its on-chain intelligence narrative makes it a project worth watching closely.
#BMT #Bubblemaps
Bubblemaps: On-Chain Intelligence With a Bigger Purpose
$BMT powers Bubblemaps, an on-chain analytics platform designed to make blockchain activity easier to understand. Its visual wallet maps can reveal whale clusters, insider connections, token concentration and suspicious fund movements.
With products like Bubblemaps V2 and Intel Desk, the project is building a stronger layer of transparency for the crypto ecosystem.
At around $0.016, $BMT remains highly volatile, but its on-chain intelligence narrative makes it a project worth watching closely.
#BMT #Bubblemaps
$BMT powers Bubblemaps, an on-chain analytics platform designed to make blockchain activity easier to understand. Its visual wallet maps can reveal whale clusters, insider connections, token concentration and suspicious fund movements.
With products like Bubblemaps V2 and Intel Desk, the project is building a stronger layer of transparency for the crypto ecosystem.
At around $0.016, $BMT remains highly volatile, but its on-chain intelligence narrative makes it a project worth watching closely.
#BMT #Bubblemaps
154

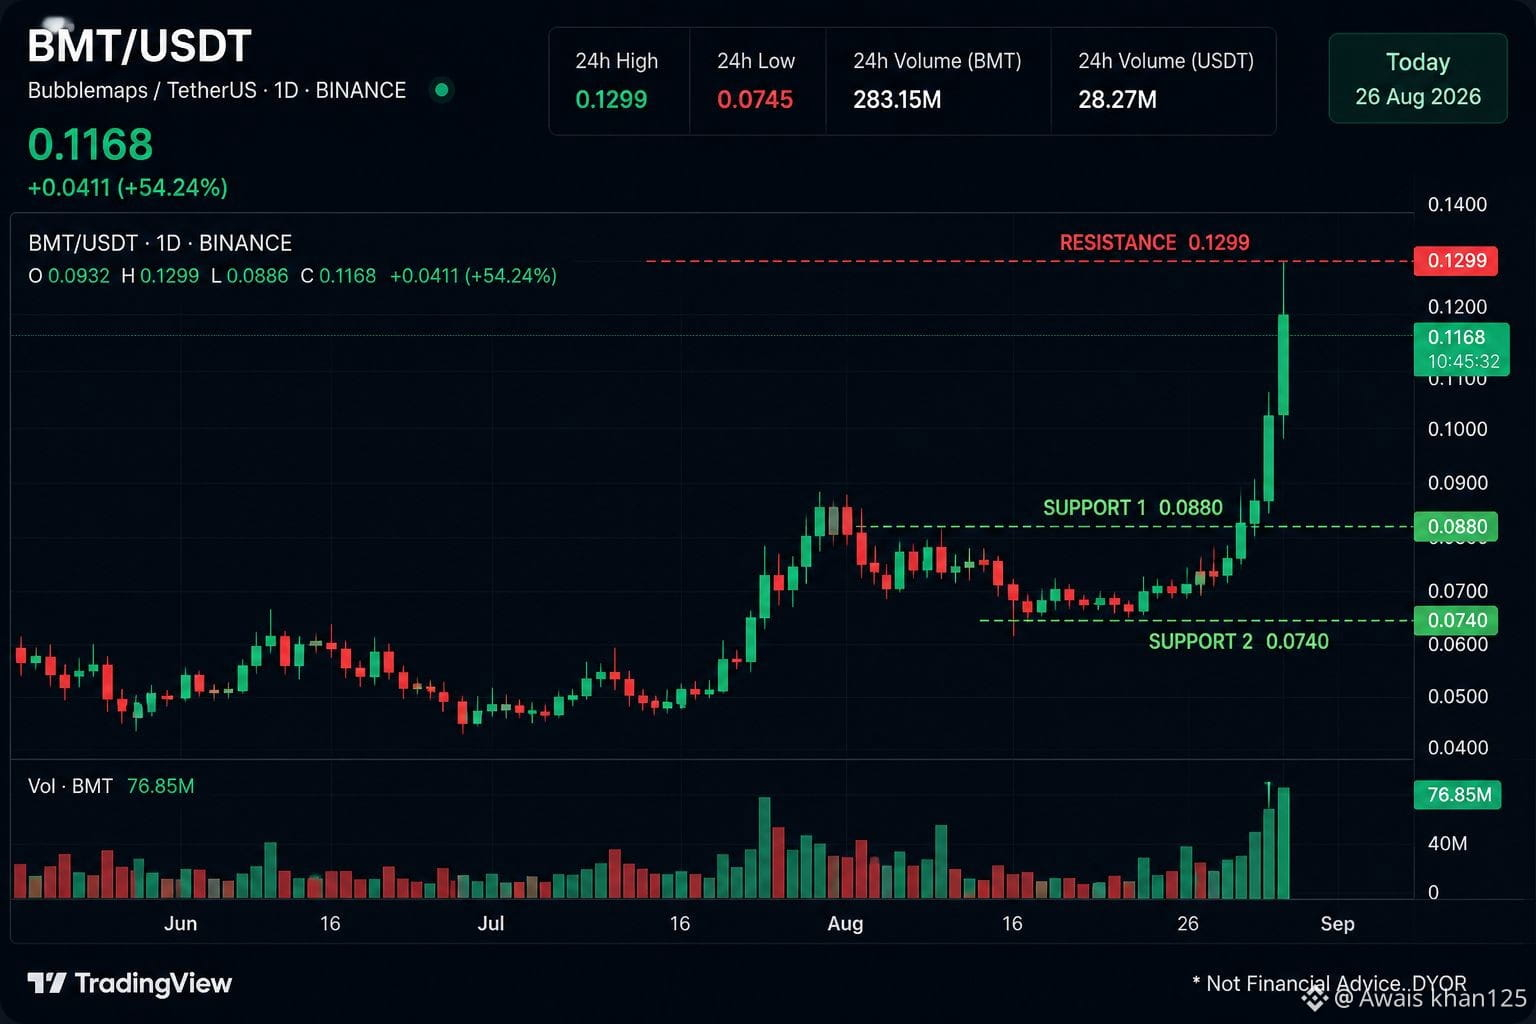
🚀 BMT/USDT Today — Strong Move! 🔥
BMT (Bubblemaps) is showing strong momentum today. 📈
The token has seen a major price move along with a huge increase in trading volume.
📊 Today’s Focus:
• Strong bullish momentum
• Heavy trading volume
• Volatility is very high
• Watch the support/resistance levels carefully
After such a sharp move, price can move quickly in either direction, so risk management is important.
DYOR — Not financial advice.
#BMT #BMTUSDT #Bubblemaps #Crypto #BinanceSquare #dyor $BMT
{future}(BMTUSDT)
🚀 BMT/USDT Today — Strong Move! 🔥
BMT (Bubblemaps) is showing strong momentum today. 📈
The token has seen a major price move along with a huge increase in trading volume.
📊 Today’s Focus:
• Strong bullish momentum
• Heavy trading volume
• Volatility is very high
• Watch the support/resistance levels carefully
After such a sharp move, price can move quickly in either direction, so risk management is important.
DYOR — Not financial advice.
#BMT #BMTUSDT #Bubblemaps #Crypto #BinanceSquare #dyor $BMT
BMT (Bubblemaps) is showing strong momentum today. 📈
The token has seen a major price move along with a huge increase in trading volume.
📊 Today’s Focus:
• Strong bullish momentum
• Heavy trading volume
• Volatility is very high
• Watch the support/resistance levels carefully
After such a sharp move, price can move quickly in either direction, so risk management is important.
DYOR — Not financial advice.
#BMT #BMTUSDT #Bubblemaps #Crypto #BinanceSquare #dyor $BMT
247

·
--
$BMT 📊 разбор роста!
Что такое BMT? Bubblemaps — это платформа для ончейн-аналитики, которая визуализирует данные о держателях токенов и их связях. BMT — токен для стейкинга и управления платформой.
Текущая ситуация: цена $0.01910** (+24.67%), закрепилась выше всех EMA (21=0.0172, 50=0.0175, 200=0.0147) — **бычий тренд**. RSI 55.5 — пространство для роста. Сопротивление **$0.02038, поддержка $0.0172. Объём растёт — интерес появляется.
Вывод: лонг на пробое $0.02038 с коротким стопом. Seed-токен — высокий риск.
👉 Подпишись на разборы!
#Bubblemaps #Trade 👇
{future}(BMTUSDT)
$BMT 📊 разбор роста!
Что такое BMT? Bubblemaps — это платформа для ончейн-аналитики, которая визуализирует данные о держателях токенов и их связях. BMT — токен для стейкинга и управления платформой.
Текущая ситуация: цена $0.01910** (+24.67%), закрепилась выше всех EMA (21=0.0172, 50=0.0175, 200=0.0147) — **бычий тренд**. RSI 55.5 — пространство для роста. Сопротивление **$0.02038, поддержка $0.0172. Объём растёт — интерес появляется.
Вывод: лонг на пробое $0.02038 с коротким стопом. Seed-токен — высокий риск.
👉 Подпишись на разборы!
#Bubblemaps #Trade 👇
Что такое BMT? Bubblemaps — это платформа для ончейн-аналитики, которая визуализирует данные о держателях токенов и их связях. BMT — токен для стейкинга и управления платформой.
Текущая ситуация: цена $0.01910** (+24.67%), закрепилась выше всех EMA (21=0.0172, 50=0.0175, 200=0.0147) — **бычий тренд**. RSI 55.5 — пространство для роста. Сопротивление **$0.02038, поддержка $0.0172. Объём растёт — интерес появляется.
Вывод: лонг на пробое $0.02038 с коротким стопом. Seed-токен — высокий риск.
👉 Подпишись на разборы!
#Bubblemaps #Trade 👇
1
215

·
--
Haussier
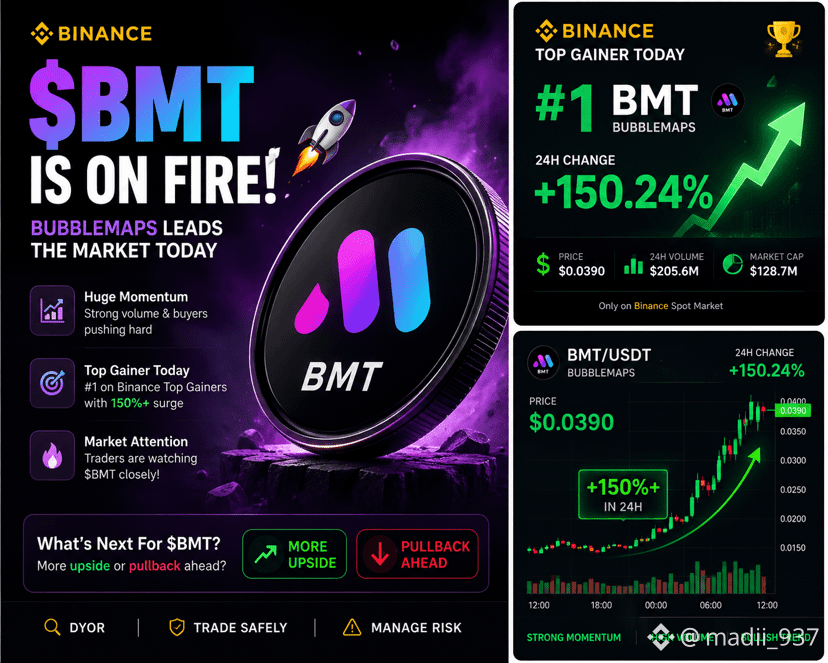
🚨 $BMT IS ON FIRE TODAY! 🔥
Bubblemaps ($BMT ) is currently leading Binance’s top gainers, with a massive ~150%#+ move in the last 24H. 📈
The interesting part? Volume and momentum are clearly picking up as traders rush toward the move.
But after such a huge pump, the big question is:
👉 Can $BMT hold these gains, or are we about to see a sharp pullback?
I’m watching:
• Volume 📊
• Support after the breakout
• Whether buyers can maintain momentum
• Any signs of profit-taking
What do you think? 👀
🚀 More upside or 🔻 correction?
#BMT #crypto #Bubblemaps #BİNANCE
🚨 $BMT IS ON FIRE TODAY! 🔥
Bubblemaps ($BMT ) is currently leading Binance’s top gainers, with a massive ~150%#+ move in the last 24H. 📈
The interesting part? Volume and momentum are clearly picking up as traders rush toward the move.
But after such a huge pump, the big question is:
👉 Can $BMT hold these gains, or are we about to see a sharp pullback?
I’m watching:
• Volume 📊
• Support after the breakout
• Whether buyers can maintain momentum
• Any signs of profit-taking
What do you think? 👀
🚀 More upside or 🔻 correction?
#BMT #crypto #Bubblemaps #BİNANCE
Bubblemaps ($BMT ) is currently leading Binance’s top gainers, with a massive ~150%#+ move in the last 24H. 📈
The interesting part? Volume and momentum are clearly picking up as traders rush toward the move.
But after such a huge pump, the big question is:
👉 Can $BMT hold these gains, or are we about to see a sharp pullback?
I’m watching:
• Volume 📊
• Support after the breakout
• Whether buyers can maintain momentum
• Any signs of profit-taking
What do you think? 👀
🚀 More upside or 🔻 correction?
#BMT #crypto #Bubblemaps #BİNANCE
104

·
--
#BMT 合约交易量 24 小时暴增超 55%,引发币安价格异动 🚀
Bubblemaps 上的链上数据又一次给出了信号。作为一款越来越被重视的链上可视化工具,Bubblemaps 近期持续成为 altcoin 玩家追踪大户动向和资金流向的重要参考。
这一轮 $BMT 合约成交量的突然放量,叠加 55% 以上的 24 小时增幅,提示我们关注两点:
1️⃣ 衍生品市场的杠杆资金正在快速涌入,多空博弈明显加剧
2️⃣ 现货端的联动效应往往紧随其后,短期波动率大概率会进一步抬升
链上工具的实时洞察,结合合约数据的异动,往往是 altcoin 启动前最值得留意的"前哨信号"。在 FOMO 之前,先看清筹码结构。
⚠️ 提醒:合约放量不等于方向确定,注意控制仓位和杠杆,理性应对波动。
#altcoin #Bubblemaps
#BMT 合约交易量 24 小时暴增超 55%,引发币安价格异动 🚀
Bubblemaps 上的链上数据又一次给出了信号。作为一款越来越被重视的链上可视化工具,Bubblemaps 近期持续成为 altcoin 玩家追踪大户动向和资金流向的重要参考。
这一轮 $BMT 合约成交量的突然放量,叠加 55% 以上的 24 小时增幅,提示我们关注两点:
1️⃣ 衍生品市场的杠杆资金正在快速涌入,多空博弈明显加剧
2️⃣ 现货端的联动效应往往紧随其后,短期波动率大概率会进一步抬升
链上工具的实时洞察,结合合约数据的异动,往往是 altcoin 启动前最值得留意的"前哨信号"。在 FOMO 之前,先看清筹码结构。
⚠️ 提醒:合约放量不等于方向确定,注意控制仓位和杠杆,理性应对波动。
#altcoin #Bubblemaps
Bubblemaps 上的链上数据又一次给出了信号。作为一款越来越被重视的链上可视化工具,Bubblemaps 近期持续成为 altcoin 玩家追踪大户动向和资金流向的重要参考。
这一轮 $BMT 合约成交量的突然放量,叠加 55% 以上的 24 小时增幅,提示我们关注两点:
1️⃣ 衍生品市场的杠杆资金正在快速涌入,多空博弈明显加剧
2️⃣ 现货端的联动效应往往紧随其后,短期波动率大概率会进一步抬升
链上工具的实时洞察,结合合约数据的异动,往往是 altcoin 启动前最值得留意的"前哨信号"。在 FOMO 之前,先看清筹码结构。
⚠️ 提醒:合约放量不等于方向确定,注意控制仓位和杠杆,理性应对波动。
#altcoin #Bubblemaps
161
·
--

Article
Bubblemaps Explodes 54%—Is This a Hidden Gem or Just Another Pump?While the broader market is catching its breath, one token is quietly stealing the show. $BMT, the native token of Bubblemaps, just pulled off a massive 54% rally in a single day, surging from a low of $0.015 to a high of $0.0275 . Currently trading around $0.0245, this DeFi analytics project is suddenly on everyone's radar. 👀
But as always, the question remains: is this a genuine breakout, or just another pump-and-dump in disguise? Let's dive in. 👇
What's Fueling the Fire? 🔥
Massive Volume Spike: The 24-hour trading volume for BMT has exploded, indicating genuine buyer interest rather than just low-liquidity manipulation . When volume confirms a price move, it's usually a sign of strength.Oversold Rebound: Before this rally, BMT had been on a brutal downtrend, dropping over 90% from its all-time high of $0.321 . When an asset gets that oversold, even a small amount of buying pressure can trigger a massive short-term bounce. The 54% gain is a classic "dead cat bounce" or the start of something bigger.Potential Catalysts: Bubblemaps is a unique DeFi analytics tool that visualizes on-chain data in an intuitive way. The project could be gaining traction as investors look for better ways to track whale movements and token distributions. There might also be upcoming exchange listings or partnerships that haven't been officially announced yet.
The Charts Are Looking Bullish 📊
Looking at the 4-hour and 15-minute charts, the technicals are turning positive:
EMA(8) on 4-Hour: The 8-period Exponential Moving Average is at $0.02182, which is well below the current price . This indicates that short-term momentum is strongly bullish.VWAP (Volume-Weighted Average Price): Currently at $0.02394, price is trading above this level . This confirms that buyers have been in control during the session.Key Resistance: The $0.0275 high is the immediate resistance to watch. If BMT can break through that with strong volume, the next stop could be $0.030 or even $0.035 .
The Fundamentals: Is There Substance? 🔍
Bubblemaps is a fascinating project that provides visual analytics for DeFi tokens. It allows users to see token distributions, identify whale wallets, and track on-chain movements in an intuitive, bubble-based interface. In a world where transparency is key, tools like Bubblemaps could become essential for both retail and institutional investors. The project has a circulating supply of 727.7 million tokens, which gives it a modest market cap that could allow for significant upside if adoption increases.
Final Takeaway 💎
A 54% rally is always exciting, but it's important to stay grounded. The key levels to watch are $0.0275 (resistance) and $0.0239 (VWAP). If BMT can break through resistance with strong volume, we could see a continuation toward $0.030. However, a pullback to test VWAP would be perfectly normal and healthy.
Are you riding this BMT pump, or waiting for a pullback? Drop your $BMT strategy below! 👇
#Bubblemaps
$BMT — Retesting Support 🚀
Bias: Bullish Preferred Entry: M15 pullback toward VWAP (0.02424) or EMA8 (0.02450) Trigger: Bullish reclaim / higher low Targets: 0.02547 / 0.02600 Invalidation: M15 close below 0.02424 (VWAP)
Why:
H4 structure is bullish with price holding above VWAP (0.02394) and well above EMA8 (0.02182).M15 is currently retesting EMA8 as support after a strong move; a clean hold here would offer a solid entry.A higher low near dynamic support would confirm buyers are stepping in.
Confirmation: Wait for a bullish M15 candle close near EMA8/VWAP to confirm the pullback is holding.
Not financial advice. DYOR and manage your risk.
Retest or rejection? 👇
#Write2Earn #BMT #TechnicalAnalysis
Bubblemaps Explodes 54%—Is This a Hidden Gem or Just Another Pump?
While the broader market is catching its breath, one token is quietly stealing the show. $BMT , the native token of Bubblemaps, just pulled off a massive 54% rally in a single day, surging from a low of $0.015 to a high of $0.0275 . Currently trading around $0.0245, this DeFi analytics project is suddenly on everyone's radar. 👀
But as always, the question remains: is this a genuine breakout, or just another pump-and-dump in disguise? Let's dive in. 👇
What's Fueling the Fire? 🔥
Massive Volume Spike: The 24-hour trading volume for BMT has exploded, indicating genuine buyer interest rather than just low-liquidity manipulation . When volume confirms a price move, it's usually a sign of strength.Oversold Rebound: Before this rally, BMT had been on a brutal downtrend, dropping over 90% from its all-time high of $0.321 . When an asset gets that oversold, even a small amount of buying pressure can trigger a massive short-term bounce. The 54% gain is a classic "dead cat bounce" or the start of something bigger.Potential Catalysts: Bubblemaps is a unique DeFi analytics tool that visualizes on-chain data in an intuitive way. The project could be gaining traction as investors look for better ways to track whale movements and token distributions. There might also be upcoming exchange listings or partnerships that haven't been officially announced yet.
The Charts Are Looking Bullish 📊
Looking at the 4-hour and 15-minute charts, the technicals are turning positive:
EMA(8) on 4-Hour: The 8-period Exponential Moving Average is at $0.02182, which is well below the current price . This indicates that short-term momentum is strongly bullish.VWAP (Volume-Weighted Average Price): Currently at $0.02394, price is trading above this level . This confirms that buyers have been in control during the session.Key Resistance: The $0.0275 high is the immediate resistance to watch. If BMT can break through that with strong volume, the next stop could be $0.030 or even $0.035 .
The Fundamentals: Is There Substance? 🔍
Bubblemaps is a fascinating project that provides visual analytics for DeFi tokens. It allows users to see token distributions, identify whale wallets, and track on-chain movements in an intuitive, bubble-based interface. In a world where transparency is key, tools like Bubblemaps could become essential for both retail and institutional investors. The project has a circulating supply of 727.7 million tokens, which gives it a modest market cap that could allow for significant upside if adoption increases.
Final Takeaway 💎
A 54% rally is always exciting, but it's important to stay grounded. The key levels to watch are $0.0275 (resistance) and $0.0239 (VWAP). If BMT can break through resistance with strong volume, we could see a continuation toward $0.030. However, a pullback to test VWAP would be perfectly normal and healthy.
Are you riding this BMT pump, or waiting for a pullback? Drop your $BMT strategy below! 👇
#Bubblemaps
$BMT — Retesting Support 🚀
Bias: Bullish Preferred Entry: M15 pullback toward VWAP (0.02424) or EMA8 (0.02450) Trigger: Bullish reclaim / higher low Targets: 0.02547 / 0.02600 Invalidation: M15 close below 0.02424 (VWAP)
Why:
H4 structure is bullish with price holding above VWAP (0.02394) and well above EMA8 (0.02182).M15 is currently retesting EMA8 as support after a strong move; a clean hold here would offer a solid entry.A higher low near dynamic support would confirm buyers are stepping in.
Confirmation: Wait for a bullish M15 candle close near EMA8/VWAP to confirm the pullback is holding.
Not financial advice. DYOR and manage your risk.
Retest or rejection? 👇
#Write2Earn #BMT #TechnicalAnalysis
But as always, the question remains: is this a genuine breakout, or just another pump-and-dump in disguise? Let's dive in. 👇
What's Fueling the Fire? 🔥
Massive Volume Spike: The 24-hour trading volume for BMT has exploded, indicating genuine buyer interest rather than just low-liquidity manipulation . When volume confirms a price move, it's usually a sign of strength.Oversold Rebound: Before this rally, BMT had been on a brutal downtrend, dropping over 90% from its all-time high of $0.321 . When an asset gets that oversold, even a small amount of buying pressure can trigger a massive short-term bounce. The 54% gain is a classic "dead cat bounce" or the start of something bigger.Potential Catalysts: Bubblemaps is a unique DeFi analytics tool that visualizes on-chain data in an intuitive way. The project could be gaining traction as investors look for better ways to track whale movements and token distributions. There might also be upcoming exchange listings or partnerships that haven't been officially announced yet.
The Charts Are Looking Bullish 📊
Looking at the 4-hour and 15-minute charts, the technicals are turning positive:
EMA(8) on 4-Hour: The 8-period Exponential Moving Average is at $0.02182, which is well below the current price . This indicates that short-term momentum is strongly bullish.VWAP (Volume-Weighted Average Price): Currently at $0.02394, price is trading above this level . This confirms that buyers have been in control during the session.Key Resistance: The $0.0275 high is the immediate resistance to watch. If BMT can break through that with strong volume, the next stop could be $0.030 or even $0.035 .
The Fundamentals: Is There Substance? 🔍
Bubblemaps is a fascinating project that provides visual analytics for DeFi tokens. It allows users to see token distributions, identify whale wallets, and track on-chain movements in an intuitive, bubble-based interface. In a world where transparency is key, tools like Bubblemaps could become essential for both retail and institutional investors. The project has a circulating supply of 727.7 million tokens, which gives it a modest market cap that could allow for significant upside if adoption increases.
Final Takeaway 💎
A 54% rally is always exciting, but it's important to stay grounded. The key levels to watch are $0.0275 (resistance) and $0.0239 (VWAP). If BMT can break through resistance with strong volume, we could see a continuation toward $0.030. However, a pullback to test VWAP would be perfectly normal and healthy.
Are you riding this BMT pump, or waiting for a pullback? Drop your $BMT strategy below! 👇
#Bubblemaps
$BMT — Retesting Support 🚀
Bias: Bullish Preferred Entry: M15 pullback toward VWAP (0.02424) or EMA8 (0.02450) Trigger: Bullish reclaim / higher low Targets: 0.02547 / 0.02600 Invalidation: M15 close below 0.02424 (VWAP)
Why:
H4 structure is bullish with price holding above VWAP (0.02394) and well above EMA8 (0.02182).M15 is currently retesting EMA8 as support after a strong move; a clean hold here would offer a solid entry.A higher low near dynamic support would confirm buyers are stepping in.
Confirmation: Wait for a bullish M15 candle close near EMA8/VWAP to confirm the pullback is holding.
Not financial advice. DYOR and manage your risk.
Retest or rejection? 👇
#Write2Earn #BMT #TechnicalAnalysis
34

·
--
Haussier
🚨 LOW-CAP GEM TO WATCH: $BMT
Bubblemaps started as a blockchain analytics platform focused on exposing wallet connections, token concentration and suspicious on-chain activity. It has since expanded into a community-driven investigation ecosystem through its Intel Desk, while also integrating with Binance Wallet.
What caught my attention is the valuation: BMT is still sitting around the $10M–$13M market-cap range, with millions in daily volume. For a project already listed on Binance, that’s interesting.
$BMT is officially on my watchlist — and I’m adding it to my bag. 👀🔥
Not financial advice. Do your own research.
{spot}(BMTUSDT)
#BMT #Bubblemaps
🚨 LOW-CAP GEM TO WATCH: $BMT
Bubblemaps started as a blockchain analytics platform focused on exposing wallet connections, token concentration and suspicious on-chain activity. It has since expanded into a community-driven investigation ecosystem through its Intel Desk, while also integrating with Binance Wallet.
What caught my attention is the valuation: BMT is still sitting around the $10M–$13M market-cap range, with millions in daily volume. For a project already listed on Binance, that’s interesting.
$BMT is officially on my watchlist — and I’m adding it to my bag. 👀🔥
Not financial advice. Do your own research.
#BMT #Bubblemaps
Bubblemaps started as a blockchain analytics platform focused on exposing wallet connections, token concentration and suspicious on-chain activity. It has since expanded into a community-driven investigation ecosystem through its Intel Desk, while also integrating with Binance Wallet.
What caught my attention is the valuation: BMT is still sitting around the $10M–$13M market-cap range, with millions in daily volume. For a project already listed on Binance, that’s interesting.
$BMT is officially on my watchlist — and I’m adding it to my bag. 👀🔥
Not financial advice. Do your own research.
#BMT #Bubblemaps
1
89

·
--
Bubblemaps ($BMT) Surges 11.44%: Here’s Why
Bubblemaps ($BMT) is making waves with an 11.44% gain over 24 hours. The surge is fueled by its innovative mapping and data visualization tools, attracting attention from tech enthusiasts and investors alike. With a massive 24-hour volume of $639.58M, $BMT is showing strong momentum. The community is buzzing, and new partnerships could be on the horizon. Traders should keep an eye on this emerging player in the decentralized tech space. 🚀🔥
Follow for more crypto setups.
#DeGenYuv #Bubblemaps
Bubblemaps ($BMT ) Surges 11.44%: Here’s Why
Bubblemaps ($BMT ) is making waves with an 11.44% gain over 24 hours. The surge is fueled by its innovative mapping and data visualization tools, attracting attention from tech enthusiasts and investors alike. With a massive 24-hour volume of $639.58M, $BMT is showing strong momentum. The community is buzzing, and new partnerships could be on the horizon. Traders should keep an eye on this emerging player in the decentralized tech space. 🚀🔥
Follow for more crypto setups.
#DeGenYuv #Bubblemaps
Bubblemaps ($BMT ) is making waves with an 11.44% gain over 24 hours. The surge is fueled by its innovative mapping and data visualization tools, attracting attention from tech enthusiasts and investors alike. With a massive 24-hour volume of $639.58M, $BMT is showing strong momentum. The community is buzzing, and new partnerships could be on the horizon. Traders should keep an eye on this emerging player in the decentralized tech space. 🚀🔥
Follow for more crypto setups.
#DeGenYuv #Bubblemaps

1
22
$BMT 24小时暴涨160.5%!小市值标的的短剧行情,上演得淋漓尽致。
低市值+链上大额充值+合约资金涌入,三股力量同时作用,直接把 Bubblemaps 推上了涨幅榜前列。成交额24小时达到5561万美元,市值约1357万美元,这种体量下的剧烈波动并不意外。
从交易视角看,这更像是典型的资金集中涌入带来的短线爆发。链上数据与合约数据共振,行情在极短时间内被资金选择放大,后续能否持续仍需观察接力资金意愿。
注:加密资产波动剧烈,短时暴涨行情风险较高,请勿追高,注意控制仓位。
#Bubblemaps #BMT #链上数据
$BMT 24小时暴涨160.5%!小市值标的的短剧行情,上演得淋漓尽致。
低市值+链上大额充值+合约资金涌入,三股力量同时作用,直接把 Bubblemaps 推上了涨幅榜前列。成交额24小时达到5561万美元,市值约1357万美元,这种体量下的剧烈波动并不意外。
从交易视角看,这更像是典型的资金集中涌入带来的短线爆发。链上数据与合约数据共振,行情在极短时间内被资金选择放大,后续能否持续仍需观察接力资金意愿。
注:加密资产波动剧烈,短时暴涨行情风险较高,请勿追高,注意控制仓位。
#Bubblemaps #BMT #链上数据
低市值+链上大额充值+合约资金涌入,三股力量同时作用,直接把 Bubblemaps 推上了涨幅榜前列。成交额24小时达到5561万美元,市值约1357万美元,这种体量下的剧烈波动并不意外。
从交易视角看,这更像是典型的资金集中涌入带来的短线爆发。链上数据与合约数据共振,行情在极短时间内被资金选择放大,后续能否持续仍需观察接力资金意愿。
注:加密资产波动剧烈,短时暴涨行情风险较高,请勿追高,注意控制仓位。
#Bubblemaps #BMT #链上数据
92

Bubblemaps ($BMT) 近期表现强势,24小时内涨幅最高达160.5%,引发市场广泛关注。背后驱动因素主要有三点:
一是币安合约未平仓量明显放大,资金参与度提升带动短线情绪走强;二是生态合作方出现大额充值动作,被市场解读为新一轮合作或产品落地预期升温;三是低市值标的叠加空头拥挤,触发集中轧空行情,助推价格急速拉升。
目前 $BMT 报价0.01484美元附近,24小时成交量接近897万美元,市值约1070万美元,整体仍处于小市值高波动阶段。短线资金博弈特征明显,追高需注意回撤风险,理性看待放量行情。
#Bubblemaps#BMT#链上数据
Bubblemaps ($BMT ) 近期表现强势,24小时内涨幅最高达160.5%,引发市场广泛关注。背后驱动因素主要有三点:
一是币安合约未平仓量明显放大,资金参与度提升带动短线情绪走强;二是生态合作方出现大额充值动作,被市场解读为新一轮合作或产品落地预期升温;三是低市值标的叠加空头拥挤,触发集中轧空行情,助推价格急速拉升。
目前 $BMT 报价0.01484美元附近,24小时成交量接近897万美元,市值约1070万美元,整体仍处于小市值高波动阶段。短线资金博弈特征明显,追高需注意回撤风险,理性看待放量行情。
#Bubblemaps#BMT#链上数据
一是币安合约未平仓量明显放大,资金参与度提升带动短线情绪走强;二是生态合作方出现大额充值动作,被市场解读为新一轮合作或产品落地预期升温;三是低市值标的叠加空头拥挤,触发集中轧空行情,助推价格急速拉升。
目前 $BMT 报价0.01484美元附近,24小时成交量接近897万美元,市值约1070万美元,整体仍处于小市值高波动阶段。短线资金博弈特征明显,追高需注意回撤风险,理性看待放量行情。
#Bubblemaps#BMT#链上数据
75

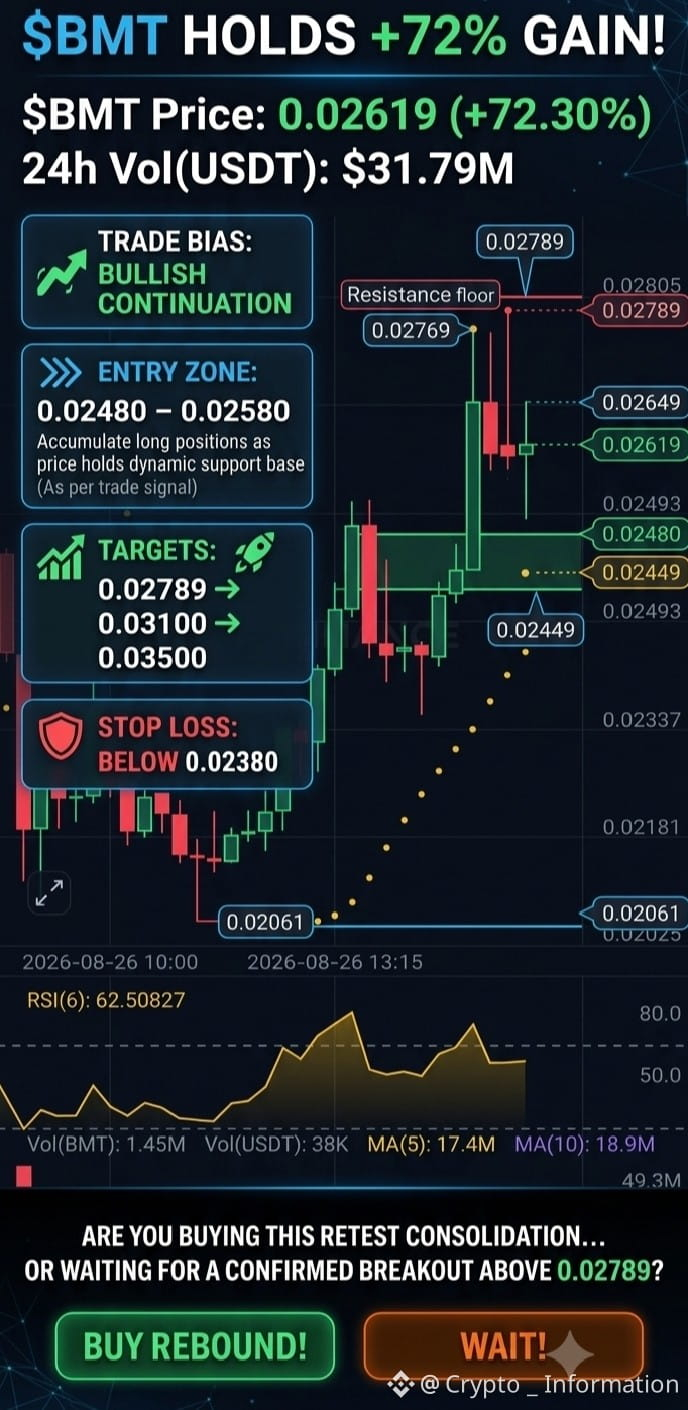
$BMT Holds +72% Gain! Retest Consolidation Setting Up For $0.02789 Breakout?
Maintaining huge top-gainer strength with a solid +72.30% gain, $BMT (Bubblemaps) is forming a classic high-volume continuation pattern! Massive trading activity has pushed 24h volume to 1.41B BMT ($31.79M USDT) on Binance. After tapping a high of 0.02789, price action retested the 0.02061 floor and is now cleanly consolidating around 0.02619.
Trade Bias: Bullish Continuation
Entry Zone: 0.02480 – 0.02580 (Accumulate long positions as price holds the dynamic 15m support floor)
Targets: 0.02789 ➡️ 0.03100 ➡️ 0.03500
Stop Loss: Below 0.02380
Technically, the pullbacks are getting heavily absorbed by buyers. Parabolic SAR trailing dots at 0.02449 confirm strong upward trend support under candles, while RSI (6) has cooled to a healthy 62.50, providing ample room for the next leg up. A clean break above 0.02789 will unlock explosive upside expansion.
Are you accumulating at this retest consolidation... or waiting for a confirmed breakout above 0.02789?
Trade Now $BMT
{spot}(BMTUSDT)
#BMT #Bubblemaps #cryptosignals
$BMT Holds +72% Gain! Retest Consolidation Setting Up For $0.02789 Breakout?
Maintaining huge top-gainer strength with a solid +72.30% gain, $BMT (Bubblemaps) is forming a classic high-volume continuation pattern! Massive trading activity has pushed 24h volume to 1.41B BMT ($31.79M USDT) on Binance. After tapping a high of 0.02789, price action retested the 0.02061 floor and is now cleanly consolidating around 0.02619.
Trade Bias: Bullish Continuation
Entry Zone: 0.02480 – 0.02580 (Accumulate long positions as price holds the dynamic 15m support floor)
Targets: 0.02789 ➡️ 0.03100 ➡️ 0.03500
Stop Loss: Below 0.02380
Technically, the pullbacks are getting heavily absorbed by buyers. Parabolic SAR trailing dots at 0.02449 confirm strong upward trend support under candles, while RSI (6) has cooled to a healthy 62.50, providing ample room for the next leg up. A clean break above 0.02789 will unlock explosive upside expansion.
Are you accumulating at this retest consolidation... or waiting for a confirmed breakout above 0.02789?
Trade Now $BMT
#BMT #Bubblemaps #cryptosignals
Maintaining huge top-gainer strength with a solid +72.30% gain, $BMT (Bubblemaps) is forming a classic high-volume continuation pattern! Massive trading activity has pushed 24h volume to 1.41B BMT ($31.79M USDT) on Binance. After tapping a high of 0.02789, price action retested the 0.02061 floor and is now cleanly consolidating around 0.02619.
Trade Bias: Bullish Continuation
Entry Zone: 0.02480 – 0.02580 (Accumulate long positions as price holds the dynamic 15m support floor)
Targets: 0.02789 ➡️ 0.03100 ➡️ 0.03500
Stop Loss: Below 0.02380
Technically, the pullbacks are getting heavily absorbed by buyers. Parabolic SAR trailing dots at 0.02449 confirm strong upward trend support under candles, while RSI (6) has cooled to a healthy 62.50, providing ample room for the next leg up. A clean break above 0.02789 will unlock explosive upside expansion.
Are you accumulating at this retest consolidation... or waiting for a confirmed breakout above 0.02789?
Trade Now $BMT
#BMT #Bubblemaps #cryptosignals
1
93

$BMT (Bubblemaps) Analysis
Bubblemaps is an on-chain analytics platform that turns complex wallet relationships and token flows into simple, interactive bubble visualizations. It helps spot insider clusters, whale moves, and potential risks across multiple chains (Solana, BNB Chain, Ethereum, and others).
Currently as of Aug 26, 2026:
Price hovering around $0.024–0.027
Strong 24h move: +50–80% on massive volume spike
30-day performance: roughly +100%+
Still ~92% below its March 2025 ATH near $0.32
Market cap in the low-to-mid teens of millions, with very high volume/MCap turnover
Why the attention?
Recent catalysts include the Upbit listing (boosting liquidity and Korean retail interest) plus ongoing product use. The platform has real utility: limited free daily checks, paid advanced queries and APIs in BMT, community bounties via Intel Desk, and institutional risk-screening services. Part of usage fees flows back to stakers, and some revenue supports buybacks/burns.
Bullish angles
Actual product usage (not pure narrative) Cross-chain expansion and integrations High relative volume showing speculative + genuine interest
Risks to watch
High concentration in top wallets Ongoing unlocks/vesting can create sell pressure Extreme short-term volatility (typical for low-cap high-turnover names) Needs sustained volume and product adoption to hold gains
Bottom line
$BMT is a pure utility play in the on-chain intelligence niche. The recent pump is momentum-driven, but the underlying tool solves a real problem for traders and researchers. Treat it as high-risk/high-reward — size accordingly and watch key supports near previous lows if momentum fades.
Not financial advice. Do Your Own Research.
#BMTArmy #Bubblemaps #CryptoAnalysis
{spot}(BMTUSDT)
$BMT (Bubblemaps) Analysis
Bubblemaps is an on-chain analytics platform that turns complex wallet relationships and token flows into simple, interactive bubble visualizations. It helps spot insider clusters, whale moves, and potential risks across multiple chains (Solana, BNB Chain, Ethereum, and others).
Currently as of Aug 26, 2026:
Price hovering around $0.024–0.027
Strong 24h move: +50–80% on massive volume spike
30-day performance: roughly +100%+
Still ~92% below its March 2025 ATH near $0.32
Market cap in the low-to-mid teens of millions, with very high volume/MCap turnover
Why the attention?
Recent catalysts include the Upbit listing (boosting liquidity and Korean retail interest) plus ongoing product use. The platform has real utility: limited free daily checks, paid advanced queries and APIs in BMT, community bounties via Intel Desk, and institutional risk-screening services. Part of usage fees flows back to stakers, and some revenue supports buybacks/burns.
Bullish angles
Actual product usage (not pure narrative) Cross-chain expansion and integrations High relative volume showing speculative + genuine interest
Risks to watch
High concentration in top wallets Ongoing unlocks/vesting can create sell pressure Extreme short-term volatility (typical for low-cap high-turnover names) Needs sustained volume and product adoption to hold gains
Bottom line
$BMT is a pure utility play in the on-chain intelligence niche. The recent pump is momentum-driven, but the underlying tool solves a real problem for traders and researchers. Treat it as high-risk/high-reward — size accordingly and watch key supports near previous lows if momentum fades.
Not financial advice. Do Your Own Research.
#BMTArmy #Bubblemaps #CryptoAnalysis
Bubblemaps is an on-chain analytics platform that turns complex wallet relationships and token flows into simple, interactive bubble visualizations. It helps spot insider clusters, whale moves, and potential risks across multiple chains (Solana, BNB Chain, Ethereum, and others).
Currently as of Aug 26, 2026:
Price hovering around $0.024–0.027
Strong 24h move: +50–80% on massive volume spike
30-day performance: roughly +100%+
Still ~92% below its March 2025 ATH near $0.32
Market cap in the low-to-mid teens of millions, with very high volume/MCap turnover
Why the attention?
Recent catalysts include the Upbit listing (boosting liquidity and Korean retail interest) plus ongoing product use. The platform has real utility: limited free daily checks, paid advanced queries and APIs in BMT, community bounties via Intel Desk, and institutional risk-screening services. Part of usage fees flows back to stakers, and some revenue supports buybacks/burns.
Bullish angles
Actual product usage (not pure narrative) Cross-chain expansion and integrations High relative volume showing speculative + genuine interest
Risks to watch
High concentration in top wallets Ongoing unlocks/vesting can create sell pressure Extreme short-term volatility (typical for low-cap high-turnover names) Needs sustained volume and product adoption to hold gains
Bottom line
$BMT is a pure utility play in the on-chain intelligence niche. The recent pump is momentum-driven, but the underlying tool solves a real problem for traders and researchers. Treat it as high-risk/high-reward — size accordingly and watch key supports near previous lows if momentum fades.
Not financial advice. Do Your Own Research.
#BMTArmy #Bubblemaps #CryptoAnalysis
84

·
--
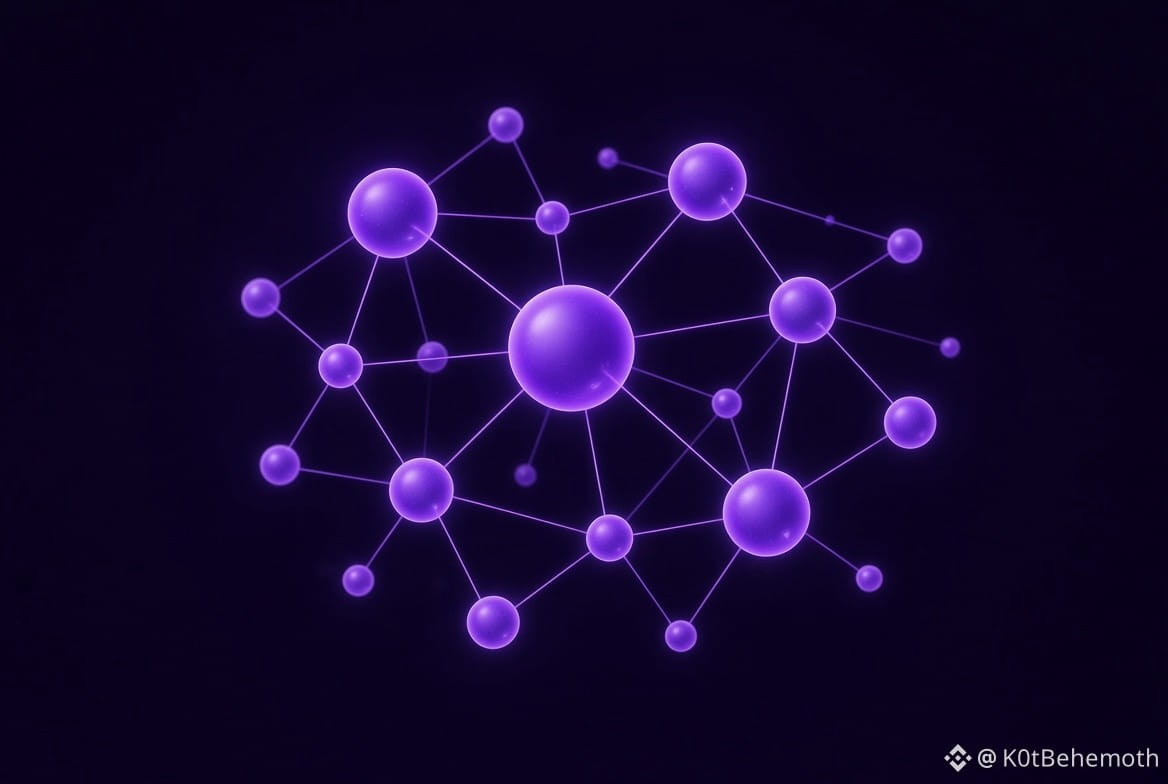
$BMT (Bubblemaps) сегодня заметно вырос.
Цена сейчас около $0.024–0.027, а за сутки токен прибавил больше 50–60%. Объёмы тоже резко подскочили.
Bubblemaps — это инструмент, который визуализирует ончейн-данные. Показывает «пузыри» держателей, кластеры кошельков и помогает быстро понять, как распределён supply у токена или NFT. В общем, удобная штука для тех, кто любит копаться в графиках и кошельках.
Сейчас движение выглядит больше спекулятивным — сильный приток объёма и интерес в соцсетях. Насколько это закрепится, будет видно по объёмам в ближайшие дни.
#BMT #Bubblemaps
$BMT (Bubblemaps) сегодня заметно вырос.
Цена сейчас около $0.024–0.027, а за сутки токен прибавил больше 50–60%. Объёмы тоже резко подскочили.
Bubblemaps — это инструмент, который визуализирует ончейн-данные. Показывает «пузыри» держателей, кластеры кошельков и помогает быстро понять, как распределён supply у токена или NFT. В общем, удобная штука для тех, кто любит копаться в графиках и кошельках.
Сейчас движение выглядит больше спекулятивным — сильный приток объёма и интерес в соцсетях. Насколько это закрепится, будет видно по объёмам в ближайшие дни.
#BMT #Bubblemaps
Цена сейчас около $0.024–0.027, а за сутки токен прибавил больше 50–60%. Объёмы тоже резко подскочили.
Bubblemaps — это инструмент, который визуализирует ончейн-данные. Показывает «пузыри» держателей, кластеры кошельков и помогает быстро понять, как распределён supply у токена или NFT. В общем, удобная штука для тех, кто любит копаться в графиках и кошельках.
Сейчас движение выглядит больше спекулятивным — сильный приток объёма и интерес в соцсетях. Насколько это закрепится, будет видно по объёмам в ближайшие дни.
#BMT #Bubblemaps
535
Connectez-vous pour découvrir plus de contenu
Rejoignez la communauté mondiale des adeptes de cryptomonnaies sur Binance Square
⚡️ Suviez les dernières informations importantes sur les cryptomonnaies.
💬 Jugé digne de confiance par la plus grande plateforme d’échange de cryptomonnaies au monde.
👍 Découvrez les connaissances que partagent les créateurs vérifiés.
Adresse e-mail/Nº de téléphone
Sujets d’actualité
1
#EarningsSeason
240,476 vues
2,139 mentions
2
#BitwiseLaunchesFirstSpotNEARETF
13,309 vues
376 mentions
3
#USJobOpeningsFallToFiveMonthLow
18,952 vues
279 mentions
4
#ECBToTestAIAgentsInDigitalEuroPayments
17,180 vues
432 mentions
5
#JapanFSABacksFourthStablecoinTradeSettlementPilot
20,292 vues
470 mentions
6
#BitgetHackerFailsToMoveStolenFunds
35,706 vues
578 mentions
7
#BitMineETHHoldingsTop6Million
30,185 vues
682 mentions
8
#StrategyAdds1666BTCHoldingsReach847666
26,111 vues
477 mentions
9
#NvidiaApproves$150BBuyback
4,775 vues
71 mentions
10
#OpenAIDelaysGPT6.1OverSafetyIssues
38,751 vues
855 mentions