

Qaiser Mehmood Sheikh
6 Publicaciones

Qaiser Mehmood Sheikh
Denunciar
Bloquear usuario
Abrir operación
2.2 meses
2 Siguiendo
0 Seguidores
0 Me gusta
Publicaciones
Cartera
#dusk $DUSK @Dusk_Foundation
El enfoque central de @Dusk_Foundation es construir una sólida capa de ejecución financiera que combine sin problemas el cumplimiento de nivel institucional con la privacidad de conocimiento cero. Al habilitar contratos inteligentes confidenciales, $DUSK proporciona la infraestructura vital necesaria para activos financieros regulados y liquidaciones seguras en cadena. ¡Un gran avance para las finanzas centradas en la privacidad! #dusk
#dusk $DUSK @Dusk
El enfoque central de @Dusk es construir una sólida capa de ejecución financiera que combine sin problemas el cumplimiento de nivel institucional con la privacidad de conocimiento cero. Al habilitar contratos inteligentes confidenciales, $DUSK proporciona la infraestructura vital necesaria para activos financieros regulados y liquidaciones seguras en cadena. ¡Un gran avance para las finanzas centradas en la privacidad! #dusk
El enfoque central de @Dusk es construir una sólida capa de ejecución financiera que combine sin problemas el cumplimiento de nivel institucional con la privacidad de conocimiento cero. Al habilitar contratos inteligentes confidenciales, $DUSK proporciona la infraestructura vital necesaria para activos financieros regulados y liquidaciones seguras en cadena. ¡Un gran avance para las finanzas centradas en la privacidad! #dusk
63

Artículo
La Trampa del Fin de Semana: ¿$BTC está a punto de romper o de engañarnos? 📉 📈¡Hola, comunidad de Binance Square! Mientras nos instalamos en el fin de semana, la volatilidad se está ajustando en todo el mercado, y $BITCOIN está justo en un punto de decisión importante cerca de $64,050.
El volumen se está enfriando, lo cual normalmente significa una cosa: viene un movimiento brusco. Así es como estoy jugando la estructura actual del mercado:
El Caso Alcista: Si los alcistas pueden defender la zona de soporte de $63,500 – $64,000 y empujar una vela de alto volumen por encima de $65,000, estamos buscando una subida rápida hacia el área de resistencia de $66,700 – $67,500.
El Riesgo Alcista: Una pérdida del soporte inmediato del piso arriesga una barrida hacia las mínimas del rango macro cerca de $62,500.
La Trampa del Fin de Semana: ¿$BTC está a punto de romper o de engañarnos? 📉 📈
¡Hola, comunidad de Binance Square! Mientras nos instalamos en el fin de semana, la volatilidad se está ajustando en todo el mercado, y $BITCOIN está justo en un punto de decisión importante cerca de $64,050.
El volumen se está enfriando, lo cual normalmente significa una cosa: viene un movimiento brusco. Así es como estoy jugando la estructura actual del mercado:
El Caso Alcista: Si los alcistas pueden defender la zona de soporte de $63,500 – $64,000 y empujar una vela de alto volumen por encima de $65,000, estamos buscando una subida rápida hacia el área de resistencia de $66,700 – $67,500.
El Riesgo Alcista: Una pérdida del soporte inmediato del piso arriesga una barrida hacia las mínimas del rango macro cerca de $62,500.
El volumen se está enfriando, lo cual normalmente significa una cosa: viene un movimiento brusco. Así es como estoy jugando la estructura actual del mercado:
El Caso Alcista: Si los alcistas pueden defender la zona de soporte de $63,500 – $64,000 y empujar una vela de alto volumen por encima de $65,000, estamos buscando una subida rápida hacia el área de resistencia de $66,700 – $67,500.
El Riesgo Alcista: Una pérdida del soporte inmediato del piso arriesga una barrida hacia las mínimas del rango macro cerca de $62,500.
99
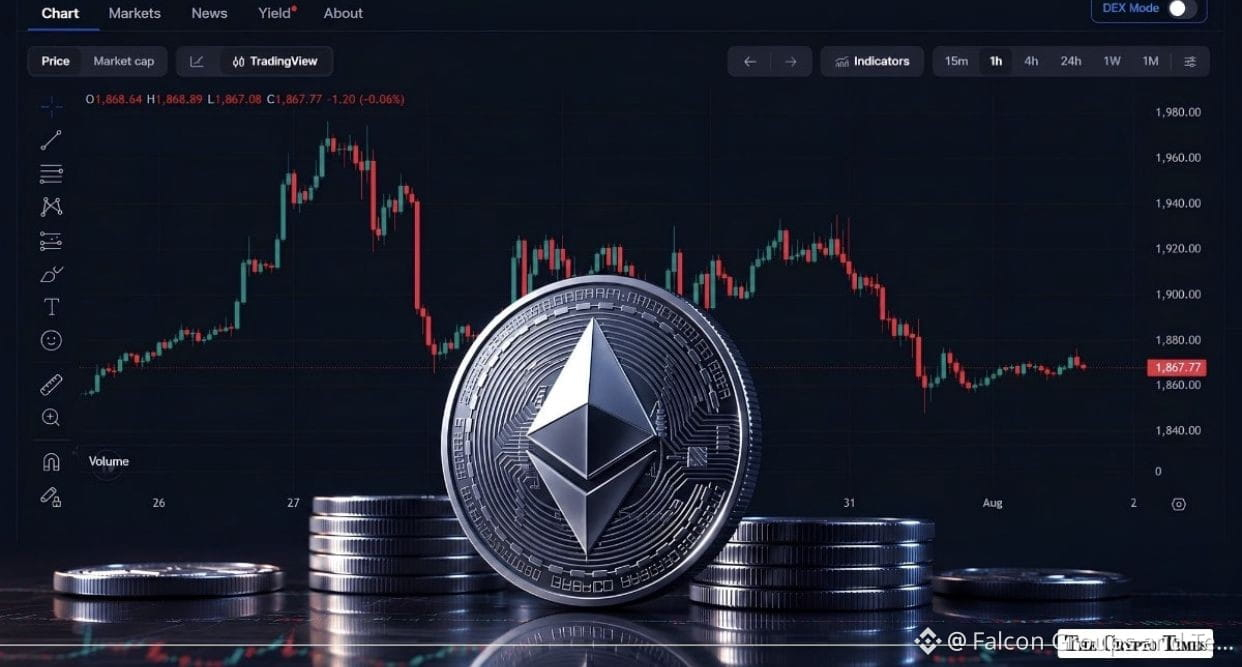
Análisis del mercado de Ethereum $ETH
* Precio actual: ~$1,890 – $1,900
* Contexto del mercado: $ETH está intentando una recuperación sostenida después de probar soporte cerca de la zona de $1,850, moviéndose en sintonía con el movimiento del mercado cripto en general mientras los operadores digieren actualizaciones macroeconómicas y los datos de inflación de EE. UU.
Niveles técnicos clave
| Tipo de nivel | Rango de precio | Importancia |
|---|---|---|
| Soporte inmediato | $1,850 – $1,865 | Confluencia de las EMA de 20 y 50 días; sirve como un “suelo” de seguridad vital para caídas a corto plazo. |
| Punto de giro / Obstáculo de ruptura | $1,895 – $1,920 | Punto de inflexión a corto plazo, alineado con la EMA de 100 días ($1,922). Recuperar esta zona es esencial para construir impulso alcista. |
| Oferta mayor / Resistencia | $1,960 – $2,000 | Zona de resistencia pesada por encima. Un cierre diario confirmado por encima de este nivel despeja el camino hacia objetivos intermedios más altos ($2,170+). |
¿Cuándo es el mejor momento para operar?
El momento de tus entradas depende de si prefieres operaciones dentro de un rango seguro o rupturas confirmadas:
* Mejor momento para entradas largas (rebote en soporte):
Busca entradas cuando el precio pruebe con éxito y defienda la zona de soporte $1,850 – $1,865 con una disminución del volumen de venta. Comprar cerca del soporte mientras mantienes un stop-loss ajustado por debajo de $1,830 ofrece una relación riesgo-recompensa favorable.
* Mejor momento para entradas por impulso / ruptura:
Evita perseguir precios en el rango medio. En su lugar, espera un cierre diario alto en volumen por encima de la zona de resistencia $1,920 – $1,960. Entrar después de la confirmación reduce el riesgo de enfrentar un fallo (fakeout) o un rechazo de vuelta a los mínimos del rango.
* Advertencia de gestión del riesgo:
Con el sentimiento general del mercado inclinándose a la cautela y las tendencias de volumen del verano manteniéndose planas, evita el alto apalancamiento. Escalonar tus órdenes y mantener stops-loss estrictos para protegerte contra la volatilidad macro.
#ETH #EthereumMarket $ETH
{spot}(ETHUSDT)
Análisis del mercado de Ethereum $ETH
* Precio actual: ~$1,890 – $1,900
* Contexto del mercado: $ETH está intentando una recuperación sostenida después de probar soporte cerca de la zona de $1,850, moviéndose en sintonía con el movimiento del mercado cripto en general mientras los operadores digieren actualizaciones macroeconómicas y los datos de inflación de EE. UU.
Niveles técnicos clave
| Tipo de nivel | Rango de precio | Importancia |
|---|---|---|
| Soporte inmediato | $1,850 – $1,865 | Confluencia de las EMA de 20 y 50 días; sirve como un “suelo” de seguridad vital para caídas a corto plazo. |
| Punto de giro / Obstáculo de ruptura | $1,895 – $1,920 | Punto de inflexión a corto plazo, alineado con la EMA de 100 días ($1,922). Recuperar esta zona es esencial para construir impulso alcista. |
| Oferta mayor / Resistencia | $1,960 – $2,000 | Zona de resistencia pesada por encima. Un cierre diario confirmado por encima de este nivel despeja el camino hacia objetivos intermedios más altos ($2,170+). |
¿Cuándo es el mejor momento para operar?
El momento de tus entradas depende de si prefieres operaciones dentro de un rango seguro o rupturas confirmadas:
* Mejor momento para entradas largas (rebote en soporte):
Busca entradas cuando el precio pruebe con éxito y defienda la zona de soporte $1,850 – $1,865 con una disminución del volumen de venta. Comprar cerca del soporte mientras mantienes un stop-loss ajustado por debajo de $1,830 ofrece una relación riesgo-recompensa favorable.
* Mejor momento para entradas por impulso / ruptura:
Evita perseguir precios en el rango medio. En su lugar, espera un cierre diario alto en volumen por encima de la zona de resistencia $1,920 – $1,960. Entrar después de la confirmación reduce el riesgo de enfrentar un fallo (fakeout) o un rechazo de vuelta a los mínimos del rango.
* Advertencia de gestión del riesgo:
Con el sentimiento general del mercado inclinándose a la cautela y las tendencias de volumen del verano manteniéndose planas, evita el alto apalancamiento. Escalonar tus órdenes y mantener stops-loss estrictos para protegerte contra la volatilidad macro.
#ETH #EthereumMarket $ETH
* Precio actual: ~$1,890 – $1,900
* Contexto del mercado: $ETH está intentando una recuperación sostenida después de probar soporte cerca de la zona de $1,850, moviéndose en sintonía con el movimiento del mercado cripto en general mientras los operadores digieren actualizaciones macroeconómicas y los datos de inflación de EE. UU.
Niveles técnicos clave
| Tipo de nivel | Rango de precio | Importancia |
|---|---|---|
| Soporte inmediato | $1,850 – $1,865 | Confluencia de las EMA de 20 y 50 días; sirve como un “suelo” de seguridad vital para caídas a corto plazo. |
| Punto de giro / Obstáculo de ruptura | $1,895 – $1,920 | Punto de inflexión a corto plazo, alineado con la EMA de 100 días ($1,922). Recuperar esta zona es esencial para construir impulso alcista. |
| Oferta mayor / Resistencia | $1,960 – $2,000 | Zona de resistencia pesada por encima. Un cierre diario confirmado por encima de este nivel despeja el camino hacia objetivos intermedios más altos ($2,170+). |
¿Cuándo es el mejor momento para operar?
El momento de tus entradas depende de si prefieres operaciones dentro de un rango seguro o rupturas confirmadas:
* Mejor momento para entradas largas (rebote en soporte):
Busca entradas cuando el precio pruebe con éxito y defienda la zona de soporte $1,850 – $1,865 con una disminución del volumen de venta. Comprar cerca del soporte mientras mantienes un stop-loss ajustado por debajo de $1,830 ofrece una relación riesgo-recompensa favorable.
* Mejor momento para entradas por impulso / ruptura:
Evita perseguir precios en el rango medio. En su lugar, espera un cierre diario alto en volumen por encima de la zona de resistencia $1,920 – $1,960. Entrar después de la confirmación reduce el riesgo de enfrentar un fallo (fakeout) o un rechazo de vuelta a los mínimos del rango.
* Advertencia de gestión del riesgo:
Con el sentimiento general del mercado inclinándose a la cautela y las tendencias de volumen del verano manteniéndose planas, evita el alto apalancamiento. Escalonar tus órdenes y mantener stops-loss estrictos para protegerte contra la volatilidad macro.
#ETH #EthereumMarket $ETH
80
Artículo
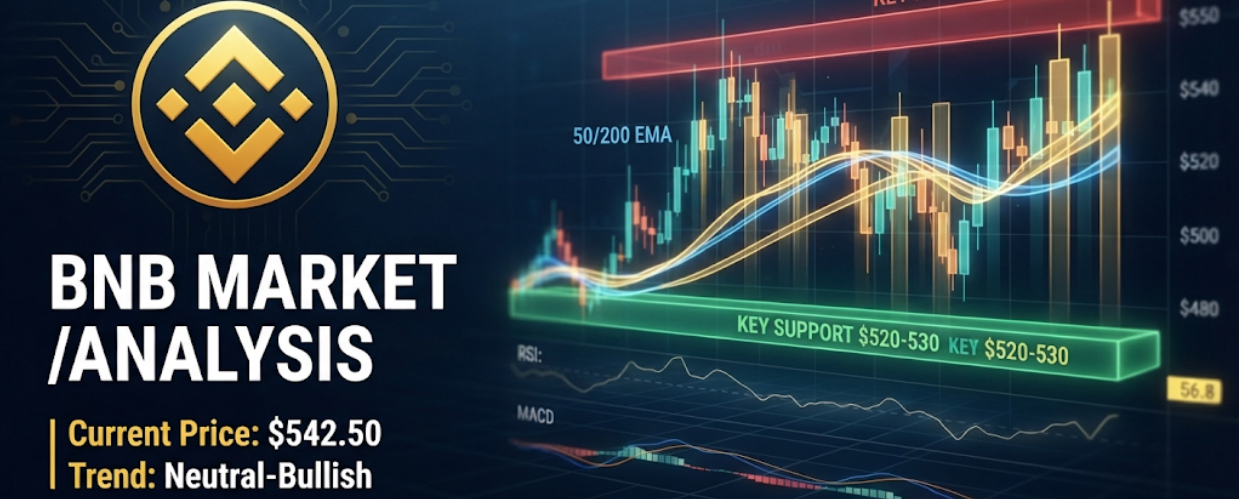
Análisis técnico detallado de BNB / USDPrecio de mercado actual: ~$BNB 542.50
Indicadores técnicos: EMA de 50 días: $530.00 (Actuando como soporte dinámico inmediato)
EMA de 200 días:
$498.00 (Base estructural a largo plazo)
RSI (Índice de Fuerza Relativa): 56.8 (Impulso neutral a alcista, apuntando hacia arriba sin estar sobrecomprado)
MACD:
Convergencia alcista moderada en formación en los gráficos diarios tras las pruebas recientes de soporte.
Zonas técnicas clave
Tipo de zona
Rango de precios
Análisis y significancia
Zona de oferta / resistencia
$555.00 - $565.00
Bloque de alta liquidez. Los intentos de rally anteriores encontraron una fuerte presión vendedora aquí. Se requiere un cierre diario por encima de $565 para una ruptura importante.
Análisis técnico detallado de BNB / USD
Precio de mercado actual: ~$BNB 542.50
Indicadores técnicos: EMA de 50 días: $530.00 (Actuando como soporte dinámico inmediato)
EMA de 200 días:
$498.00 (Base estructural a largo plazo)
RSI (Índice de Fuerza Relativa): 56.8 (Impulso neutral a alcista, apuntando hacia arriba sin estar sobrecomprado)
MACD:
Convergencia alcista moderada en formación en los gráficos diarios tras las pruebas recientes de soporte.
Zonas técnicas clave
Tipo de zona
Rango de precios
Análisis y significancia
Zona de oferta / resistencia
$555.00 - $565.00
Bloque de alta liquidez. Los intentos de rally anteriores encontraron una fuerte presión vendedora aquí. Se requiere un cierre diario por encima de $565 para una ruptura importante.
Indicadores técnicos: EMA de 50 días: $530.00 (Actuando como soporte dinámico inmediato)
EMA de 200 días:
$498.00 (Base estructural a largo plazo)
RSI (Índice de Fuerza Relativa): 56.8 (Impulso neutral a alcista, apuntando hacia arriba sin estar sobrecomprado)
MACD:
Convergencia alcista moderada en formación en los gráficos diarios tras las pruebas recientes de soporte.
Zonas técnicas clave
Tipo de zona
Rango de precios
Análisis y significancia
Zona de oferta / resistencia
$555.00 - $565.00
Bloque de alta liquidez. Los intentos de rally anteriores encontraron una fuerte presión vendedora aquí. Se requiere un cierre diario por encima de $565 para una ruptura importante.
86
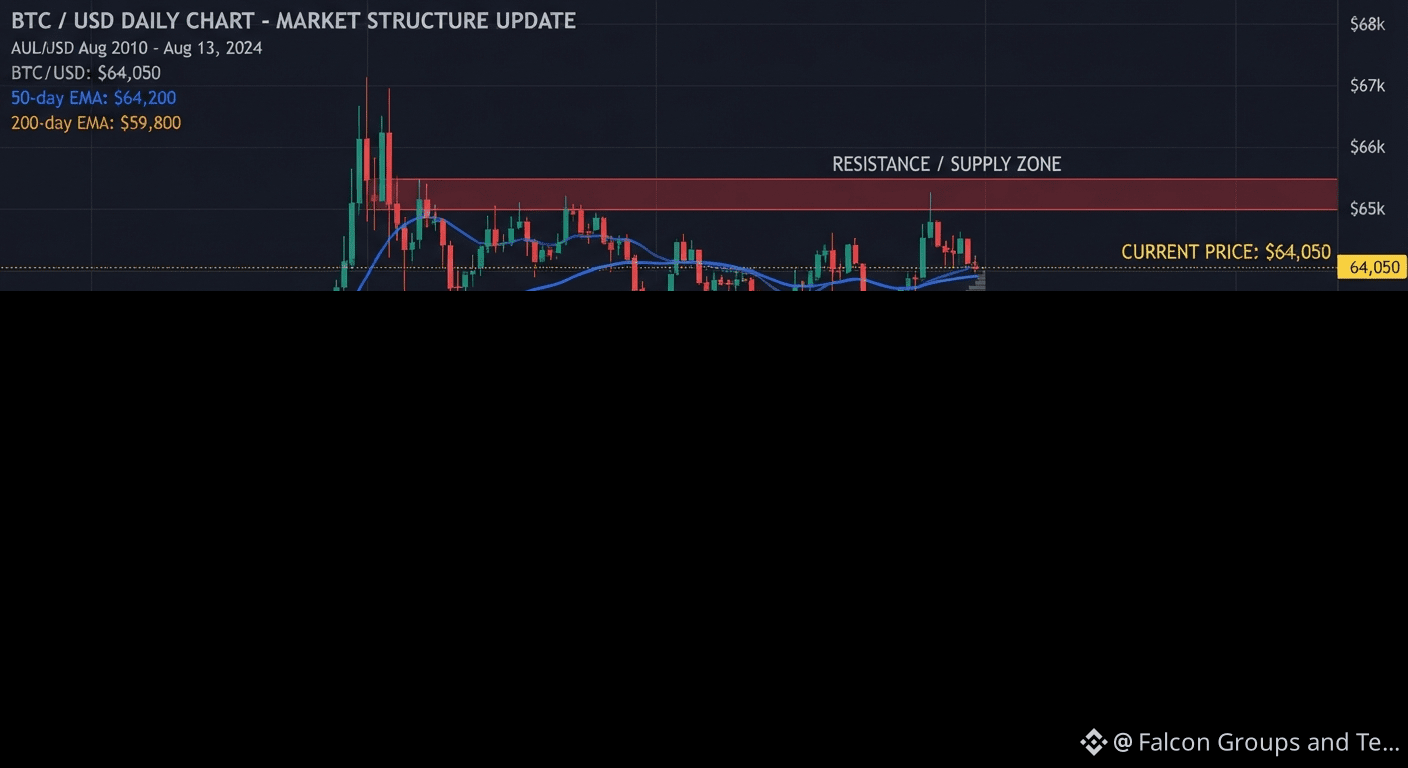
Bitcoin $BTC Análisis de Operaciones
* Precio actual: ~63.800 – 64.000 USD
* Contexto de mercado: $BTC está consolidando en un rango estrecho entre 62.500 y 65.000 USD, reaccionando de cerca a los datos recientes de inflación en EE. UU. (IPC) y a la espera de próximos catalizadores macroeconómicos.
Niveles Técnicos Clave
| Tipo de nivel | Zona de precio / Rango | Significado |
|---|---|---|
| Soporte inmediato | 62.500 – 63.500 USD | Zona de demanda crucial sosteniendo mínimos más altos a corto plazo; una ruptura podría llevar a una caída hacia 61.300 USD. |
| Punto de pivote / Área de ruptura | 64.000 – 64.500 USD | Punto de inflexión a corto plazo; interactúa con la EMA de 50 días (64.583 USD). |
| Resistencia inmediata | 64.900 – 65.300 USD | Zona pesada de oferta/liquidez. Un rechazo aquí podría prolongar el movimiento dentro del rango. |
| Objetivo al alza / Ruptura | 66.700 – 67.500 USD | Un cierre diario confirmado por encima de los objetivos de resistencia apunta a la EMA de 100 días y a máximos locales débiles. |
Escenarios de Operación
* Configuración de continuación alcista (Long):
* Disparador: Buscar un cierre fuerte en una vela de 1H–4H por encima de 65.000 USD respaldado por volumen, o un retest limpio y defensa del bloque de soporte 63.800 – 64.200 USD.
* Objetivos: 65.500 USD y luego 66.750 USD.
* Gestión de riesgo: Stop-loss ajustado estrictamente por debajo de 63.500 USD.
* Configuración bajista / Rechazo del rango (Short):
* Disparador: Rechazo y pérdida de impulso alrededor del área de oferta 64.900 – 65.300 USD.
* Objetivos: Regreso a los mínimos del rango en 62.500 USD.
* Gestión de riesgo: Stop-loss colocado por encima de 65.600 USD.
* Invalidación: Un cierre diario con alto volumen por debajo de 62.000 USD invalida la estructura actual de recuperación a corto plazo, exponiendo un soporte macro más profundo.
#BTC #Actualización_del_Mercado
{spot}(BTCUSDT)
Bitcoin $BTC Análisis de Operaciones
* Precio actual: ~63.800 – 64.000 USD
* Contexto de mercado: $BTC está consolidando en un rango estrecho entre 62.500 y 65.000 USD, reaccionando de cerca a los datos recientes de inflación en EE. UU. (IPC) y a la espera de próximos catalizadores macroeconómicos.
Niveles Técnicos Clave
| Tipo de nivel | Zona de precio / Rango | Significado |
|---|---|---|
| Soporte inmediato | 62.500 – 63.500 USD | Zona de demanda crucial sosteniendo mínimos más altos a corto plazo; una ruptura podría llevar a una caída hacia 61.300 USD. |
| Punto de pivote / Área de ruptura | 64.000 – 64.500 USD | Punto de inflexión a corto plazo; interactúa con la EMA de 50 días (64.583 USD). |
| Resistencia inmediata | 64.900 – 65.300 USD | Zona pesada de oferta/liquidez. Un rechazo aquí podría prolongar el movimiento dentro del rango. |
| Objetivo al alza / Ruptura | 66.700 – 67.500 USD | Un cierre diario confirmado por encima de los objetivos de resistencia apunta a la EMA de 100 días y a máximos locales débiles. |
Escenarios de Operación
* Configuración de continuación alcista (Long):
* Disparador: Buscar un cierre fuerte en una vela de 1H–4H por encima de 65.000 USD respaldado por volumen, o un retest limpio y defensa del bloque de soporte 63.800 – 64.200 USD.
* Objetivos: 65.500 USD y luego 66.750 USD.
* Gestión de riesgo: Stop-loss ajustado estrictamente por debajo de 63.500 USD.
* Configuración bajista / Rechazo del rango (Short):
* Disparador: Rechazo y pérdida de impulso alrededor del área de oferta 64.900 – 65.300 USD.
* Objetivos: Regreso a los mínimos del rango en 62.500 USD.
* Gestión de riesgo: Stop-loss colocado por encima de 65.600 USD.
* Invalidación: Un cierre diario con alto volumen por debajo de 62.000 USD invalida la estructura actual de recuperación a corto plazo, exponiendo un soporte macro más profundo.
#BTC #Actualización_del_Mercado
* Precio actual: ~63.800 – 64.000 USD
* Contexto de mercado: $BTC está consolidando en un rango estrecho entre 62.500 y 65.000 USD, reaccionando de cerca a los datos recientes de inflación en EE. UU. (IPC) y a la espera de próximos catalizadores macroeconómicos.
Niveles Técnicos Clave
| Tipo de nivel | Zona de precio / Rango | Significado |
|---|---|---|
| Soporte inmediato | 62.500 – 63.500 USD | Zona de demanda crucial sosteniendo mínimos más altos a corto plazo; una ruptura podría llevar a una caída hacia 61.300 USD. |
| Punto de pivote / Área de ruptura | 64.000 – 64.500 USD | Punto de inflexión a corto plazo; interactúa con la EMA de 50 días (64.583 USD). |
| Resistencia inmediata | 64.900 – 65.300 USD | Zona pesada de oferta/liquidez. Un rechazo aquí podría prolongar el movimiento dentro del rango. |
| Objetivo al alza / Ruptura | 66.700 – 67.500 USD | Un cierre diario confirmado por encima de los objetivos de resistencia apunta a la EMA de 100 días y a máximos locales débiles. |
Escenarios de Operación
* Configuración de continuación alcista (Long):
* Disparador: Buscar un cierre fuerte en una vela de 1H–4H por encima de 65.000 USD respaldado por volumen, o un retest limpio y defensa del bloque de soporte 63.800 – 64.200 USD.
* Objetivos: 65.500 USD y luego 66.750 USD.
* Gestión de riesgo: Stop-loss ajustado estrictamente por debajo de 63.500 USD.
* Configuración bajista / Rechazo del rango (Short):
* Disparador: Rechazo y pérdida de impulso alrededor del área de oferta 64.900 – 65.300 USD.
* Objetivos: Regreso a los mínimos del rango en 62.500 USD.
* Gestión de riesgo: Stop-loss colocado por encima de 65.600 USD.
* Invalidación: Un cierre diario con alto volumen por debajo de 62.000 USD invalida la estructura actual de recuperación a corto plazo, exponiendo un soporte macro más profundo.
#BTC #Actualización_del_Mercado
75
Inicia sesión para explorar más contenidos
Únete a usuarios de criptomonedas de todo el mundo en Binance Square
⚡️ Obtén la información más reciente y útil sobre criptomonedas.
💬 Confía en el mayor exchange de criptomonedas del mundo.
👍 Descubre opiniones reales de creadores verificados.
Correo electrónico/número de teléfono
Temas en tendencia
EarningsSeason
26,963 visualizaciones
194 participa(n) en el debate
Temporada de Resultados: Ganancias del 4T de Micron — ¿Alcista o Bajista?
Binance Square Official
·16 «Me gusta»
·1.7k visualizaciones
BitgetHackerFailsToMoveStolenFunds
1,161 visualizaciones
113 participa(n) en el debate
BitMineETHHoldingsTop6Million
4,562 visualizaciones
265 participa(n) en el debate