
Sadam Jamali
1 Publicaciones

Sadam Jamali
Denunciar
Bloquear usuario
2 Siguiendo
4 Seguidores
0 Me gusta
Publicaciones
·
--
Ver traducción
$BTC
{spot}(BTCUSDT)
#ADPJobsSurge✨ #BinaceHODLerMMT #PrivacyCoinSurge BTC/USDT — 1H Technical Analysis
30 October 2026 | Short-term bias: Bearish 📉
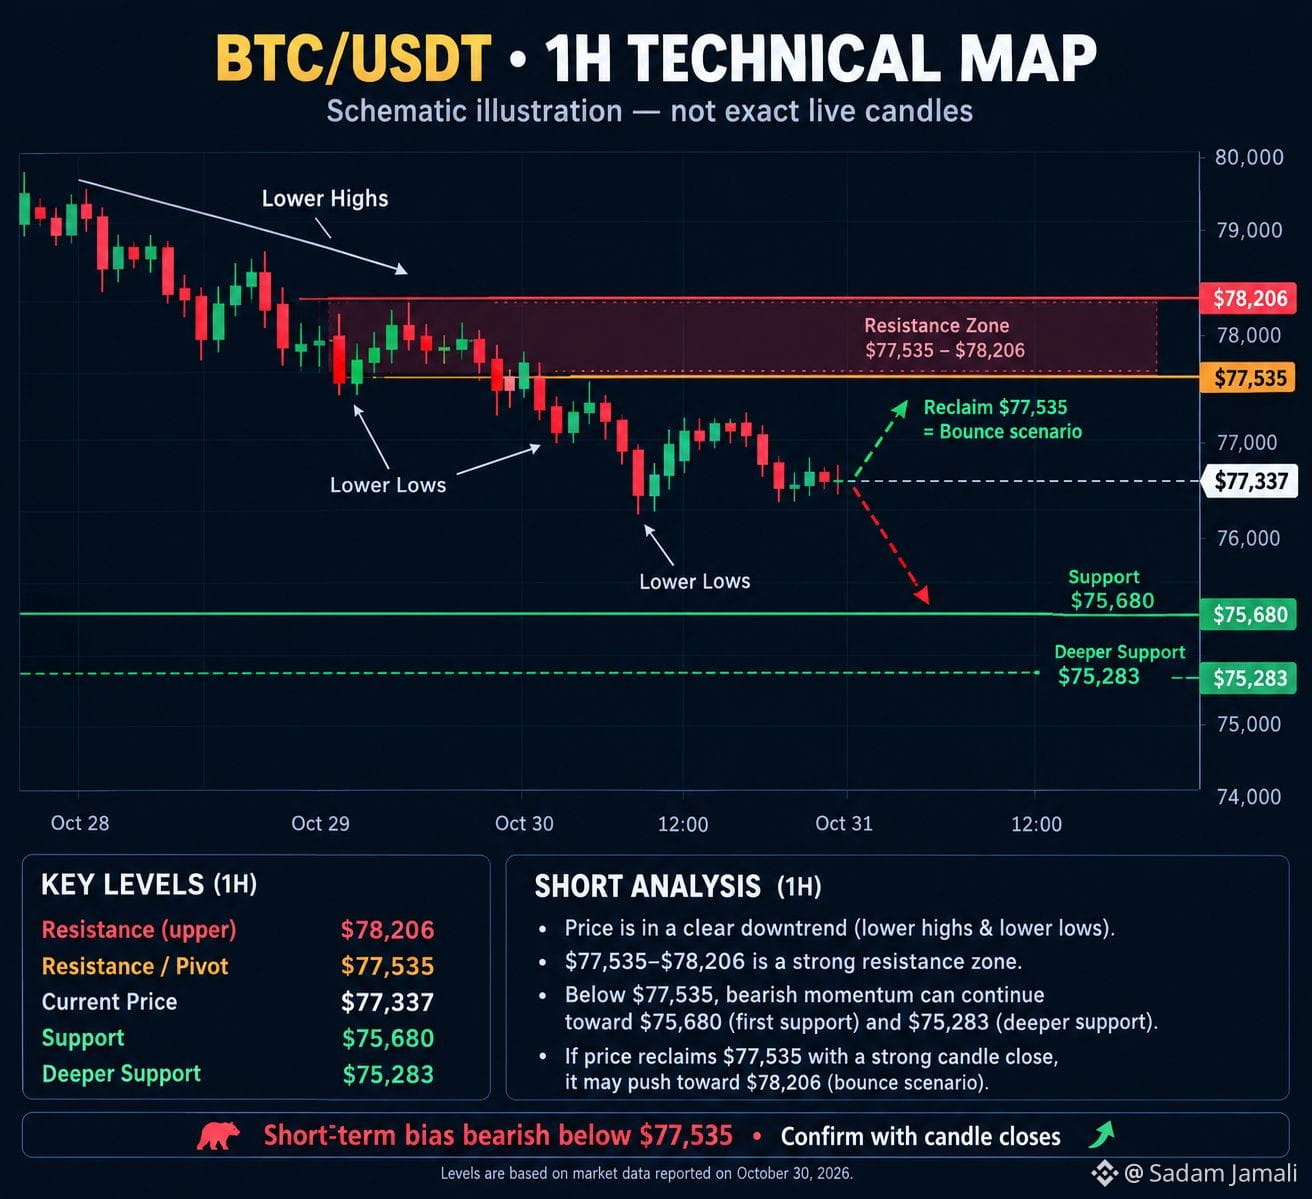
Bitcoin is trading around $77,300–$77,800 in the latest market data I found. The short-term picture leans bearish, with selling pressure and weak momentum.
Key levels to watch:
Resistance: $77,535, then $78,200.
Support: $75,680, then $75,280.
Bullish possibility: Price reclaims resistance and holds above it.
Bearish possibility: Price remains below resistance and breaks support.
These are reference levels, not guaranteed price targets.
Chart reading: The chart above is a schematic based on reported market levels, not an exact live Binance chart.
For learning technical analysis, focus on these three things:
Market structure: Lower highs and lower lows indicate a downtrend.
Support and resistance: Watch how price behaves around the marked zones.
Confirmation: A candle closing beyond a level is more informative than a brief wick through it.
Bitcoin can reverse quickly, so treat these levels as observations rather than predictions.
$BTC
#ADPJobsSurge✨ #BinaceHODLerMMT #PrivacyCoinSurge BTC/USDT — 1H Technical Analysis
30 October 2026 | Short-term bias: Bearish 📉
Bitcoin is trading around $77,300–$77,800 in the latest market data I found. The short-term picture leans bearish, with selling pressure and weak momentum.
Key levels to watch:
Resistance: $77,535, then $78,200.
Support: $75,680, then $75,280.
Bullish possibility: Price reclaims resistance and holds above it.
Bearish possibility: Price remains below resistance and breaks support.
These are reference levels, not guaranteed price targets.
Chart reading: The chart above is a schematic based on reported market levels, not an exact live Binance chart.
For learning technical analysis, focus on these three things:
Market structure: Lower highs and lower lows indicate a downtrend.
Support and resistance: Watch how price behaves around the marked zones.
Confirmation: A candle closing beyond a level is more informative than a brief wick through it.
Bitcoin can reverse quickly, so treat these levels as observations rather than predictions.
#ADPJobsSurge✨ #BinaceHODLerMMT #PrivacyCoinSurge BTC/USDT — 1H Technical Analysis
30 October 2026 | Short-term bias: Bearish 📉
Bitcoin is trading around $77,300–$77,800 in the latest market data I found. The short-term picture leans bearish, with selling pressure and weak momentum.
Key levels to watch:
Resistance: $77,535, then $78,200.
Support: $75,680, then $75,280.
Bullish possibility: Price reclaims resistance and holds above it.
Bearish possibility: Price remains below resistance and breaks support.
These are reference levels, not guaranteed price targets.
Chart reading: The chart above is a schematic based on reported market levels, not an exact live Binance chart.
For learning technical analysis, focus on these three things:
Market structure: Lower highs and lower lows indicate a downtrend.
Support and resistance: Watch how price behaves around the marked zones.
Confirmation: A candle closing beyond a level is more informative than a brief wick through it.
Bitcoin can reverse quickly, so treat these levels as observations rather than predictions.
70
Inicia sesión para explorar más contenidos
Únete a usuarios de criptomonedas de todo el mundo en Binance Square
⚡️ Obtén la información más reciente y útil sobre criptomonedas.
💬 Confía en el mayor exchange de criptomonedas del mundo.
👍 Descubre opiniones reales de creadores verificados.
Correo electrónico/número de teléfono
Temas en tendencia
USMidterms-WhatAreMarketsExpecting?
50,348 visualizaciones
529 participa(n) en el debate
La victoria demócrata en el Congreso sacude las apuestas por Trump en acciones de IA y criptomonedas
Binance News
·7 «Me gusta»
·3k visualizaciones
USOctoberNFP-AreRateCutsStillPossible
225,243 visualizaciones
1,781 participa(n) en el debate
AMDBeatsExpectations-AINarrativeContinues
10,254 visualizaciones
202 participa(n) en el debate