
MrAwaisBilal
4 Publicaciones

MrAwaisBilal
Denunciar
Bloquear usuario
Abrir operación
9.1 meses
0 Siguiendo
11 Seguidores
7 Me gusta
Publicaciones
Cartera
·
--
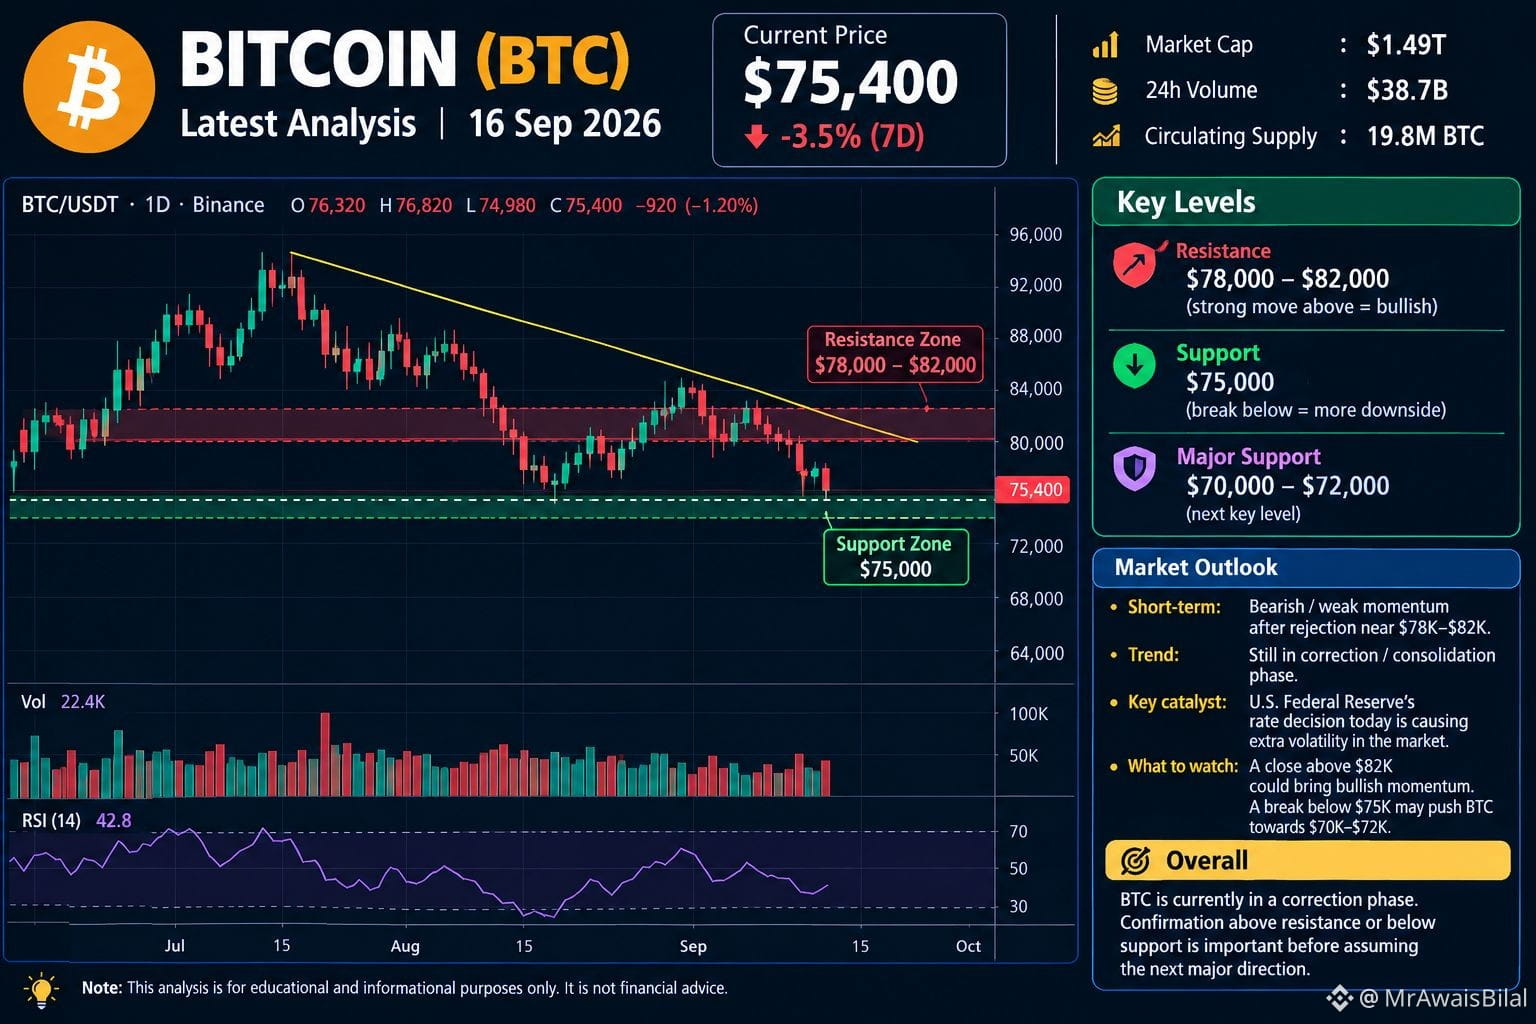
$BTC bitcoin — Último análisis
Precio actual: alrededor de 75.400 dólares. BTC está bajando aproximadamente un 3,5% durante los últimos 7 días. �
CoinGecko +1
Corto plazo: Bajista/debilidad de impulso tras el rechazo cerca de la zona de 78K–82K.
Soporte: 75K es un nivel importante a corto plazo; si se pierde, podría exponer niveles más bajos.
Resistencia: 78K–82K. Un movimiento fuerte de vuelta por encima de esta zona mejoraría la estructura a corto plazo.
Catalizador principal de hoy: La decisión de tipos del Sistema de la Reserva Federal de EE. UU. está creando una volatilidad adicional en el mercado. �
reuters.com +1
En general: BTC actualmente está en una fase de corrección/consolidación, por lo que es importante confirmar por encima de la resistencia o por debajo del soporte antes de asumir la próxima dirección importante.
*Este es un análisis de mercado, no una garantía ni asesoramiento financiero.*#FedRateWatch #USSenateBlocksClarityAct #StrategyMarketCapPassesFord #ClarityActOddsHalveOnPolymarket #US30YTreasuryYieldTops5.40%
$BTC bitcoin — Último análisis
Precio actual: alrededor de 75.400 dólares. BTC está bajando aproximadamente un 3,5% durante los últimos 7 días. �
CoinGecko +1
Corto plazo: Bajista/debilidad de impulso tras el rechazo cerca de la zona de 78K–82K.
Soporte: 75K es un nivel importante a corto plazo; si se pierde, podría exponer niveles más bajos.
Resistencia: 78K–82K. Un movimiento fuerte de vuelta por encima de esta zona mejoraría la estructura a corto plazo.
Catalizador principal de hoy: La decisión de tipos del Sistema de la Reserva Federal de EE. UU. está creando una volatilidad adicional en el mercado. �
reuters.com +1
En general: BTC actualmente está en una fase de corrección/consolidación, por lo que es importante confirmar por encima de la resistencia o por debajo del soporte antes de asumir la próxima dirección importante.
*Este es un análisis de mercado, no una garantía ni asesoramiento financiero.*#FedRateWatch #USSenateBlocksClarityAct #StrategyMarketCapPassesFord #ClarityActOddsHalveOnPolymarket #US30YTreasuryYieldTops5.40%
Precio actual: alrededor de 75.400 dólares. BTC está bajando aproximadamente un 3,5% durante los últimos 7 días. �
CoinGecko +1
Corto plazo: Bajista/debilidad de impulso tras el rechazo cerca de la zona de 78K–82K.
Soporte: 75K es un nivel importante a corto plazo; si se pierde, podría exponer niveles más bajos.
Resistencia: 78K–82K. Un movimiento fuerte de vuelta por encima de esta zona mejoraría la estructura a corto plazo.
Catalizador principal de hoy: La decisión de tipos del Sistema de la Reserva Federal de EE. UU. está creando una volatilidad adicional en el mercado. �
reuters.com +1
En general: BTC actualmente está en una fase de corrección/consolidación, por lo que es importante confirmar por encima de la resistencia o por debajo del soporte antes de asumir la próxima dirección importante.
*Este es un análisis de mercado, no una garantía ni asesoramiento financiero.*#FedRateWatch #USSenateBlocksClarityAct #StrategyMarketCapPassesFord #ClarityActOddsHalveOnPolymarket #US30YTreasuryYieldTops5.40%
69
·
--
Ver traducción
Analyst Who Correctly Predicted XRP Crash to $1.88 Sets His Next Price Target$XRP As noted by market expert Dark Defender, the XRP price has completed Wave 4 in its Elliot Wave pattern and is poised to soar over 200% from here.
The XRP price is on the cusp of a significant movement, as the token has completed Wave 4 in its Elliot Wave pattern. As the altcoin continues to advance in line with predictions, market experts like Dark Defender set sights on a new target of $5.85 in Wave 5, an over 207% rise from the current price.
✨Bear Market Hasn’t Yet Started
In a recent X post, crypto analyst Dark Defender shared his bullish perspectives on the XRP token. The analyst utilized Elliott Wave theory, asserting that XRP will achieve a new peak in this cycle.
Notably, Dark Defender has been tracking the Wave 4 since February 13, 2025. Based on his analysis, the token completed Wave A at $1.60 in April and Wave B at $3.66 in July. The analyst marked $1.88 as the completion point of Wave C of the Monthly Wave 4, which is now technically confirmed as done.
Dark Defender noted that he stayed calm during XRP’s price movements, identifying a key support zone between $2.2222 and $1.8815. While XRP dropped to this level, it managed to bounce back, completing Wave C of Wave 4 at $1.88.
✨Ignore FUD
In his previous analysis in February, Dark Defender urged investors and traders to ignore FUD (Fear, Uncertainty, Doubt) and instead focus on the potential developments. He presented a technical analysis chart for the XRP/USD pair, outlining its long-term projection based on historical market cycles and technical indicators.
Using the Elliot Wave theory and Fibonacci levels, the expert identified the key support around $1.88, which has been tested and held firm during market corrections. According to his analysis, Waves 1 to 3 show a clear impulsive structure.
Building on this momentum, Wave 4 has also unfolded as a healthy corrective phase, retracing toward the $1.90–$2.00 zone in line with the 70.2% Fibonacci level. During this phase, the XRP price managed to stay above critical structural support and preserve the broader bullish trend.
Currently, XRP is experiencing high volatility. At the time of writing, the crypto token trades for $1.88, down 5.6% in a day. This negative momentum is further bolstered by its weekly and monthly declines, having dropped 8% in a week and 16% in a month.
🚀🚀🚀 FOLLOW BE_MASTER BUY_SMART 💰💰💰
Appreciate the work. 😍 Thank You. 👍 FOLLOW BeMaster BuySmart 🚀 TO FIND OUT MORE $$$$$ 🤩 BE MASTER BUY SMART 💰🤩
🚀🚀🚀 PLEASE CLICK FOLLOW BE MASTER BUY SMART - Thank You.
$BTC
{spot}(BTCUSDT)
$XRP
{spot}(XRPUSDT)
#USNonFarmPayrollReport #USJobsData #BTCVSGOLD #CPIWatch #TrumpTariffs
Analyst Who Correctly Predicted XRP Crash to $1.88 Sets His Next Price Target
$XRP As noted by market expert Dark Defender, the XRP price has completed Wave 4 in its Elliot Wave pattern and is poised to soar over 200% from here.
The XRP price is on the cusp of a significant movement, as the token has completed Wave 4 in its Elliot Wave pattern. As the altcoin continues to advance in line with predictions, market experts like Dark Defender set sights on a new target of $5.85 in Wave 5, an over 207% rise from the current price.
✨Bear Market Hasn’t Yet Started
In a recent X post, crypto analyst Dark Defender shared his bullish perspectives on the XRP token. The analyst utilized Elliott Wave theory, asserting that XRP will achieve a new peak in this cycle.
Notably, Dark Defender has been tracking the Wave 4 since February 13, 2025. Based on his analysis, the token completed Wave A at $1.60 in April and Wave B at $3.66 in July. The analyst marked $1.88 as the completion point of Wave C of the Monthly Wave 4, which is now technically confirmed as done.
Dark Defender noted that he stayed calm during XRP’s price movements, identifying a key support zone between $2.2222 and $1.8815. While XRP dropped to this level, it managed to bounce back, completing Wave C of Wave 4 at $1.88.
✨Ignore FUD
In his previous analysis in February, Dark Defender urged investors and traders to ignore FUD (Fear, Uncertainty, Doubt) and instead focus on the potential developments. He presented a technical analysis chart for the XRP/USD pair, outlining its long-term projection based on historical market cycles and technical indicators.
Using the Elliot Wave theory and Fibonacci levels, the expert identified the key support around $1.88, which has been tested and held firm during market corrections. According to his analysis, Waves 1 to 3 show a clear impulsive structure.
Building on this momentum, Wave 4 has also unfolded as a healthy corrective phase, retracing toward the $1.90–$2.00 zone in line with the 70.2% Fibonacci level. During this phase, the XRP price managed to stay above critical structural support and preserve the broader bullish trend.
Currently, XRP is experiencing high volatility. At the time of writing, the crypto token trades for $1.88, down 5.6% in a day. This negative momentum is further bolstered by its weekly and monthly declines, having dropped 8% in a week and 16% in a month.
🚀🚀🚀 FOLLOW BE_MASTER BUY_SMART 💰💰💰
Appreciate the work. 😍 Thank You. 👍 FOLLOW BeMaster BuySmart 🚀 TO FIND OUT MORE $$$$$ 🤩 BE MASTER BUY SMART 💰🤩
🚀🚀🚀 PLEASE CLICK FOLLOW BE MASTER BUY SMART - Thank You.
$BTC
$XRP
#USNonFarmPayrollReport #USJobsData #BTCVSGOLD #CPIWatch #TrumpTariffs
The XRP price is on the cusp of a significant movement, as the token has completed Wave 4 in its Elliot Wave pattern. As the altcoin continues to advance in line with predictions, market experts like Dark Defender set sights on a new target of $5.85 in Wave 5, an over 207% rise from the current price.
✨Bear Market Hasn’t Yet Started
In a recent X post, crypto analyst Dark Defender shared his bullish perspectives on the XRP token. The analyst utilized Elliott Wave theory, asserting that XRP will achieve a new peak in this cycle.
Notably, Dark Defender has been tracking the Wave 4 since February 13, 2025. Based on his analysis, the token completed Wave A at $1.60 in April and Wave B at $3.66 in July. The analyst marked $1.88 as the completion point of Wave C of the Monthly Wave 4, which is now technically confirmed as done.
Dark Defender noted that he stayed calm during XRP’s price movements, identifying a key support zone between $2.2222 and $1.8815. While XRP dropped to this level, it managed to bounce back, completing Wave C of Wave 4 at $1.88.
✨Ignore FUD
In his previous analysis in February, Dark Defender urged investors and traders to ignore FUD (Fear, Uncertainty, Doubt) and instead focus on the potential developments. He presented a technical analysis chart for the XRP/USD pair, outlining its long-term projection based on historical market cycles and technical indicators.
Using the Elliot Wave theory and Fibonacci levels, the expert identified the key support around $1.88, which has been tested and held firm during market corrections. According to his analysis, Waves 1 to 3 show a clear impulsive structure.
Building on this momentum, Wave 4 has also unfolded as a healthy corrective phase, retracing toward the $1.90–$2.00 zone in line with the 70.2% Fibonacci level. During this phase, the XRP price managed to stay above critical structural support and preserve the broader bullish trend.
Currently, XRP is experiencing high volatility. At the time of writing, the crypto token trades for $1.88, down 5.6% in a day. This negative momentum is further bolstered by its weekly and monthly declines, having dropped 8% in a week and 16% in a month.
🚀🚀🚀 FOLLOW BE_MASTER BUY_SMART 💰💰💰
Appreciate the work. 😍 Thank You. 👍 FOLLOW BeMaster BuySmart 🚀 TO FIND OUT MORE $$$$$ 🤩 BE MASTER BUY SMART 💰🤩
🚀🚀🚀 PLEASE CLICK FOLLOW BE MASTER BUY SMART - Thank You.
$BTC
$XRP
#USNonFarmPayrollReport #USJobsData #BTCVSGOLD #CPIWatch #TrumpTariffs
1
·
--
Ver traducción
Japan could shake the global market on 19 December 2025 📅
Guys I need just 2 minutes of your time, Listen carefully👇👇👇👇
Japan quietly supported global markets for many years… and now that support is vanashing.
Here’s what Japan was doing (in very simple words) 👇
1. For almost 30 years, Japan kept interest rates near zero.
2. That means borrowing Japanese yen was very cheap.
3. Big investors used this cheap yen like “fuel”:
Borrow yen cheaply
Convert it into dollars/other currencies
Buy stocks, bonds, and crypto
This is called the yen carry trade.
Now what has changed? ⚠️
Japan is raising interest rates (highest expected in 31 years)
Why does this matter to crypto and global markets?
Because when borrowing yen becomes expensive… the opposite happens 👇
1. Investors borrow less money
2. Many investors reduce risky positions
3. Some will sell assets (including crypto) to pay back yen loans
4. That means liquidity can leave the market
And when liquidity leaves, markets feel pressure.
That’s why 19 December is important.
If Japan hikes rates, we can see a strong move downward in crypto too.
We’ve seen this pattern before 📉
March 2024: Japan hike → BTC dropped about 23%
July 2024: Japan hike → BTC dropped about 26%
January 2025: Japan hike → BTC dropped about 31%
So my pandas , trade carefully 🙏
Volatility around 19 December can be huge. If the interest rates hike up and BTC is expected to dump to 70k
Also remember: PandaTraders warned about the last drop before hand
We called the crash from 90K, and BTC dumped to 85K, hitting our targets ✅
As usual Panda Traders is monitoring the market 24/7 for you guys and maintains the legacy of informing you before every major crash and every big pump‼️
Once we get confirmation, we will look to short BTC on 19th december
Keep Following Panda Traders for daily BTC updates and crash alerts ✅
$BTC $XRP $SOL
{spot}(SOLUSDT)
{spot}(BTCUSDT)
{spot}(XRPUSDT)
#USNonFarmPayrollReport #TrumpTariffs #WriteToEarnUpgrade #BTCVSGOLD #BinanceBlockchainWeek
Japan could shake the global market on 19 December 2025 📅
Guys I need just 2 minutes of your time, Listen carefully👇👇👇👇
Japan quietly supported global markets for many years… and now that support is vanashing.
Here’s what Japan was doing (in very simple words) 👇
1. For almost 30 years, Japan kept interest rates near zero.
2. That means borrowing Japanese yen was very cheap.
3. Big investors used this cheap yen like “fuel”:
Borrow yen cheaply
Convert it into dollars/other currencies
Buy stocks, bonds, and crypto
This is called the yen carry trade.
Now what has changed? ⚠️
Japan is raising interest rates (highest expected in 31 years)
Why does this matter to crypto and global markets?
Because when borrowing yen becomes expensive… the opposite happens 👇
1. Investors borrow less money
2. Many investors reduce risky positions
3. Some will sell assets (including crypto) to pay back yen loans
4. That means liquidity can leave the market
And when liquidity leaves, markets feel pressure.
That’s why 19 December is important.
If Japan hikes rates, we can see a strong move downward in crypto too.
We’ve seen this pattern before 📉
March 2024: Japan hike → BTC dropped about 23%
July 2024: Japan hike → BTC dropped about 26%
January 2025: Japan hike → BTC dropped about 31%
So my pandas , trade carefully 🙏
Volatility around 19 December can be huge. If the interest rates hike up and BTC is expected to dump to 70k
Also remember: PandaTraders warned about the last drop before hand
We called the crash from 90K, and BTC dumped to 85K, hitting our targets ✅
As usual Panda Traders is monitoring the market 24/7 for you guys and maintains the legacy of informing you before every major crash and every big pump‼️
Once we get confirmation, we will look to short BTC on 19th december
Keep Following Panda Traders for daily BTC updates and crash alerts ✅
$BTC $XRP $SOL
#USNonFarmPayrollReport #TrumpTariffs #WriteToEarnUpgrade #BTCVSGOLD #BinanceBlockchainWeek
Guys I need just 2 minutes of your time, Listen carefully👇👇👇👇
Japan quietly supported global markets for many years… and now that support is vanashing.
Here’s what Japan was doing (in very simple words) 👇
1. For almost 30 years, Japan kept interest rates near zero.
2. That means borrowing Japanese yen was very cheap.
3. Big investors used this cheap yen like “fuel”:
Borrow yen cheaply
Convert it into dollars/other currencies
Buy stocks, bonds, and crypto
This is called the yen carry trade.
Now what has changed? ⚠️
Japan is raising interest rates (highest expected in 31 years)
Why does this matter to crypto and global markets?
Because when borrowing yen becomes expensive… the opposite happens 👇
1. Investors borrow less money
2. Many investors reduce risky positions
3. Some will sell assets (including crypto) to pay back yen loans
4. That means liquidity can leave the market
And when liquidity leaves, markets feel pressure.
That’s why 19 December is important.
If Japan hikes rates, we can see a strong move downward in crypto too.
We’ve seen this pattern before 📉
March 2024: Japan hike → BTC dropped about 23%
July 2024: Japan hike → BTC dropped about 26%
January 2025: Japan hike → BTC dropped about 31%
So my pandas , trade carefully 🙏
Volatility around 19 December can be huge. If the interest rates hike up and BTC is expected to dump to 70k
Also remember: PandaTraders warned about the last drop before hand
We called the crash from 90K, and BTC dumped to 85K, hitting our targets ✅
As usual Panda Traders is monitoring the market 24/7 for you guys and maintains the legacy of informing you before every major crash and every big pump‼️
Once we get confirmation, we will look to short BTC on 19th december
Keep Following Panda Traders for daily BTC updates and crash alerts ✅
$BTC $XRP $SOL
#USNonFarmPayrollReport #TrumpTariffs #WriteToEarnUpgrade #BTCVSGOLD #BinanceBlockchainWeek

1
·
--
Ver traducción
Btc $BTC – Latest Market Analysis
Current Trend:
Bitcoin is trading in a consolidation phase, moving sideways after a strong bullish rally earlier. The price is holding above key support, which shows that long-term buyers are still active.
Market Structure:
Support Zone: $88,000 – $90,000
Resistance Zone: $98,000 – $100,000
Volume is moderate, suggesting traders are waiting for a clear breakout direction.
Technical Outlook:
As long as BTC stays above support, the trend remains bullish-neutral.
A breakout above $100K could trigger strong upside momentum.
If support breaks, a short-term correction toward $85K is possible.
Sentiment:
Market sentiment is mixed but stable. Institutional interest and long-term holding continue to support Bitcoin’s price.
---
📈 Simple Price Chart (Illustration)
Price
100K ┤ ▲
98K ┤ ▲ │ Resistance
95K ┤ ▲ │
92K ┤ ▲ │
90K ┼────▲───────┼── Support
88K ┤ ▲
└────────────────── Time
{spot}(BTCUSDT)
#TrumpTariffs #WriteToEarnUpgrade #USJobsData #BinanceBlockchainWeek #BTCVSGOLD
Btc
$BTC – Latest Market Analysis
Current Trend:
Bitcoin is trading in a consolidation phase, moving sideways after a strong bullish rally earlier. The price is holding above key support, which shows that long-term buyers are still active.
Market Structure:
Support Zone: $88,000 – $90,000
Resistance Zone: $98,000 – $100,000
Volume is moderate, suggesting traders are waiting for a clear breakout direction.
Technical Outlook:
As long as BTC stays above support, the trend remains bullish-neutral.
A breakout above $100K could trigger strong upside momentum.
If support breaks, a short-term correction toward $85K is possible.
Sentiment:
Market sentiment is mixed but stable. Institutional interest and long-term holding continue to support Bitcoin’s price.
---
📈 Simple Price Chart (Illustration)
Price
100K ┤ ▲
98K ┤ ▲ │ Resistance
95K ┤ ▲ │
92K ┤ ▲ │
90K ┼────▲───────┼── Support
88K ┤ ▲
└────────────────── Time
#TrumpTariffs #WriteToEarnUpgrade #USJobsData #BinanceBlockchainWeek #BTCVSGOLD
Current Trend:
Bitcoin is trading in a consolidation phase, moving sideways after a strong bullish rally earlier. The price is holding above key support, which shows that long-term buyers are still active.
Market Structure:
Support Zone: $88,000 – $90,000
Resistance Zone: $98,000 – $100,000
Volume is moderate, suggesting traders are waiting for a clear breakout direction.
Technical Outlook:
As long as BTC stays above support, the trend remains bullish-neutral.
A breakout above $100K could trigger strong upside momentum.
If support breaks, a short-term correction toward $85K is possible.
Sentiment:
Market sentiment is mixed but stable. Institutional interest and long-term holding continue to support Bitcoin’s price.
---
📈 Simple Price Chart (Illustration)
Price
100K ┤ ▲
98K ┤ ▲ │ Resistance
95K ┤ ▲ │
92K ┤ ▲ │
90K ┼────▲───────┼── Support
88K ┤ ▲
└────────────────── Time
#TrumpTariffs #WriteToEarnUpgrade #USJobsData #BinanceBlockchainWeek #BTCVSGOLD
7
7
Inicia sesión para explorar más contenidos
Únete a usuarios de criptomonedas de todo el mundo en Binance Square
⚡️ Obtén la información más reciente y útil sobre criptomonedas.
💬 Confía en el mayor exchange de criptomonedas del mundo.
👍 Descubre opiniones reales de creadores verificados.
Correo electrónico/número de teléfono
Temas en tendencia
FedRateWatch
692,784 visualizaciones
3,301 participa(n) en el debate
Comparte y gana recompensas de tráfico en nuestra campaña de hashtag en tendencia
✨Tema: FOMC septiembre, ¿cuál será el próximo movimiento de la Fed?
👉Cómo unirte:
Publica una publicación breve o un artículo con el hashtag #FedRateWatch
Crea contenido basado en los siguientes enfoques:
- El CPI subyacente de agosto aumentó 0.3% mes a mes, y las probabilidades de una subida de 25 pb esta semana ahora están cerca del 90%. ¿Anticipas una subida de tasas esta semana? ¿Es algo puntual o el inicio de un ciclo de subidas más largo?
- Si la subida ocurre, ¿cómo se desarrolla para BTC, acciones tecnológicas y oro? ¿Alcista o bajista?
- ¿Cómo planeas operar a continuación? Comparte tu operación/tenencias de BTC, acciones u oro con nuestro widget para compartir operaciones.
⏰Periodo de la campaña:
- 2026-09-15 11:00 - 2026-09-17 3:00 UTC
🎁Recompensa:
- Las publicaciones que cumplan con las pautas anteriores y tengan más de 100 palabras serán revisadas y podrían recibir un impulso aleatorio de tráfico de 500 a 3,000 visitas. Recibirás una notificación de tu secretario/a de feed si tu publicación es seleccionada.
- Obtén la oportunidad de que tu artículo aparezca destacado en Binance Square Official
¿Necesitas ideas para tu publicación? Visita la página del tema #FedRateWatch o la Square Guide on How to Post for Better Reach.
Binance Square Official
·427 «Me gusta»
·964.8k visualizaciones
ArgentinaCommitsToOECDCryptoReportingBy2029
0 visualizaciones
0 participa(n) en el debate
EthereumFallsBelow$2400
1,059 visualizaciones
37 participa(n) en el debate