
ChFarooq11
8 Publicaciones

ChFarooq11
Denunciar
Bloquear usuario
2 Siguiendo
15 Seguidores
13 Me gusta
Publicaciones
·
--
$ETH
es una de las principales criptomonedas del mundo. Es una plataforma de cadena de bloques descentralizada que admite contratos inteligentes, aplicaciones descentralizadas (DApps) y finanzas digitales.
Panorama actual del mercado
Al 6 de noviembre de 2026, Ethereum cotiza en torno a los 2.236–2.240 dólares, con una caída aproximada del 7,8 % en las últimas 24 horas.
Análisis técnico
Tendencia del mercado: bajista a corto plazo.
Nivel de soporte: en torno a 2.200–2.220 dólares.
Nivel de resistencia: en torno a 2.279–2.330 dólares.
Momentum: la presión vendedora sigue siendo elevada.
Perspectivas del mercado: Ethereum necesita recuperar niveles de resistencia importantes para mostrar señales de recuperación.
Conclusión
Ethereum tiene una gran importancia tecnológica a largo plazo gracias a su ecosistema de cadena de bloques, sus contratos inteligentes y sus aplicaciones DeFi. Sin embargo, las condiciones actuales del mercado muestran debilidad y una alta volatilidad. Su rendimiento futuro dependerá de la demanda del mercado, el sentimiento de los inversores, el desarrollo de la red y las condiciones económicas mundiales.
Importante: este análisis del mercado tiene fines educativos y no constituye asesoramiento financiero. Los precios de las criptomonedas pueden cambiar rápidamente.
{spot}(ETHUSDT)
#AnthropicIPOValuationDoubts #USStocksSlipandCryptoMarketUnderBroadPressure #BinanceReopensWithdrawalsForMoreAssets #USStocksSufferSteepestRoutSince2020 #StrategySTRCResumesIssuanceAfterOver170Days
$ETH
es una de las principales criptomonedas del mundo. Es una plataforma de cadena de bloques descentralizada que admite contratos inteligentes, aplicaciones descentralizadas (DApps) y finanzas digitales.
Panorama actual del mercado
Al 6 de noviembre de 2026, Ethereum cotiza en torno a los 2.236–2.240 dólares, con una caída aproximada del 7,8 % en las últimas 24 horas.
Análisis técnico
Tendencia del mercado: bajista a corto plazo.
Nivel de soporte: en torno a 2.200–2.220 dólares.
Nivel de resistencia: en torno a 2.279–2.330 dólares.
Momentum: la presión vendedora sigue siendo elevada.
Perspectivas del mercado: Ethereum necesita recuperar niveles de resistencia importantes para mostrar señales de recuperación.
Conclusión
Ethereum tiene una gran importancia tecnológica a largo plazo gracias a su ecosistema de cadena de bloques, sus contratos inteligentes y sus aplicaciones DeFi. Sin embargo, las condiciones actuales del mercado muestran debilidad y una alta volatilidad. Su rendimiento futuro dependerá de la demanda del mercado, el sentimiento de los inversores, el desarrollo de la red y las condiciones económicas mundiales.
Importante: este análisis del mercado tiene fines educativos y no constituye asesoramiento financiero. Los precios de las criptomonedas pueden cambiar rápidamente.
#AnthropicIPOValuationDoubts #USStocksSlipandCryptoMarketUnderBroadPressure #BinanceReopensWithdrawalsForMoreAssets #USStocksSufferSteepestRoutSince2020 #StrategySTRCResumesIssuanceAfterOver170Days
es una de las principales criptomonedas del mundo. Es una plataforma de cadena de bloques descentralizada que admite contratos inteligentes, aplicaciones descentralizadas (DApps) y finanzas digitales.
Panorama actual del mercado
Al 6 de noviembre de 2026, Ethereum cotiza en torno a los 2.236–2.240 dólares, con una caída aproximada del 7,8 % en las últimas 24 horas.
Análisis técnico
Tendencia del mercado: bajista a corto plazo.
Nivel de soporte: en torno a 2.200–2.220 dólares.
Nivel de resistencia: en torno a 2.279–2.330 dólares.
Momentum: la presión vendedora sigue siendo elevada.
Perspectivas del mercado: Ethereum necesita recuperar niveles de resistencia importantes para mostrar señales de recuperación.
Conclusión
Ethereum tiene una gran importancia tecnológica a largo plazo gracias a su ecosistema de cadena de bloques, sus contratos inteligentes y sus aplicaciones DeFi. Sin embargo, las condiciones actuales del mercado muestran debilidad y una alta volatilidad. Su rendimiento futuro dependerá de la demanda del mercado, el sentimiento de los inversores, el desarrollo de la red y las condiciones económicas mundiales.
Importante: este análisis del mercado tiene fines educativos y no constituye asesoramiento financiero. Los precios de las criptomonedas pueden cambiar rápidamente.
#AnthropicIPOValuationDoubts #USStocksSlipandCryptoMarketUnderBroadPressure #BinanceReopensWithdrawalsForMoreAssets #USStocksSufferSteepestRoutSince2020 #StrategySTRCResumesIssuanceAfterOver170Days

21
·
--
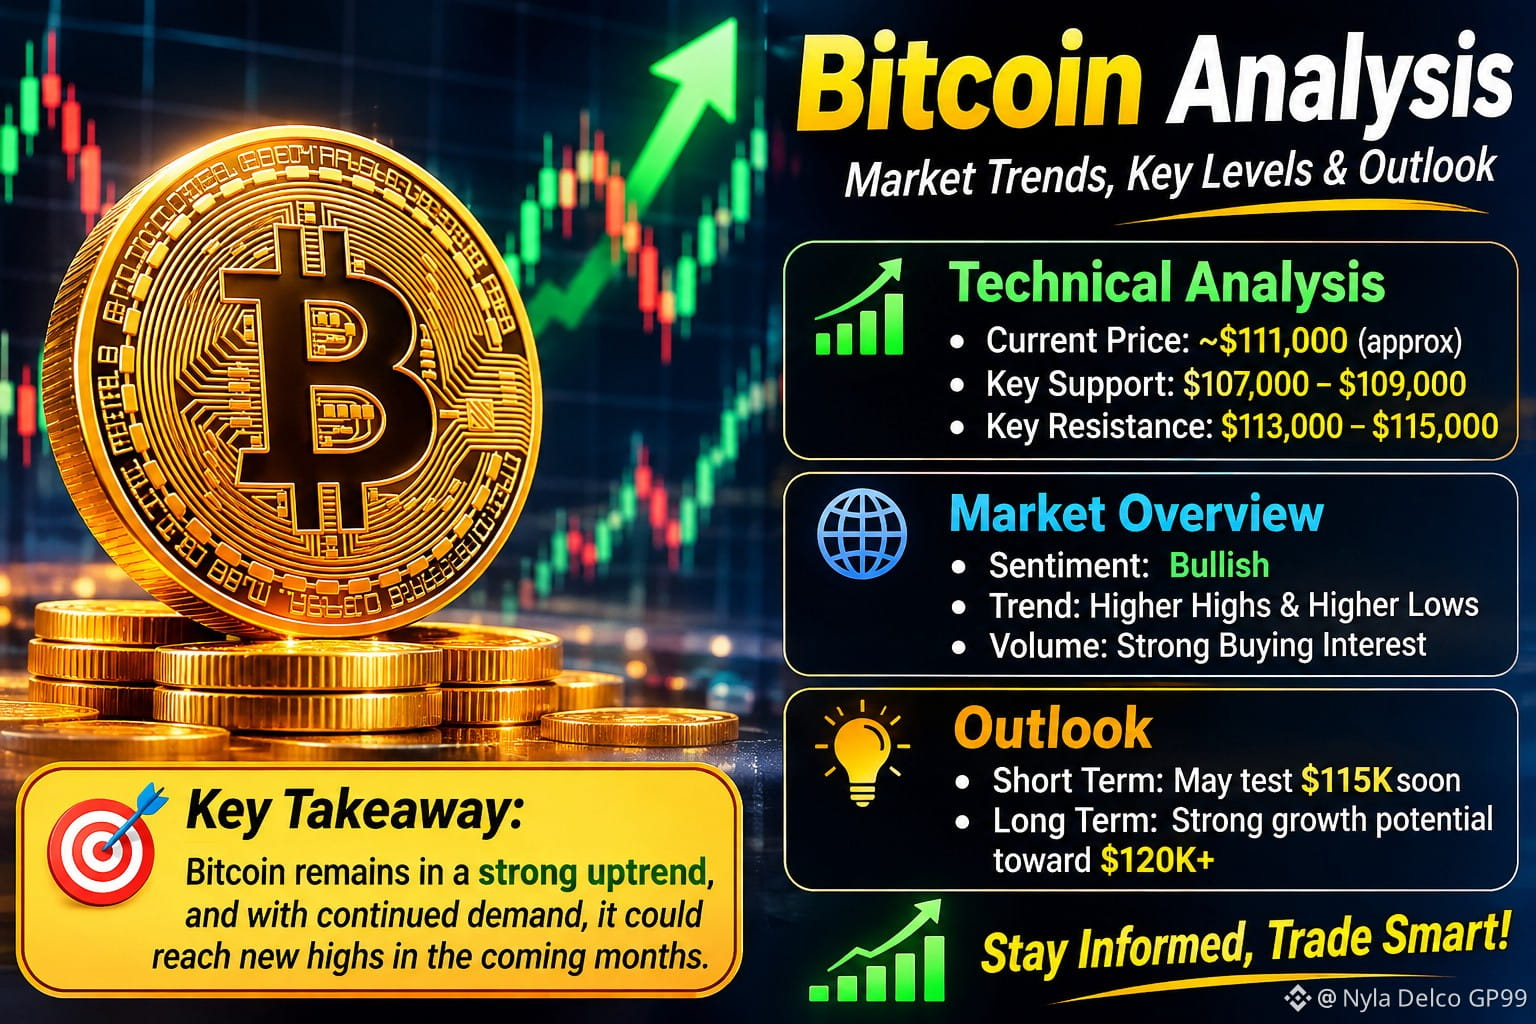
$BTC es la principal criptomoneda del mundo. Su precio se ve influido por la demanda del mercado, el sentimiento de los inversores, las condiciones económicas mundiales y la actividad comercial.
Puntos clave del análisis de Bitcoin:
Tendencia del mercado: Los precios de Bitcoin pueden subir o bajar según las condiciones del mercado.
Análisis técnico: Los operadores estudian los niveles de soporte y resistencia, los gráficos y el volumen de operaciones.
Volatilidad del mercado: Bitcoin es muy volátil, por lo que sus precios pueden cambiar rápidamente.
Perspectivas futuras: Bitcoin tiene potencial de crecimiento a largo plazo, pero sus precios futuros son inciertos.
Conclusión: Bitcoin es un activo digital importante que ofrece oportunidades y conlleva riesgos. Investiga siempre cuidadosamente antes de tomar decisiones financieras.
{spot}(BTCUSDT)
#BinanceReopensWithdrawalsForMoreAssets #AnthropicIPOValuationDoubts #USStocksSlipandCryptoMarketUnderBroadPressure #USStocksSufferSteepestRoutSince2020 #USStocksSufferSteepestRoutSince2020
$BTC es la principal criptomoneda del mundo. Su precio se ve influido por la demanda del mercado, el sentimiento de los inversores, las condiciones económicas mundiales y la actividad comercial.
Puntos clave del análisis de Bitcoin:
Tendencia del mercado: Los precios de Bitcoin pueden subir o bajar según las condiciones del mercado.
Análisis técnico: Los operadores estudian los niveles de soporte y resistencia, los gráficos y el volumen de operaciones.
Volatilidad del mercado: Bitcoin es muy volátil, por lo que sus precios pueden cambiar rápidamente.
Perspectivas futuras: Bitcoin tiene potencial de crecimiento a largo plazo, pero sus precios futuros son inciertos.
Conclusión: Bitcoin es un activo digital importante que ofrece oportunidades y conlleva riesgos. Investiga siempre cuidadosamente antes de tomar decisiones financieras.
#BinanceReopensWithdrawalsForMoreAssets #AnthropicIPOValuationDoubts #USStocksSlipandCryptoMarketUnderBroadPressure #USStocksSufferSteepestRoutSince2020 #USStocksSufferSteepestRoutSince2020
Puntos clave del análisis de Bitcoin:
Tendencia del mercado: Los precios de Bitcoin pueden subir o bajar según las condiciones del mercado.
Análisis técnico: Los operadores estudian los niveles de soporte y resistencia, los gráficos y el volumen de operaciones.
Volatilidad del mercado: Bitcoin es muy volátil, por lo que sus precios pueden cambiar rápidamente.
Perspectivas futuras: Bitcoin tiene potencial de crecimiento a largo plazo, pero sus precios futuros son inciertos.
Conclusión: Bitcoin es un activo digital importante que ofrece oportunidades y conlleva riesgos. Investiga siempre cuidadosamente antes de tomar decisiones financieras.
#BinanceReopensWithdrawalsForMoreAssets #AnthropicIPOValuationDoubts #USStocksSlipandCryptoMarketUnderBroadPressure #USStocksSufferSteepestRoutSince2020 #USStocksSufferSteepestRoutSince2020
35
·
--
Ver traducción
BlackRock’s iShares bitcoin fund sees record exodus as crypto heads for worst month since 2022
Key Points
The iShares Bitcoin Trust ETF has recorded $2.2 billion in outflows this month, as of Monday, FactSet data shows.
That’s nearly eight times the $291 million in losses suffered by the investment vehicle last October, or its second-worst month on record since its debut in early 2024.
The outflows come as bitcoin is down more than 20% over the past month.
traders are now pricing in more than 80% odds that the Federal Reserve will slash rates at its December meeting, such a cut remains far from sure bet.
Amid all the uncertainty, bitcoin is bleeding. And, investors in spot bitcoin ETFs, particularly newer holders, are feeling pressure to sell their shares — a reality that could extend the asset’s downside in the near term, Frank Chaparro, head of content and special projects at crypto-focused trading firm GSR, told CNBC.
“With the macro environment becoming less certain, investors tend to de-risk across assets, which often means trimming exposure to crypto and other risk-sensitive stocks,” Chaparro said. “And for newer entrants who came in through the funds, any downturn can be unsettling – they can sell just as quickly as they bought.”
But while it’s true that spot bitcoin ETFs have brought in hoards of new retail investors who may be flighty during volatile times, the funds have also attracted a range of long-term investors such as institutions who can hold through the downturn, according to Joshua Levine, chairman at bitcoin treasury firm OranjeBTC, told CNBC.
That institutional base could “dampen some of the extreme downside, but also smooth upside, reducing bitcoin’s volatility as the asset class matures,” Levine said.
BlackRock’s iShares bitcoin fund sees record exodus as crypto heads for worst month since 2022
Key Points
The iShares Bitcoin Trust ETF has recorded $2.2 billion in outflows this month, as of Monday, FactSet data shows.
That’s nearly eight times the $291 million in losses suffered by the investment vehicle last October, or its second-worst month on record since its debut in early 2024.
The outflows come as bitcoin is down more than 20% over the past month.
traders are now pricing in more than 80% odds that the Federal Reserve will slash rates at its December meeting, such a cut remains far from sure bet.
Amid all the uncertainty, bitcoin is bleeding. And, investors in spot bitcoin ETFs, particularly newer holders, are feeling pressure to sell their shares — a reality that could extend the asset’s downside in the near term, Frank Chaparro, head of content and special projects at crypto-focused trading firm GSR, told CNBC.
“With the macro environment becoming less certain, investors tend to de-risk across assets, which often means trimming exposure to crypto and other risk-sensitive stocks,” Chaparro said. “And for newer entrants who came in through the funds, any downturn can be unsettling – they can sell just as quickly as they bought.”
But while it’s true that spot bitcoin ETFs have brought in hoards of new retail investors who may be flighty during volatile times, the funds have also attracted a range of long-term investors such as institutions who can hold through the downturn, according to Joshua Levine, chairman at bitcoin treasury firm OranjeBTC, told CNBC.
That institutional base could “dampen some of the extreme downside, but also smooth upside, reducing bitcoin’s volatility as the asset class matures,” Levine said.
The iShares Bitcoin Trust ETF has recorded $2.2 billion in outflows this month, as of Monday, FactSet data shows.
That’s nearly eight times the $291 million in losses suffered by the investment vehicle last October, or its second-worst month on record since its debut in early 2024.
The outflows come as bitcoin is down more than 20% over the past month.
traders are now pricing in more than 80% odds that the Federal Reserve will slash rates at its December meeting, such a cut remains far from sure bet.
Amid all the uncertainty, bitcoin is bleeding. And, investors in spot bitcoin ETFs, particularly newer holders, are feeling pressure to sell their shares — a reality that could extend the asset’s downside in the near term, Frank Chaparro, head of content and special projects at crypto-focused trading firm GSR, told CNBC.
“With the macro environment becoming less certain, investors tend to de-risk across assets, which often means trimming exposure to crypto and other risk-sensitive stocks,” Chaparro said. “And for newer entrants who came in through the funds, any downturn can be unsettling – they can sell just as quickly as they bought.”
But while it’s true that spot bitcoin ETFs have brought in hoards of new retail investors who may be flighty during volatile times, the funds have also attracted a range of long-term investors such as institutions who can hold through the downturn, according to Joshua Levine, chairman at bitcoin treasury firm OranjeBTC, told CNBC.
That institutional base could “dampen some of the extreme downside, but also smooth upside, reducing bitcoin’s volatility as the asset class matures,” Levine said.
1
·
--
Ver traducción
Pi Network’s Chart Resembles Ethereum’sPi Network’s Chart Resembles Ethereum’s Early Days — Is History Repeating?
In the cryptocurrency market, history doesn’t always repeat—but it often rhymes. Pi Network (PI), after six years of development, officially launched its mainnet on February 20, 2024. Since then, the project has been closely watched by the crypto community, not just for its unique mobile-first mining model, but also for its intriguing price movement.
Following its debut, PI saw a strong surge, briefly touching $3 before facing a correction that brought it back to the current trading range of around $1. While price volatility is common in early-stage listings, what’s capturing attention now is something far more interesting—a possible repetition of a historical pattern seen in Ethereum’s (ETH) early days.
PI Mirrors Ethereum’s Early Listing Phase
Our recent comparative chart analysis between Ethereum’s early listing period and Pi Network’s current listing period price behavior shows striking similarities. Both assets display a falling wedge pattern, a well-known bullish reversal formation in technical analysis.
ETH-PI Chart Comparison/Coinsprobe (Source: Tradingview)
Looking back at Ethereum in 2015–2016, the coin entered exchanges at a price close to $1 and moved into a low-volatility phase, clearly marked by a falling wedge structure. After several weeks of consolidation, ETH broke out of this wedge, and a move above its 15-day moving average (15D MA) triggered a sharp bullish rally. This breakout didn’t just signal momentum—it delivered results. ETH surged over 1,400%, climbing from around $0.85 to over $14 within a couple of months.
Fast forward to 2025, Pi Network appears to be painting a similar picture. On the right side of the chart, PI is consolidating in a falling wedge pattern, with its current price hovering around $1—the same level ETH was trading before its breakout. The 15D MA is also hovering just above the price, much like ETH’s setup before its surge.
If Pi follows the same path as Ethereum, it doesn’t take a technical analyst to imagine what could come next.
Is History Repeating?
Of course, it’s important to approach chart similarities with caution. Ethereum’s rise was powered by groundbreaking smart contract technology and early developer adoption. Pi Network, while growing rapidly in user numbers, is still in the process of defining its core utilities and building tangible use cases in the ecosystem.
However, markets often move in patterns, reflecting collective psychology more than just fundamentals. And if the current chart structure is any indication, Pi Network could be quietly preparing for a similar breakout phase.
The momentum may depend on several factors—market sentiment, utility rollout, exchange integrations, and broader crypto trends. But from a pure technical perspective, all eyes are now on whether Pi can break above the wedge and its 15D MA, just as Ethereum once did.
Disclaimer: This article is for informational purposes only and does not constitute financial advice. Always conduct your own research before making any investment decisions.
Pi Network’s Chart Resembles Ethereum’s
Pi Network’s Chart Resembles Ethereum’s Early Days — Is History Repeating?
In the cryptocurrency market, history doesn’t always repeat—but it often rhymes. Pi Network (PI), after six years of development, officially launched its mainnet on February 20, 2024. Since then, the project has been closely watched by the crypto community, not just for its unique mobile-first mining model, but also for its intriguing price movement.
Following its debut, PI saw a strong surge, briefly touching $3 before facing a correction that brought it back to the current trading range of around $1. While price volatility is common in early-stage listings, what’s capturing attention now is something far more interesting—a possible repetition of a historical pattern seen in Ethereum’s (ETH) early days.
PI Mirrors Ethereum’s Early Listing Phase
Our recent comparative chart analysis between Ethereum’s early listing period and Pi Network’s current listing period price behavior shows striking similarities. Both assets display a falling wedge pattern, a well-known bullish reversal formation in technical analysis.
ETH-PI Chart Comparison/Coinsprobe (Source: Tradingview)
Looking back at Ethereum in 2015–2016, the coin entered exchanges at a price close to $1 and moved into a low-volatility phase, clearly marked by a falling wedge structure. After several weeks of consolidation, ETH broke out of this wedge, and a move above its 15-day moving average (15D MA) triggered a sharp bullish rally. This breakout didn’t just signal momentum—it delivered results. ETH surged over 1,400%, climbing from around $0.85 to over $14 within a couple of months.
Fast forward to 2025, Pi Network appears to be painting a similar picture. On the right side of the chart, PI is consolidating in a falling wedge pattern, with its current price hovering around $1—the same level ETH was trading before its breakout. The 15D MA is also hovering just above the price, much like ETH’s setup before its surge.
If Pi follows the same path as Ethereum, it doesn’t take a technical analyst to imagine what could come next.
Is History Repeating?
Of course, it’s important to approach chart similarities with caution. Ethereum’s rise was powered by groundbreaking smart contract technology and early developer adoption. Pi Network, while growing rapidly in user numbers, is still in the process of defining its core utilities and building tangible use cases in the ecosystem.
However, markets often move in patterns, reflecting collective psychology more than just fundamentals. And if the current chart structure is any indication, Pi Network could be quietly preparing for a similar breakout phase.
The momentum may depend on several factors—market sentiment, utility rollout, exchange integrations, and broader crypto trends. But from a pure technical perspective, all eyes are now on whether Pi can break above the wedge and its 15D MA, just as Ethereum once did.
Disclaimer: This article is for informational purposes only and does not constitute financial advice. Always conduct your own research before making any investment decisions.
In the cryptocurrency market, history doesn’t always repeat—but it often rhymes. Pi Network (PI), after six years of development, officially launched its mainnet on February 20, 2024. Since then, the project has been closely watched by the crypto community, not just for its unique mobile-first mining model, but also for its intriguing price movement.
Following its debut, PI saw a strong surge, briefly touching $3 before facing a correction that brought it back to the current trading range of around $1. While price volatility is common in early-stage listings, what’s capturing attention now is something far more interesting—a possible repetition of a historical pattern seen in Ethereum’s (ETH) early days.
PI Mirrors Ethereum’s Early Listing Phase
Our recent comparative chart analysis between Ethereum’s early listing period and Pi Network’s current listing period price behavior shows striking similarities. Both assets display a falling wedge pattern, a well-known bullish reversal formation in technical analysis.
ETH-PI Chart Comparison/Coinsprobe (Source: Tradingview)
Looking back at Ethereum in 2015–2016, the coin entered exchanges at a price close to $1 and moved into a low-volatility phase, clearly marked by a falling wedge structure. After several weeks of consolidation, ETH broke out of this wedge, and a move above its 15-day moving average (15D MA) triggered a sharp bullish rally. This breakout didn’t just signal momentum—it delivered results. ETH surged over 1,400%, climbing from around $0.85 to over $14 within a couple of months.
Fast forward to 2025, Pi Network appears to be painting a similar picture. On the right side of the chart, PI is consolidating in a falling wedge pattern, with its current price hovering around $1—the same level ETH was trading before its breakout. The 15D MA is also hovering just above the price, much like ETH’s setup before its surge.
If Pi follows the same path as Ethereum, it doesn’t take a technical analyst to imagine what could come next.
Is History Repeating?
Of course, it’s important to approach chart similarities with caution. Ethereum’s rise was powered by groundbreaking smart contract technology and early developer adoption. Pi Network, while growing rapidly in user numbers, is still in the process of defining its core utilities and building tangible use cases in the ecosystem.
However, markets often move in patterns, reflecting collective psychology more than just fundamentals. And if the current chart structure is any indication, Pi Network could be quietly preparing for a similar breakout phase.
The momentum may depend on several factors—market sentiment, utility rollout, exchange integrations, and broader crypto trends. But from a pure technical perspective, all eyes are now on whether Pi can break above the wedge and its 15D MA, just as Ethereum once did.
Disclaimer: This article is for informational purposes only and does not constitute financial advice. Always conduct your own research before making any investment decisions.
61
·
--
Ver traducción
#RamadanGiveaway
The holy month of Ramadan is a time of reflection, gratitude, and generosity. To celebrate this blessed season, we’re excited to announce our #RamadanGiveaway! Share your favorite Ramadan traditions, memories, or acts of kindness for a chance to win amazing prizes. Whether it’s preparing iftar with loved ones, reading Quran, or helping those in need, let’s spread the spirit of Ramadan together. Follow us, tag friends, and use #RamadanGiveaway to enter. Winners will be announced at the end of the month. May this Ramadan bring peace, joy, and countless blessings to all. Good luck! 🌙✨ #Blessings #Community #Giveback
#RamadanGiveaway
The holy month of Ramadan is a time of reflection, gratitude, and generosity. To celebrate this blessed season, we’re excited to announce our #RamadanGiveaway! Share your favorite Ramadan traditions, memories, or acts of kindness for a chance to win amazing prizes. Whether it’s preparing iftar with loved ones, reading Quran, or helping those in need, let’s spread the spirit of Ramadan together. Follow us, tag friends, and use #RamadanGiveaway to enter. Winners will be announced at the end of the month. May this Ramadan bring peace, joy, and countless blessings to all. Good luck! 🌙✨ #Blessings #Community #Giveback
The holy month of Ramadan is a time of reflection, gratitude, and generosity. To celebrate this blessed season, we’re excited to announce our #RamadanGiveaway! Share your favorite Ramadan traditions, memories, or acts of kindness for a chance to win amazing prizes. Whether it’s preparing iftar with loved ones, reading Quran, or helping those in need, let’s spread the spirit of Ramadan together. Follow us, tag friends, and use #RamadanGiveaway to enter. Winners will be announced at the end of the month. May this Ramadan bring peace, joy, and countless blessings to all. Good luck! 🌙✨ #Blessings #Community #Giveback
59
·
--
Ver traducción
The power of the community is stronger than ever! 🚀 Binance is giving users the chance to decide which project gets listed next, and your vote can make all the difference. Supporting your favorite token means increased visibility, liquidity, and massive growth potential. A Binance listing can take a project to the next level, attracting new investors and boosting adoption. Now is the time to come together, spread the word, and rally behind the project you believe in. Don’t miss this opportunity to shape the future of crypto—every vote counts! Cast your vote today! 🔥 #VoteToListOnBinance
The power of the community is stronger than ever! 🚀 Binance is giving users the chance to decide which project gets listed next, and your vote can make all the difference. Supporting your favorite token means increased visibility, liquidity, and massive growth potential. A Binance listing can take a project to the next level, attracting new investors and boosting adoption. Now is the time to come together, spread the word, and rally behind the project you believe in. Don’t miss this opportunity to shape the future of crypto—every vote counts! Cast your vote today! 🔥 #VoteToListOnBinance
92
·
--
Ver traducción
#pi pi coin prediction 2025 & 2026
March 2025: PI Prediction
Analysts expect PI's price to rise in March, with a projected change of 112.06% compared to current rates. The asset may reach a high of $ 3.92 and a low of $ 1.163461, averaging around $ 2.34. This prediction comes after a poor market performance in the last 30 days – during which time lost -21.43% – indicating a possible reversal of the trend. The potential ROI stands at 255.72%, suggesting a profitable opportunity for long traders.
In 2026, Pi Network is forecasted to trade in a price channel between $ 1.098607 and $ 3.20. On average, PI is expected to change hands at $ 2.26 during the year. The most bullish month for PI could be January, when the currency is anticipated to trade 190.04% higher than today.
#pi pi coin prediction 2025 & 2026
March 2025: PI Prediction
Analysts expect PI's price to rise in March, with a projected change of 112.06% compared to current rates. The asset may reach a high of $ 3.92 and a low of $ 1.163461, averaging around $ 2.34. This prediction comes after a poor market performance in the last 30 days – during which time lost -21.43% – indicating a possible reversal of the trend. The potential ROI stands at 255.72%, suggesting a profitable opportunity for long traders.
In 2026, Pi Network is forecasted to trade in a price channel between $ 1.098607 and $ 3.20. On average, PI is expected to change hands at $ 2.26 during the year. The most bullish month for PI could be January, when the currency is anticipated to trade 190.04% higher than today.
March 2025: PI Prediction
Analysts expect PI's price to rise in March, with a projected change of 112.06% compared to current rates. The asset may reach a high of $ 3.92 and a low of $ 1.163461, averaging around $ 2.34. This prediction comes after a poor market performance in the last 30 days – during which time lost -21.43% – indicating a possible reversal of the trend. The potential ROI stands at 255.72%, suggesting a profitable opportunity for long traders.
In 2026, Pi Network is forecasted to trade in a price channel between $ 1.098607 and $ 3.20. On average, PI is expected to change hands at $ 2.26 during the year. The most bullish month for PI could be January, when the currency is anticipated to trade 190.04% higher than today.
13
145
Inicia sesión para explorar más contenidos
Únete a usuarios de criptomonedas de todo el mundo en Binance Square
⚡️ Obtén la información más reciente y útil sobre criptomonedas.
💬 Confía en el mayor exchange de criptomonedas del mundo.
👍 Descubre opiniones reales de creadores verificados.
Correo electrónico/número de teléfono
Temas en tendencia
BinanceReopensWithdrawalsForMoreAssets
1M visualizaciones
5,449 participa(n) en el debate
Actualización de recuperación n.º 9: se reanudarán los retiros de más activos (2026-11-06)
Binance Announcement
·100 «Me gusta»
·393.8k visualizaciones
AnthropicIPOValuationDoubts
7,476 visualizaciones
235 participa(n) en el debate
USStocksSlipandCryptoMarketUnderBroadPressure
94,647 visualizaciones
645 participa(n) en el debate