

الزہرا ٹریڈ
23.2k Publicaciones

الزہرا ٹریڈ
Denunciar
Bloquear usuario
Crypto Analyst Tracking whale movements
32 Siguiendo
880 Seguidores
4.5K+ Me gusta
Publicaciones
·
--
Ver traducción
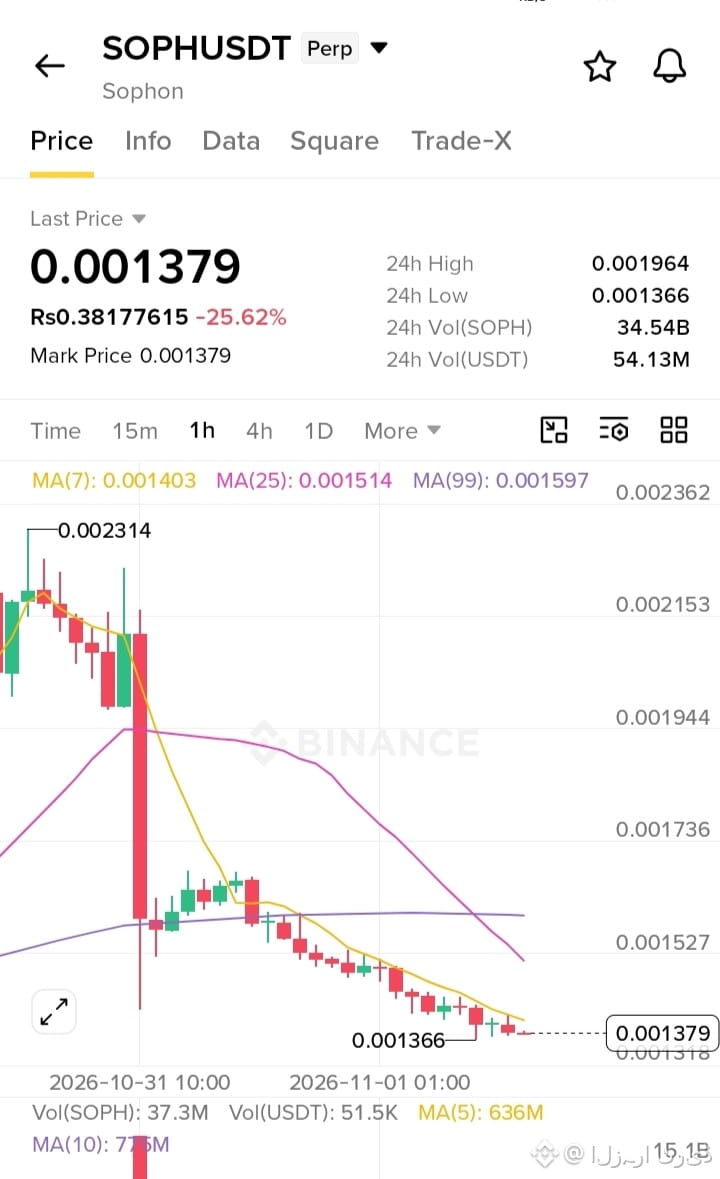
$SOPH is trading at 0.001379, down -25.62% over the last 24 hours, consolidating near its support low of 0.001366 and remaining firmly below key moving averages including the MA(7) at 0.001403, MA(25) at 0.001514, and MA(99) at 0.001597.
🔻 Bias: Short $SOPH
{future}(SOPHUSDT)
* Entry range: $0.001350 – $0.001420
* SL: $0.001550
* TP 1: $0.001250
* TP 2: $0.001100
* TP 3: $0.000950
Price action shows relentless downward momentum following a sharp breakdown from higher levels. The asset continues to drift underneath the MA(7), MA(25), and MA(99) moving averages with restricted buying interest. This technical structure heavily favors continued downside continuation toward lower support targets as long as immediate overhead resistance near 0.001450 remains intact.
$SOPH is trading at 0.001379, down -25.62% over the last 24 hours, consolidating near its support low of 0.001366 and remaining firmly below key moving averages including the MA(7) at 0.001403, MA(25) at 0.001514, and MA(99) at 0.001597.
🔻 Bias: Short $SOPH
* Entry range: $0.001350 – $0.001420
* SL: $0.001550
* TP 1: $0.001250
* TP 2: $0.001100
* TP 3: $0.000950
Price action shows relentless downward momentum following a sharp breakdown from higher levels. The asset continues to drift underneath the MA(7), MA(25), and MA(99) moving averages with restricted buying interest. This technical structure heavily favors continued downside continuation toward lower support targets as long as immediate overhead resistance near 0.001450 remains intact.
2
·
--
Ver traducción
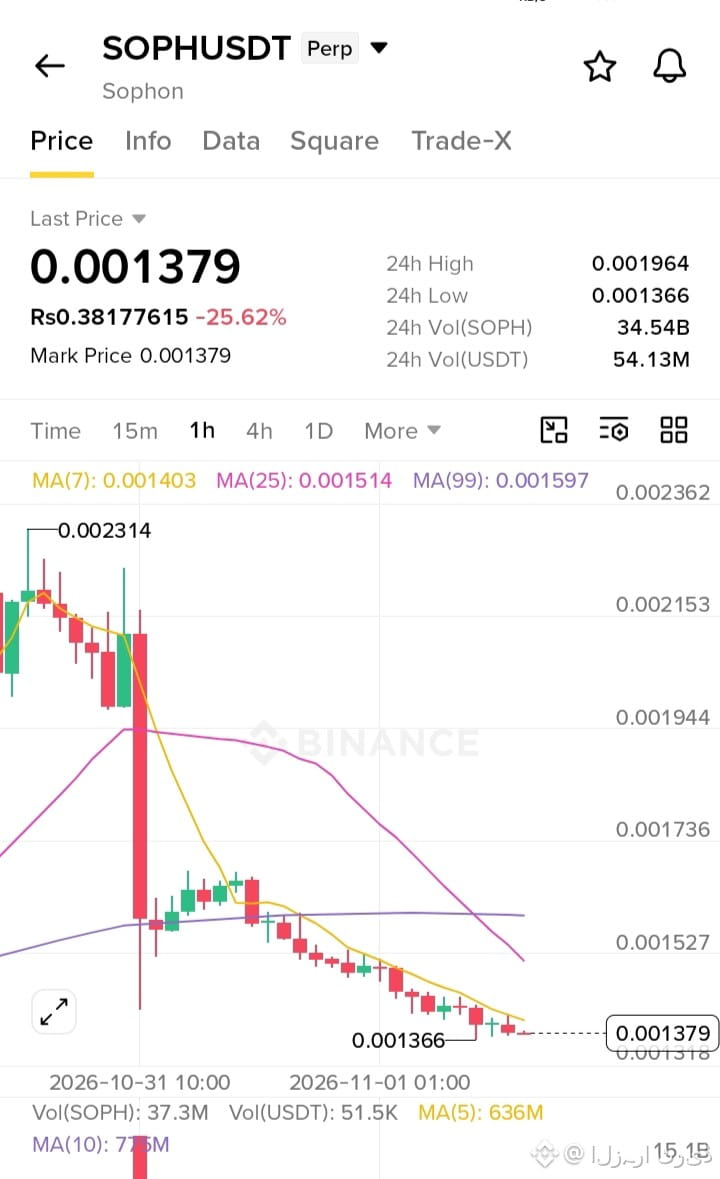
يتداول زوج $SOPH عند مستوى 0.001379 مسجلاً تراجعاً بنسبة -25.62% خلال 24 ساعة، مع تماسك السعر بالقرب من قاع الدعم عند 0.001366 واستقراره بوضوح أدنى المتوسطات المتحركة الرئيسية بما فيها MA(7) عند 0.001403 وMA(25) عند 0.001514 وMA(99) عند 0.001597.
🔻 الاتجاه: البيع (Short) لعملة $SOPH
{future}(SOPHUSDT)
* Entry range: $0.001350 – $0.001420
* SL: $0.001550
* TP 1: $0.001250
* TP 2: $0.001100
* TP 3: $0.000950
تُظهر حركة السعر ضغوطاً بيعية مستمرة ومتسارعة عقب الهبوط الحاد من المستويات المرتفعة. يستقر السعر أدنى خطوط المتوسطات المتحركة MA(7) وMA(25) وMA(99) وسط ضعف واضح في اهتمام المشترين. يدعم هذا الهيكل الفني استمرار الاتجاه الهابط نحو أهداف دعم أدنى طالما ظلت المقاومة القريبة قرب 0.001450 صامدة.
يتداول زوج $SOPH عند مستوى 0.001379 مسجلاً تراجعاً بنسبة -25.62% خلال 24 ساعة، مع تماسك السعر بالقرب من قاع الدعم عند 0.001366 واستقراره بوضوح أدنى المتوسطات المتحركة الرئيسية بما فيها MA(7) عند 0.001403 وMA(25) عند 0.001514 وMA(99) عند 0.001597.
🔻 الاتجاه: البيع (Short) لعملة $SOPH
* Entry range: $0.001350 – $0.001420
* SL: $0.001550
* TP 1: $0.001250
* TP 2: $0.001100
* TP 3: $0.000950
تُظهر حركة السعر ضغوطاً بيعية مستمرة ومتسارعة عقب الهبوط الحاد من المستويات المرتفعة. يستقر السعر أدنى خطوط المتوسطات المتحركة MA(7) وMA(25) وMA(99) وسط ضعف واضح في اهتمام المشترين. يدعم هذا الهيكل الفني استمرار الاتجاه الهابط نحو أهداف دعم أدنى طالما ظلت المقاومة القريبة قرب 0.001450 صامدة.
3
·
--
Ver traducción
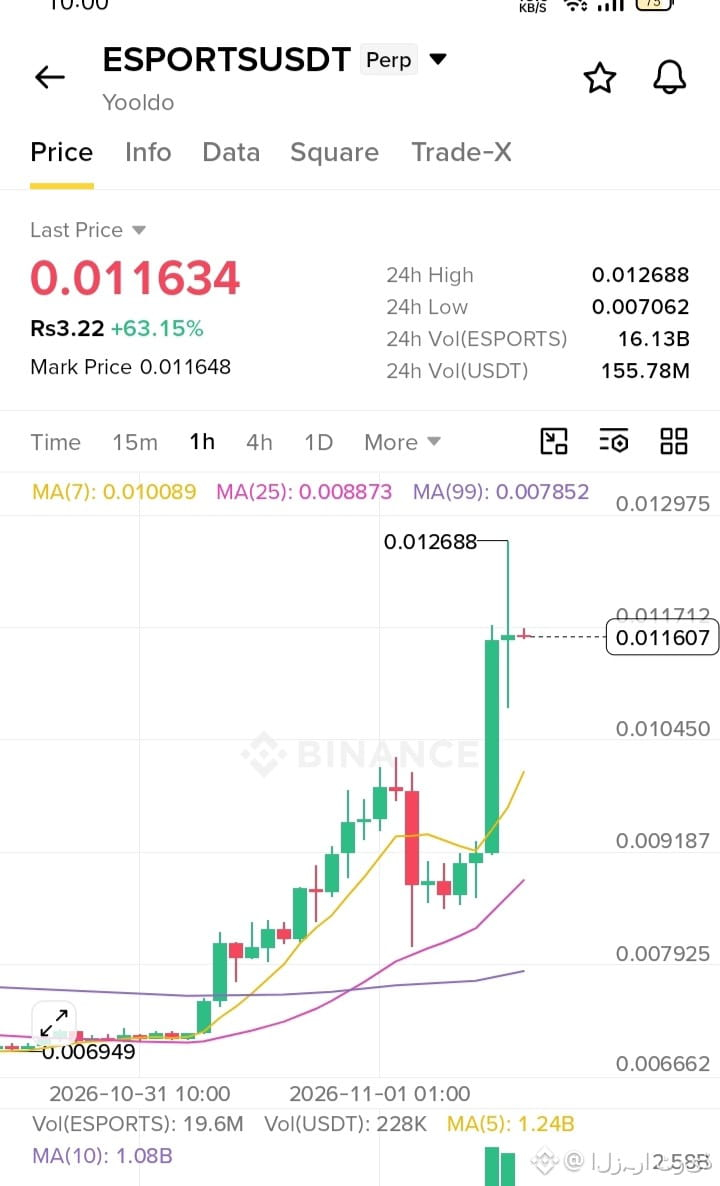
$ESPORTS is trading at 0.011634, up +63.15% over the last 24 hours, maintaining strong bullish momentum well above key moving averages including the MA(7) at 0.010089, MA(25) at 0.008873, and MA(99) at 0.007852 following a massive surge toward its 0.012688 high.
🔥 Bias: Long $ESPORTS
{future}(ESPORTSUSDT)
* Entry range: $0.01050 – $0.01170
* SL: $0.00920
* TP 1: $0.01350
* TP 2: $0.01500
* TP 3: $0.01700
Price action shows explosive upward momentum following a powerful breakout rally from the 0.006949 support base. The asset exhibits heavy trading volume and continues to hold solid structural support above short-term and long-term moving averages. This technical setup heavily favors continued upward expansion toward higher resistance targets as long as immediate support near 0.01000 remains defended.
$ESPORTS is trading at 0.011634, up +63.15% over the last 24 hours, maintaining strong bullish momentum well above key moving averages including the MA(7) at 0.010089, MA(25) at 0.008873, and MA(99) at 0.007852 following a massive surge toward its 0.012688 high.
🔥 Bias: Long $ESPORTS
* Entry range: $0.01050 – $0.01170
* SL: $0.00920
* TP 1: $0.01350
* TP 2: $0.01500
* TP 3: $0.01700
Price action shows explosive upward momentum following a powerful breakout rally from the 0.006949 support base. The asset exhibits heavy trading volume and continues to hold solid structural support above short-term and long-term moving averages. This technical setup heavily favors continued upward expansion toward higher resistance targets as long as immediate support near 0.01000 remains defended.
5
·
--
Ver traducción
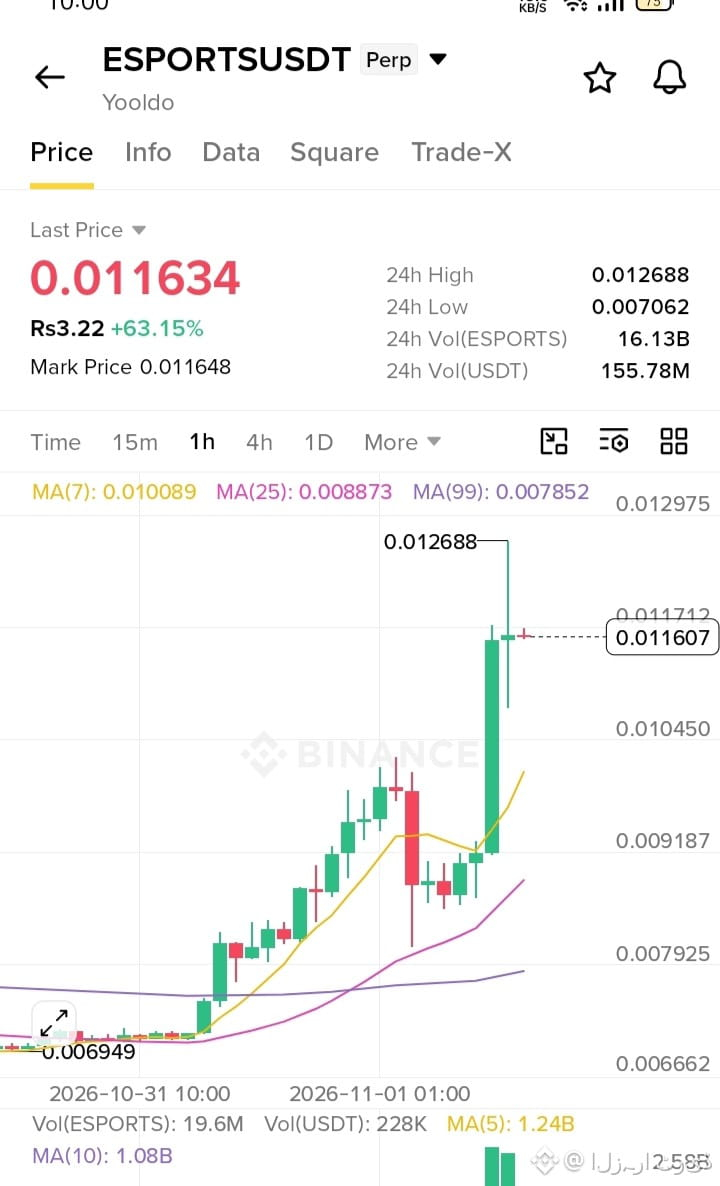
يتداول زوج $ESPORTS عند مستوى 0.011634 مسجلاً ارتفاعاً هائلاً بنسبة +63.15% خلال 24 ساعة، مع الحفاظ على زخم صعودي قوي بوضوح أعلَى المتوسطات المتحركة الرئيسية بما فيها MA(7) عند 0.010089 وMA(25) عند 0.008873 وMA(99) عند 0.007852 عقب موجة صعود قوية نحو قمة 0.012688.
🔥 الاتجاه: الشراء (Long) لعملة $ESPORTS
{future}(ESPORTSUSDT)
* Entry range: $0.01050 – $0.01170
* SL: $0.00920
* TP 1: $0.01350
* TP 2: $0.01500
* TP 3: $0.01700
تُظهر حركة السعر زَخَماً صعودياً هائلاً عقب انطلاقة قوية واختراق من قاعدة الدعم عند 0.06949. يُظهر الأصل حجماً تداولياً مرتفعاً ويحافظ على دعم هيكلي صلب أعلَى المتوسطات المتحركة قصيرة وطويلة الأجل. يدعم هذا الإعداد الفني بقوة استمرار الصعود نحو أهداف المقاومة العليا طالما استمر الدعم الفوري قرب 0.01000 في الثبات.
يتداول زوج $ESPORTS عند مستوى 0.011634 مسجلاً ارتفاعاً هائلاً بنسبة +63.15% خلال 24 ساعة، مع الحفاظ على زخم صعودي قوي بوضوح أعلَى المتوسطات المتحركة الرئيسية بما فيها MA(7) عند 0.010089 وMA(25) عند 0.008873 وMA(99) عند 0.007852 عقب موجة صعود قوية نحو قمة 0.012688.
🔥 الاتجاه: الشراء (Long) لعملة $ESPORTS
* Entry range: $0.01050 – $0.01170
* SL: $0.00920
* TP 1: $0.01350
* TP 2: $0.01500
* TP 3: $0.01700
تُظهر حركة السعر زَخَماً صعودياً هائلاً عقب انطلاقة قوية واختراق من قاعدة الدعم عند 0.06949. يُظهر الأصل حجماً تداولياً مرتفعاً ويحافظ على دعم هيكلي صلب أعلَى المتوسطات المتحركة قصيرة وطويلة الأجل. يدعم هذا الإعداد الفني بقوة استمرار الصعود نحو أهداف المقاومة العليا طالما استمر الدعم الفوري قرب 0.01000 في الثبات.
4
·
--
Ver traducción
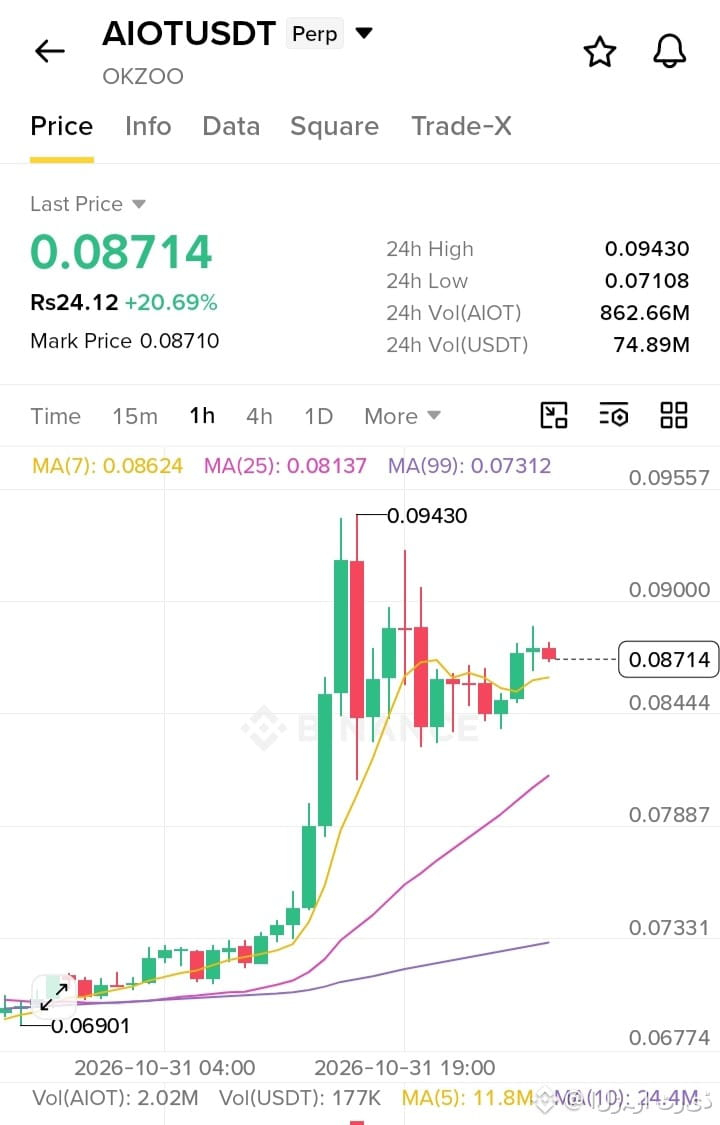
$AIOT is trading at 0.08714, up +20.69% over the last 24 hours, consolidating right above key moving averages including the MA(7) at 0.08624, MA(25) at 0.08137, and MA(99) at 0.07312 following a strong bounce from the 0.06901 support low.
🔥 Bias: Long $AIOT
{future}(AIOTUSDT)
* Entry range: $0.08300 – $0.08750
* SL: $0.07800
* TP 1: $0.09400
* TP 2: $0.10200
* TP 3: $0.11200
Price action demonstrates strong bullish momentum after recovering aggressively from the 0.06901 support level. The asset is holding comfortably above short-term and long-term moving averages, forming higher lows as it consolidates recent gains. This structural setup favors an upward continuation toward higher targets as long as the immediate support zone near 0.08200 remains defended.
$AIOT is trading at 0.08714, up +20.69% over the last 24 hours, consolidating right above key moving averages including the MA(7) at 0.08624, MA(25) at 0.08137, and MA(99) at 0.07312 following a strong bounce from the 0.06901 support low.
🔥 Bias: Long $AIOT
* Entry range: $0.08300 – $0.08750
* SL: $0.07800
* TP 1: $0.09400
* TP 2: $0.10200
* TP 3: $0.11200
Price action demonstrates strong bullish momentum after recovering aggressively from the 0.06901 support level. The asset is holding comfortably above short-term and long-term moving averages, forming higher lows as it consolidates recent gains. This structural setup favors an upward continuation toward higher targets as long as the immediate support zone near 0.08200 remains defended.
11
·
--
Ver traducción
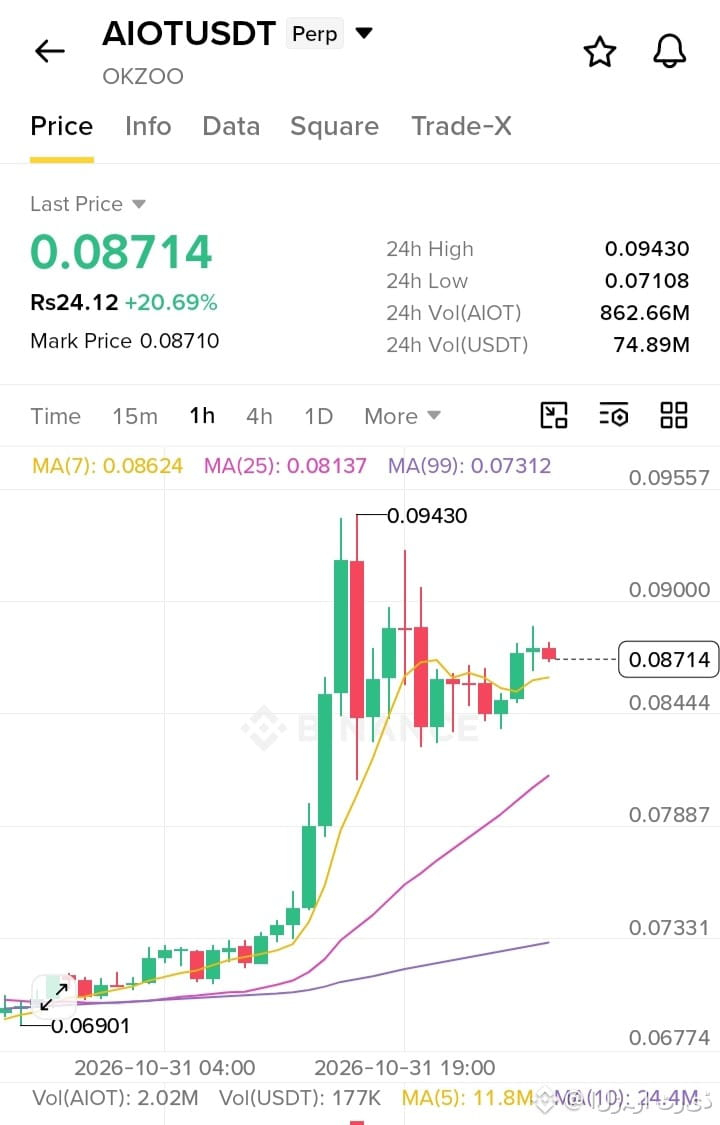
يتداول زوج $AIOT عند مستوى 0.08714 مسجلاً ارتفاعاً بنسبة +20.69% خلال 24 ساعة، مع تماسك السعر أعلَى المتوسطات المتحركة الرئيسية بما فيها MA(7) عند 0.08624 وMA(25) عند 0.08137 وMA(99) عند 0.07312 إثر ارتداد قوي من قاع الدعم عند 0.06901.
🔥 الاتجاه: الشراء (Long) لعملة $AIOT
{future}(AIOTUSDT)
* Entry range: $0.08300 – $0.08750
* SL: $0.07800
* TP 1: $0.09400
* TP 2: $0.10200
* TP 3: $0.11200
تُظهر حركة السعر زَخَماً صعودياً قوياً عقب التعافي بقوة من مستوى الدعم عند 0.06901. يستقر السعر براحة فوق المتوسطات المتحركة قصيرة وطويلة الأجل، محققاً قيعان تصاعدية مع تماسك المكاسب الأخيرة. يدعم هذا الهيكل الفني استمرار الصعود نحو أهداف أعلى طالما استمرت منطقة الدعم الفورية قرب 0.08200 في الثبات.
يتداول زوج $AIOT عند مستوى 0.08714 مسجلاً ارتفاعاً بنسبة +20.69% خلال 24 ساعة، مع تماسك السعر أعلَى المتوسطات المتحركة الرئيسية بما فيها MA(7) عند 0.08624 وMA(25) عند 0.08137 وMA(99) عند 0.07312 إثر ارتداد قوي من قاع الدعم عند 0.06901.
🔥 الاتجاه: الشراء (Long) لعملة $AIOT
* Entry range: $0.08300 – $0.08750
* SL: $0.07800
* TP 1: $0.09400
* TP 2: $0.10200
* TP 3: $0.11200
تُظهر حركة السعر زَخَماً صعودياً قوياً عقب التعافي بقوة من مستوى الدعم عند 0.06901. يستقر السعر براحة فوق المتوسطات المتحركة قصيرة وطويلة الأجل، محققاً قيعان تصاعدية مع تماسك المكاسب الأخيرة. يدعم هذا الهيكل الفني استمرار الصعود نحو أهداف أعلى طالما استمرت منطقة الدعم الفورية قرب 0.08200 في الثبات.
10
·
--
Ver traducción
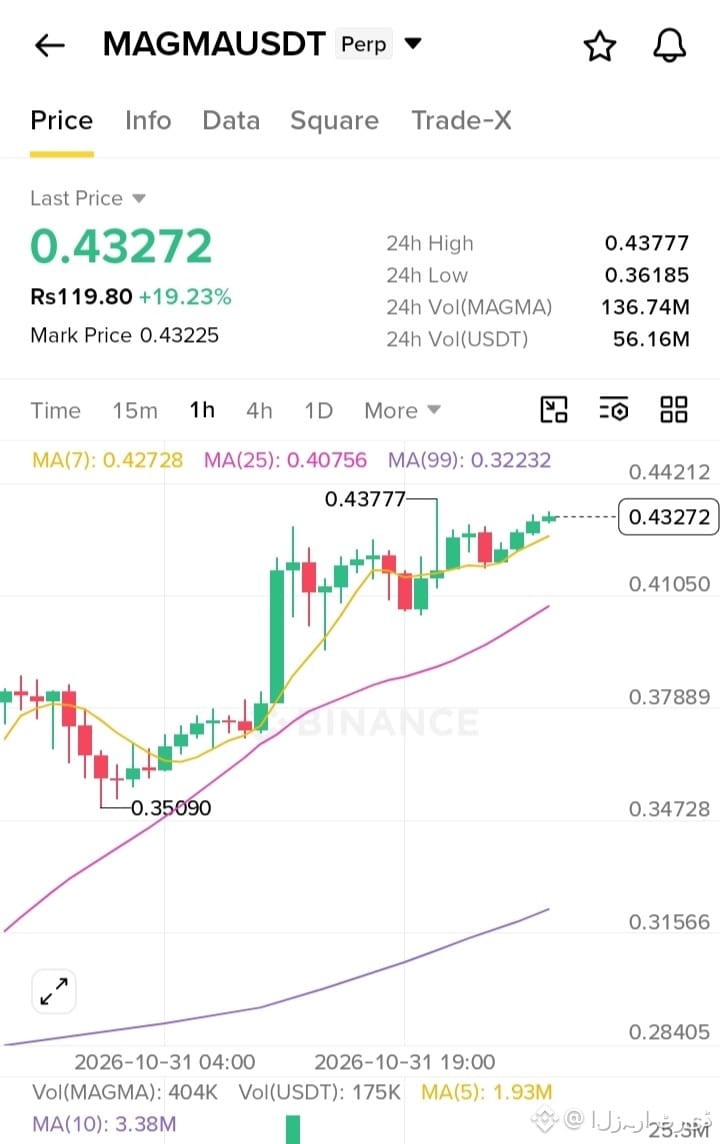
$MAGMA is trading at 0.43272, up +19.23% over the last 24 hours, maintaining strong bullish momentum above key moving averages including the MA(7) at 0.42728, MA(25) at 0.40756, and MA(99) at 0.32232 after advancing from the 0.35090 support level toward its 0.43777 high.
🔥 Bias: Long $MAGMA
{future}(MAGMAUSDT)
* Entry range: $0.41500 – $0.43300
* SL: $0.38500
* TP 1: $0.46500
* TP 2: $0.50000
* TP 3: $0.54000
Price action shows continuous upward momentum following a solid reversal from the 0.35090 support region. The asset continues to hold firm structural support above short-term and long-term moving averages while pressing against immediate resistance near 0.43770. This technical setup strongly favors an upward expansion toward higher resistance targets as long as support near 0.41000 is sustained.
$MAGMA is trading at 0.43272, up +19.23% over the last 24 hours, maintaining strong bullish momentum above key moving averages including the MA(7) at 0.42728, MA(25) at 0.40756, and MA(99) at 0.32232 after advancing from the 0.35090 support level toward its 0.43777 high.
🔥 Bias: Long $MAGMA
* Entry range: $0.41500 – $0.43300
* SL: $0.38500
* TP 1: $0.46500
* TP 2: $0.50000
* TP 3: $0.54000
Price action shows continuous upward momentum following a solid reversal from the 0.35090 support region. The asset continues to hold firm structural support above short-term and long-term moving averages while pressing against immediate resistance near 0.43770. This technical setup strongly favors an upward expansion toward higher resistance targets as long as support near 0.41000 is sustained.
12
·
--
Ver traducción
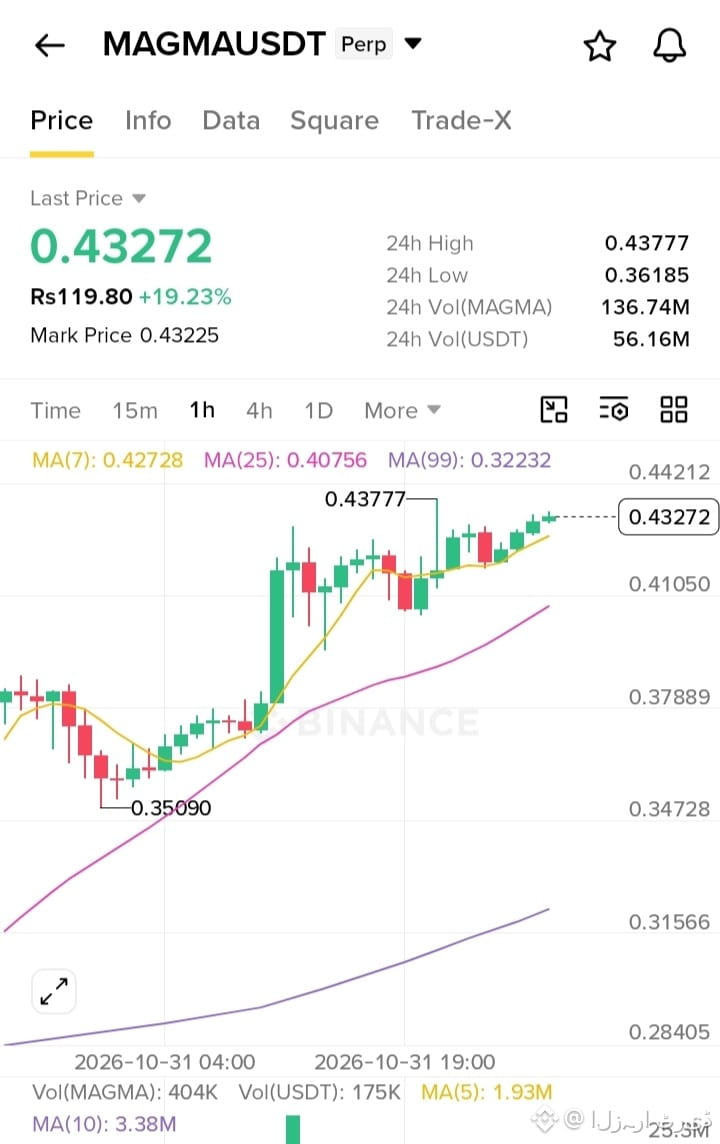
يتداول زوج $MAGMA عند مستوى 0.43272 مسجلاً ارتفاعاً بنسبة +19.23% خلال 24 ساعة، مع الحفاظ على زخم صعودي قوي أعلَى المتوسطات المتحركة الرئيسية بما فيها MA(7) عند 0.42728 وMA(25) عند 0.40756 وMA(99) عند 0.32232 إثر الارتفاع من مستوى الدعم عند 0.35090 نحو قمة 0.43777.
🔥 الاتجاه: الشراء (Long) لعملة $MAGMA
{future}(MAGMAUSDT)
* Entry range: $0.41500 – $0.43300
* SL: $0.38500
* TP 1: $0.46500
* TP 2: $0.50000
* TP 3: $0.54000
تُظهر حركة السعر زَخَماً صعودياً مستمراً عقب ارتداد قوي من منطقة الدعم عند 0.35090. يحافظ السعر على ثباته الفني أعلَى المتوسطات المتحركة قصيرة وطويلة الأجل بينما يضغط على المقاومة الفورية قرب 0.43770. يدعم هذا الإعداد الفني استمرار الصعود نحو أهداف مقاومة أعلى طالما استمر الدعم القريب قرب 0.41000 في الثبات.
يتداول زوج $MAGMA عند مستوى 0.43272 مسجلاً ارتفاعاً بنسبة +19.23% خلال 24 ساعة، مع الحفاظ على زخم صعودي قوي أعلَى المتوسطات المتحركة الرئيسية بما فيها MA(7) عند 0.42728 وMA(25) عند 0.40756 وMA(99) عند 0.32232 إثر الارتفاع من مستوى الدعم عند 0.35090 نحو قمة 0.43777.
🔥 الاتجاه: الشراء (Long) لعملة $MAGMA
* Entry range: $0.41500 – $0.43300
* SL: $0.38500
* TP 1: $0.46500
* TP 2: $0.50000
* TP 3: $0.54000
تُظهر حركة السعر زَخَماً صعودياً مستمراً عقب ارتداد قوي من منطقة الدعم عند 0.35090. يحافظ السعر على ثباته الفني أعلَى المتوسطات المتحركة قصيرة وطويلة الأجل بينما يضغط على المقاومة الفورية قرب 0.43770. يدعم هذا الإعداد الفني استمرار الصعود نحو أهداف مقاومة أعلى طالما استمر الدعم القريب قرب 0.41000 في الثبات.
9
·
--
Ver traducción
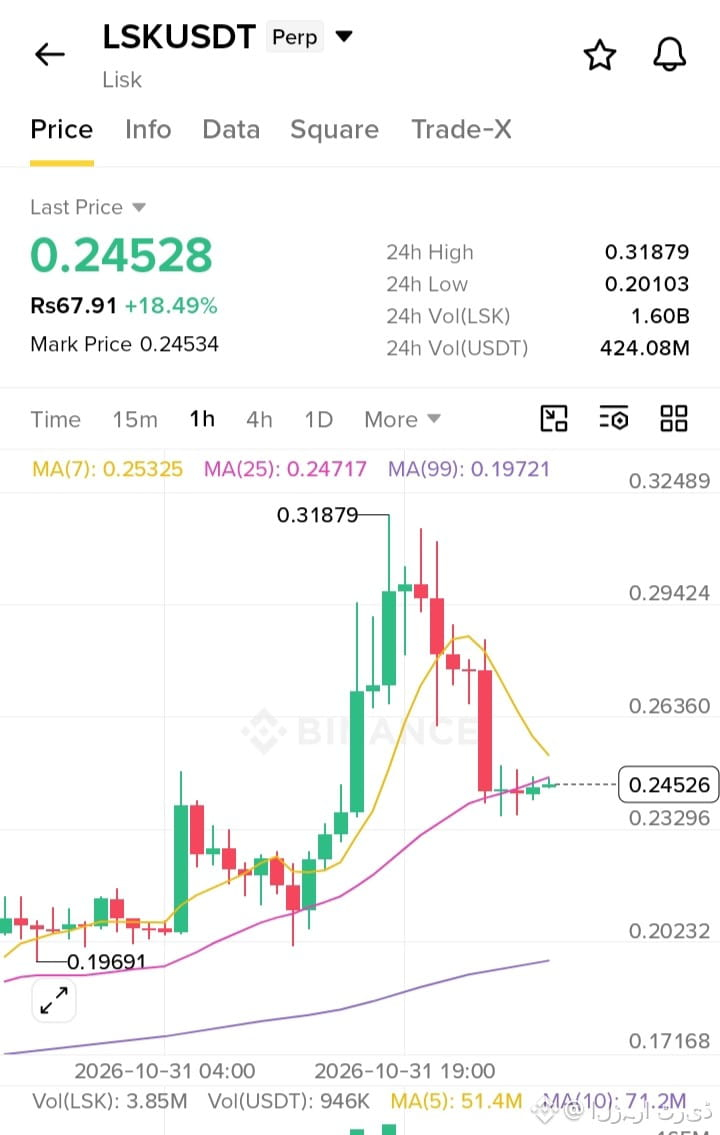
يتداول زوج $LSK عند مستوى 0.24528 مسجلاً ارتفاعاً بنسبة +18.49% خلال 24 ساعة، مع تماسك السعر بالقرب من خط MA(25) عند 0.24717 عقب تراجع من قمة 0.31879 واستقراره أعلَى خط MA(99) الرئيسي عند 0.19721.
🔥 الاتجاه: الشراء (Long) لعملة $LSK
{future}(LSKUSDT)
* Entry range: $0.23500 – $0.24800
* SL: $0.21500
* TP 1: $0.27500
* TP 2: $0.30000
* TP 3: $0.33000
تُظهر حركة السعر تماسكاً صحياً عقب الارتفاع القوي نحو ذروة 0.31879. يحافظ السعر على مستويات الدعم عند المتوسط المتحرك MA(25) مع بقاء الهيكل الفني أعلى خط الدعم الرئيسي MA(99). يدعم هذا الإعداد الفني صعود السعر نحو الأهداف العليا طالما استمرت منطقة الدعم القريبة قرب 0.23000 في الثبات.
يتداول زوج $LSK عند مستوى 0.24528 مسجلاً ارتفاعاً بنسبة +18.49% خلال 24 ساعة، مع تماسك السعر بالقرب من خط MA(25) عند 0.24717 عقب تراجع من قمة 0.31879 واستقراره أعلَى خط MA(99) الرئيسي عند 0.19721.
🔥 الاتجاه: الشراء (Long) لعملة $LSK
* Entry range: $0.23500 – $0.24800
* SL: $0.21500
* TP 1: $0.27500
* TP 2: $0.30000
* TP 3: $0.33000
تُظهر حركة السعر تماسكاً صحياً عقب الارتفاع القوي نحو ذروة 0.31879. يحافظ السعر على مستويات الدعم عند المتوسط المتحرك MA(25) مع بقاء الهيكل الفني أعلى خط الدعم الرئيسي MA(99). يدعم هذا الإعداد الفني صعود السعر نحو الأهداف العليا طالما استمرت منطقة الدعم القريبة قرب 0.23000 في الثبات.
17
·
--
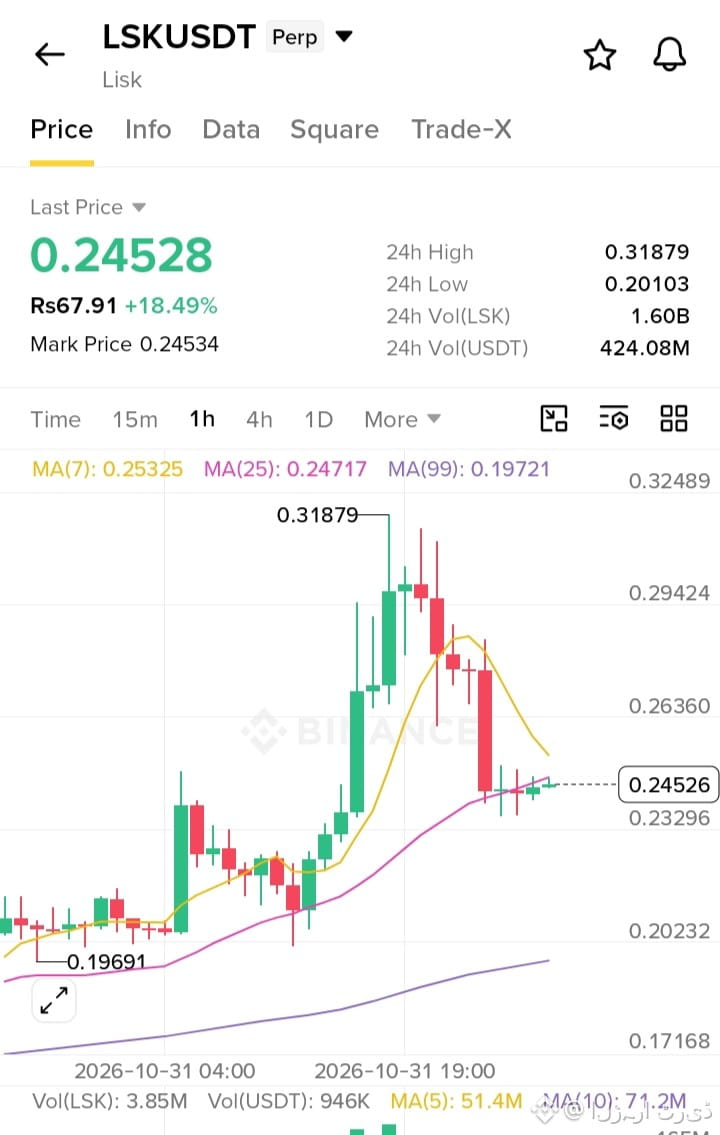
$LSK cotiza a 0.24528, con una subida del +18.49% en las últimas 24 horas, consolidándose cerca de la línea MA(25) en 0.24717 tras un retroceso desde el máximo de 0.31879, mientras se mantiene muy por encima de la línea de tendencia clave MA(99) en 0.19721.
🔥 Sesgo: Largo $LSK
{future}(LSKUSDT)
* Rango de entrada: $0.23500 – $0.24800
* SL: $0.21500
* TP 1: $0.27500
* TP 2: $0.30000
* TP 3: $0.33000
La acción del precio muestra una consolidación saludable tras un repunte de gran volumen hacia el máximo de 0.31879. El activo está manteniendo el soporte justo en el nivel dinámico MA(25), a la vez que conserva una estructura de mínimos crecientes por encima de la línea de tendencia principal MA(99). Este panorama técnico favorece una continuación alcista hacia los objetivos superiores, siempre que se mantenga firme el soporte inmediato cerca de 0.23000.
$LSK cotiza a 0.24528, con una subida del +18.49% en las últimas 24 horas, consolidándose cerca de la línea MA(25) en 0.24717 tras un retroceso desde el máximo de 0.31879, mientras se mantiene muy por encima de la línea de tendencia clave MA(99) en 0.19721.
🔥 Sesgo: Largo $LSK
* Rango de entrada: $0.23500 – $0.24800
* SL: $0.21500
* TP 1: $0.27500
* TP 2: $0.30000
* TP 3: $0.33000
La acción del precio muestra una consolidación saludable tras un repunte de gran volumen hacia el máximo de 0.31879. El activo está manteniendo el soporte justo en el nivel dinámico MA(25), a la vez que conserva una estructura de mínimos crecientes por encima de la línea de tendencia principal MA(99). Este panorama técnico favorece una continuación alcista hacia los objetivos superiores, siempre que se mantenga firme el soporte inmediato cerca de 0.23000.
13
·
--
Ver traducción
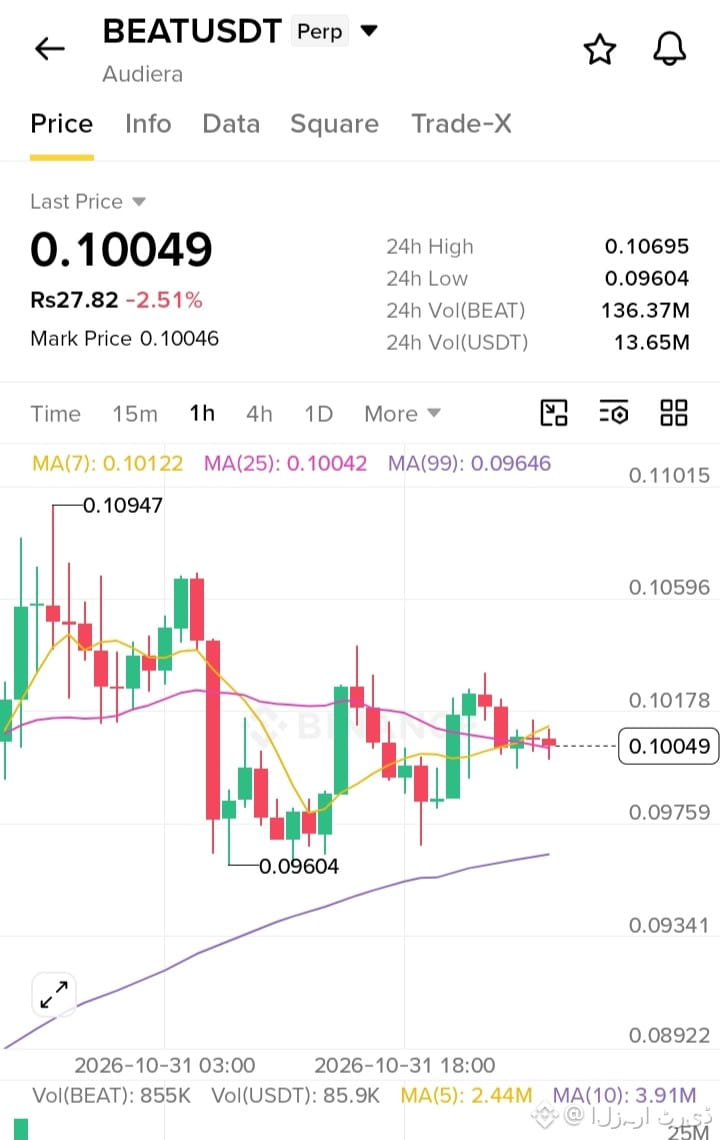
$BEAT is trading at 0.10049, down -2.51% over the last 24 hours, consolidating right around the MA(7) at 0.10122 and MA(25) at 0.10042 while staying above the key MA(99) baseline at 0.09646 following a pullback from the 0.10695 high.
🔻 Bias: Short $BEAT
{future}(BEATUSDT)
* Entry range: $0.10000 – $0.10250
* SL: $0.10800
* TP 1: $0.09650
* TP 2: $0.09200
* TP 3: $0.08750
Price action shows tight consolidation below short-term moving averages, with overhead resistance keeping the asset under pressure after failing to sustain higher levels. This structural setup favors a downside drift toward lower support targets as long as immediate resistance near 0.10300 remains defended.
$BEAT is trading at 0.10049, down -2.51% over the last 24 hours, consolidating right around the MA(7) at 0.10122 and MA(25) at 0.10042 while staying above the key MA(99) baseline at 0.09646 following a pullback from the 0.10695 high.
🔻 Bias: Short $BEAT
* Entry range: $0.10000 – $0.10250
* SL: $0.10800
* TP 1: $0.09650
* TP 2: $0.09200
* TP 3: $0.08750
Price action shows tight consolidation below short-term moving averages, with overhead resistance keeping the asset under pressure after failing to sustain higher levels. This structural setup favors a downside drift toward lower support targets as long as immediate resistance near 0.10300 remains defended.
17
·
--
Ver traducción
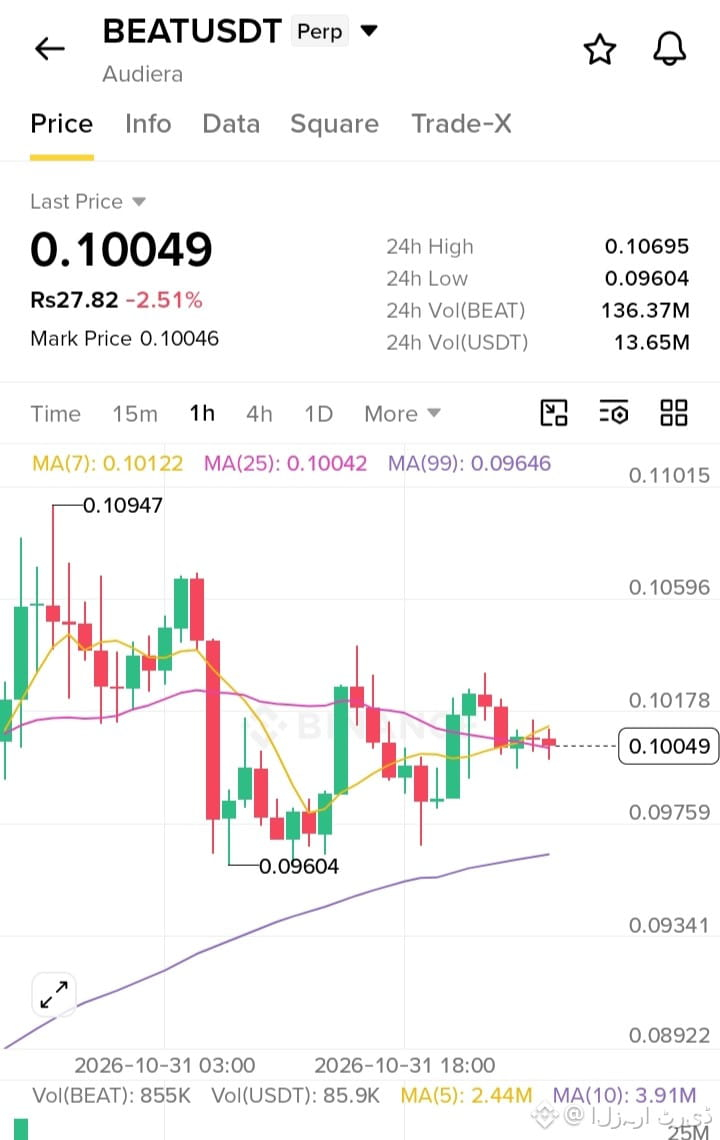
يتداول زوج $BEAT عند مستوى 0.10049 مسجلاً تراجعاً بنسبة -2.51% خلال 24 ساعة، مع تماسك السعر بالقرب من MA(7) عند 0.10122 وMA(25) عند 0.10042 بينما يحافظ على ثباته فوق خط الأساس الرئيسي MA(99) عند 0.09646 عقب انخفاض طفيف من قمة 0.10695.
🔻 الاتجاه: البيع (Short) لعملة $BEAT
{future}(BEATUSDT)
* Entry range: $0.10000 – $0.10250
* SL: $0.10800
* TP 1: $0.09650
* TP 2: $0.09200
* TP 3: $0.08750
تُظهر حركة السعر تماسكاً ضيقاً أدنى المتوسطات المتحركة قصيرة الأجل، مع وجود مقاومة علوية تبقي السعر تحت الضغط بعد عدم القدرة على الحفاظ على المستويات المرتفعة. يدعم هذا الهيكل الفني الانخفاض نحو أهداف الدعم السفلي طالما ظلت المقاومة القريبة قرب 0.10300 صامدة.
يتداول زوج $BEAT عند مستوى 0.10049 مسجلاً تراجعاً بنسبة -2.51% خلال 24 ساعة، مع تماسك السعر بالقرب من MA(7) عند 0.10122 وMA(25) عند 0.10042 بينما يحافظ على ثباته فوق خط الأساس الرئيسي MA(99) عند 0.09646 عقب انخفاض طفيف من قمة 0.10695.
🔻 الاتجاه: البيع (Short) لعملة $BEAT
* Entry range: $0.10000 – $0.10250
* SL: $0.10800
* TP 1: $0.09650
* TP 2: $0.09200
* TP 3: $0.08750
تُظهر حركة السعر تماسكاً ضيقاً أدنى المتوسطات المتحركة قصيرة الأجل، مع وجود مقاومة علوية تبقي السعر تحت الضغط بعد عدم القدرة على الحفاظ على المستويات المرتفعة. يدعم هذا الهيكل الفني الانخفاض نحو أهداف الدعم السفلي طالما ظلت المقاومة القريبة قرب 0.10300 صامدة.
25
·
--
Ver traducción
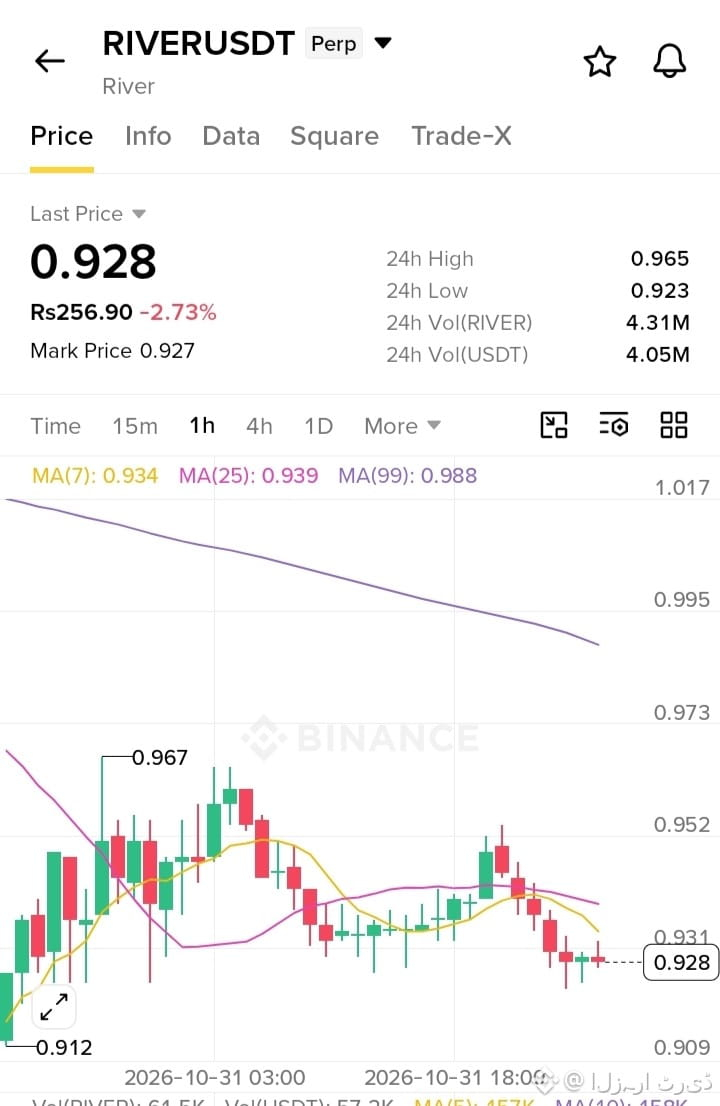
$RIVER is trading under minor pressure at 0.928, down -2.73% over the last 24 hours, consolidating near its support low of 0.923 and remaining below key moving averages including the MA(7) at 0.934, MA(25) at 0.939, and MA(99) at 0.988 following a pullback from the 0.965 high.
🔻 Bias: Short $RIVER
{future}(RIVERUSDT)
* Entry range: $0.925 – $0.945
* SL: $0.980
* TP 1: $0.890
* TP 2: $0.850
* TP 3: $0.810
Price action shows continuous downward drift below short-term moving averages, with overhead resistance keeping the asset under pressure. Weak buying volume favors a continued move toward lower support targets as long as immediate resistance near 0.950 remains defended.
$RIVER is trading under minor pressure at 0.928, down -2.73% over the last 24 hours, consolidating near its support low of 0.923 and remaining below key moving averages including the MA(7) at 0.934, MA(25) at 0.939, and MA(99) at 0.988 following a pullback from the 0.965 high.
🔻 Bias: Short $RIVER
* Entry range: $0.925 – $0.945
* SL: $0.980
* TP 1: $0.890
* TP 2: $0.850
* TP 3: $0.810
Price action shows continuous downward drift below short-term moving averages, with overhead resistance keeping the asset under pressure. Weak buying volume favors a continued move toward lower support targets as long as immediate resistance near 0.950 remains defended.
16
·
--
Ver traducción
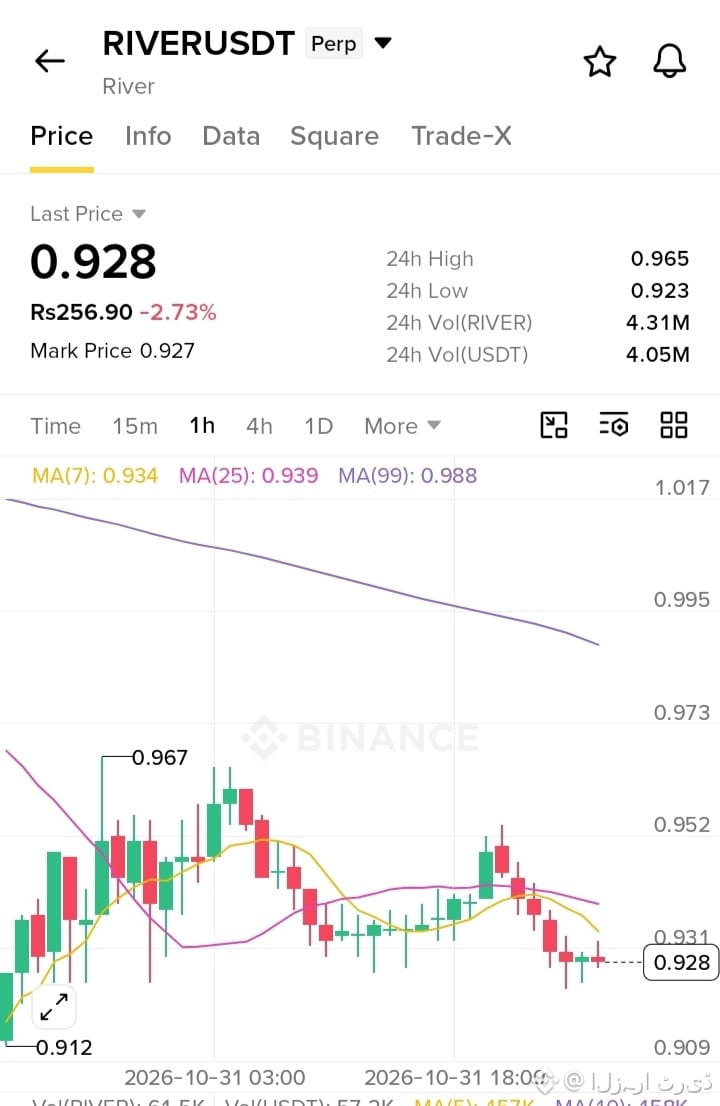
يتداول زوج $RIVER تحت ضغوط خفيفة عند مستوى 0.928 مسجلاً تراجعاً بنسبة -2.73% خلال 24 ساعة، مع تماسك السعر بالقرب من قاع الدعم عند 0.923 وبقائه أدنى المتوسطات المتحركة الرئيسية بما فيها MA(7) عند 0.934 وMA(25) عند 0.939 وMA(99) عند 0.988 عقب انخفاض طفيف من قمة 0.965.
🔻 الاتجاه: البيع (Short) لعملة $RIVER
{future}(RIVERUSDT)
* Entry range: $0.925 – $0.945
* SL: $0.980
* TP 1: $0.890
* TP 2: $0.850
* TP 3: $0.810
تُظهر حركة السعر انخفاضاً تدريجياً أدنى المتوسطات المتحركة قصيرة الأجل، مع وجود مقاومة علوية تبقي السعر تحت الضغط. يدعم ضعف حجم الشراء استمرار الحركة نحو أهداف الدعم السفلي طالما ظلت المقاومة القريبة قرب 0.950 صامدة.
يتداول زوج $RIVER تحت ضغوط خفيفة عند مستوى 0.928 مسجلاً تراجعاً بنسبة -2.73% خلال 24 ساعة، مع تماسك السعر بالقرب من قاع الدعم عند 0.923 وبقائه أدنى المتوسطات المتحركة الرئيسية بما فيها MA(7) عند 0.934 وMA(25) عند 0.939 وMA(99) عند 0.988 عقب انخفاض طفيف من قمة 0.965.
🔻 الاتجاه: البيع (Short) لعملة $RIVER
* Entry range: $0.925 – $0.945
* SL: $0.980
* TP 1: $0.890
* TP 2: $0.850
* TP 3: $0.810
تُظهر حركة السعر انخفاضاً تدريجياً أدنى المتوسطات المتحركة قصيرة الأجل، مع وجود مقاومة علوية تبقي السعر تحت الضغط. يدعم ضعف حجم الشراء استمرار الحركة نحو أهداف الدعم السفلي طالما ظلت المقاومة القريبة قرب 0.950 صامدة.
12
·
--
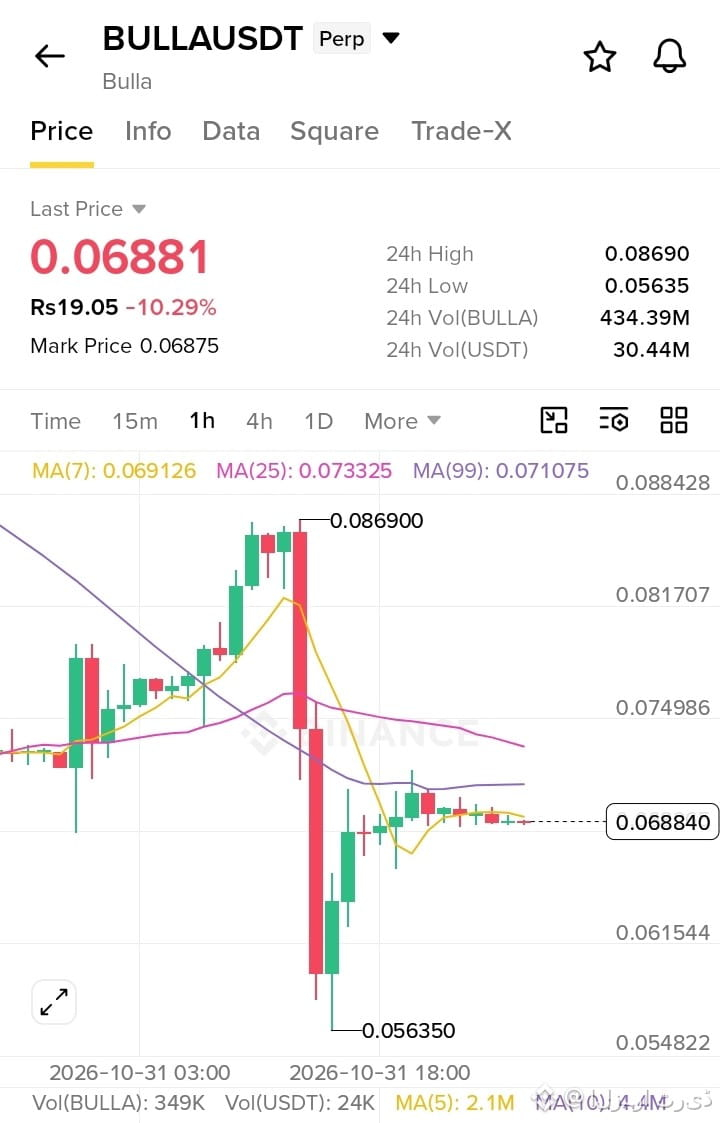
$BULLA cotiza a 0.06881, con una caída del -10.29% en las últimas 24 horas, consolidándose cerca de la línea MA(7) en 0.069126 tras un fuerte descenso hacia el mínimo de soporte de 0.05635.
🔻 Sesgo: Corto $BULLA
{future}(BULLAUSDT)
* Rango de entrada: $0.06800 – $0.07200
* SL: $0.07700
* TP 1: $0.06100
* TP 2: $0.05500
* TP 3: $0.04900
La acción del precio muestra una fuerte presión bajista tras romper las zonas de consolidación más altas, y se mantiene muy por debajo de las principales medias móviles, incluida la MA(25) en 0.073325 y la MA(99) en 0.071075. Los débiles intentos de recuperación y el claro dominio de los vendedores favorecen que continúe el movimiento bajista mientras se mantenga firme la resistencia superior cerca de 0.07400.
$BULLA cotiza a 0.06881, con una caída del -10.29% en las últimas 24 horas, consolidándose cerca de la línea MA(7) en 0.069126 tras un fuerte descenso hacia el mínimo de soporte de 0.05635.
🔻 Sesgo: Corto $BULLA
* Rango de entrada: $0.06800 – $0.07200
* SL: $0.07700
* TP 1: $0.06100
* TP 2: $0.05500
* TP 3: $0.04900
La acción del precio muestra una fuerte presión bajista tras romper las zonas de consolidación más altas, y se mantiene muy por debajo de las principales medias móviles, incluida la MA(25) en 0.073325 y la MA(99) en 0.071075. Los débiles intentos de recuperación y el claro dominio de los vendedores favorecen que continúe el movimiento bajista mientras se mantenga firme la resistencia superior cerca de 0.07400.
13
·
--
Ver traducción
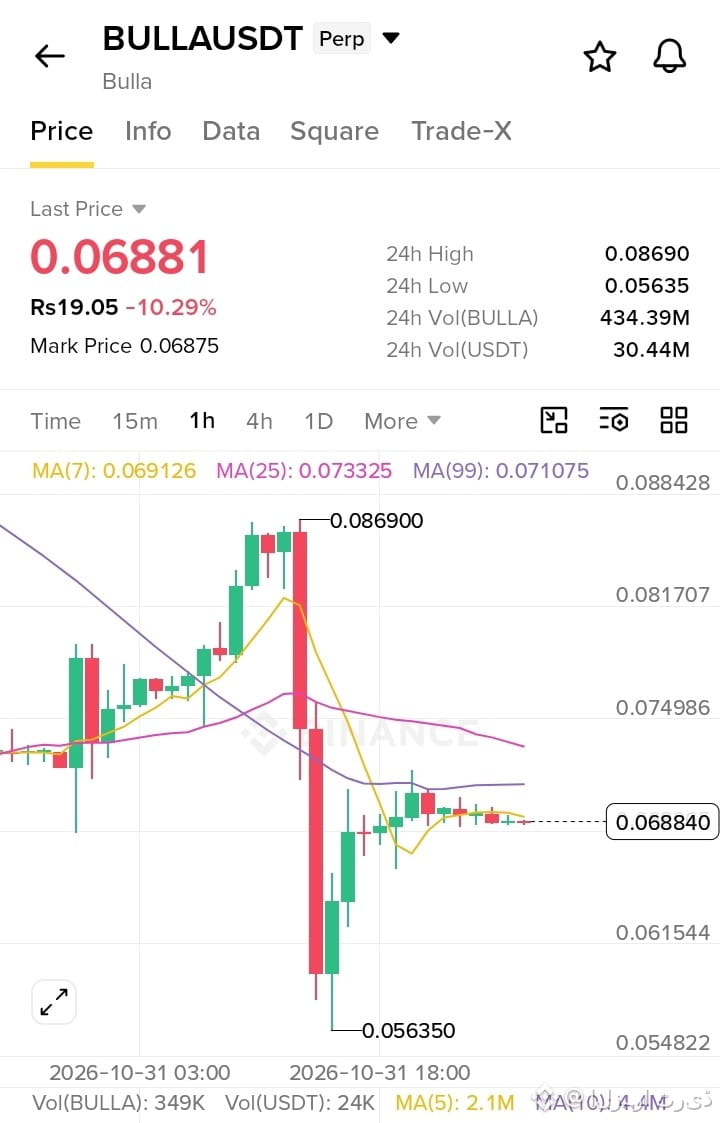
يتداول زوج $BULLA عند مستوى 0.06881 مسجلاً تراجعاً بنسبة -10.29% خلال 24 ساعة، مع تماسك السعر قرب خط MA(7) عند 0.069126 عقب هبوط حاد نحو قاع الدعم عند 0.05635.
🔻 الاتجاه: البيع (Short) لعملة $BULLA
{future}(BULLAUSDT)
* Entry range: $0.06800 – $0.07200
* SL: $0.07700
* TP 1: $0.06100
* TP 2: $0.05500
* TP 3: $0.04900
تُظهر حركة السعر ضغوطاً بيعية مكثفة عقب كسراً لمستويات التجميع السابقة، حيث يستقر السعر بوضوح أدنى المتوسطات المتحركة الرئيسية بما فيها MA(25) عند 0.073325 وMA(99) عند 0.071075. تدعم محاولات التعافي الضعيفة وسيطرة البائعين استمرار الاتجاه الهابط طالما ظلت المقاومة القريبة قرب 0.07400 صامدة.
يتداول زوج $BULLA عند مستوى 0.06881 مسجلاً تراجعاً بنسبة -10.29% خلال 24 ساعة، مع تماسك السعر قرب خط MA(7) عند 0.069126 عقب هبوط حاد نحو قاع الدعم عند 0.05635.
🔻 الاتجاه: البيع (Short) لعملة $BULLA
* Entry range: $0.06800 – $0.07200
* SL: $0.07700
* TP 1: $0.06100
* TP 2: $0.05500
* TP 3: $0.04900
تُظهر حركة السعر ضغوطاً بيعية مكثفة عقب كسراً لمستويات التجميع السابقة، حيث يستقر السعر بوضوح أدنى المتوسطات المتحركة الرئيسية بما فيها MA(25) عند 0.073325 وMA(99) عند 0.071075. تدعم محاولات التعافي الضعيفة وسيطرة البائعين استمرار الاتجاه الهابط طالما ظلت المقاومة القريبة قرب 0.07400 صامدة.
7
·
--
Ver traducción
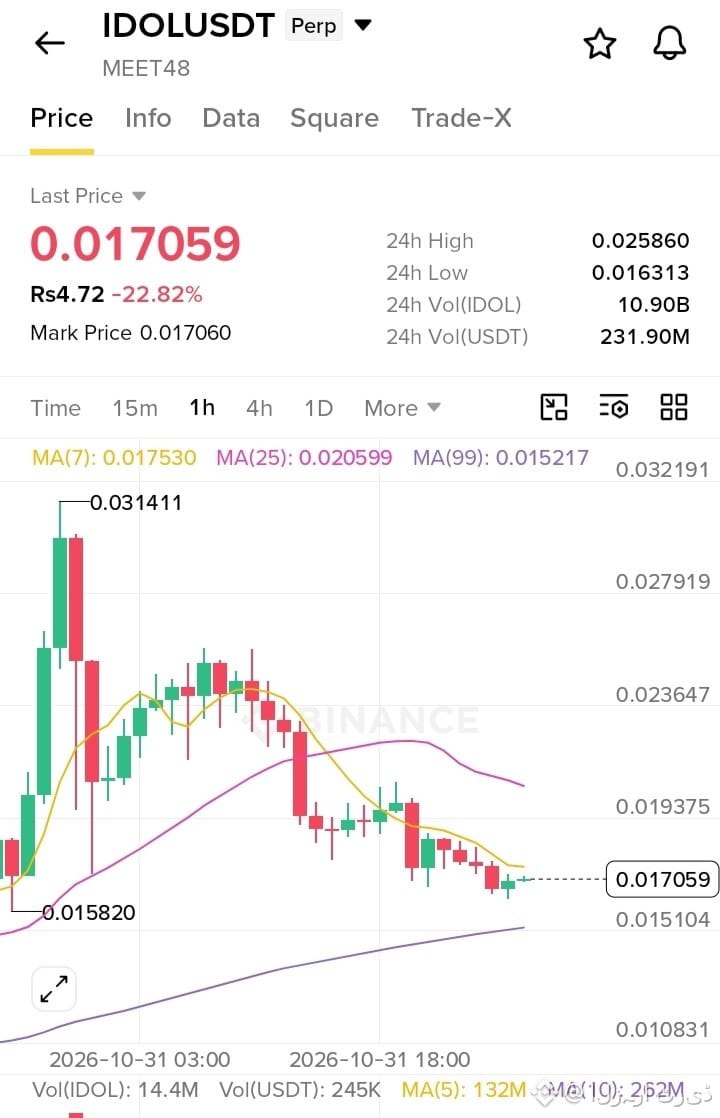
يتداول زوج $IDOL عند مستوى 0.017059 مسجلاً تراجعاً بنسبة -22.82% خلال 24 ساعة، مع تماسك السعر بالقرب من قاع الدعم عند 0.016313 وبقائه أدنى خطوط MA(7) عند 0.017530 وMA(25) عند 0.020599، لكنه يحافظ على ثباته فوق خط الأساس الرئيسي MA(99) عند 0.015217 عقب الانخفاض الحاد من قمة 0.031411.
🔻 الاتجاه: البيع (Short) لعملة $IDOL
{future}(IDOLUSDT)
* Entry range: $0.017000 – $0.018200
* SL: $0.020500
* TP 1: $0.015200
* TP 2: $0.013500
* TP 3: $0.011800
تُظهر حركة السعر ضغوطاً بيعية حادة على المدى القريب عقب الانخفاض السريع من ذروة 0.031411. يظل السعر محصوراً أدنى متوسطات الحركة قصيرة الأجل MA(7) وMA(25) وسط ضعف زخم الشراء. يدعم هذا الهيكل الفني استمرار اختبار مستويات دعم أدنى نحو خط MA(99) قرب 0.015200 ما لم يستطع المشترون استعادة مستوى المقاومة أعلَى 0.018500.
يتداول زوج $IDOL عند مستوى 0.017059 مسجلاً تراجعاً بنسبة -22.82% خلال 24 ساعة، مع تماسك السعر بالقرب من قاع الدعم عند 0.016313 وبقائه أدنى خطوط MA(7) عند 0.017530 وMA(25) عند 0.020599، لكنه يحافظ على ثباته فوق خط الأساس الرئيسي MA(99) عند 0.015217 عقب الانخفاض الحاد من قمة 0.031411.
🔻 الاتجاه: البيع (Short) لعملة $IDOL
* Entry range: $0.017000 – $0.018200
* SL: $0.020500
* TP 1: $0.015200
* TP 2: $0.013500
* TP 3: $0.011800
تُظهر حركة السعر ضغوطاً بيعية حادة على المدى القريب عقب الانخفاض السريع من ذروة 0.031411. يظل السعر محصوراً أدنى متوسطات الحركة قصيرة الأجل MA(7) وMA(25) وسط ضعف زخم الشراء. يدعم هذا الهيكل الفني استمرار اختبار مستويات دعم أدنى نحو خط MA(99) قرب 0.015200 ما لم يستطع المشترون استعادة مستوى المقاومة أعلَى 0.018500.
6
·
--
Ver traducción
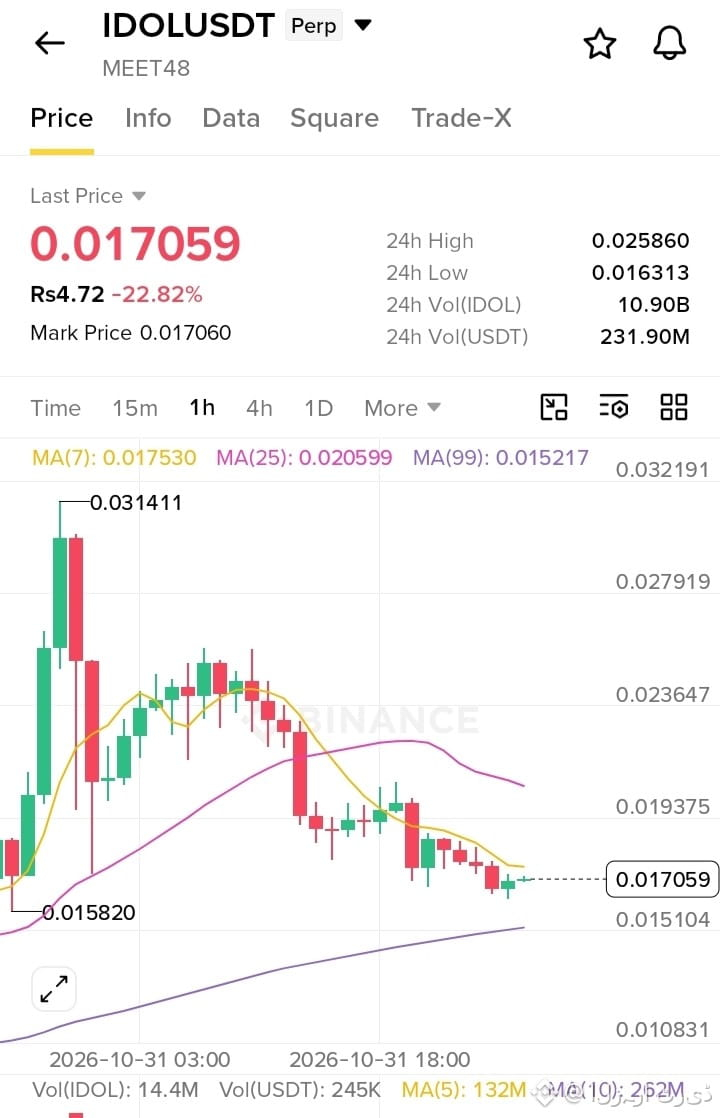
$IDOL is trading at 0.017059, down -22.82% over the last 24 hours, consolidating near the 0.016313 support low while staying below the MA(7) at 0.017530 and MA(25) at 0.020599, but holding above the key MA(99) baseline at 0.015217 following a severe rejection from the 0.031411 high.
🔻 Bias: Short $IDOL
{future}(IDOLUSDT)
* Entry range: $0.017000 – $0.018200
* SL: $0.020500
* TP 1: $0.015200
* TP 2: $0.013500
* TP 3: $0.011800
Price action indicates strong short-term bearish pressure after dropping sharply from the 0.031411 peak. The asset remains constrained beneath the short-term MA(7) and MA(25) moving averages, showing minimal buying momentum. This structure favors further downside testing toward the MA(99) support near 0.015200 unless buyers can reclaim resistance above 0.018500.
$IDOL is trading at 0.017059, down -22.82% over the last 24 hours, consolidating near the 0.016313 support low while staying below the MA(7) at 0.017530 and MA(25) at 0.020599, but holding above the key MA(99) baseline at 0.015217 following a severe rejection from the 0.031411 high.
🔻 Bias: Short $IDOL
* Entry range: $0.017000 – $0.018200
* SL: $0.020500
* TP 1: $0.015200
* TP 2: $0.013500
* TP 3: $0.011800
Price action indicates strong short-term bearish pressure after dropping sharply from the 0.031411 peak. The asset remains constrained beneath the short-term MA(7) and MA(25) moving averages, showing minimal buying momentum. This structure favors further downside testing toward the MA(99) support near 0.015200 unless buyers can reclaim resistance above 0.018500.
8
·
--
Ver traducción
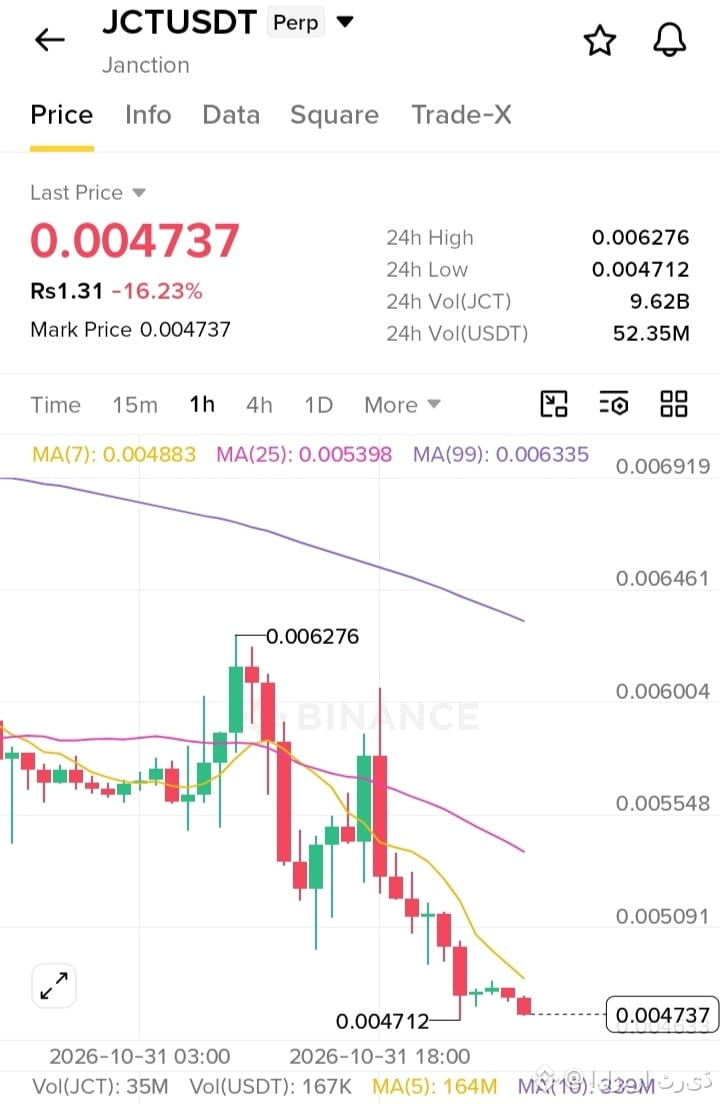
$JCT is trading at 0.004737, down -16.23% over the last 24 hours, consolidating near its support low of 0.004712 and remaining well below key moving averages including the MA(7) at 0.004883, MA(25) at 0.005398, and MA(99) at 0.006335 following a breakdown from the 0.006276 high.
🔻 Bias: Short $JCT
{future}(JCTUSDT)
* Entry range: $0.004700 – $0.005000
* SL: $0.005500
* TP 1: $0.004200
* TP 2: $0.003700
* TP 3: $0.003100
Price action shows continuous downward momentum following a breakdown from higher consolidation zones. The asset remains trading underneath the MA(7), MA(25), and MA(99) moving averages with low volume recovery attempts. This structural setup favors further downside continuation toward lower support targets as long as immediate overhead resistance near 0.005200 remains intact.
$JCT is trading at 0.004737, down -16.23% over the last 24 hours, consolidating near its support low of 0.004712 and remaining well below key moving averages including the MA(7) at 0.004883, MA(25) at 0.005398, and MA(99) at 0.006335 following a breakdown from the 0.006276 high.
🔻 Bias: Short $JCT
* Entry range: $0.004700 – $0.005000
* SL: $0.005500
* TP 1: $0.004200
* TP 2: $0.003700
* TP 3: $0.003100
Price action shows continuous downward momentum following a breakdown from higher consolidation zones. The asset remains trading underneath the MA(7), MA(25), and MA(99) moving averages with low volume recovery attempts. This structural setup favors further downside continuation toward lower support targets as long as immediate overhead resistance near 0.005200 remains intact.
12
·
--
Ver traducción
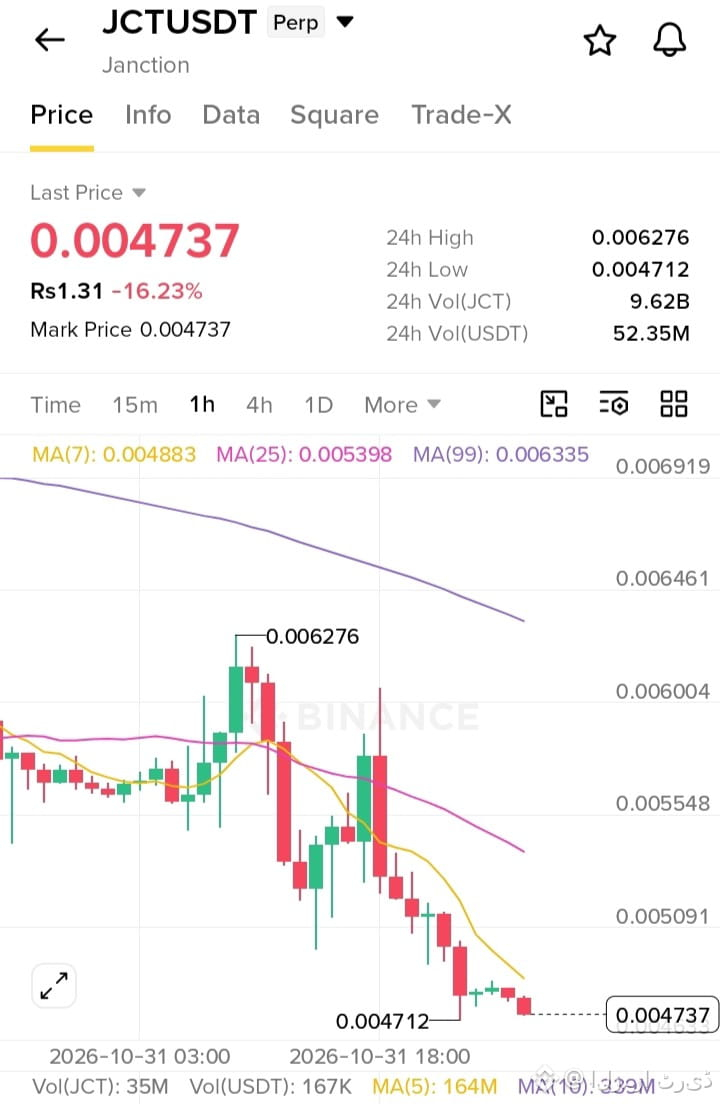
يتداول زوج $JCT عند مستوى 0.004737 مسجلاً تراجعاً بنسبة -16.23% خلال 24 ساعة، مع تماسك السعر بالقرب من قاع الدعم عند 0.004712 واستقراره بوضوح أدنى المتوسطات المتحركة الرئيسية بما فيها MA(7) عند 0.004883 وMA(25) عند 0.005398 وMA(99) عند 0.006335 إثر انخفاض حاد من قمة 0.006276.
🔻 الاتجاه: البيع (Short) لعملة $JCT
{future}(JCTUSDT)
* Entry range: $0.004700 – $0.005000
* SL: $0.005500
* TP 1: $0.004200
* TP 2: $0.003700
* TP 3: $0.003100
تُظهر حركة السعر استمرار الضغوط البيعية عقب كسراً لمستويات التجميع العليا. يستقر السعر أدنى خطوط المتوسطات المتحركة MA(7) وMA(25) وMA(99) وسط محاولات ارتداد ضعيفة في حجم التداول. يدعم هذا الهيكل الفني استمرار الاتجاه الهابط نحو أهداف دعم أدنى طالما ظلت المقاومة القريبة قرب 0.005200 صامدة.
يتداول زوج $JCT عند مستوى 0.004737 مسجلاً تراجعاً بنسبة -16.23% خلال 24 ساعة، مع تماسك السعر بالقرب من قاع الدعم عند 0.004712 واستقراره بوضوح أدنى المتوسطات المتحركة الرئيسية بما فيها MA(7) عند 0.004883 وMA(25) عند 0.005398 وMA(99) عند 0.006335 إثر انخفاض حاد من قمة 0.006276.
🔻 الاتجاه: البيع (Short) لعملة $JCT
* Entry range: $0.004700 – $0.005000
* SL: $0.005500
* TP 1: $0.004200
* TP 2: $0.003700
* TP 3: $0.003100
تُظهر حركة السعر استمرار الضغوط البيعية عقب كسراً لمستويات التجميع العليا. يستقر السعر أدنى خطوط المتوسطات المتحركة MA(7) وMA(25) وMA(99) وسط محاولات ارتداد ضعيفة في حجم التداول. يدعم هذا الهيكل الفني استمرار الاتجاه الهابط نحو أهداف دعم أدنى طالما ظلت المقاومة القريبة قرب 0.005200 صامدة.
6
Inicia sesión para explorar más contenidos
Únete a usuarios de criptomonedas de todo el mundo en Binance Square
⚡️ Obtén la información más reciente y útil sobre criptomonedas.
💬 Confía en el mayor exchange de criptomonedas del mundo.
👍 Descubre opiniones reales de creadores verificados.
Correo electrónico/número de teléfono
Temas en tendencia
BinanceToResumePhaseOneOfWithdrawals
1,239 visualizaciones
98 participa(n) en el debate
Incidente de seguridad | Actualización de recuperación n.º 4: los retiros se reanudarán por fases (2026-11-01)
Binance Announcement
·114 «Me gusta»
·115.5k visualizaciones
BinanceHadAlreadyCovered$6BofHackLoss
717 visualizaciones
24 participa(n) en el debate
FBIConfirmsNorthKoreaIsResponsibleForBinanceCryptoHack
3,799 visualizaciones
36 participa(n) en el debate