

Mughal007
3 Publicaciones

Mughal007
Denunciar
Bloquear usuario
Abrir operación
Trader ocasional
3 años
1 Siguiendo
4 Seguidores
0 Me gusta
Publicaciones
Cartera
·
--
$ETH Sinceramente, ETH ha tenido un mes bastante complicado. Después de intentar superar la resistencia de los $2,800 hace un tiempo, los alcistas simplemente no pudieron mantener el impulso. Ahora mismo, está bajando y se mueve en torno al rango de $2,310 a $2,330, con una caída de aproximadamente un 11-12% a lo largo de octubre.
Si estás siguiendo los gráficos, hay algunas cosas que destacan:
La prueba del soporte: El precio está justo alrededor de los $2,300. Es un nivel bastante crucial. Si se rompe, podríamos verlo caer fácilmente hasta poner a prueba la zona psicológica de los $2,000.
Los indicadores: El RSI está en torno a los 30 puntos, acercándose a territorio de sobreventa, lo que suele significar que podríamos ver pronto un pequeño rebote de alivio, aunque la tendencia general sigue siendo bajista. El volumen de ventas en el mercado de futuros también ha sido bastante dominante.
El panorama: Últimamente, las entradas de capital institucional no han sido lo bastante fuertes como para rescatar el precio, y el mercado macroeconómico en general está inquieto.
En resumen, ahora mismo toca esperar. ETH realmente necesita recuperar los $2,400 o más y mantenerse por encima de ese nivel antes de que alguien pueda hablar en serio de un cambio de tendencia.
¿Qué tipo de estrategia estás considerando ahora mismo? ¿Estás intentando encontrar un buen momento para acumular o simplemente sigues de cerca los gráficos de Binance para ver dónde toca fondo? @Ethereum_official
{spot}(ETHUSDT)
#Ethereum
$ETH Sinceramente, ETH ha tenido un mes bastante complicado. Después de intentar superar la resistencia de los $2,800 hace un tiempo, los alcistas simplemente no pudieron mantener el impulso. Ahora mismo, está bajando y se mueve en torno al rango de $2,310 a $2,330, con una caída de aproximadamente un 11-12% a lo largo de octubre.
Si estás siguiendo los gráficos, hay algunas cosas que destacan:
La prueba del soporte: El precio está justo alrededor de los $2,300. Es un nivel bastante crucial. Si se rompe, podríamos verlo caer fácilmente hasta poner a prueba la zona psicológica de los $2,000.
Los indicadores: El RSI está en torno a los 30 puntos, acercándose a territorio de sobreventa, lo que suele significar que podríamos ver pronto un pequeño rebote de alivio, aunque la tendencia general sigue siendo bajista. El volumen de ventas en el mercado de futuros también ha sido bastante dominante.
El panorama: Últimamente, las entradas de capital institucional no han sido lo bastante fuertes como para rescatar el precio, y el mercado macroeconómico en general está inquieto.
En resumen, ahora mismo toca esperar. ETH realmente necesita recuperar los $2,400 o más y mantenerse por encima de ese nivel antes de que alguien pueda hablar en serio de un cambio de tendencia.
¿Qué tipo de estrategia estás considerando ahora mismo? ¿Estás intentando encontrar un buen momento para acumular o simplemente sigues de cerca los gráficos de Binance para ver dónde toca fondo? @Ethereum
#Ethereum

135
·
--
Artículo
Ver traducción
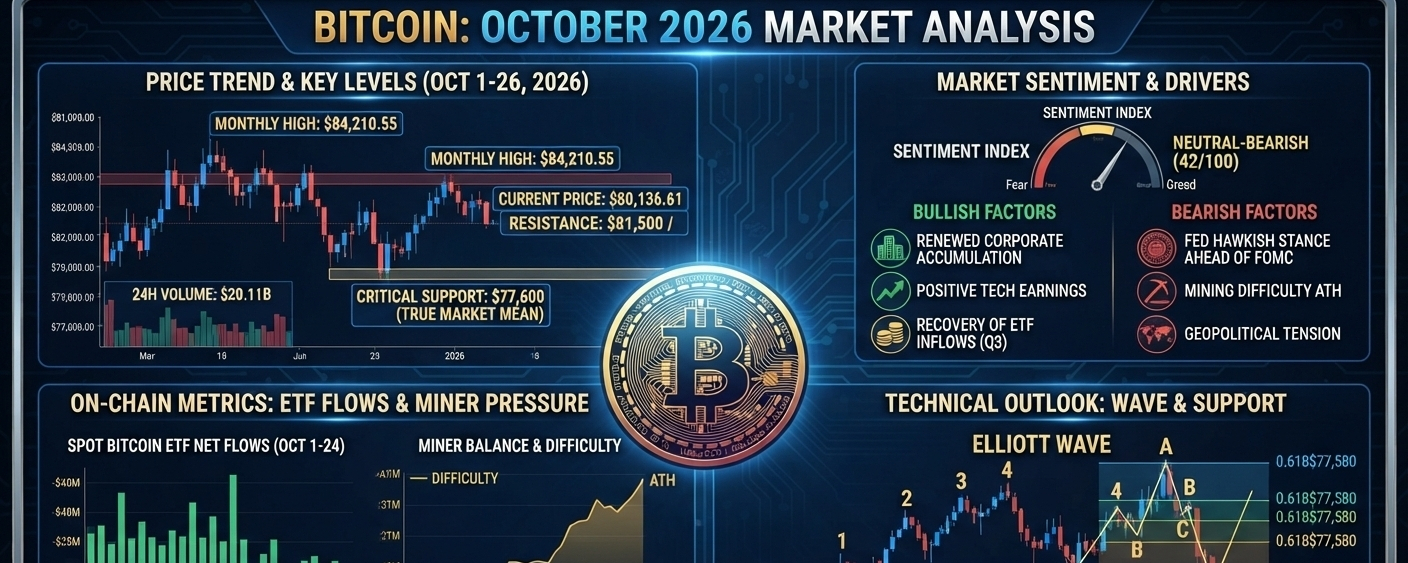
Bitcoin Analysis October 2026$BTC (BTC) Market Analysis – October 2026
Bitcoin ($BTC) has experienced notable volatility in October 2026, dropping to the $77,600 region before attempting to stabilize around the $80,100 mark. The current market phase represents a critical consolidation period as the asset navigates contrasting macro-economic headwinds and fundamental on-chain shifts.
Here is a detailed breakdown of the technical, fundamental, and sentiment factors currently shaping Bitcoin's price action:
1. Price Action & Key Levels
After reaching a monthly high of $84,210.55, Bitcoin faced a correctional pull-back, touching a critical support level at $77,600. This support area is particularly significant as it aligns with the 2026 "True Market Mean" and previous high-volume node areas, offering a strong floor for bulls.
Resistance: Immidiate hurdles lie at the $81,500 to $82,500 range. For the bullish trend to resume with strength, $BTC needs to decisively break and hold above the $81,500 resistance.
Support: The $77,600 area remains the most vital defense line. A sustained breach below this point could see Bitcoin fall back to the $72,856 level, which coincides with the 200-day Moving Average (MA).
2. Market Sentiment: "Neutral-Bearish"
The Crypto Fear & Greed / Sentiment Index has dipped into Neutral-Bearish territory (42/100), reflecting cautiousness among retail and institutional players.
Bearish Drivers: General hesitation is fueled by a hawkish Federal Reserve stance heading into the upcoming FOMC meeting, alongside escalating geopolitical tensions. Furthermore, the network’s mining difficulty has hit an All-Time High (ATH), squeezing miner margins.
Bullish Undercurrents: Despite the fear, underlying institutional interest remains steady, marked by renewed corporate accumulation. The market is also benefiting from a general recovery trend in spot ETF interest after a mixed third quarter.
3. On-Chain Metrics & ETF Activity
ETF Flow Activity (Oct 1–24): Mid-October saw a period of net outflows (totaling around -$485M). Spot Bitcoin ETFs have seen sporadic daily activity as institutional desk managers adjust their portfolios ahead of year-end.
Miner Behavior: With the mining difficulty peaking, on-chain data shows Miner Balances decreasing slightly, indicating that miners may be selling off some holdings to cover rising operational costs. This miner capitulation pressure is currently keeping a lid on rapid upward movements.
4. Technical Outlook (Elliott Wave Analysis)
From a technical wave perspective, Bitcoin's drop from its local highs can be interpreted as a standard corrective 'Wave C' phase within an Elliott Wave pattern.
A natural ending to the correction appears to have formed around the $77,600 (0.618 Fibonacci level).
If the support continues to hold, we are likely to see a period of consolidation between $77,600 and $81,500.
An accumulation pattern in this range could lay the groundwork for the next impulsive 'Wave 5' upward push toward new highs later in the year.
Summary: The market is at a crossroads. While near-term headwinds like mining difficulty and macro-economic policies are caping large gains, Bitcoin's defense of the $77,600 level demonstrates resilient buy-side interest. A period of sideways consolidation is expected before the next major directional breakout.
Disclaimer: This analysis is for informational purposes only and does not constitute financial advice. Cryptocurrency markets are highly volatile
#bitcoin #cryptooinsigts

Bitcoin Analysis October 2026
$BTC (BTC) Market Analysis – October 2026
Bitcoin ($BTC ) has experienced notable volatility in October 2026, dropping to the $77,600 region before attempting to stabilize around the $80,100 mark. The current market phase represents a critical consolidation period as the asset navigates contrasting macro-economic headwinds and fundamental on-chain shifts.
Here is a detailed breakdown of the technical, fundamental, and sentiment factors currently shaping Bitcoin's price action:
1. Price Action & Key Levels
After reaching a monthly high of $84,210.55, Bitcoin faced a correctional pull-back, touching a critical support level at $77,600. This support area is particularly significant as it aligns with the 2026 "True Market Mean" and previous high-volume node areas, offering a strong floor for bulls.
Resistance: Immidiate hurdles lie at the $81,500 to $82,500 range. For the bullish trend to resume with strength, $BTC needs to decisively break and hold above the $81,500 resistance.
Support: The $77,600 area remains the most vital defense line. A sustained breach below this point could see Bitcoin fall back to the $72,856 level, which coincides with the 200-day Moving Average (MA).
2. Market Sentiment: "Neutral-Bearish"
The Crypto Fear & Greed / Sentiment Index has dipped into Neutral-Bearish territory (42/100), reflecting cautiousness among retail and institutional players.
Bearish Drivers: General hesitation is fueled by a hawkish Federal Reserve stance heading into the upcoming FOMC meeting, alongside escalating geopolitical tensions. Furthermore, the network’s mining difficulty has hit an All-Time High (ATH), squeezing miner margins.
Bullish Undercurrents: Despite the fear, underlying institutional interest remains steady, marked by renewed corporate accumulation. The market is also benefiting from a general recovery trend in spot ETF interest after a mixed third quarter.
3. On-Chain Metrics & ETF Activity
ETF Flow Activity (Oct 1–24): Mid-October saw a period of net outflows (totaling around -$485M). Spot Bitcoin ETFs have seen sporadic daily activity as institutional desk managers adjust their portfolios ahead of year-end.
Miner Behavior: With the mining difficulty peaking, on-chain data shows Miner Balances decreasing slightly, indicating that miners may be selling off some holdings to cover rising operational costs. This miner capitulation pressure is currently keeping a lid on rapid upward movements.
4. Technical Outlook (Elliott Wave Analysis)
From a technical wave perspective, Bitcoin's drop from its local highs can be interpreted as a standard corrective 'Wave C' phase within an Elliott Wave pattern.
A natural ending to the correction appears to have formed around the $77,600 (0.618 Fibonacci level).
If the support continues to hold, we are likely to see a period of consolidation between $77,600 and $81,500.
An accumulation pattern in this range could lay the groundwork for the next impulsive 'Wave 5' upward push toward new highs later in the year.
Summary: The market is at a crossroads. While near-term headwinds like mining difficulty and macro-economic policies are caping large gains, Bitcoin's defense of the $77,600 level demonstrates resilient buy-side interest. A period of sideways consolidation is expected before the next major directional breakout.
Disclaimer: This analysis is for informational purposes only and does not constitute financial advice. Cryptocurrency markets are highly volatile
#bitcoin #cryptooinsigts

73
·
--
Ver traducción
#EarnFreeCrypto2024
I think we should calm ourselves during bad financial Times So we can create Good Time For Us.
#EarnFreeCrypto2024
I think we should calm ourselves during bad financial Times So we can create Good Time For Us.
I think we should calm ourselves during bad financial Times So we can create Good Time For Us.
1
138
Inicia sesión para explorar más contenidos
Únete a usuarios de criptomonedas de todo el mundo en Binance Square
⚡️ Obtén la información más reciente y útil sobre criptomonedas.
💬 Confía en el mayor exchange de criptomonedas del mundo.
👍 Descubre opiniones reales de creadores verificados.
Correo electrónico/número de teléfono
Temas en tendencia
BinancePick
3.1M visualizaciones
153,244 participa(n) en el debate
¡Únete a #TemporadaDeResultados: predice resultados en Binance Pick y comparte tu opinión en Binance Square!
Binance Square Official
·413 «Me gusta»
·343.4k visualizaciones
EarningsSeason
5.3M visualizaciones
26,056 participa(n) en el debate
AnthropicTTMRevenueGrewAbout1200%
35,426 visualizaciones
442 participa(n) en el debate