

أميرة سيد
2.6k Publicaciones

أميرة سيد
Denunciar
Bloquear usuario
Professional Trader | Free Chart Analysis | Signal & Update about Crypto |
Abrir operación
Trader ocasional
1.3 años
29 Siguiendo
1.0K+ Seguidores
499 Me gusta
Publicaciones
Cartera
Todo
Cotizaciones
·
--
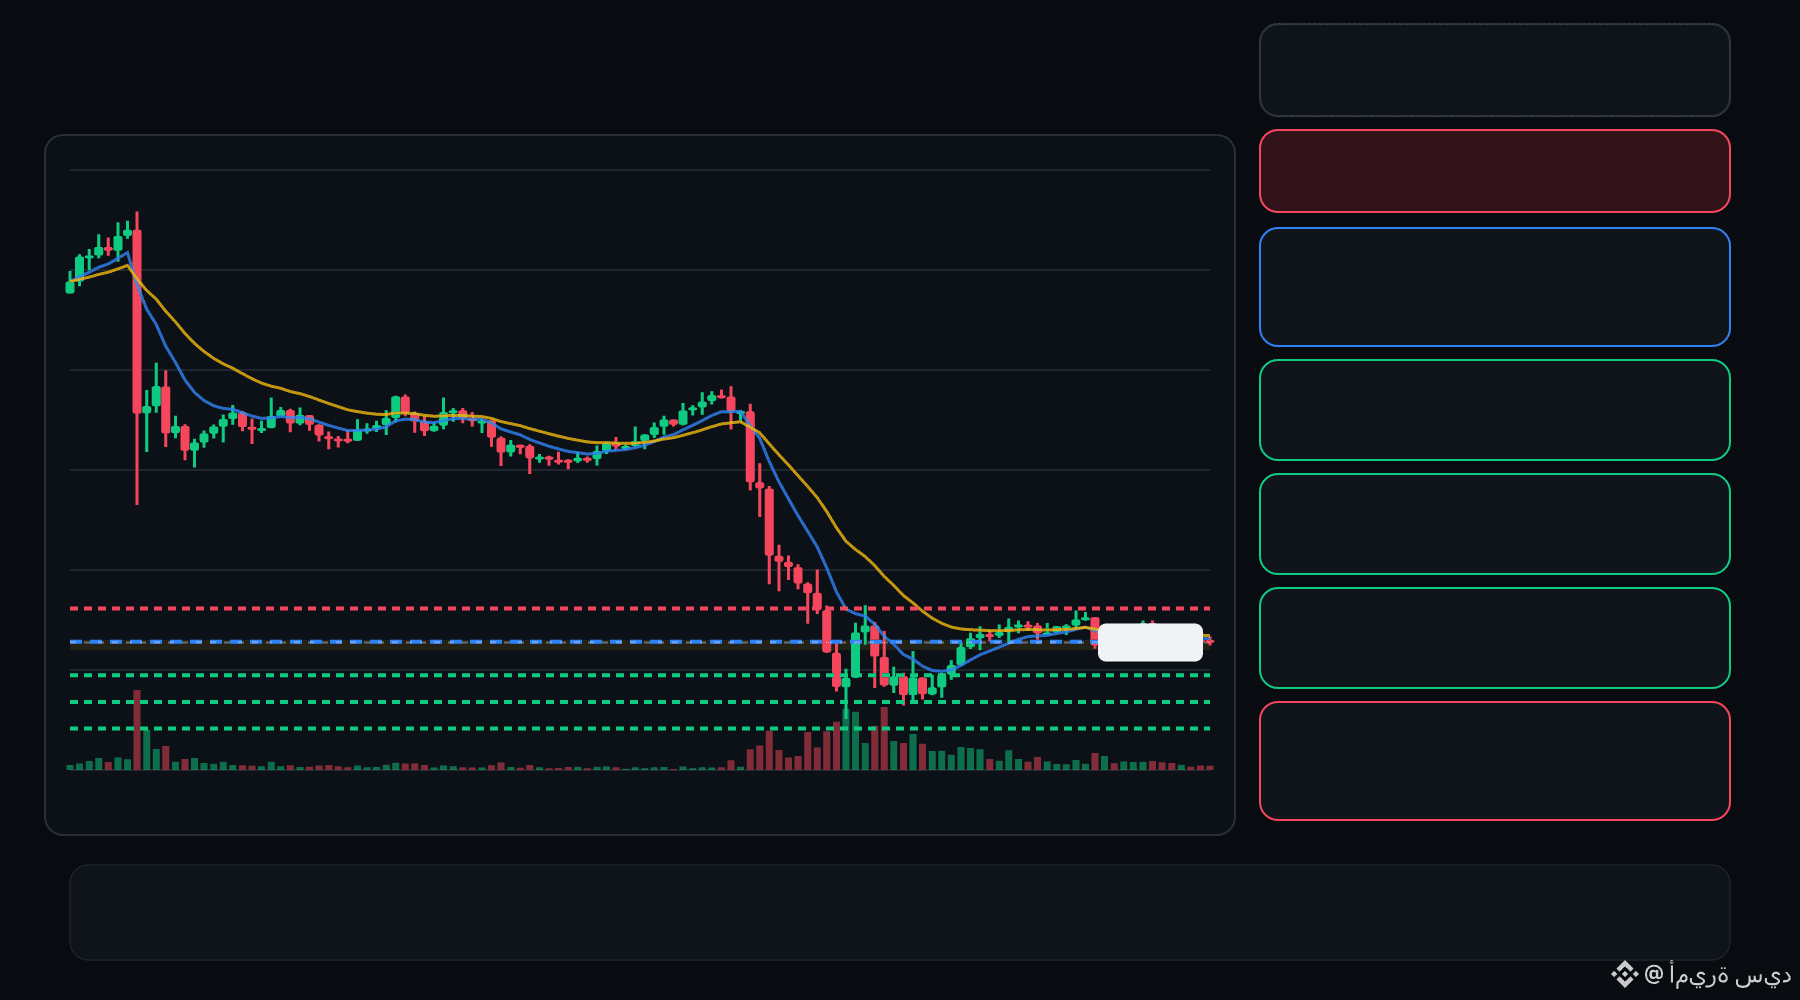
🔴 Los bajistas de Q están presionando el retroceso… ¿se está profundizando el rechazo? ⁉️
🔴 CORTO en Q
Entrada: 0.03159 – 0.03185
TP1: 0.02933
TP2: 0.02742
TP3: 0.02551
Stop Loss: 0.03411
El gráfico de 15M muestra una estructura bajista con confirmación de impulso y volumen. Un nuevo test controlado de la zona de entrada podría ofrecer una señal más clara para la operación.
Plan: Espera confirmación/rechazo dentro de la zona de entrada; no persigas el movimiento.
Investiga por tu cuenta | Gestiona el riesgo | Evita un apalancamiento excesivo
·
--
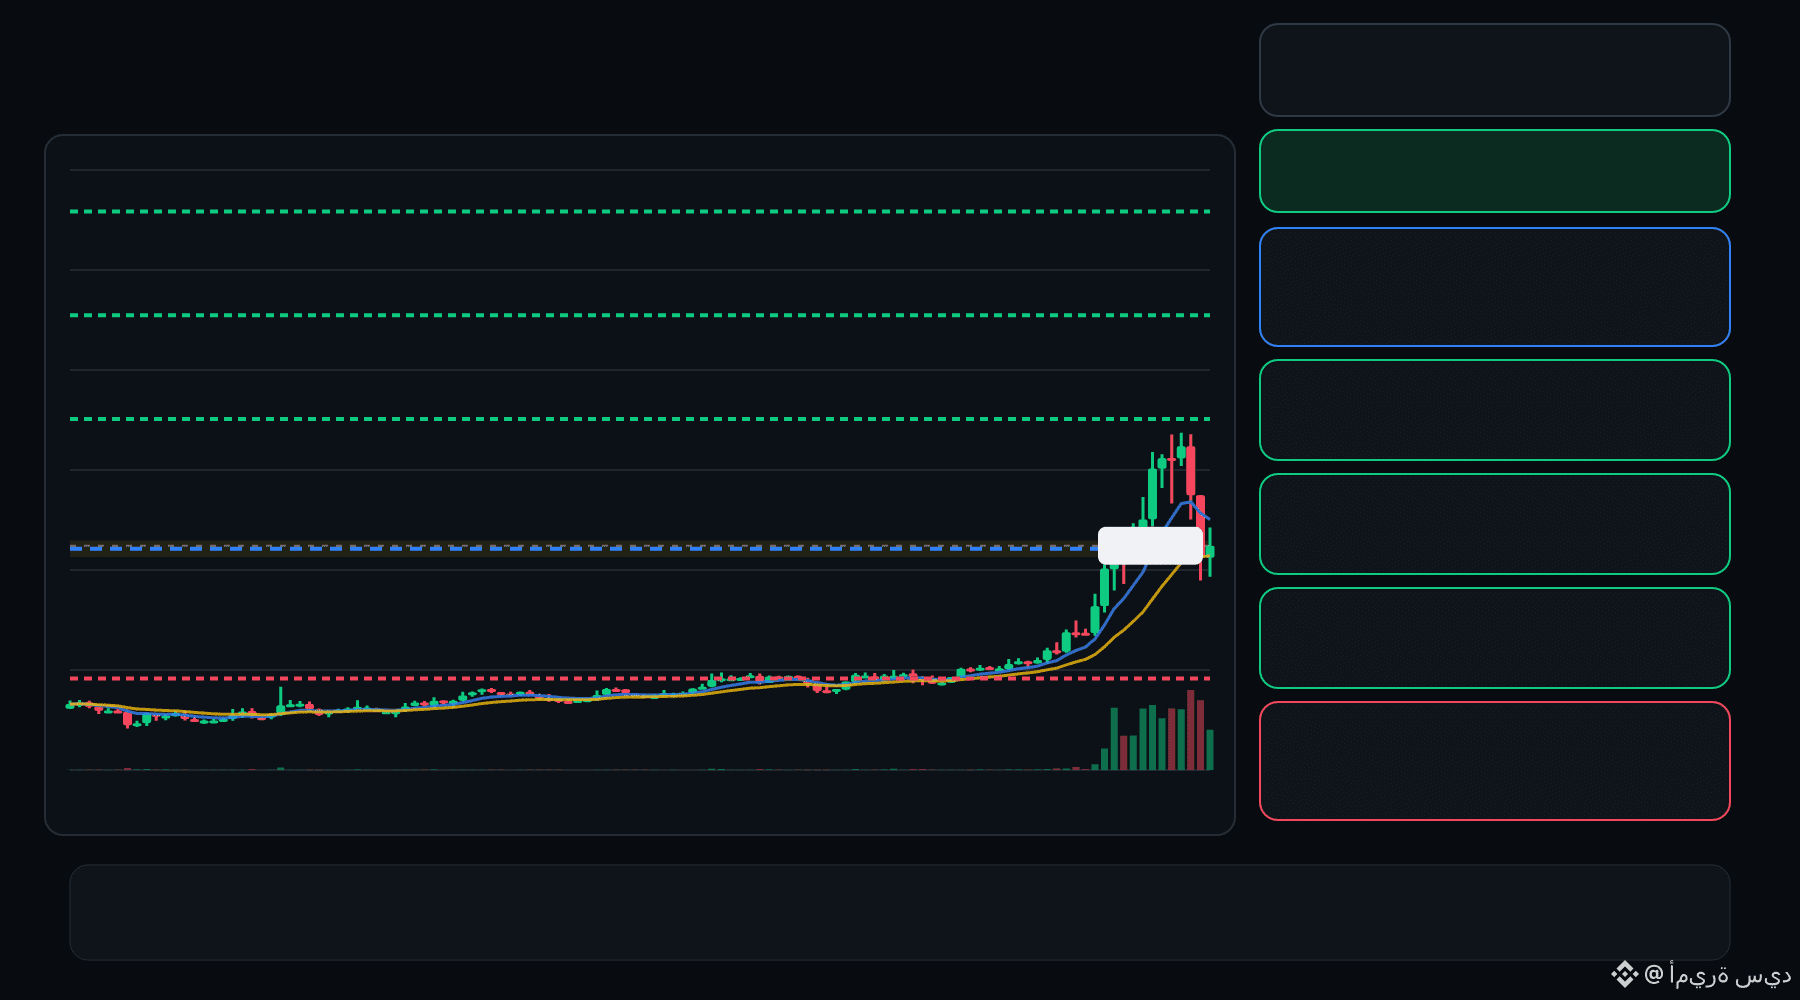
🟢 Los alcistas de AIOT están defendiendo el retroceso… ¿se está preparando una continuación? ⁉️
🟩 AIOT LONG
Entrada: 0.08326 – 0.08472
TP1: 0.09552
TP2: 0.1048
TP3: 0.1140
Stop Loss: 0.07245
El gráfico de 15M muestra una estructura alcista, con confirmación del impulso y el volumen. Una nueva prueba controlada de la zona de entrada podría ofrecer una señal de entrada más clara.
Plan: Espera confirmación/rechazo dentro de la zona de entrada; no persigas el movimiento.
Investiga por tu cuenta | Gestiona el riesgo | Evita un apalancamiento excesivo
·
--
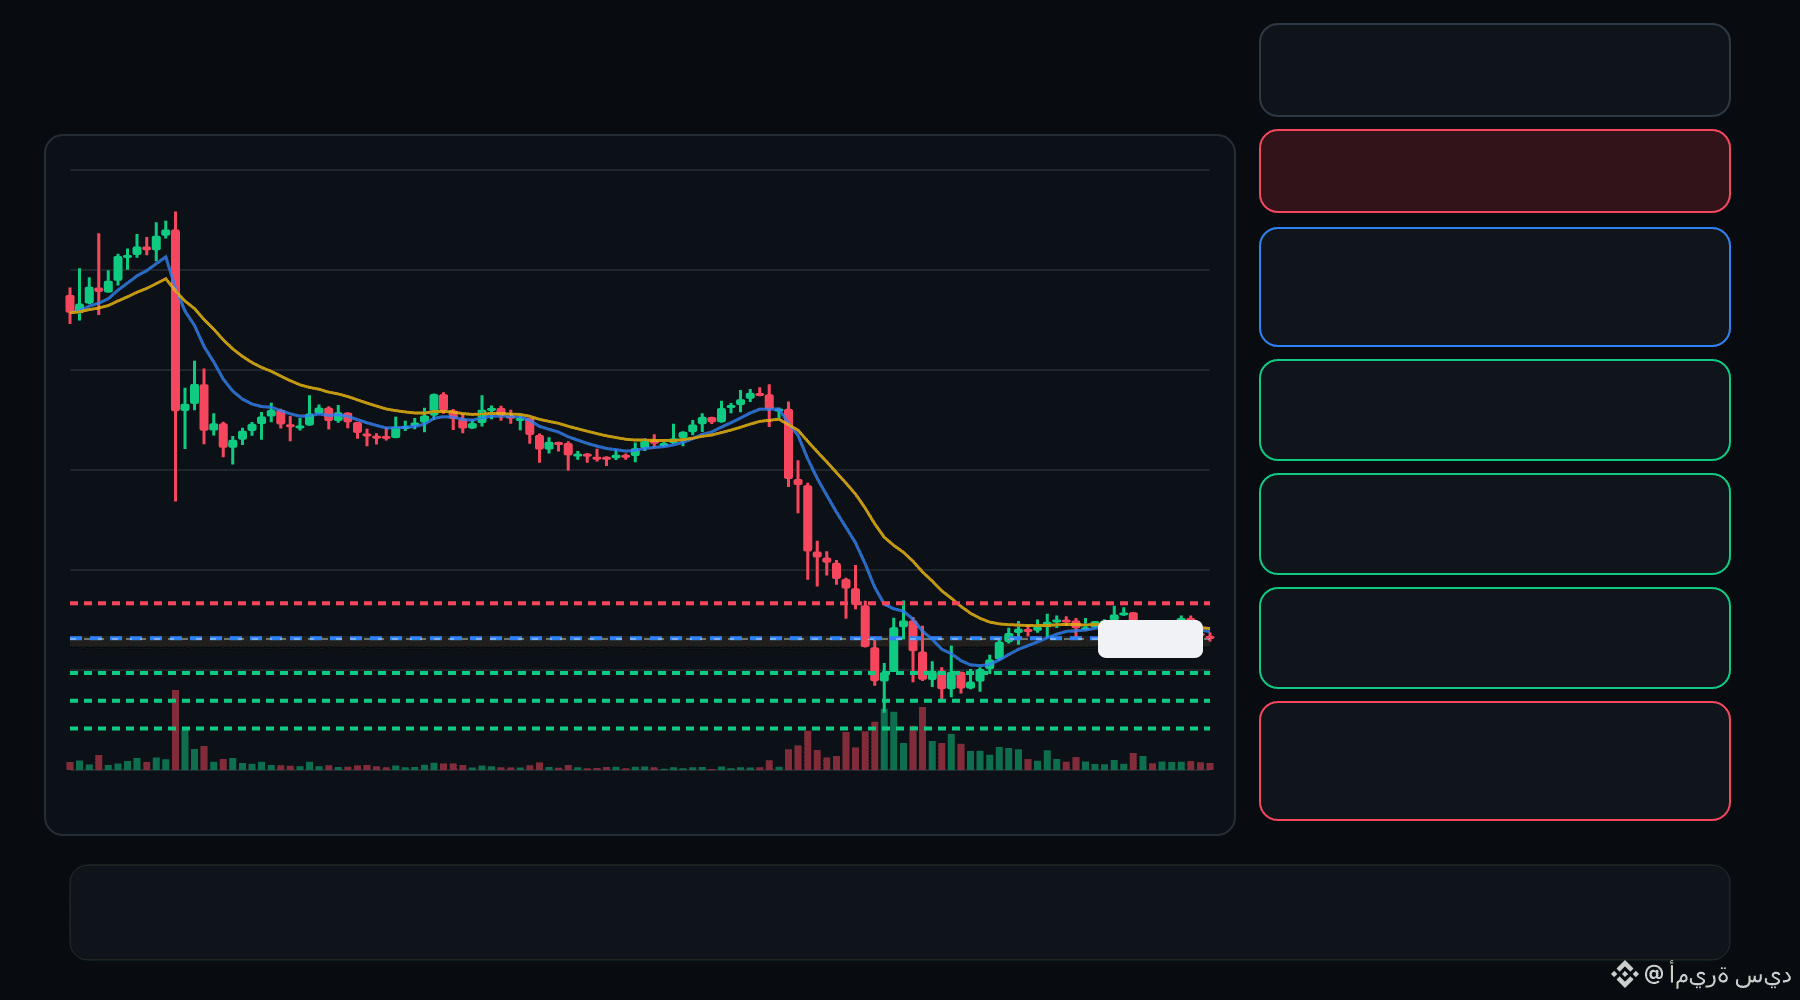
🔴 Los bajistas de Q están presionando el retroceso… ¿se está profundizando el rechazo ⁉️
🔴 Q CORTO
Entrada: 0.03146 – 0.03175
TP1: 0.02909
TP2: 0.02707
TP3: 0.02505
Stop Loss: 0.03412
El gráfico de 15M muestra una estructura bajista, confirmada por el impulso y el volumen. Un nuevo test controlado de la zona de entrada podría ofrecer una señal más clara para la operación.
Plan: Espera una confirmación/rechazo dentro de la zona de entrada; no persigas el movimiento.
Investiga por tu cuenta | Gestiona el riesgo | Evita un apalancamiento excesivo
3
·
--
Ver traducción
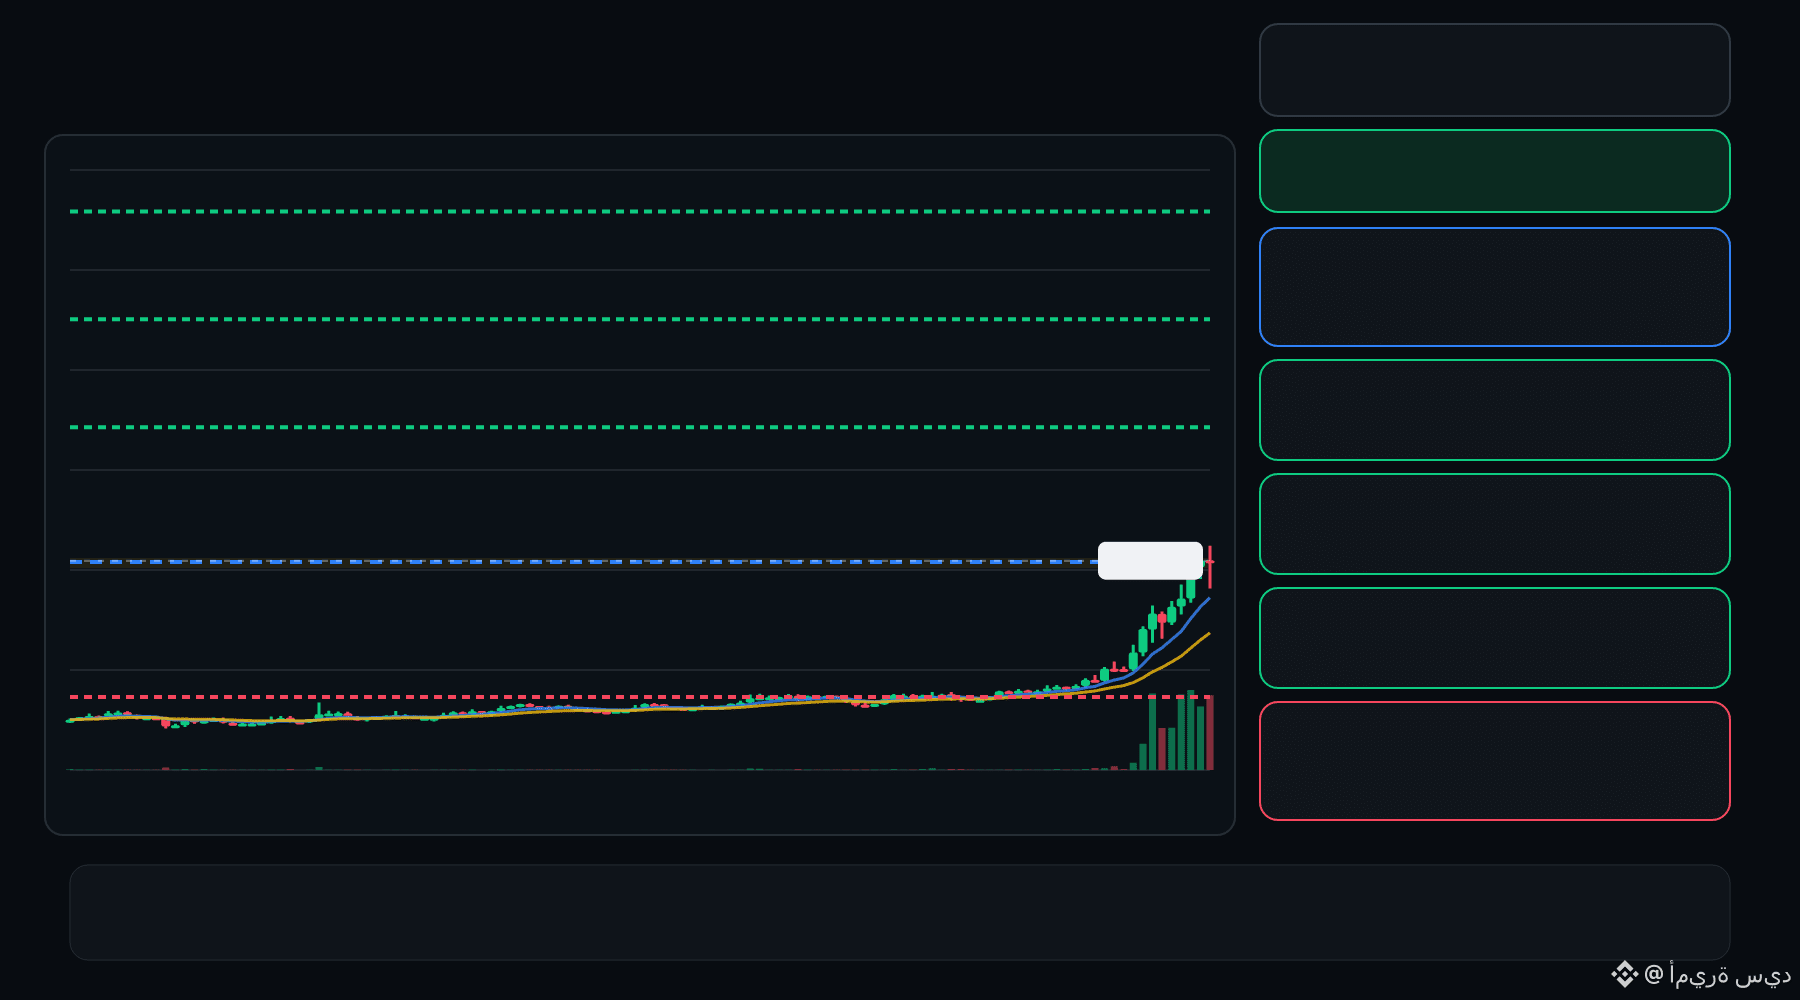
🟢 AIOT bulls are defending the pullback… is continuation setting up ⁉️
🟩 AIOT LONG
Entry: 0.09127 – 0.09235
TP1: 0.1111
TP2: 0.1265
TP3: 0.1420
Stop Loss: 0.07252
The 15M chart shows a bullish structure with momentum and volume confirmation. A controlled retest of the entry zone may give the setup a cleaner trigger.
Plan: Wait for confirmation/rejection inside the entry zone; don’t chase the move.
DYOR | Manage Risk | Avoid Over-Leverage
·
--
Ver traducción
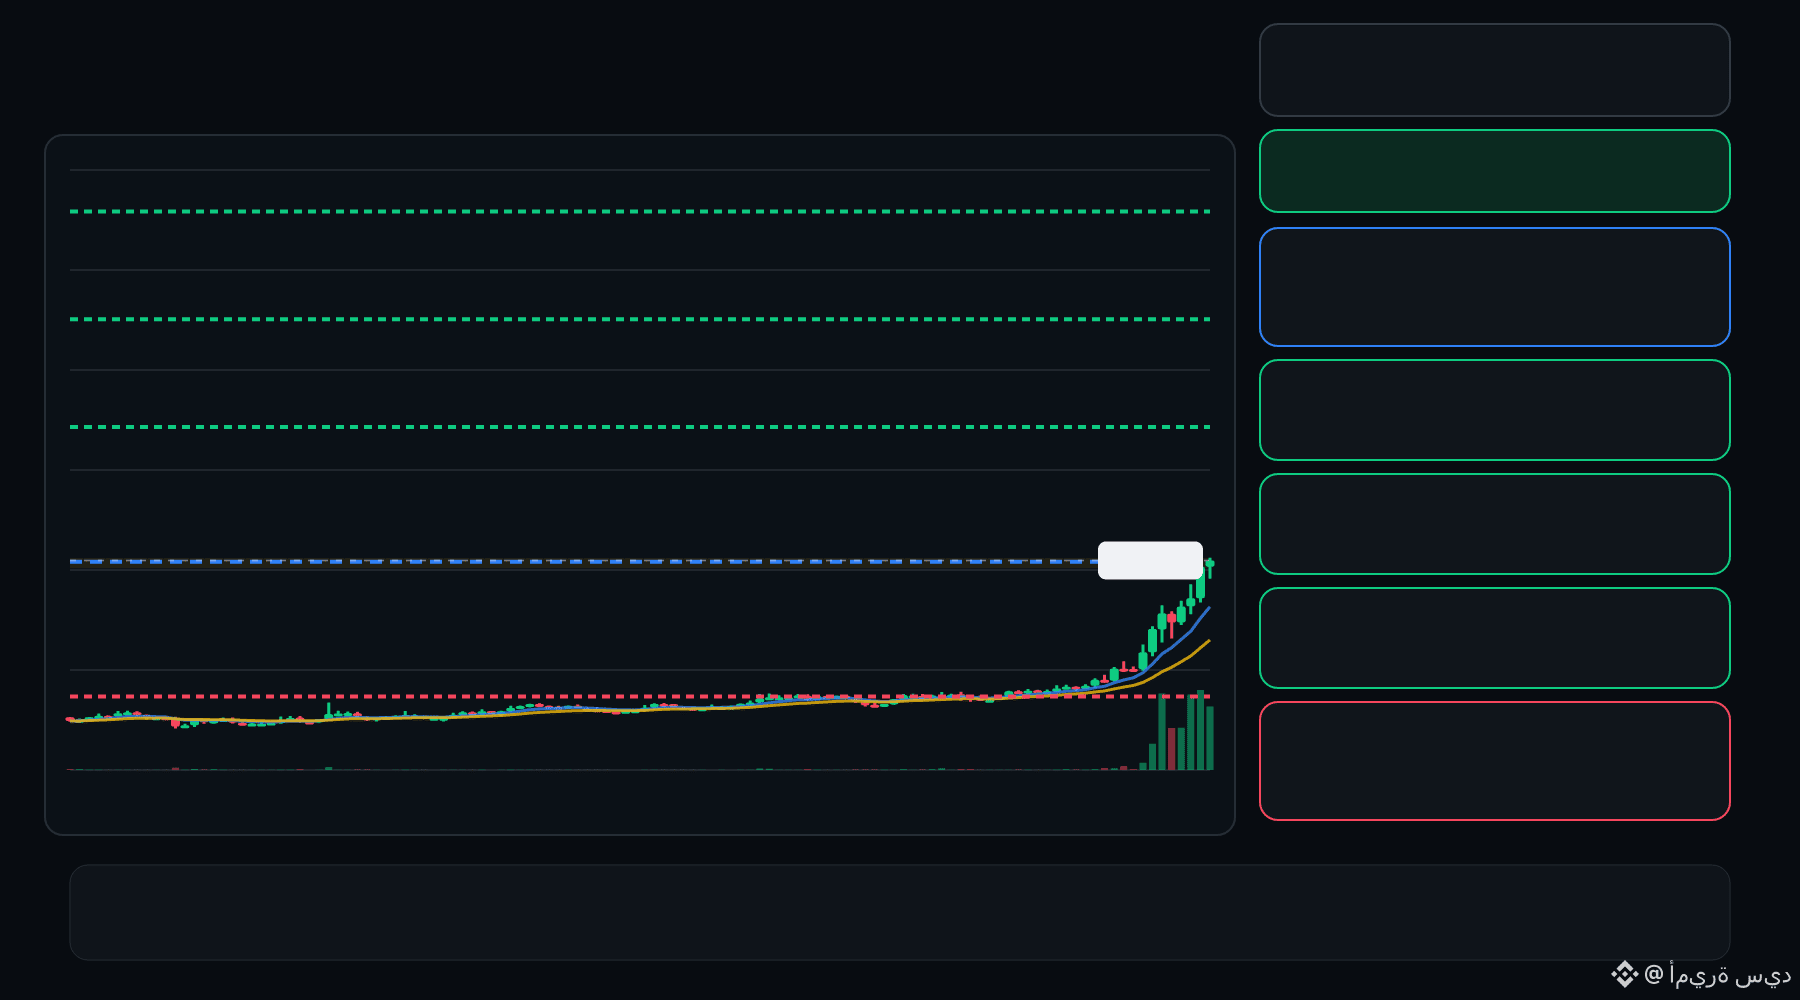
🟢 AIOT bulls are defending the pullback… is continuation setting up ⁉️
🟩 AIOT LONG
Entry: 0.09134 – 0.09230
TP1: 0.1110
TP2: 0.1264
TP3: 0.1418
Stop Loss: 0.07259
The 15M chart shows a bullish structure with momentum and volume confirmation. A controlled retest of the entry zone may give the setup a cleaner trigger.
Plan: Wait for confirmation/rejection inside the entry zone; don’t chase the move.
DYOR | Manage Risk | Avoid Over-Leverage
·
--
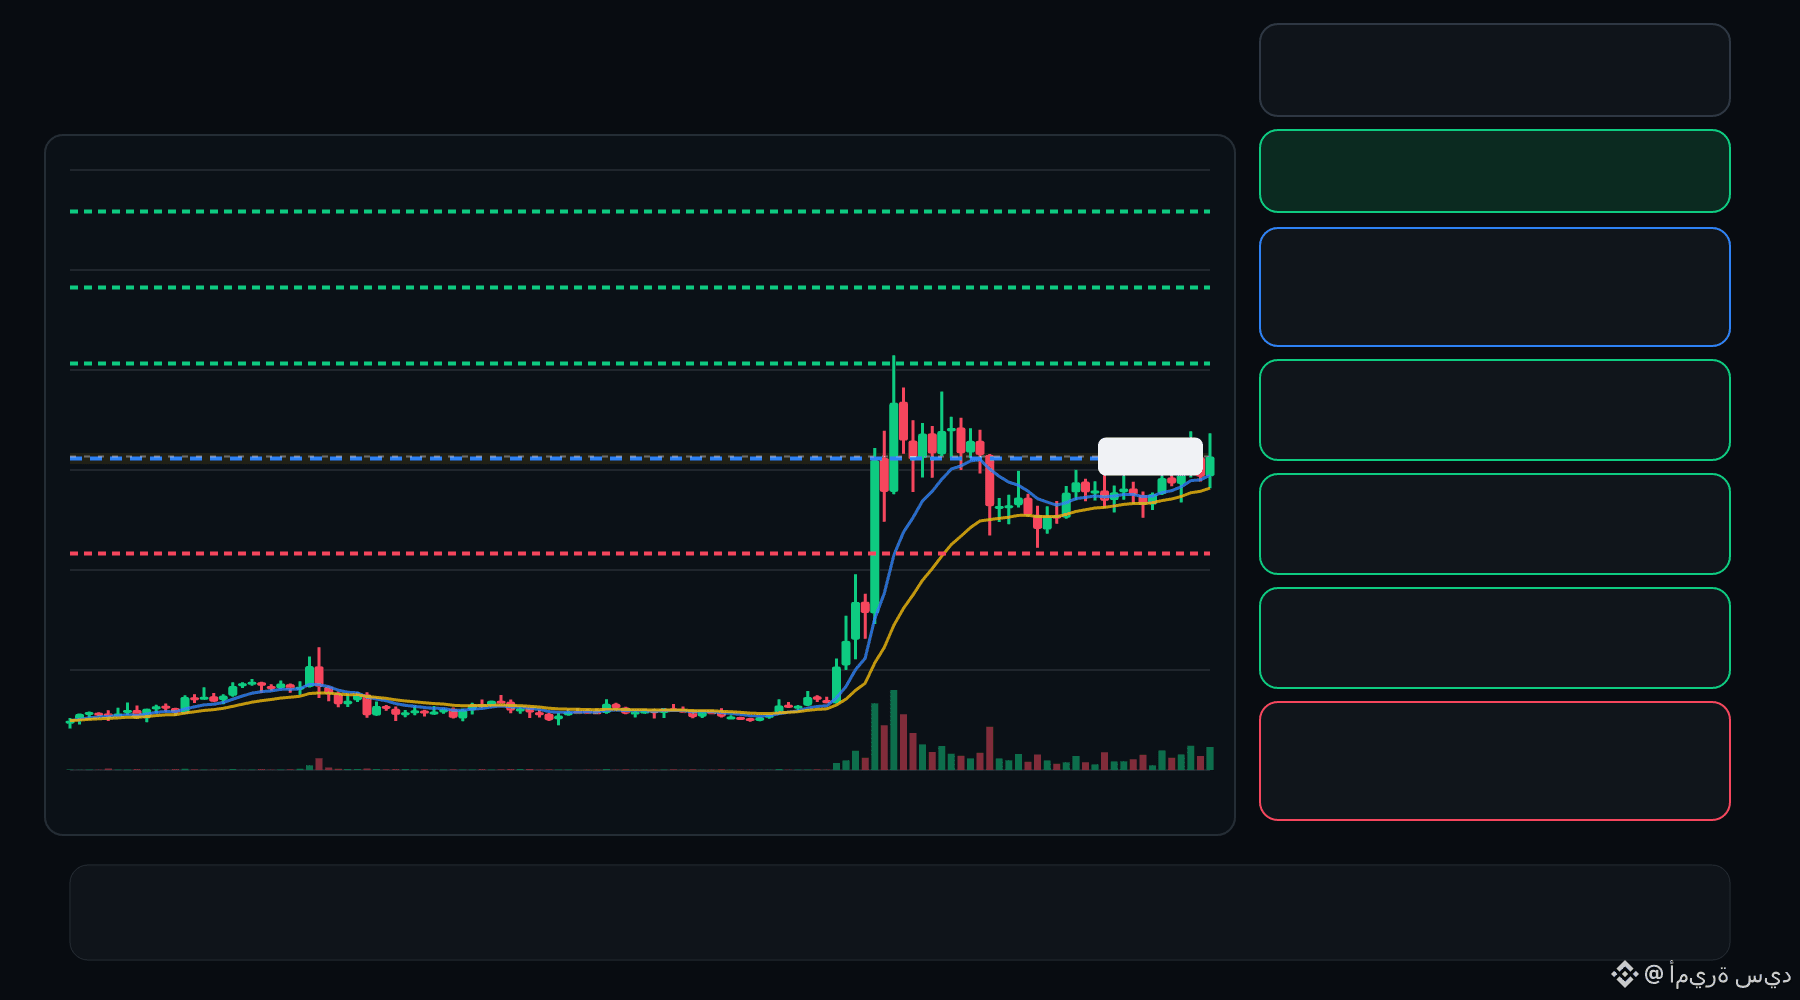
🟢 Los alcistas de WET están defendiendo el retroceso… ¿se está preparando la continuación? ⁉️
🟩 WET LARGO
Entrada: 0.06277 – 0.06322
Objetivo 1: 0.06705
Objetivo 2: 0.07030
Objetivo 3: 0.07355
Stop loss: 0.05894
El gráfico de 15M muestra una estructura alcista con confirmación del impulso y el volumen. Un nuevo test controlado de la zona de entrada podría dar una señal de entrada más clara.
Plan: Espera una confirmación/rechazo dentro de la zona de entrada; no persigas el movimiento.
Investiga por tu cuenta | Gestiona el riesgo | Evita un apalancamiento excesivo
1
·
--
Ver traducción
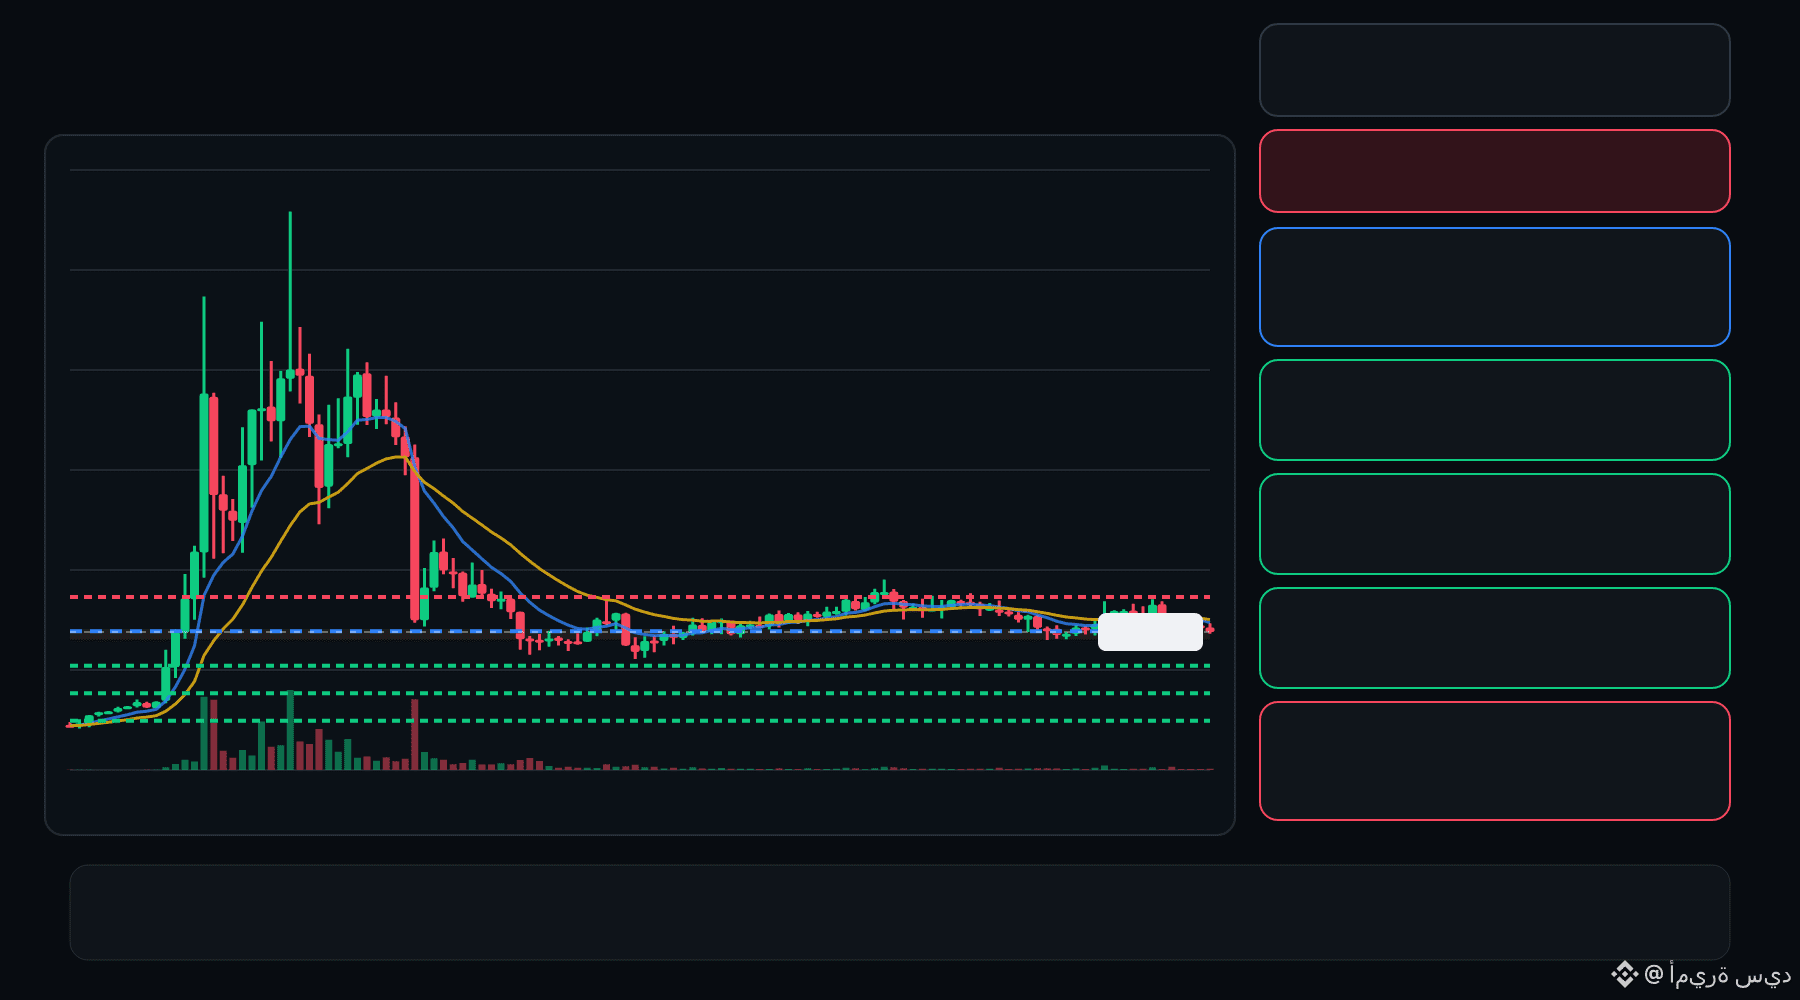
🔴 ALPINE bears are pressing the pullback… is the rejection getting deeper ⁉️
🔴 ALPINE SHORT
Entry: 0.2999 – 0.3009
TP1: 0.2922
TP2: 0.2857
TP3: 0.2792
Stop Loss: 0.3085
The 15M chart shows a bearish structure with momentum and volume confirmation. A controlled retest of the entry zone may give the setup a cleaner trigger.
Plan: Wait for confirmation/rejection inside the entry zone; don’t chase the move.
DYOR | Manage Risk | Avoid Over-Leverage
·
--
Ver traducción
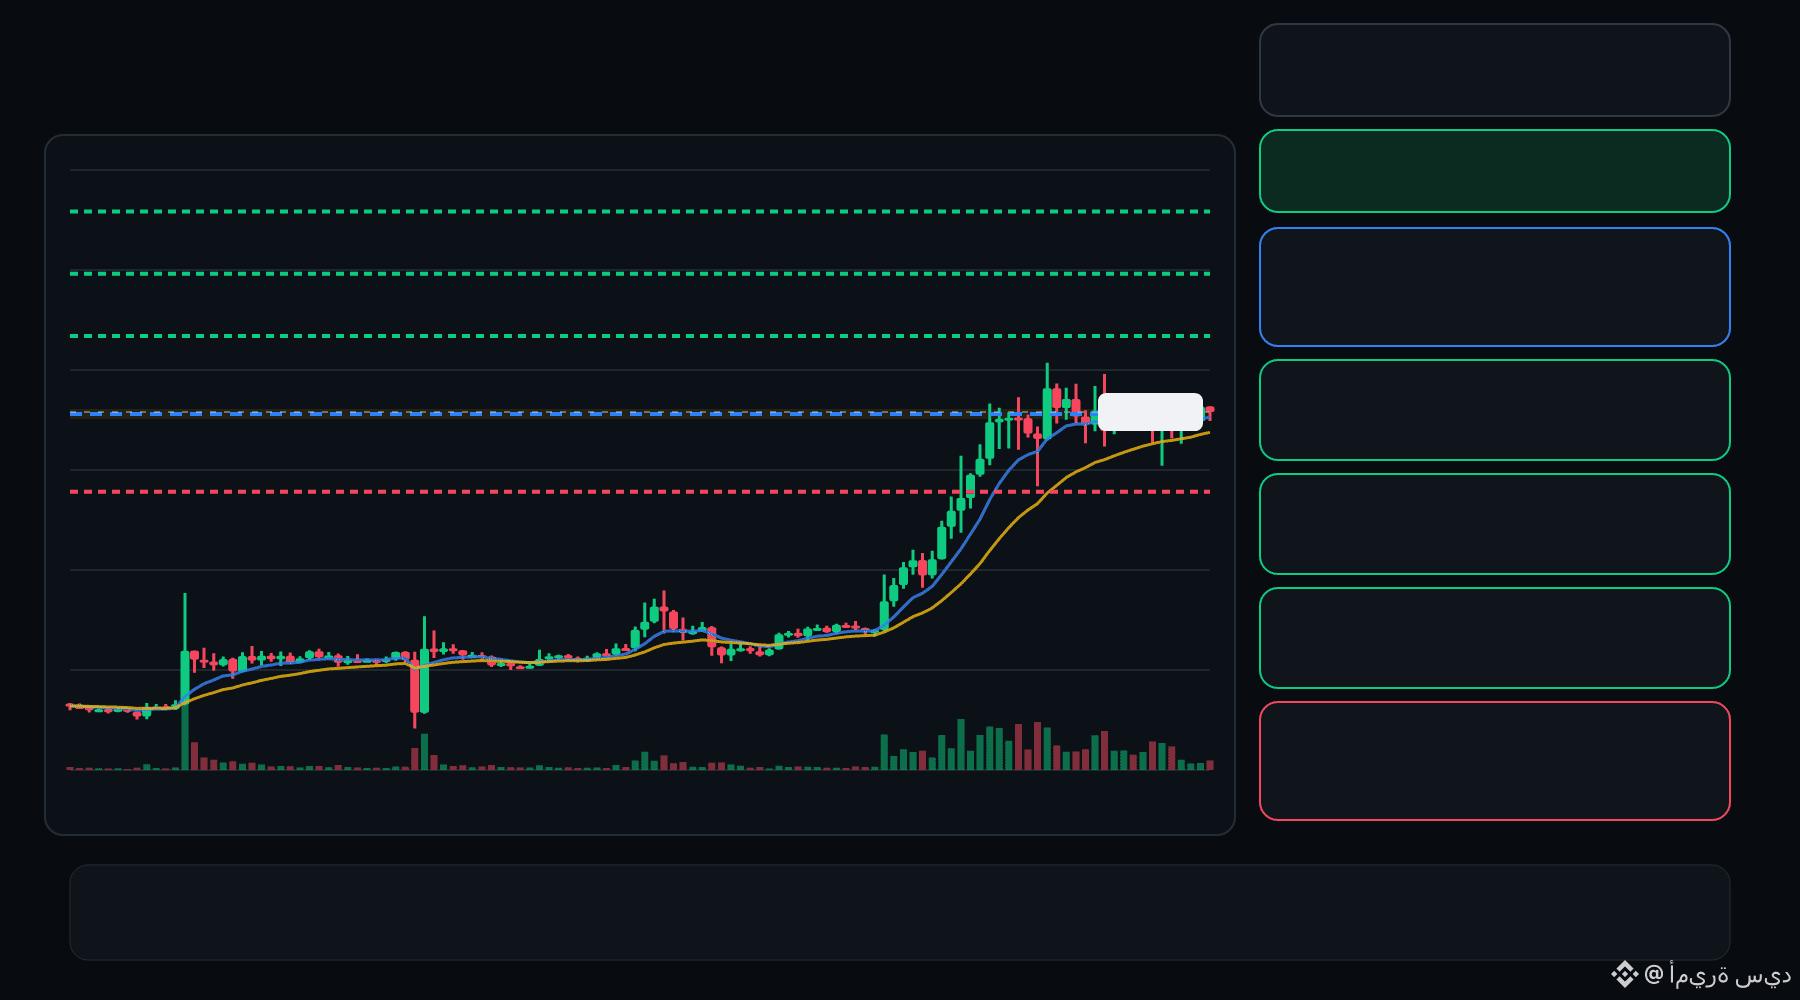
🟢 AIN bulls are defending the pullback… is continuation setting up ⁉️
🟩 AIN LONG
Entry: 0.2694 – 0.2735
TP1: 0.3038
TP2: 0.3297
TP3: 0.3556
Stop Loss: 0.2390
The 15M chart shows a bullish structure with momentum and volume confirmation. A controlled retest of the entry zone may give the setup a cleaner trigger.
Plan: Wait for confirmation/rejection inside the entry zone; don’t chase the move.
DYOR | Manage Risk | Avoid Over-Leverage
2
·
--
Ver traducción
🟢 BIRB bulls are defending the pullback… is continuation setting up ⁉️
🟩 BIRB LONG
Entry: 0.09015 – 0.09098
TP1: 0.09728
TP2: 0.1026
TP3: 0.1080
Stop Loss: 0.08385
The 15M chart shows a bullish structure with momentum and volume confirmation. A controlled retest of the entry zone may give the setup a cleaner trigger.
Plan: Wait for confirmation/rejection inside the entry zone; don’t chase the move.
DYOR | Manage Risk | Avoid Over-Leverage
1
·
--
Ver traducción
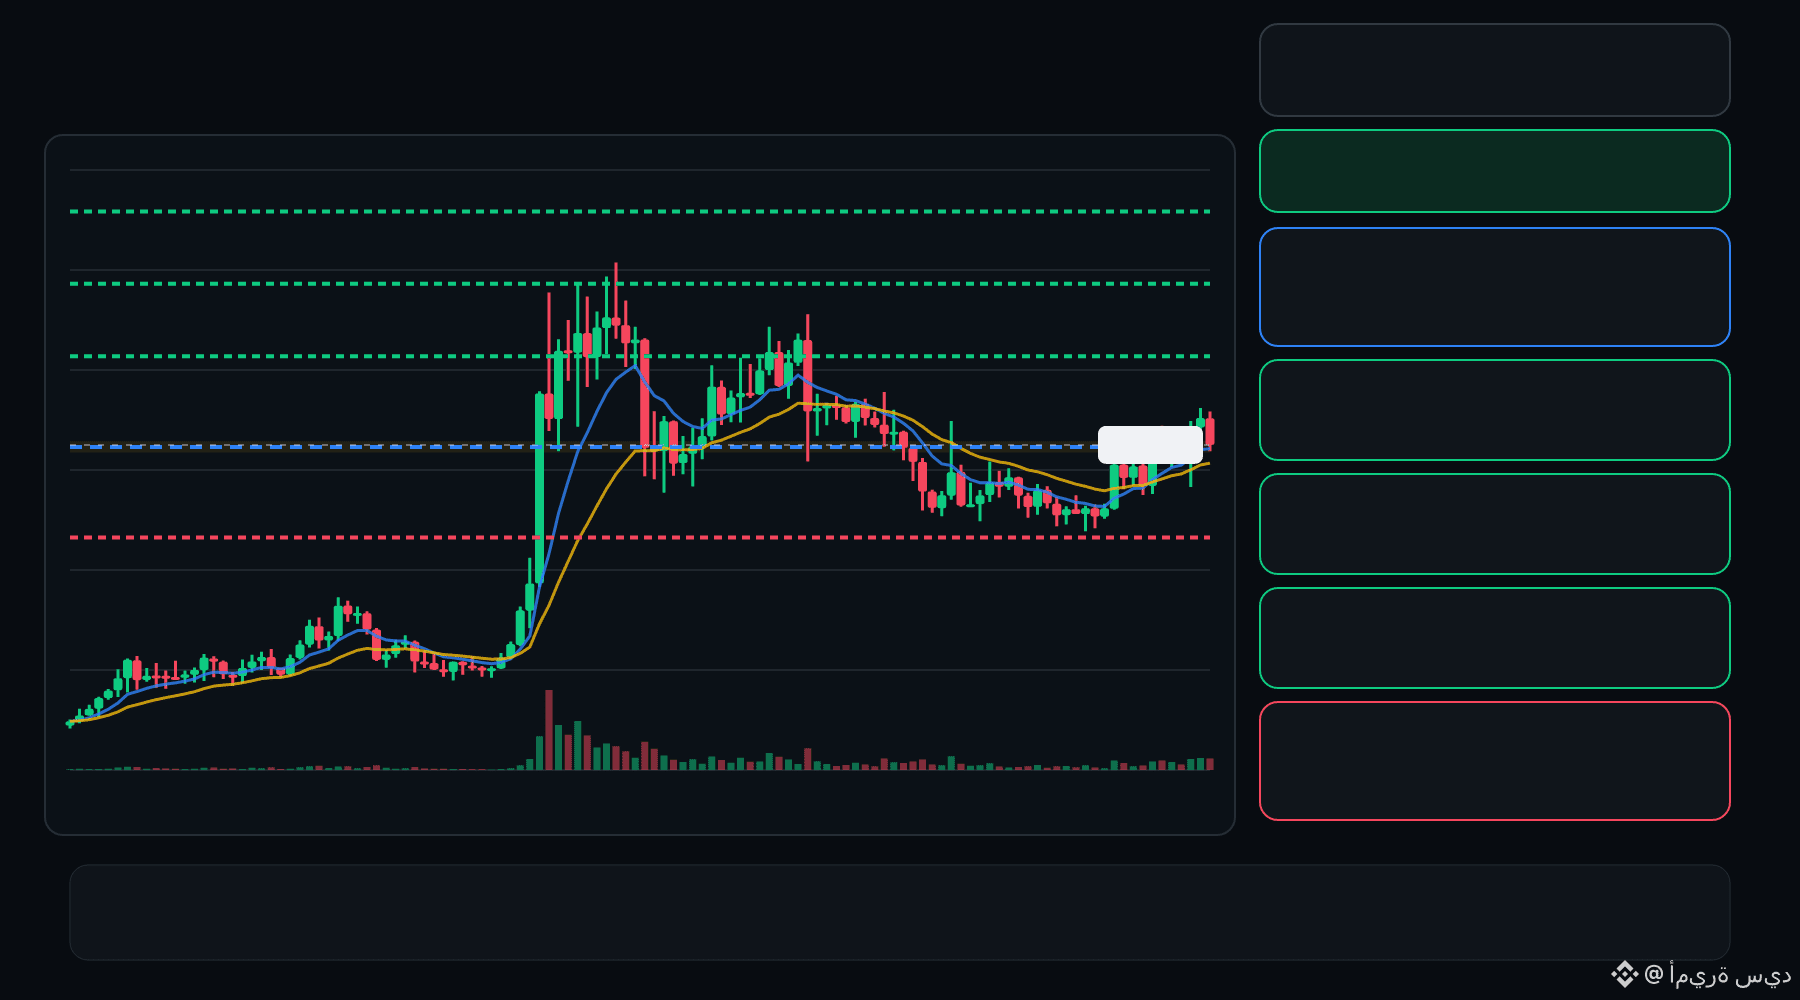
🔴 BLESS bears are pressing the pullback… is the rejection getting deeper ⁉️
🔴 BLESS SHORT
Entry: 0.009885 – 0.009963
TP1: 0.008988
TP2: 0.008240
TP3: 0.007492
Stop Loss: 0.01086
The 15M chart shows a bearish structure with momentum and volume confirmation. A controlled retest of the entry zone may give the setup a cleaner trigger.
Plan: Wait for confirmation/rejection inside the entry zone; don’t chase the move.
DYOR | Manage Risk | Avoid Over-Leverage
·
--
Ver traducción
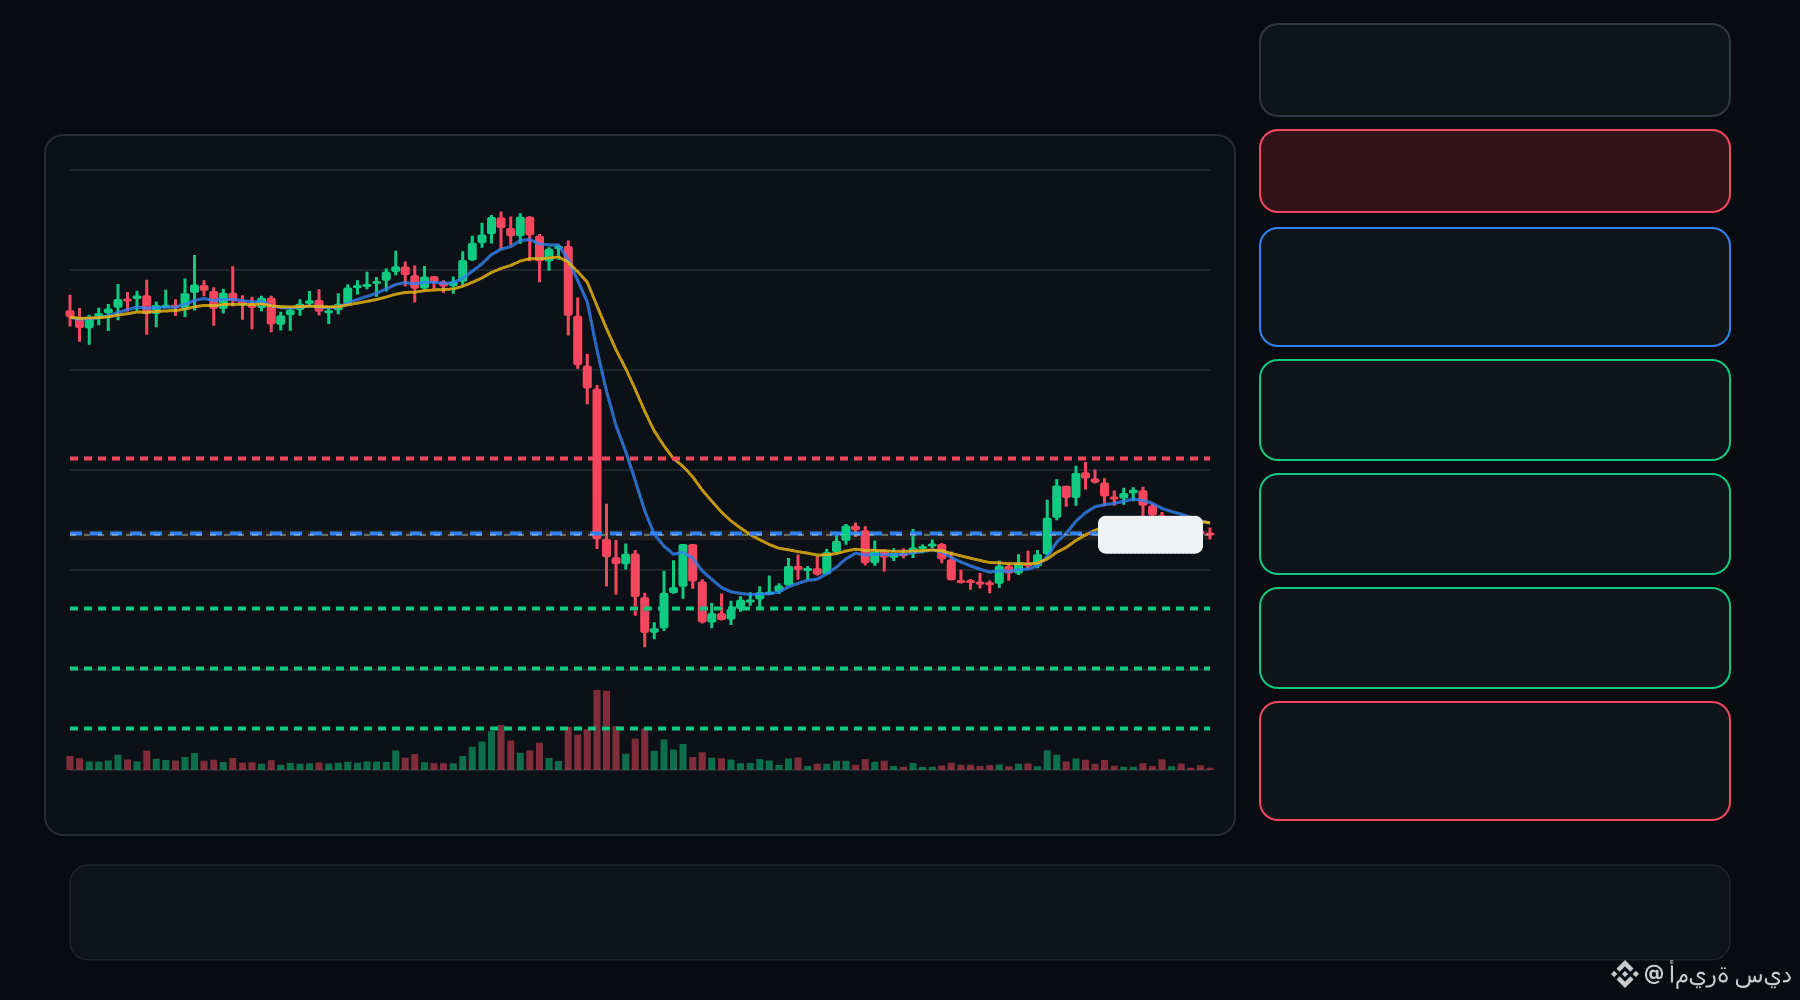
🟢 GWEI bulls are defending the pullback… is continuation setting up ⁉️
🟩 GWEI LONG
Entry: 0.02272 – 0.02288
TP1: 0.02438
TP2: 0.02565
TP3: 0.02691
Stop Loss: 0.02122
The 15M chart shows a bullish structure with momentum and volume confirmation. A controlled retest of the entry zone may give the setup a cleaner trigger.
Plan: Wait for confirmation/rejection inside the entry zone; don’t chase the move.
DYOR | Manage Risk | Avoid Over-Leverage
·
--
Ver traducción
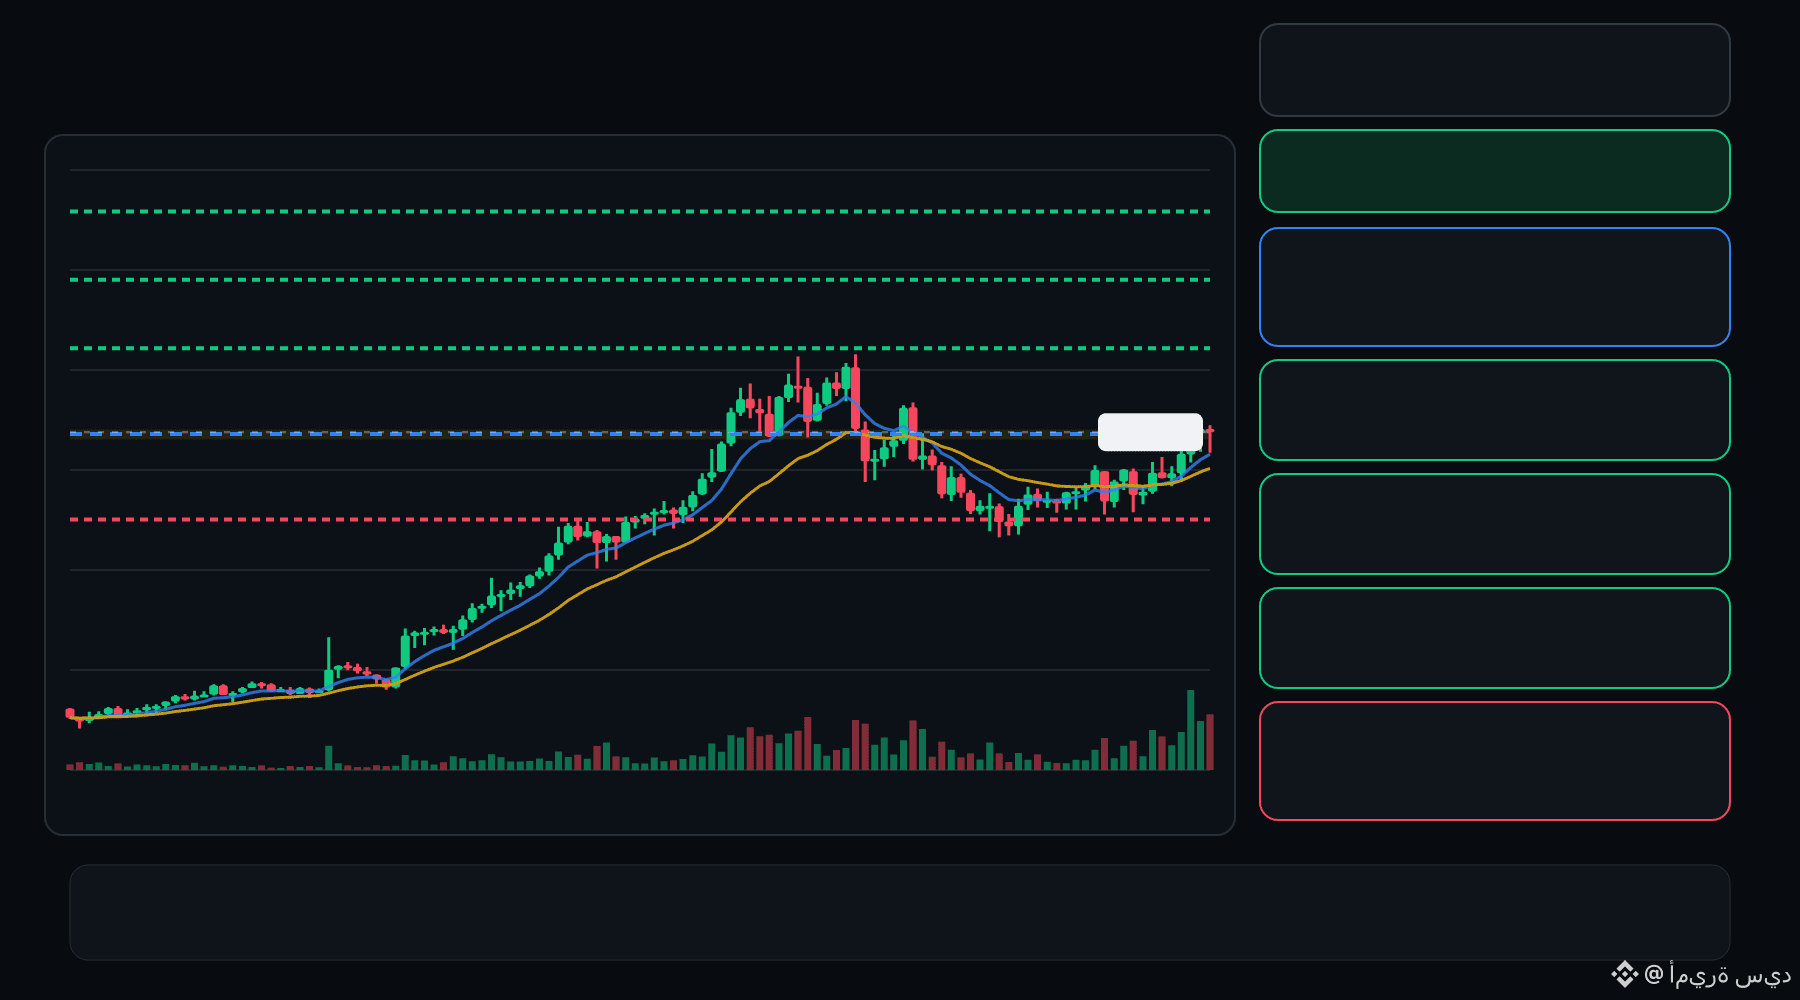
🟢 SLP bulls are defending the pullback… is continuation setting up ⁉️
🟩 SLP LONG
Entry: 0.0005468 – 0.0005516
TP1: 0.0005957
TP2: 0.0006329
TP3: 0.0006701
Stop Loss: 0.0005027
The 15M chart shows a bullish structure with momentum and volume confirmation. A controlled retest of the entry zone may give the setup a cleaner trigger.
Plan: Wait for confirmation/rejection inside the entry zone; don’t chase the move.
DYOR | Manage Risk | Avoid Over-Leverage
3
·
--
Ver traducción
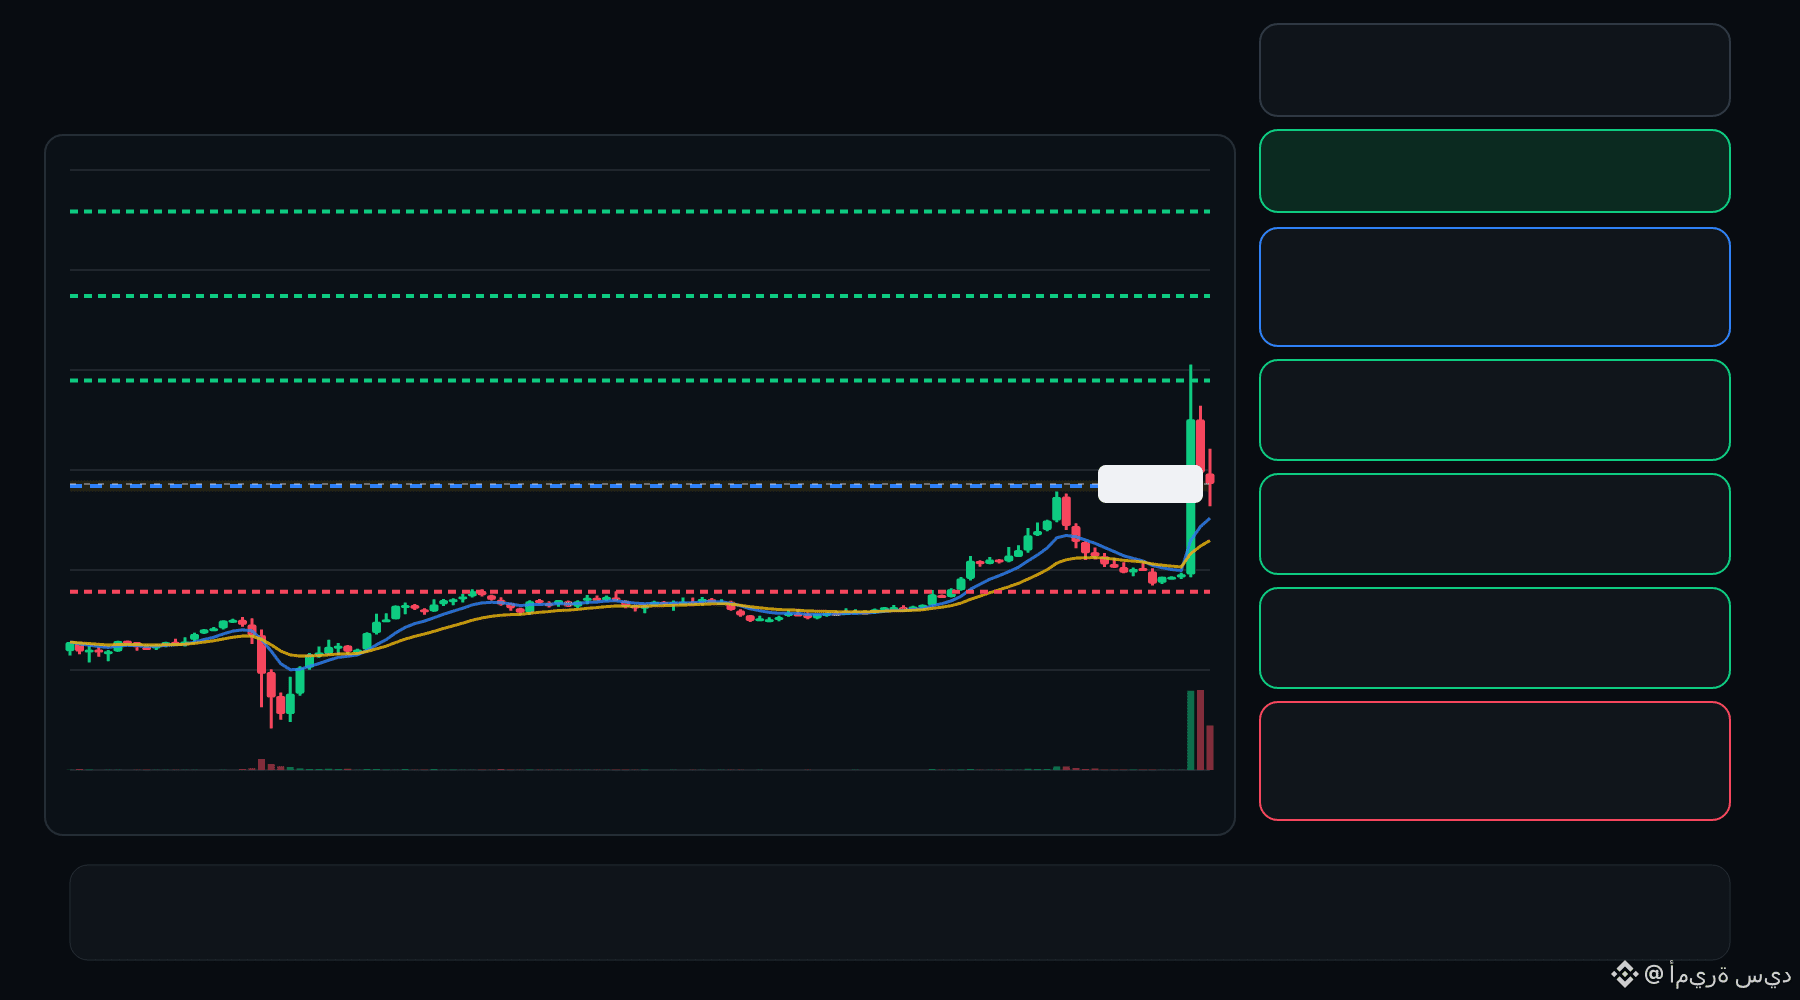
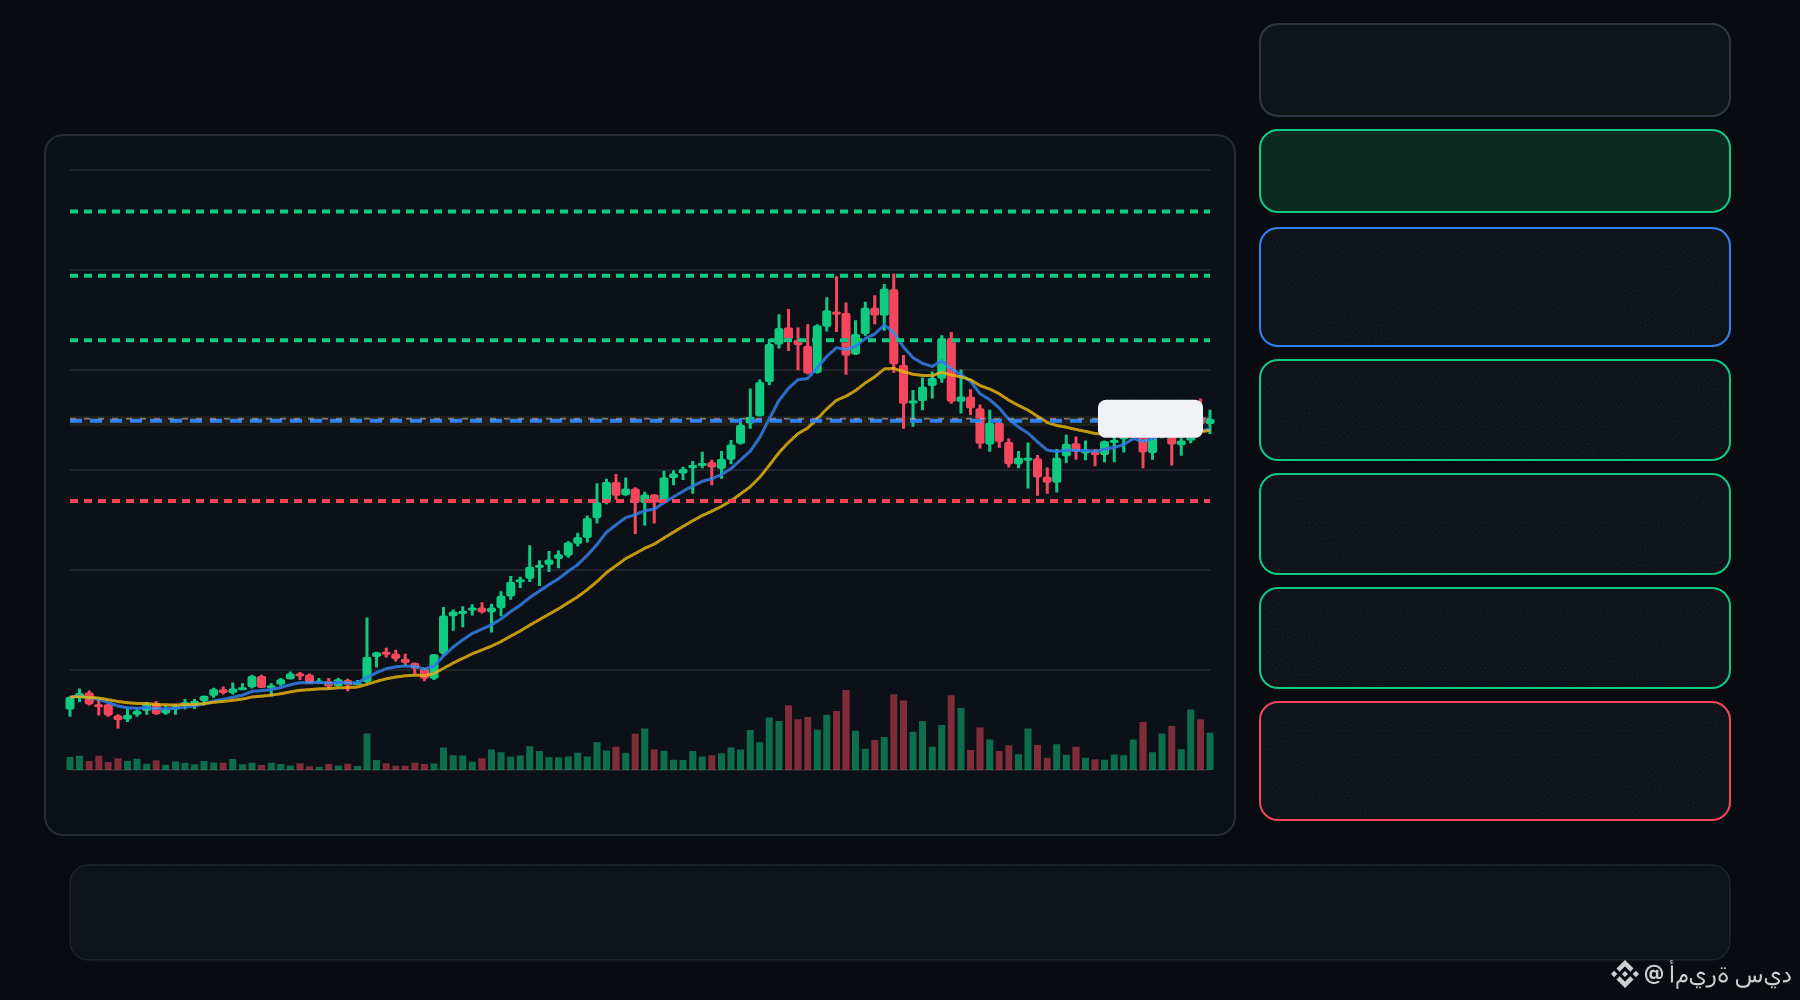
🟢 GWEI bulls are defending the pullback… is continuation setting up ⁉️
🟩 GWEI LONG
Entry: 0.02196 – 0.02210
TP1: 0.02326
TP2: 0.02424
TP3: 0.02521
Stop Loss: 0.02081
The 15M chart shows a bullish structure with momentum and volume confirmation. A controlled retest of the entry zone may give the setup a cleaner trigger.
Plan: Wait for confirmation/rejection inside the entry zone; don’t chase the move.
DYOR | Manage Risk | Avoid Over-Leverage
·
--
Ver traducción
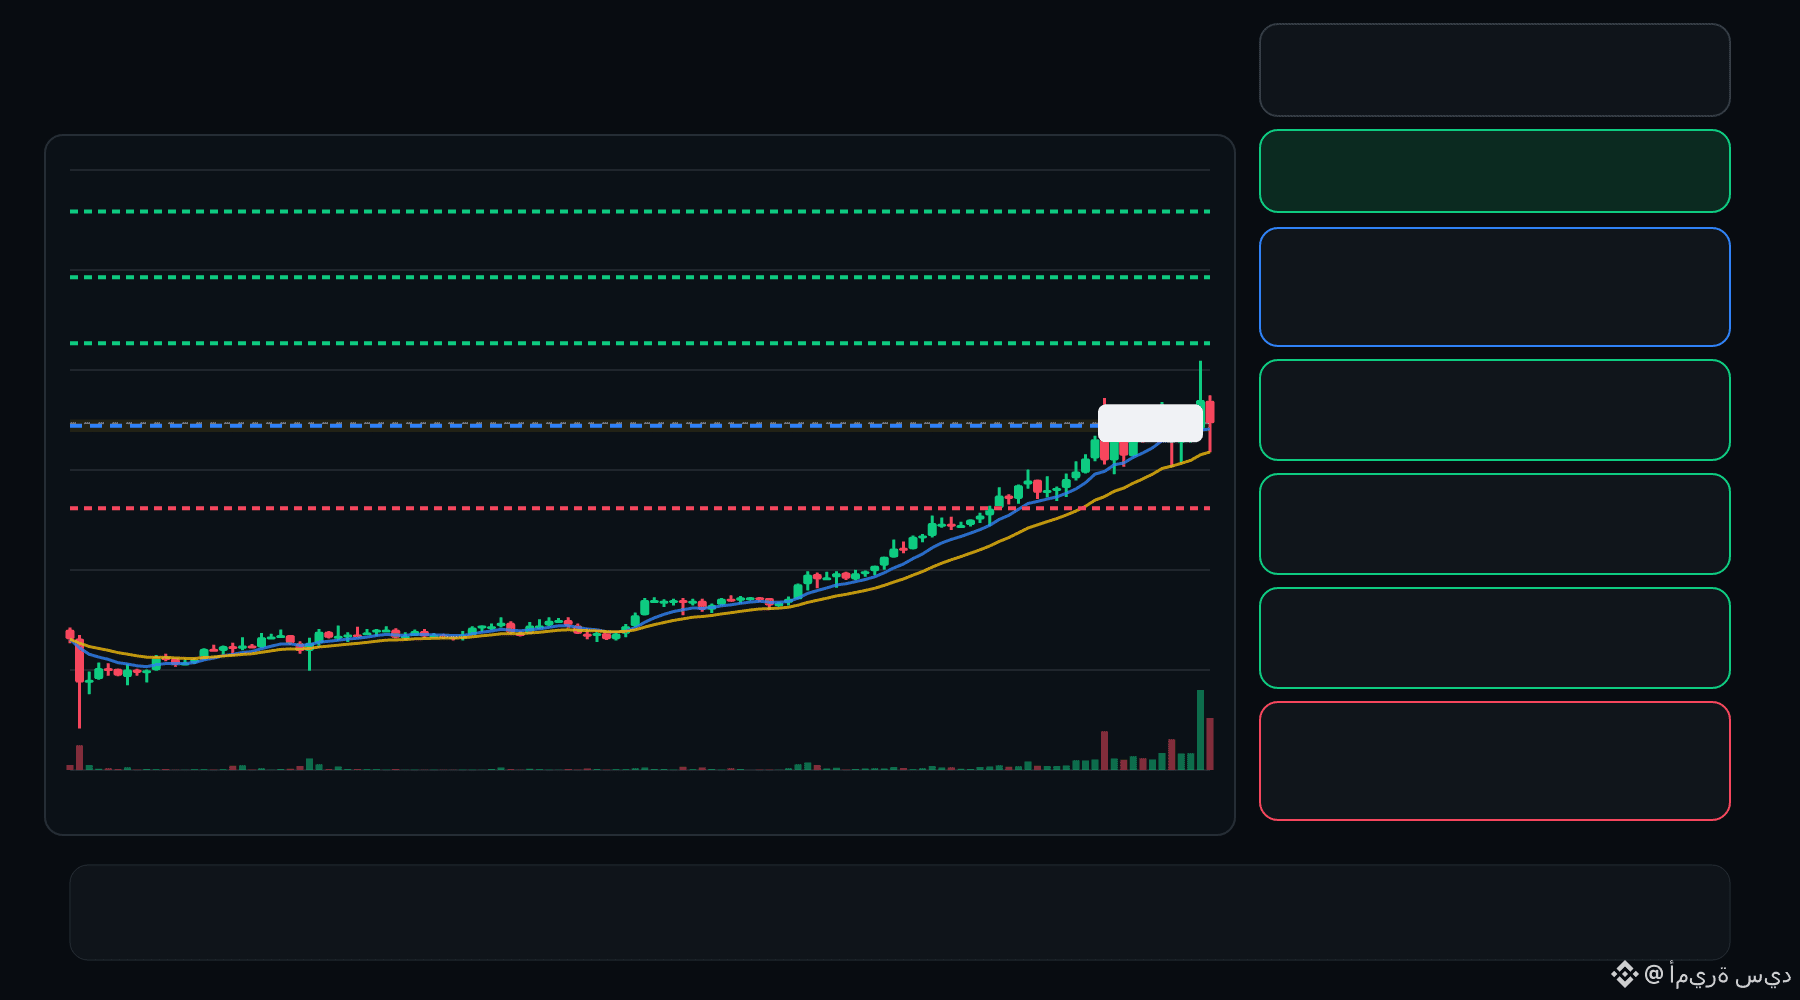
🟢 SPK bulls are defending the pullback… is continuation setting up ⁉️
🟩 SPK LONG
Entry: 0.02006 – 0.02025
TP1: 0.02135
TP2: 0.02231
TP3: 0.02327
Stop Loss: 0.01896
The 15M chart shows a bullish structure with momentum and volume confirmation. A controlled retest of the entry zone may give the setup a cleaner trigger.
Plan: Wait for confirmation/rejection inside the entry zone; don’t chase the move.
DYOR | Manage Risk | Avoid Over-Leverage
·
--
Ver traducción
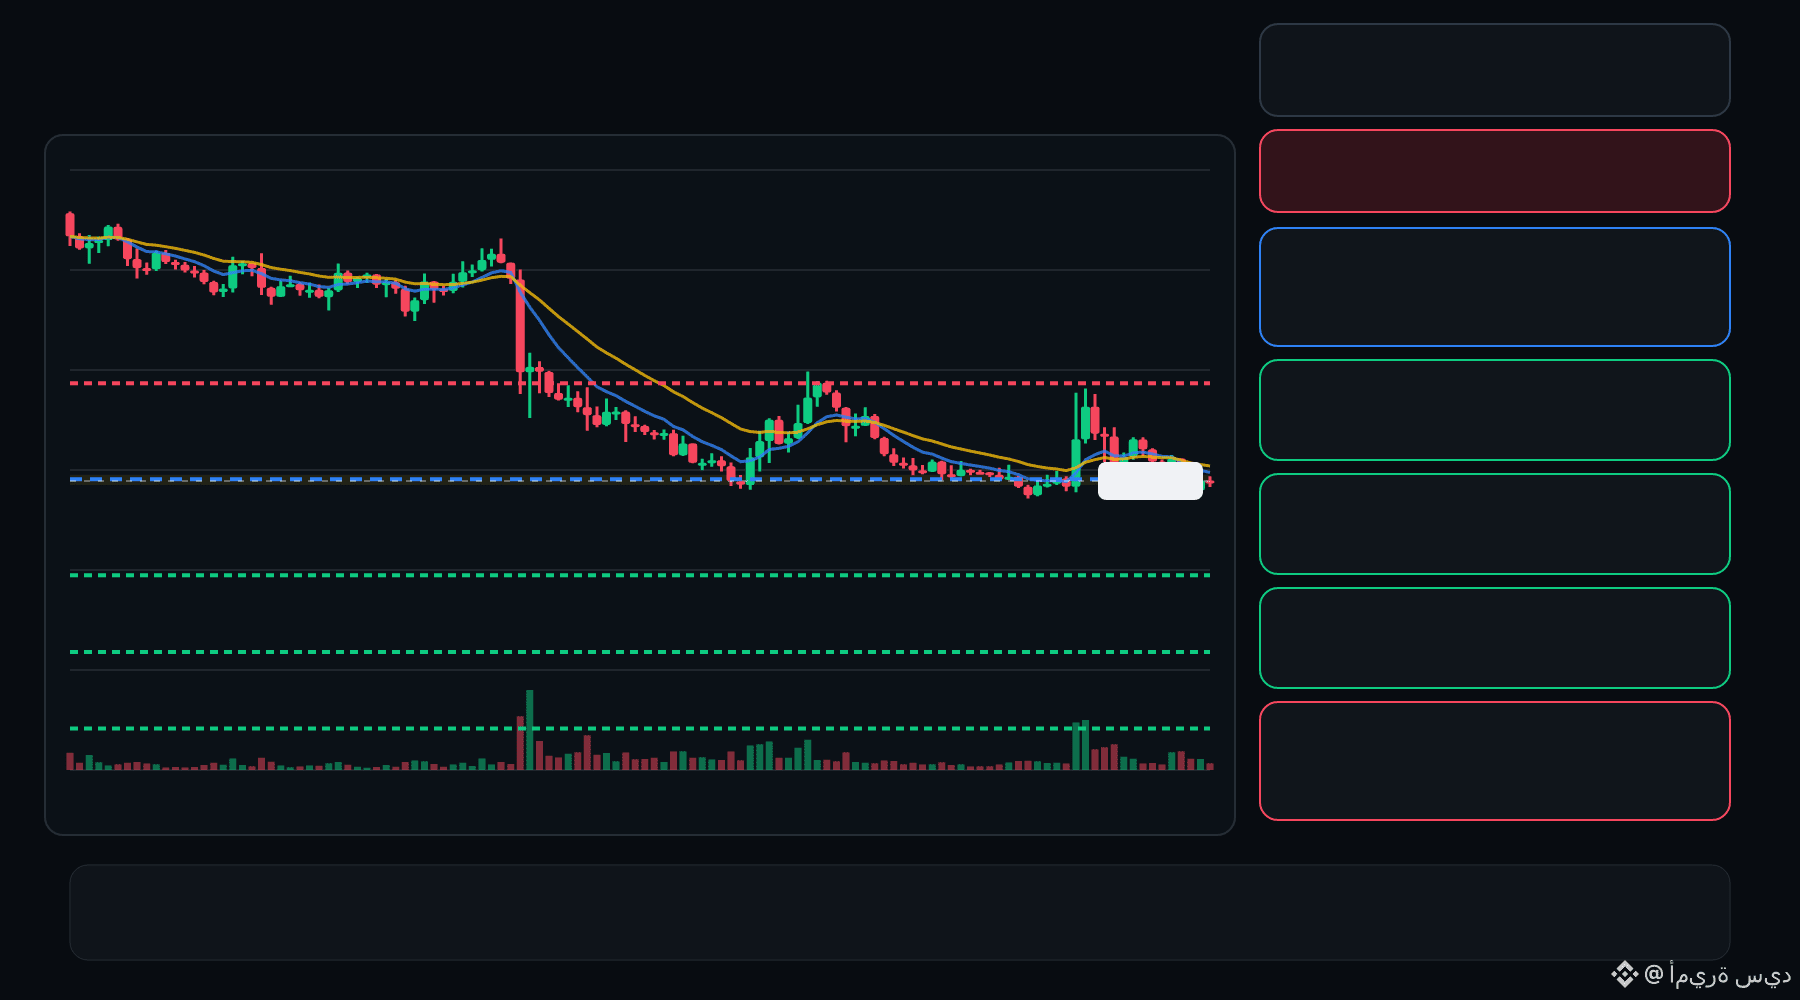
🔴 BTW bears are pressing the pullback… is the rejection getting deeper ⁉️
🔴 BTW SHORT
Entry: 1.129 – 1.145
TP1: 0.9686
TP2: 0.8338
TP3: 0.6990
Stop Loss: 1.306
The 15M chart shows a bearish structure with momentum and volume confirmation. A controlled retest of the entry zone may give the setup a cleaner trigger.
Plan: Wait for confirmation/rejection inside the entry zone; don’t chase the move.
DYOR | Manage Risk | Avoid Over-Leverage
9
·
--
Ver traducción
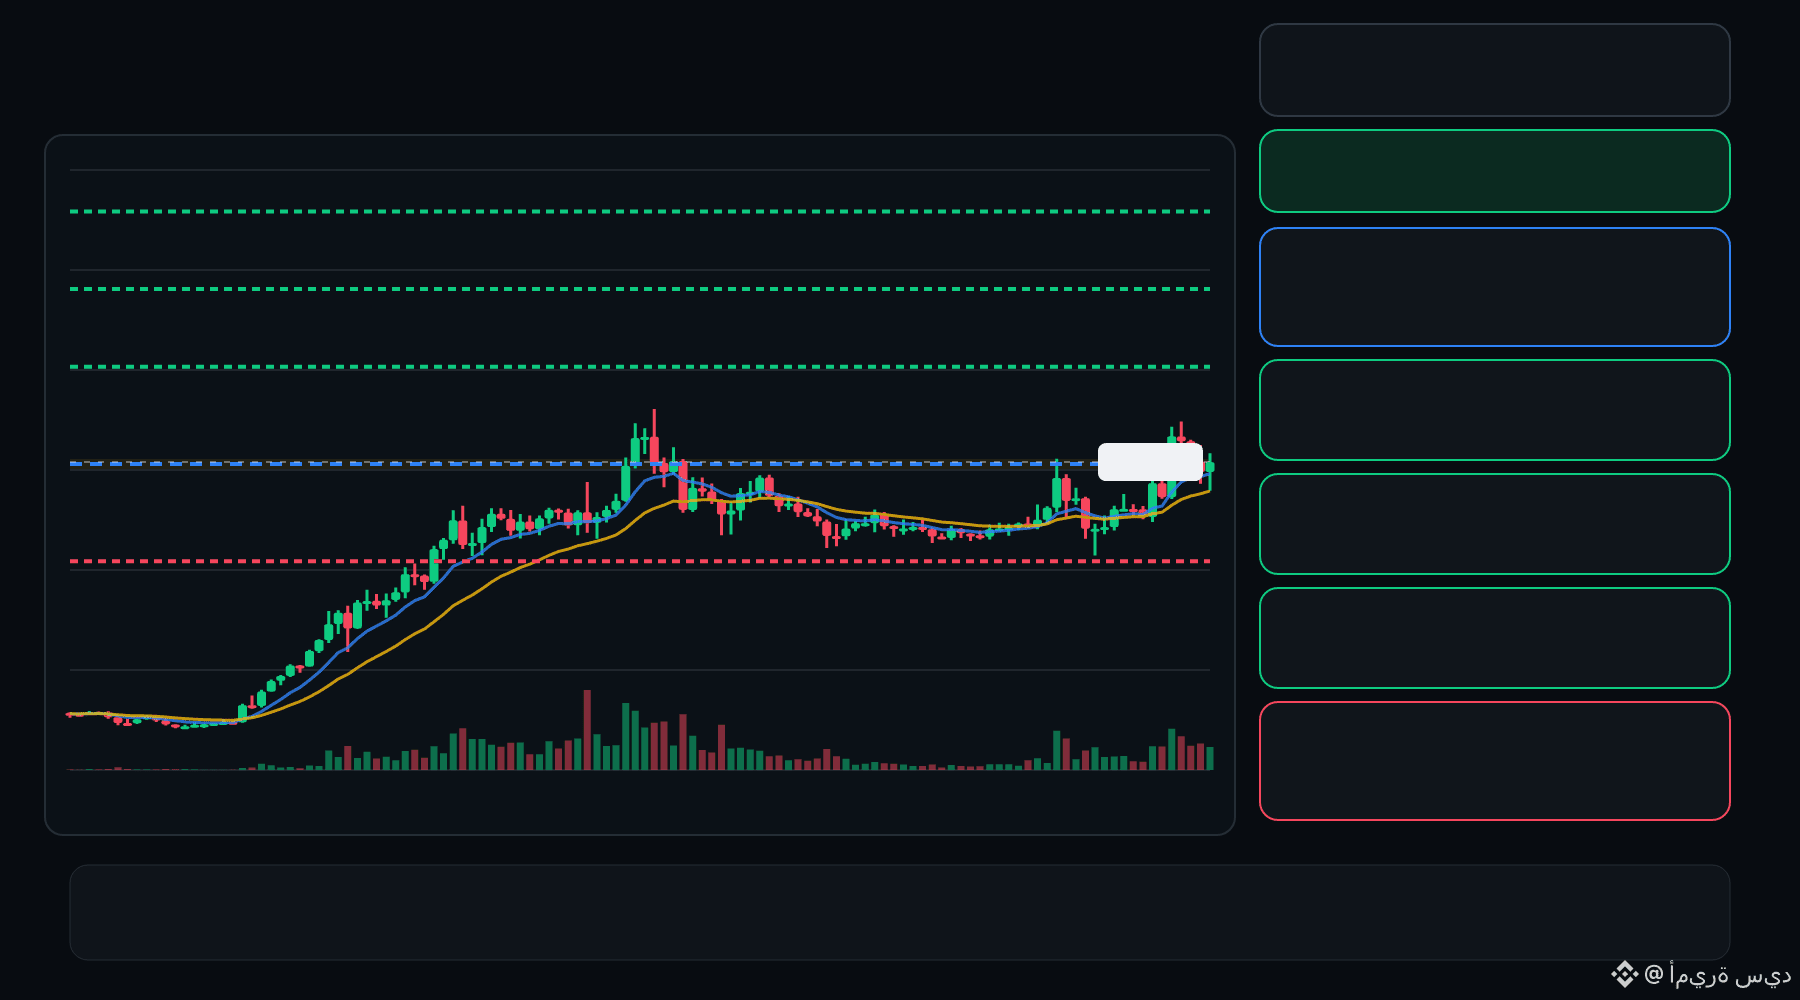
🟢 BEAMX bulls are defending the pullback… is continuation setting up ⁉️
🟩 BEAMX LONG
Entry: 0.005018 – 0.005088
TP1: 0.005724
TP2: 0.006261
TP3: 0.006798
Stop Loss: 0.004382
The 15M chart shows a bullish structure with momentum and volume confirmation. A controlled retest of the entry zone may give the setup a cleaner trigger.
Plan: Wait for confirmation/rejection inside the entry zone; don’t chase the move.
DYOR | Manage Risk | Avoid Over-Leverage
2
·
--
Ver traducción
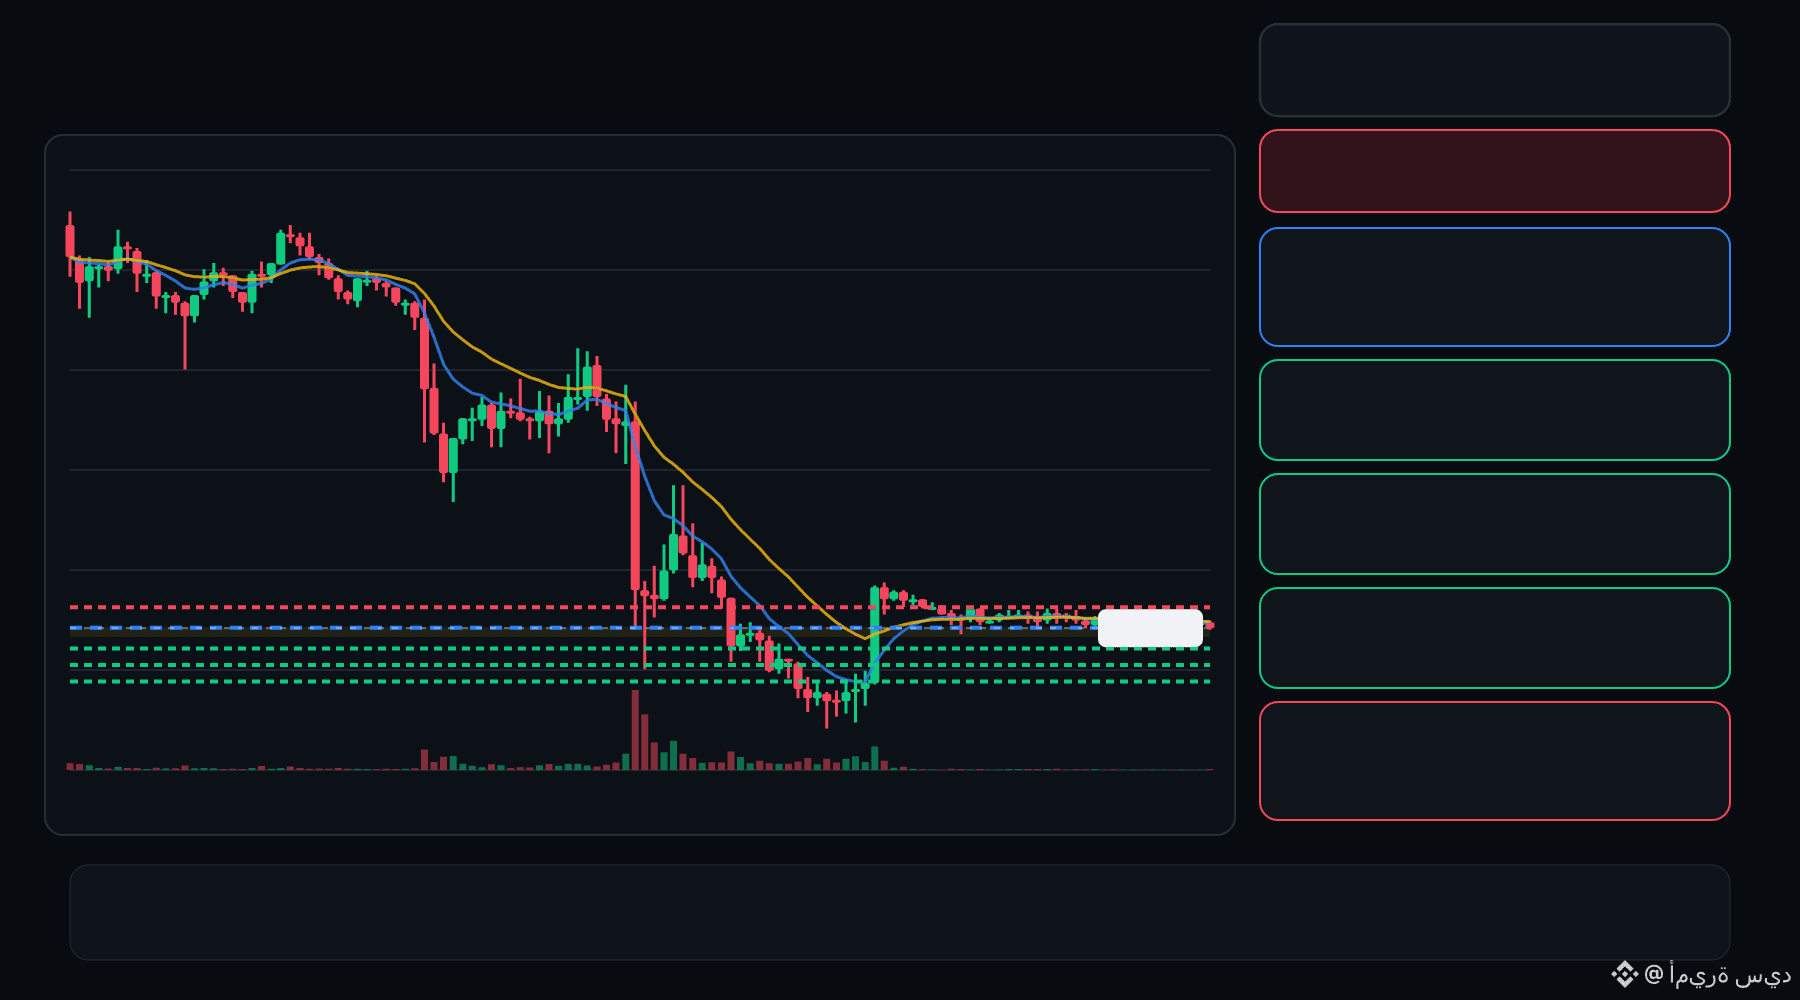
🔴 INTW bears are pressing the pullback… is the rejection getting deeper ⁉️
🔴 INTW SHORT
Entry: 7.265 – 7.280
TP1: 7.137
TP2: 7.029
TP3: 6.920
Stop Loss: 7.408
The 15M chart shows a bearish structure with momentum and volume confirmation. A controlled retest of the entry zone may give the setup a cleaner trigger.
Plan: Wait for confirmation/rejection inside the entry zone; don’t chase the move.
DYOR | Manage Risk | Avoid Over-Leverage
1
·
--
Ver traducción
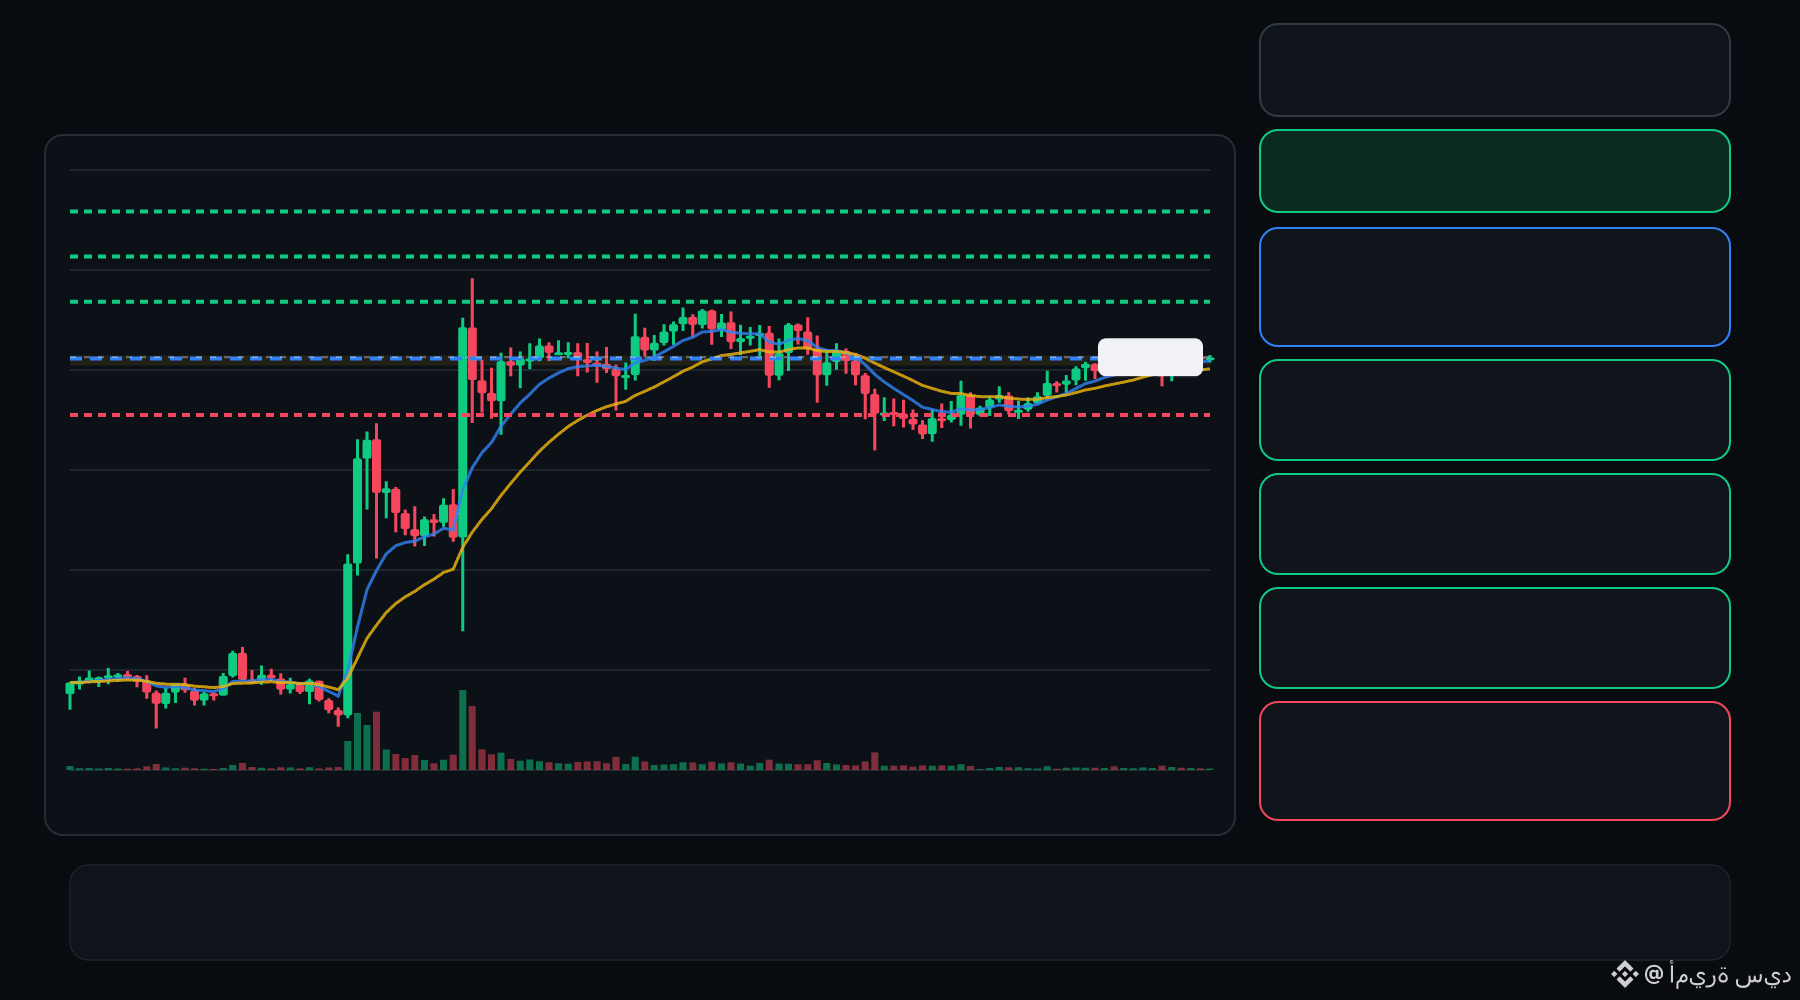
🟢 MAGMA bulls are defending the pullback… is continuation setting up ⁉️
🟩 MAGMA LONG
Entry: 0.3741 – 0.3756
TP1: 0.3895
TP2: 0.4012
TP3: 0.4130
Stop Loss: 0.3601
The 15M chart shows a bullish structure with momentum and volume confirmation. A controlled retest of the entry zone may give the setup a cleaner trigger.
Plan: Wait for confirmation/rejection inside the entry zone; don’t chase the move.
DYOR | Manage Risk | Avoid Over-Leverage
·
--
Ver traducción
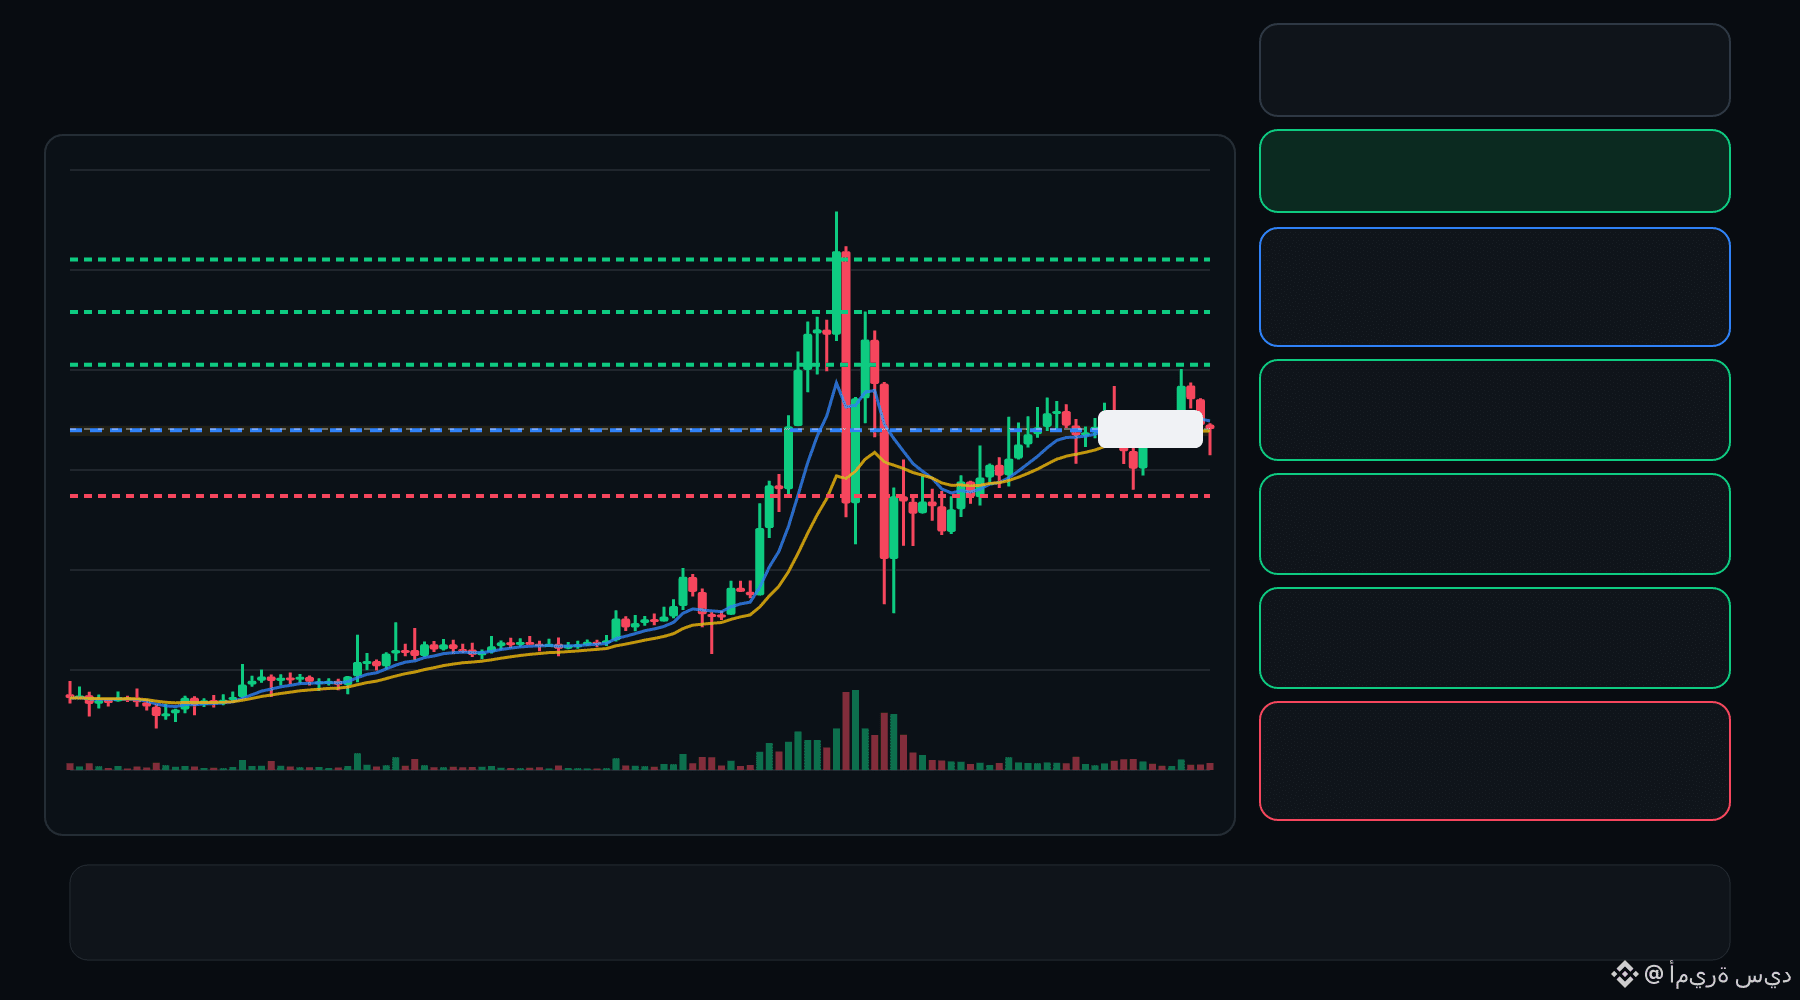
🟢 IDOL bulls are defending the pullback… is continuation setting up ⁉️
🟩 IDOL LONG
Entry: 0.02353 – 0.02386
TP1: 0.02601
TP2: 0.02786
TP3: 0.02972
Stop Loss: 0.02138
The 15M chart shows a bullish structure with momentum and volume confirmation. A controlled retest of the entry zone may give the setup a cleaner trigger.
Plan: Wait for confirmation/rejection inside the entry zone; don’t chase the move.
DYOR | Manage Risk | Avoid Over-Leverage
·
--
Ver traducción
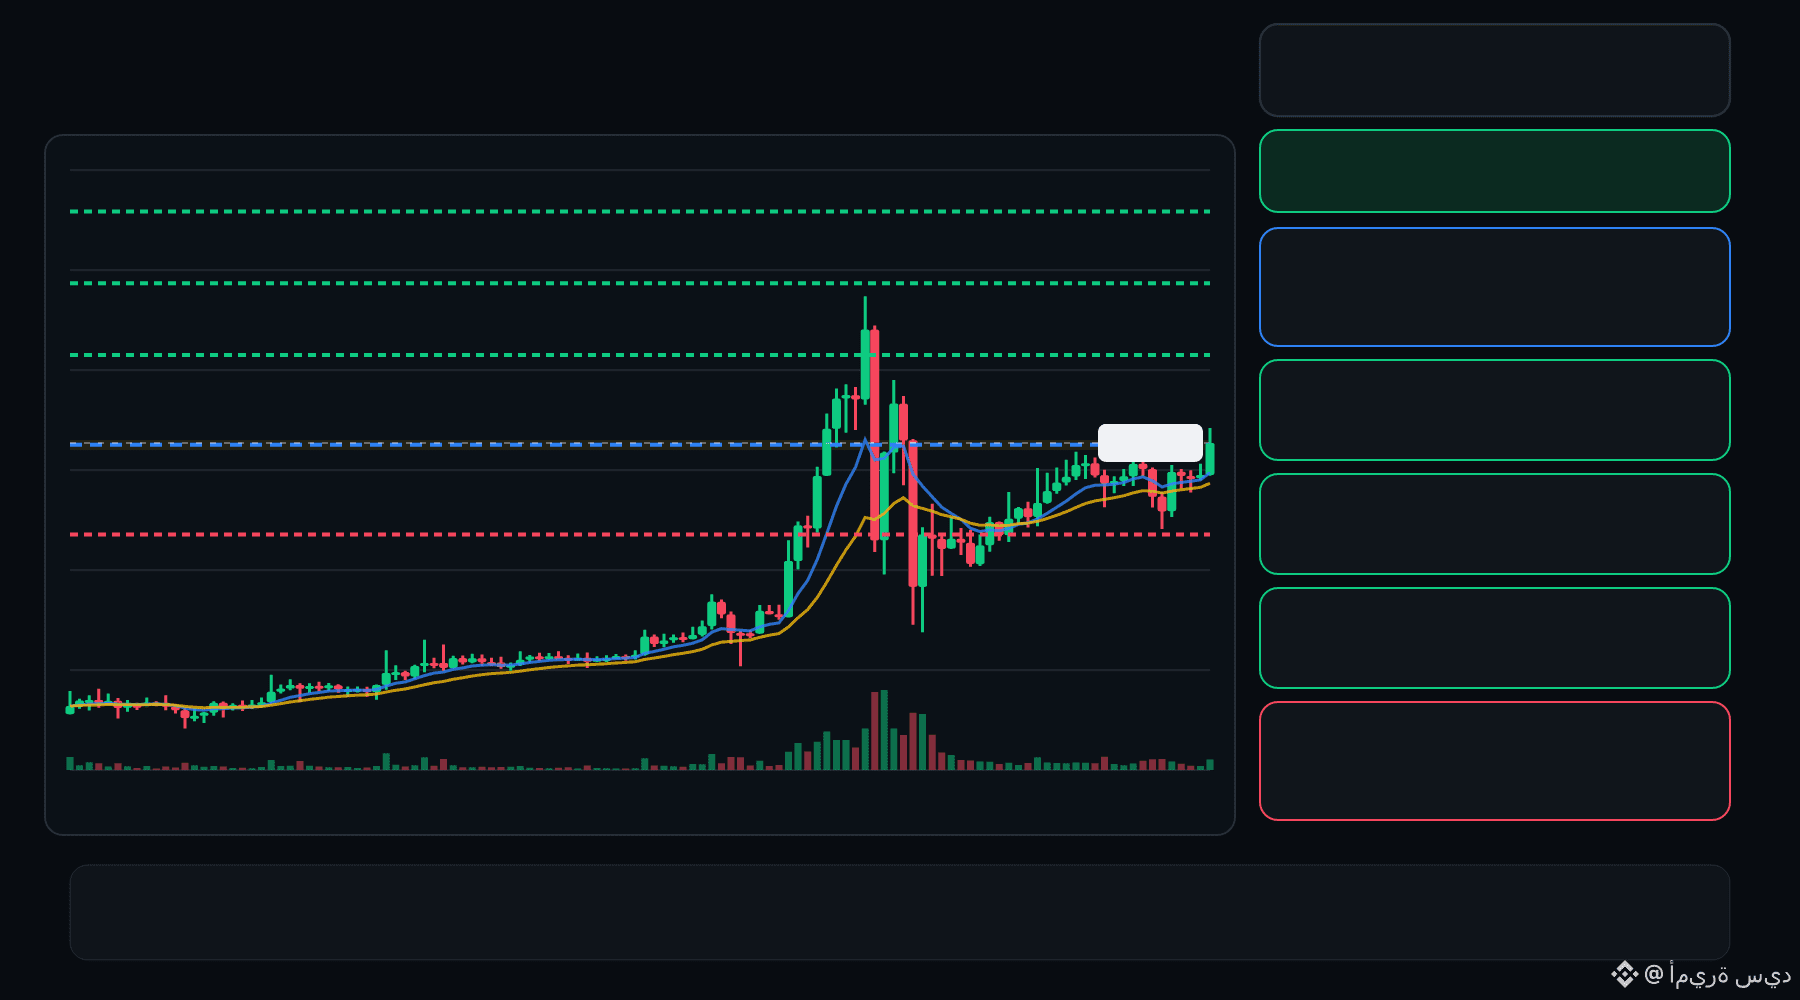
🟢 IDOL bulls are defending the pullback… is continuation setting up ⁉️
🟩 IDOL LONG
Entry: 0.02496 – 0.02536
TP1: 0.02894
TP2: 0.03197
TP3: 0.03499
Stop Loss: 0.02138
The 15M chart shows a bullish structure with momentum and volume confirmation. A controlled retest of the entry zone may give the setup a cleaner trigger.
Plan: Wait for confirmation/rejection inside the entry zone; don’t chase the move.
DYOR | Manage Risk | Avoid Over-Leverage
1
Inicia sesión para explorar más contenidos
Únete a usuarios de criptomonedas de todo el mundo en Binance Square
⚡️ Obtén la información más reciente y útil sobre criptomonedas.
💬 Confía en el mayor exchange de criptomonedas del mundo.
👍 Descubre opiniones reales de creadores verificados.
Correo electrónico/número de teléfono
Temas en tendencia
BinanceReports80%Recoveryof$6.3BillioninLossesfromHackIncident
16,123 visualizaciones
151 participa(n) en el debate
Actualización n.º 2 sobre el incidente de seguridad (2026-10-30)
Binance Announcement
·1.1k «Me gusta»
·1.3M visualizaciones
HeYiSaysWithdrawalsExpectedtoResumeWithin42Hours
28,151 visualizaciones
576 participa(n) en el debate
CZSaysCompensationIsinPlaceUsersAreProtected
31,742 visualizaciones
448 participa(n) en el debate