
KingBTC87
1.6k Publicaciones

KingBTC87
Denunciar
Bloquear usuario
Professional Crypto Trader | Multi-Agent AI Prediction System | High Accuracy Signals
Trader frecuente
1.7 años
18 Siguiendo
83 Seguidores
101 Me gusta
Publicaciones
Todo
Cotizaciones
·
--
Ver traducción
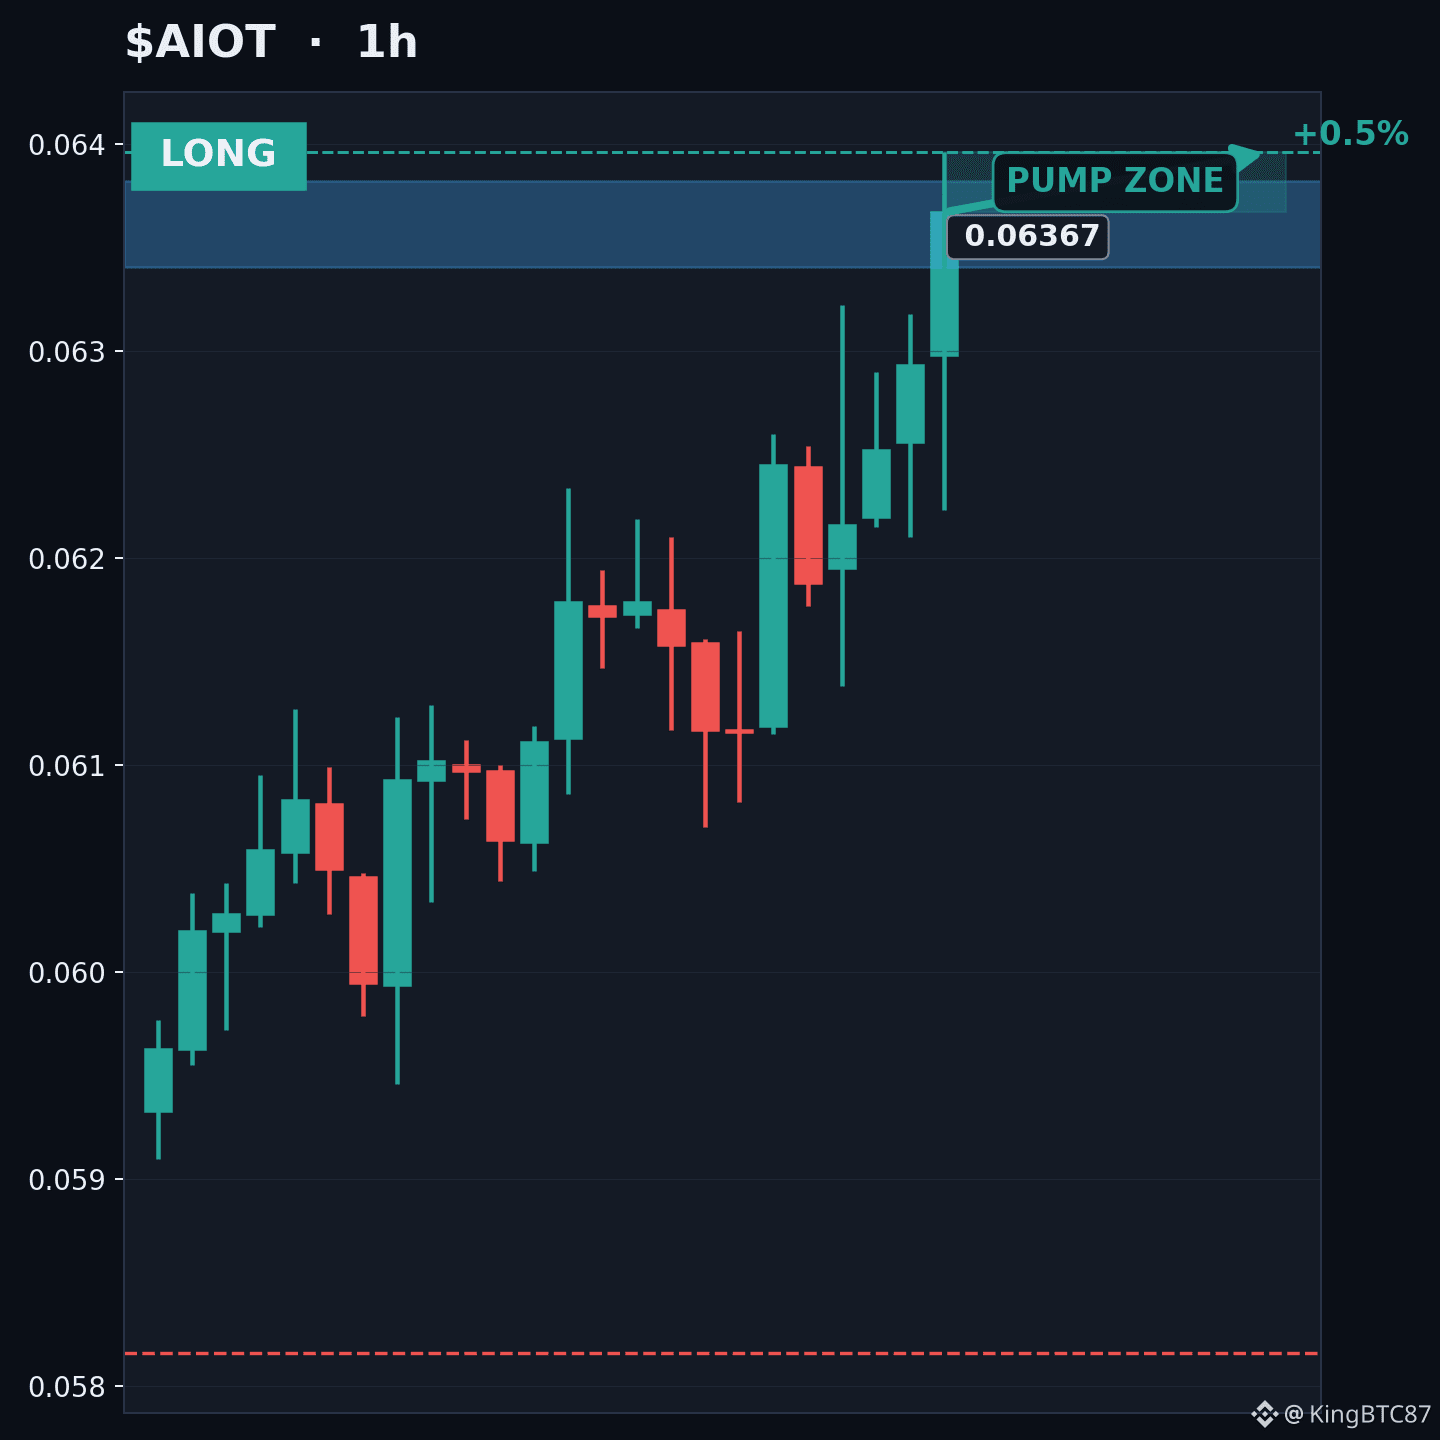
📈 $AIOT LONG on the 1H: 5 data points line up
🟢 Bias: LONG
📍 Entry: 0.063404 – 0.063822
🛑 Stop: 0.058161 (8.6% from entry)
🎯 TP1: 0.06396 (+0.55%)
📊 R:R to TP1: 0.06:1
Technical evidence:
• Price is pressing 0.06322, but no closed 1H candle is above it yet. This is a potential breakout, not a confirmed one
• Current 1H volume is 2.4x its 20-candle average
• EMA20 0.061718 > EMA50 0.060713 > EMA200 0.057428: bullish trend structure
• Nearest resistance 0.06396 is 0.55% from entry
• 1H regime is trending (ADX 35.7)
Indicators:
EMA20/50/200: 0.061718 / 0.060713 / 0.057428
RSI 73.3 | ATR 0.001045 | Volume 2.4x average
Watch-outs:
• RSI 73.3 is already overbought, so the move may be stretched.
Technical Setup Score: 95/95 (a rule-based rating of the setup, not a win probability)
⚠️ Invalid below 0.058161. Do not chase outside the entry zone.
Do these signals convince you, or is something missing for AIOT?
#CryptoTrading
This is a technical read, not financial advice.
📈 $AIOT LONG on the 1H: 5 data points line up
🟢 Bias: LONG
📍 Entry: 0.063404 – 0.063822
🛑 Stop: 0.058161 (8.6% from entry)
🎯 TP1: 0.06396 (+0.55%)
📊 R:R to TP1: 0.06:1
Technical evidence:
• Price is pressing 0.06322, but no closed 1H candle is above it yet. This is a potential breakout, not a confirmed one
• Current 1H volume is 2.4x its 20-candle average
• EMA20 0.061718 > EMA50 0.060713 > EMA200 0.057428: bullish trend structure
• Nearest resistance 0.06396 is 0.55% from entry
• 1H regime is trending (ADX 35.7)
Indicators:
EMA20/50/200: 0.061718 / 0.060713 / 0.057428
RSI 73.3 | ATR 0.001045 | Volume 2.4x average
Watch-outs:
• RSI 73.3 is already overbought, so the move may be stretched.
Technical Setup Score: 95/95 (a rule-based rating of the setup, not a win probability)
⚠️ Invalid below 0.058161. Do not chase outside the entry zone.
Do these signals convince you, or is something missing for AIOT?
#CryptoTrading
This is a technical read, not financial advice.
🟢 Bias: LONG
📍 Entry: 0.063404 – 0.063822
🛑 Stop: 0.058161 (8.6% from entry)
🎯 TP1: 0.06396 (+0.55%)
📊 R:R to TP1: 0.06:1
Technical evidence:
• Price is pressing 0.06322, but no closed 1H candle is above it yet. This is a potential breakout, not a confirmed one
• Current 1H volume is 2.4x its 20-candle average
• EMA20 0.061718 > EMA50 0.060713 > EMA200 0.057428: bullish trend structure
• Nearest resistance 0.06396 is 0.55% from entry
• 1H regime is trending (ADX 35.7)
Indicators:
EMA20/50/200: 0.061718 / 0.060713 / 0.057428
RSI 73.3 | ATR 0.001045 | Volume 2.4x average
Watch-outs:
• RSI 73.3 is already overbought, so the move may be stretched.
Technical Setup Score: 95/95 (a rule-based rating of the setup, not a win probability)
⚠️ Invalid below 0.058161. Do not chase outside the entry zone.
Do these signals convince you, or is something missing for AIOT?
#CryptoTrading
This is a technical read, not financial advice.
2
·
--
Ver traducción
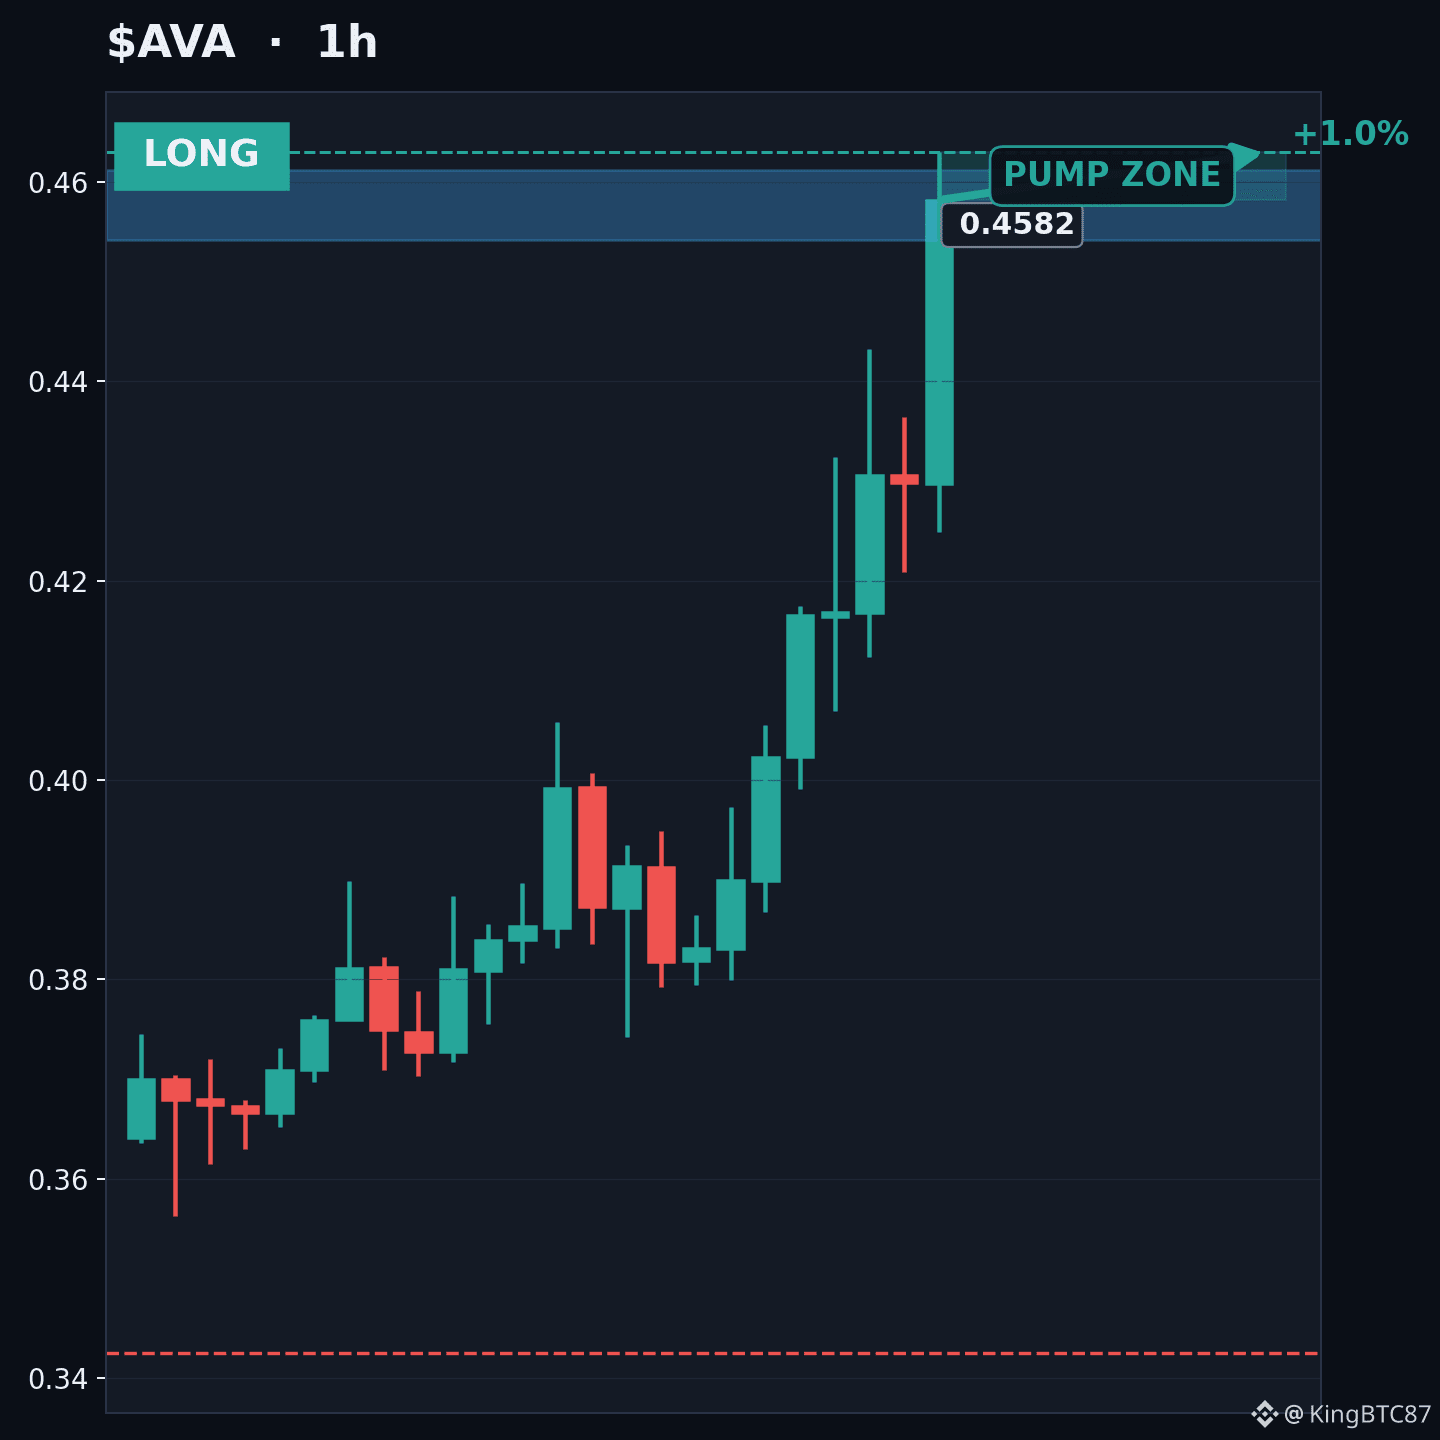
📈 $AVA LONG on the 1H: 5 data points line up
🟢 Bias: LONG
📍 Entry: 0.454211 – 0.46117
🛑 Stop: 0.34252 (25.2% from entry)
🎯 TP1: 0.463 (+1.2%)
📊 R:R to TP1: 0.05:1
Technical evidence:
• Price is pressing 0.4433, but no closed 1H candle is above it yet. This is a potential breakout, not a confirmed one
• Current 1H volume is 2.1x its 20-candle average
• EMA20 0.401719 > EMA50 0.383609 > EMA200 0.355334: bullish trend structure
• Nearest resistance 0.463 is 1.2% from entry
• 1H regime is trending (ADX 56.3)
Indicators:
EMA20/50/200: 0.401719 / 0.383609 / 0.355334
RSI 82.0 | ATR 0.017398 | Volume 2.1x average
Watch-outs:
• RSI 82.0 is already overbought, so the move may be stretched.
Technical Setup Score: 95/95 (a rule-based rating of the setup, not a win probability)
⚠️ Invalid below 0.34252. Do not chase outside the entry zone.
Would you take this setup as is, or wait for a pullback?
#CryptoTrading
Not financial advice. Do your own research and size risk responsibly.
📈 $AVA LONG on the 1H: 5 data points line up
🟢 Bias: LONG
📍 Entry: 0.454211 – 0.46117
🛑 Stop: 0.34252 (25.2% from entry)
🎯 TP1: 0.463 (+1.2%)
📊 R:R to TP1: 0.05:1
Technical evidence:
• Price is pressing 0.4433, but no closed 1H candle is above it yet. This is a potential breakout, not a confirmed one
• Current 1H volume is 2.1x its 20-candle average
• EMA20 0.401719 > EMA50 0.383609 > EMA200 0.355334: bullish trend structure
• Nearest resistance 0.463 is 1.2% from entry
• 1H regime is trending (ADX 56.3)
Indicators:
EMA20/50/200: 0.401719 / 0.383609 / 0.355334
RSI 82.0 | ATR 0.017398 | Volume 2.1x average
Watch-outs:
• RSI 82.0 is already overbought, so the move may be stretched.
Technical Setup Score: 95/95 (a rule-based rating of the setup, not a win probability)
⚠️ Invalid below 0.34252. Do not chase outside the entry zone.
Would you take this setup as is, or wait for a pullback?
#CryptoTrading
Not financial advice. Do your own research and size risk responsibly.
🟢 Bias: LONG
📍 Entry: 0.454211 – 0.46117
🛑 Stop: 0.34252 (25.2% from entry)
🎯 TP1: 0.463 (+1.2%)
📊 R:R to TP1: 0.05:1
Technical evidence:
• Price is pressing 0.4433, but no closed 1H candle is above it yet. This is a potential breakout, not a confirmed one
• Current 1H volume is 2.1x its 20-candle average
• EMA20 0.401719 > EMA50 0.383609 > EMA200 0.355334: bullish trend structure
• Nearest resistance 0.463 is 1.2% from entry
• 1H regime is trending (ADX 56.3)
Indicators:
EMA20/50/200: 0.401719 / 0.383609 / 0.355334
RSI 82.0 | ATR 0.017398 | Volume 2.1x average
Watch-outs:
• RSI 82.0 is already overbought, so the move may be stretched.
Technical Setup Score: 95/95 (a rule-based rating of the setup, not a win probability)
⚠️ Invalid below 0.34252. Do not chase outside the entry zone.
Would you take this setup as is, or wait for a pullback?
#CryptoTrading
Not financial advice. Do your own research and size risk responsibly.
5
·
--
Ver traducción
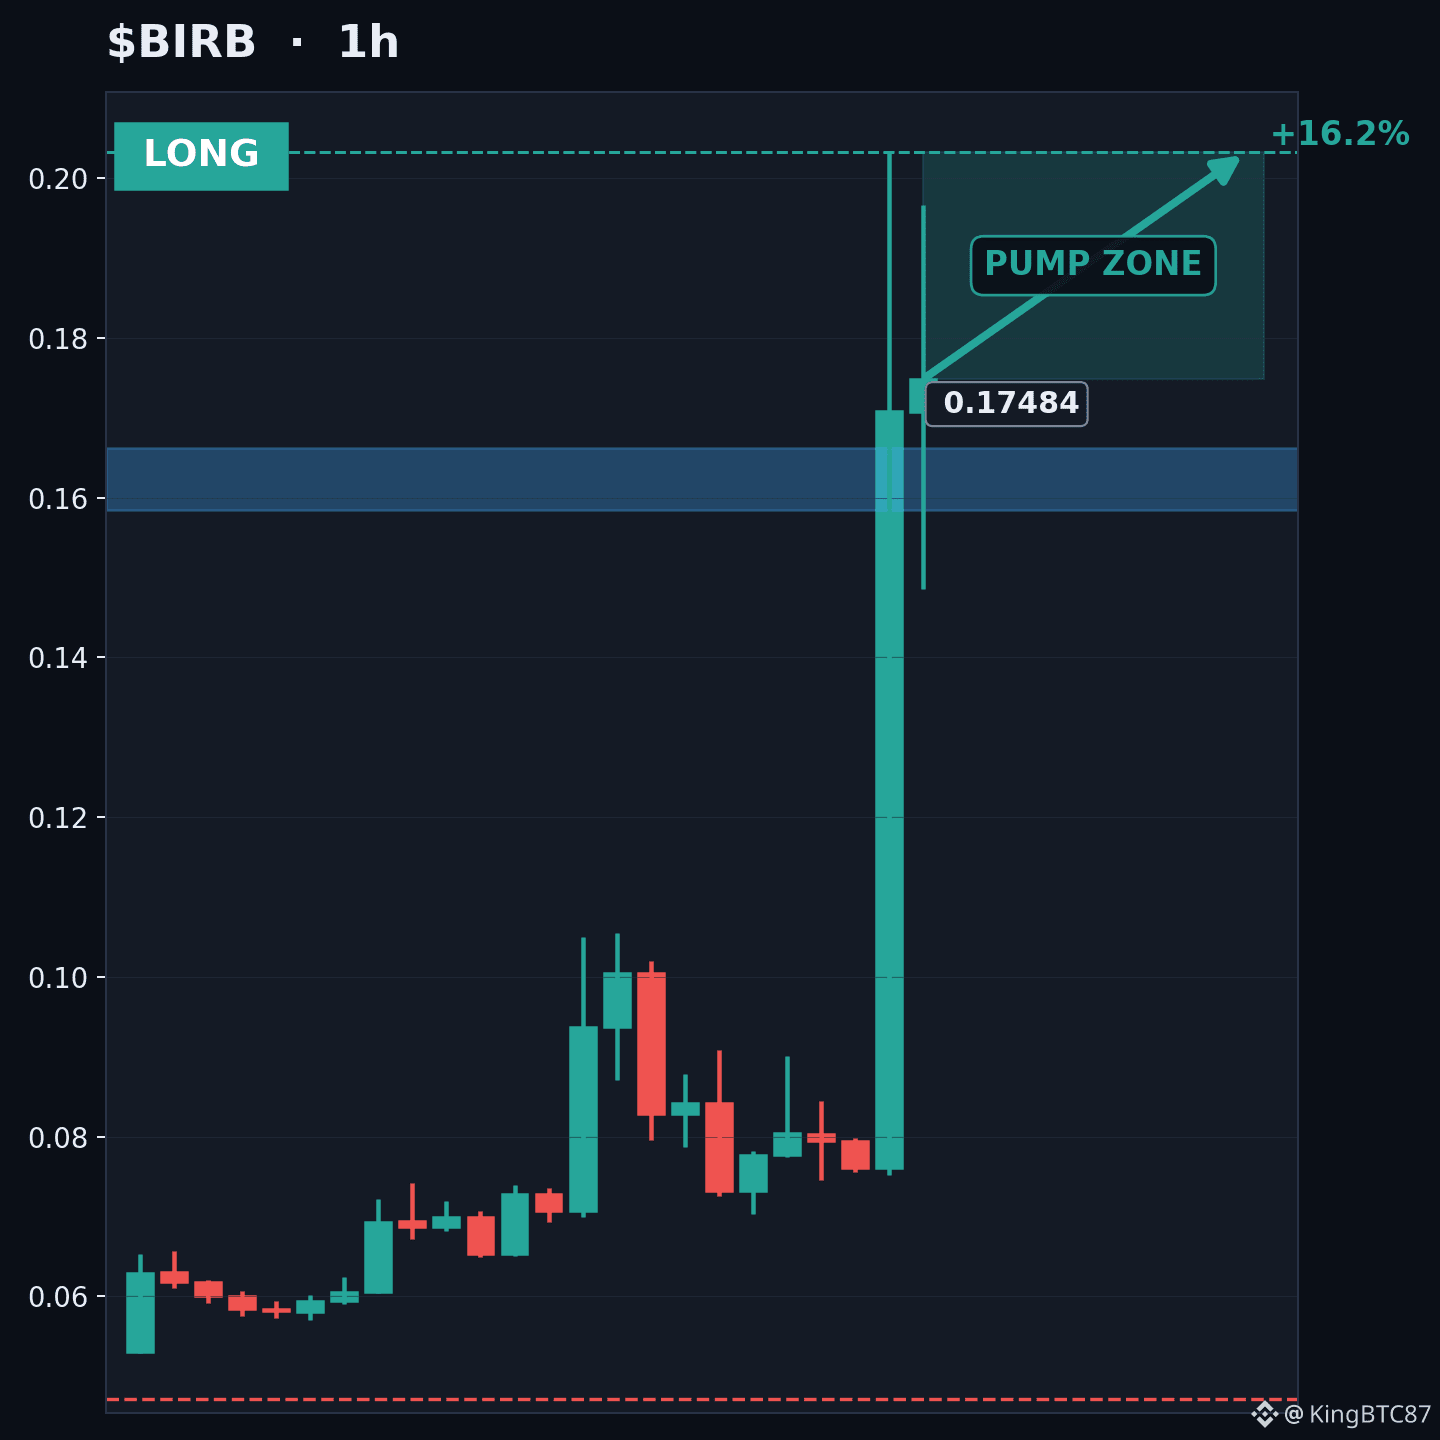
👀 $BIRB is on the watchlist: a possible LONG on the 1H, not a confirmed setup yet
Technical Setup Score: 50/95. That is below the level this studio treats as a trade setup.
Why now?
• Confirmed breakout: a closed 1H candle finished above 0.10544 on the latest closed candle with volume 3.81x its 20-candle average
• EMA20 0.090885 > EMA50 0.073287 > EMA200 0.058167: bullish trend structure
Area to watch: 0.158401 – 0.16624. No stop or targets are offered until it is confirmed.
Would you add it to your watchlist?
#CryptoTrading
Analysis, not advice. Trade your own plan and never risk more than you can afford to lose.
👀 $BIRB is on the watchlist: a possible LONG on the 1H, not a confirmed setup yet
Technical Setup Score: 50/95. That is below the level this studio treats as a trade setup.
Why now?
• Confirmed breakout: a closed 1H candle finished above 0.10544 on the latest closed candle with volume 3.81x its 20-candle average
• EMA20 0.090885 > EMA50 0.073287 > EMA200 0.058167: bullish trend structure
Area to watch: 0.158401 – 0.16624. No stop or targets are offered until it is confirmed.
Would you add it to your watchlist?
#CryptoTrading
Analysis, not advice. Trade your own plan and never risk more than you can afford to lose.
Technical Setup Score: 50/95. That is below the level this studio treats as a trade setup.
Why now?
• Confirmed breakout: a closed 1H candle finished above 0.10544 on the latest closed candle with volume 3.81x its 20-candle average
• EMA20 0.090885 > EMA50 0.073287 > EMA200 0.058167: bullish trend structure
Area to watch: 0.158401 – 0.16624. No stop or targets are offered until it is confirmed.
Would you add it to your watchlist?
#CryptoTrading
Analysis, not advice. Trade your own plan and never risk more than you can afford to lose.
2
·
--
Ver traducción
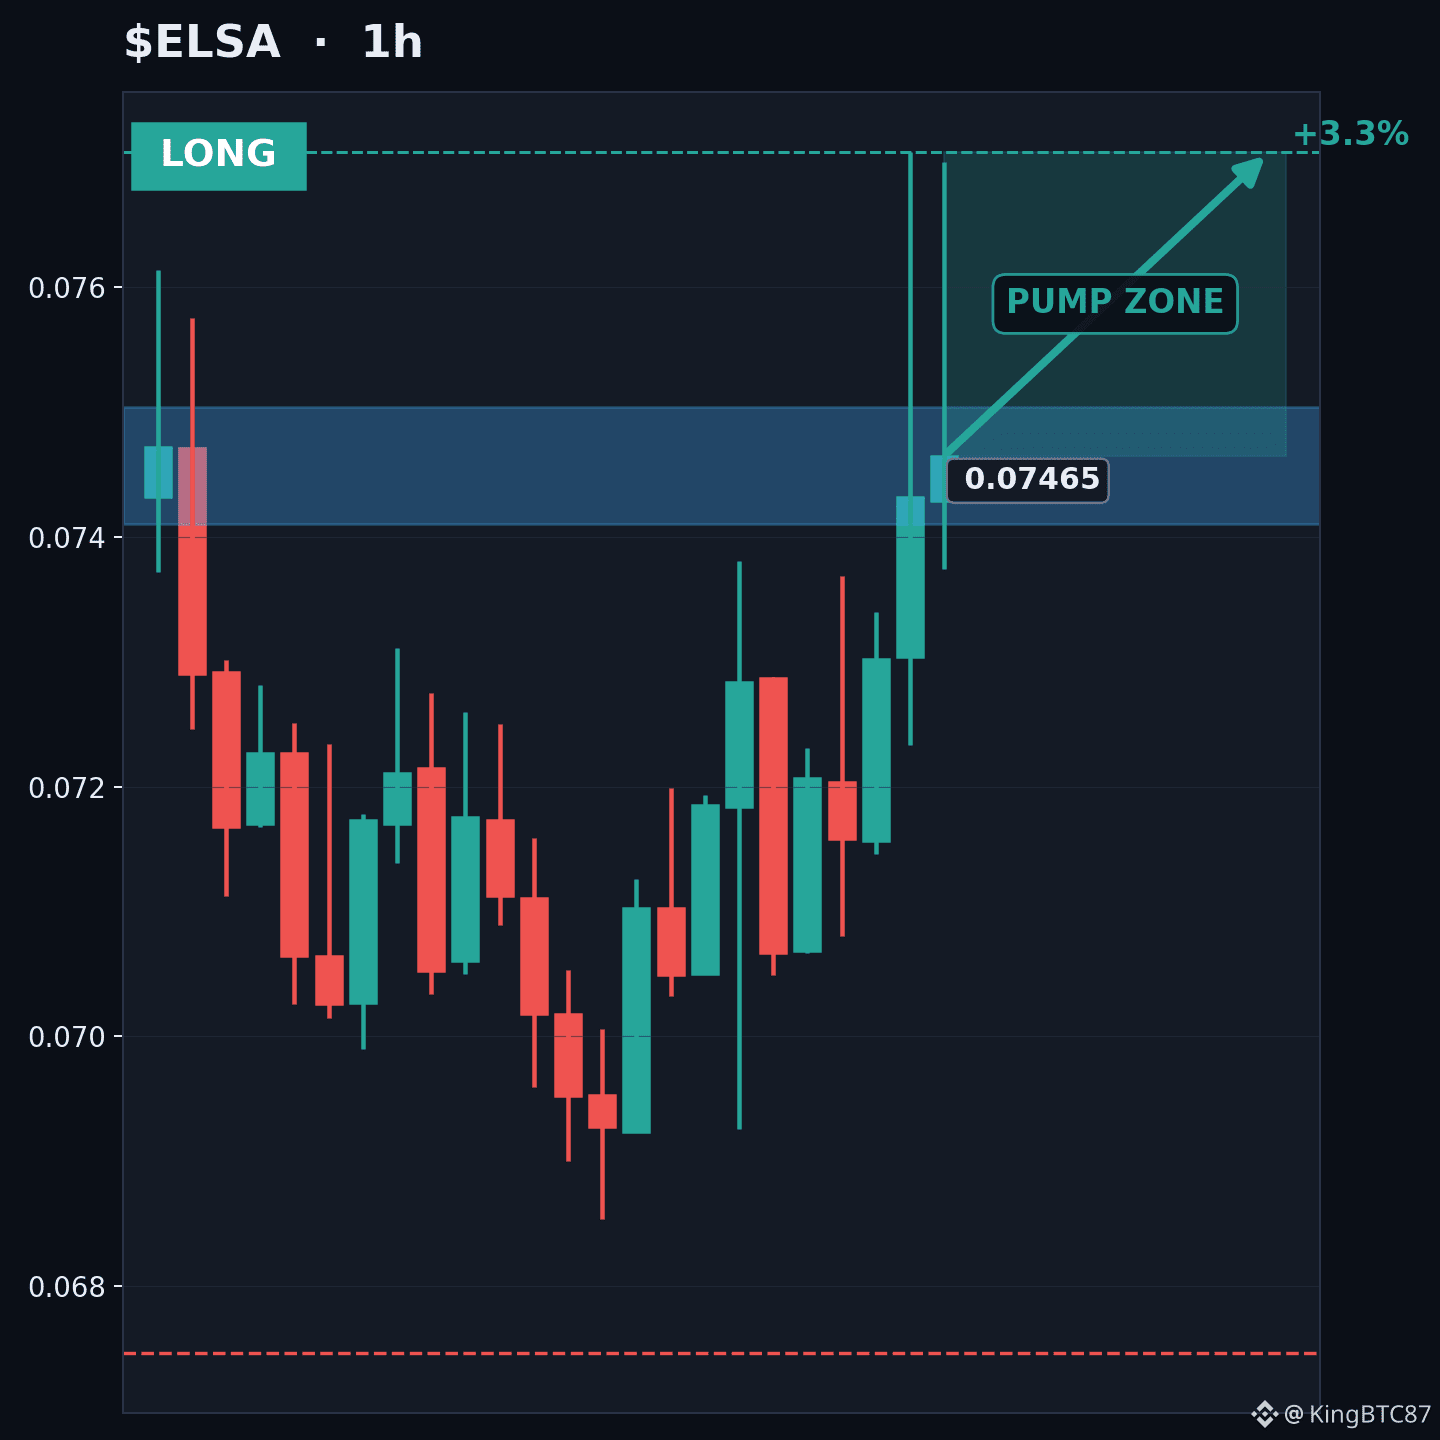
👀 $ELSA is on the watchlist: a possible LONG on the 1H, not a confirmed setup yet
Technical Setup Score: 50/95. That is below the level this studio treats as a trade setup.
Why now?
• Current 1H volume is 1.78x its 20-candle average
• EMA20 0.072004 > EMA50 0.071035 > EMA200 0.0656: bullish trend structure
Area to watch: 0.074105 – 0.075036. No stop or targets are offered until it is confirmed.
Would you add it to your watchlist?
#CryptoTrading
This is a technical read, not financial advice.
👀 $ELSA is on the watchlist: a possible LONG on the 1H, not a confirmed setup yet
Technical Setup Score: 50/95. That is below the level this studio treats as a trade setup.
Why now?
• Current 1H volume is 1.78x its 20-candle average
• EMA20 0.072004 > EMA50 0.071035 > EMA200 0.0656: bullish trend structure
Area to watch: 0.074105 – 0.075036. No stop or targets are offered until it is confirmed.
Would you add it to your watchlist?
#CryptoTrading
This is a technical read, not financial advice.
Technical Setup Score: 50/95. That is below the level this studio treats as a trade setup.
Why now?
• Current 1H volume is 1.78x its 20-candle average
• EMA20 0.072004 > EMA50 0.071035 > EMA200 0.0656: bullish trend structure
Area to watch: 0.074105 – 0.075036. No stop or targets are offered until it is confirmed.
Would you add it to your watchlist?
#CryptoTrading
This is a technical read, not financial advice.
1
·
--
Ver traducción
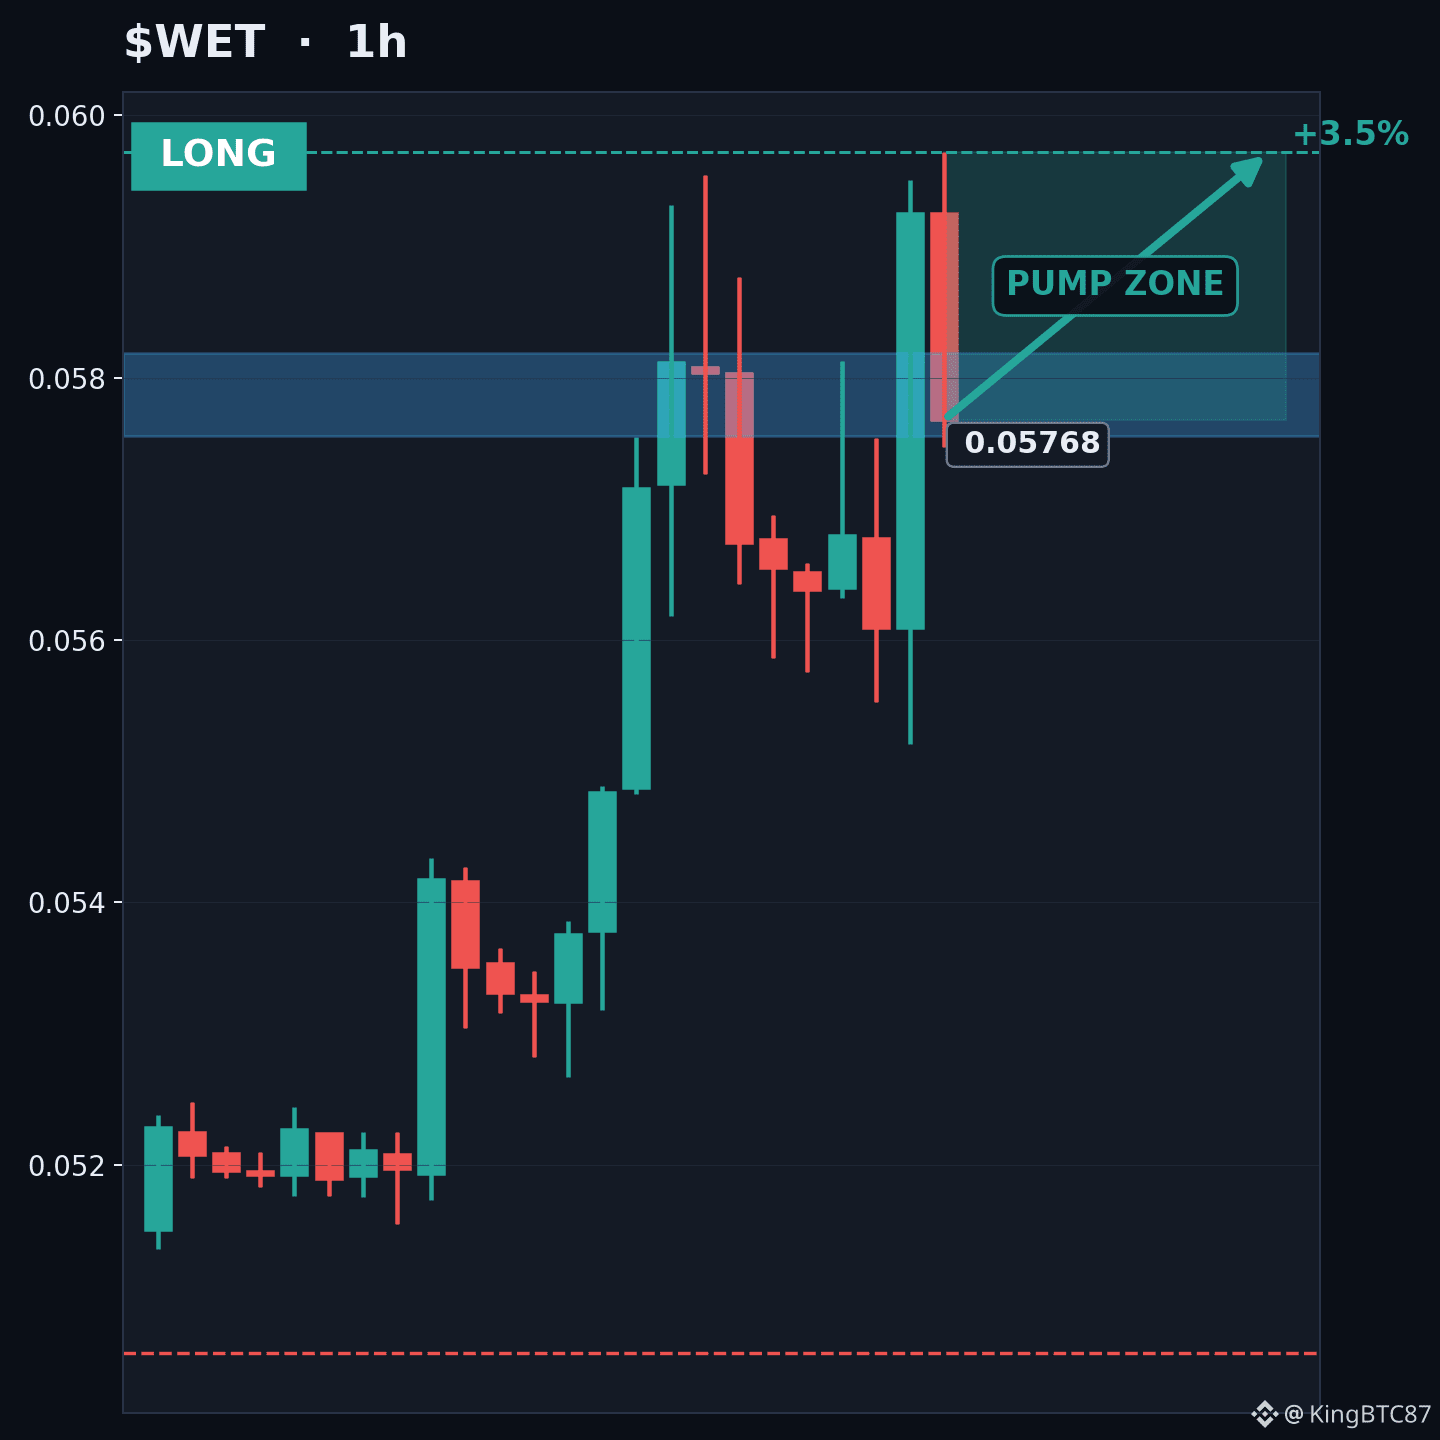
📈 $WET LONG on the 1H: 5 data points line up
🟢 Bias: LONG
📍 Entry: 0.057557 – 0.058189
🛑 Stop: 0.050564 (12.6% from entry)
🎯 TP1: 0.05972 (+3.2%)
📊 R:R to TP1: 0.25:1
Technical evidence:
• Current 1H volume is 1.43x its 20-candle average
• EMA20 0.055696 > EMA50 0.054064 > EMA200 0.052571: bullish trend structure
• RSI 68.7 shows bullish momentum without being stretched
• Nearest resistance 0.05972 is 3.2% from entry
• 1H regime is trending (ADX 56.4)
Indicators:
EMA20/50/200: 0.055696 / 0.054064 / 0.052571
RSI 68.7 | ATR 0.001581 | Volume 1.43x average
Technical Setup Score: 80/95 (a rule-based rating of the setup, not a win probability)
⚠️ Invalid below 0.050564. Do not chase outside the entry zone.
Would you take this setup as is, or wait for a pullback?
#CryptoTrading
This is a technical read, not financial advice.
📈 $WET LONG on the 1H: 5 data points line up
🟢 Bias: LONG
📍 Entry: 0.057557 – 0.058189
🛑 Stop: 0.050564 (12.6% from entry)
🎯 TP1: 0.05972 (+3.2%)
📊 R:R to TP1: 0.25:1
Technical evidence:
• Current 1H volume is 1.43x its 20-candle average
• EMA20 0.055696 > EMA50 0.054064 > EMA200 0.052571: bullish trend structure
• RSI 68.7 shows bullish momentum without being stretched
• Nearest resistance 0.05972 is 3.2% from entry
• 1H regime is trending (ADX 56.4)
Indicators:
EMA20/50/200: 0.055696 / 0.054064 / 0.052571
RSI 68.7 | ATR 0.001581 | Volume 1.43x average
Technical Setup Score: 80/95 (a rule-based rating of the setup, not a win probability)
⚠️ Invalid below 0.050564. Do not chase outside the entry zone.
Would you take this setup as is, or wait for a pullback?
#CryptoTrading
This is a technical read, not financial advice.
🟢 Bias: LONG
📍 Entry: 0.057557 – 0.058189
🛑 Stop: 0.050564 (12.6% from entry)
🎯 TP1: 0.05972 (+3.2%)
📊 R:R to TP1: 0.25:1
Technical evidence:
• Current 1H volume is 1.43x its 20-candle average
• EMA20 0.055696 > EMA50 0.054064 > EMA200 0.052571: bullish trend structure
• RSI 68.7 shows bullish momentum without being stretched
• Nearest resistance 0.05972 is 3.2% from entry
• 1H regime is trending (ADX 56.4)
Indicators:
EMA20/50/200: 0.055696 / 0.054064 / 0.052571
RSI 68.7 | ATR 0.001581 | Volume 1.43x average
Technical Setup Score: 80/95 (a rule-based rating of the setup, not a win probability)
⚠️ Invalid below 0.050564. Do not chase outside the entry zone.
Would you take this setup as is, or wait for a pullback?
#CryptoTrading
This is a technical read, not financial advice.
4
·
--
Ver traducción
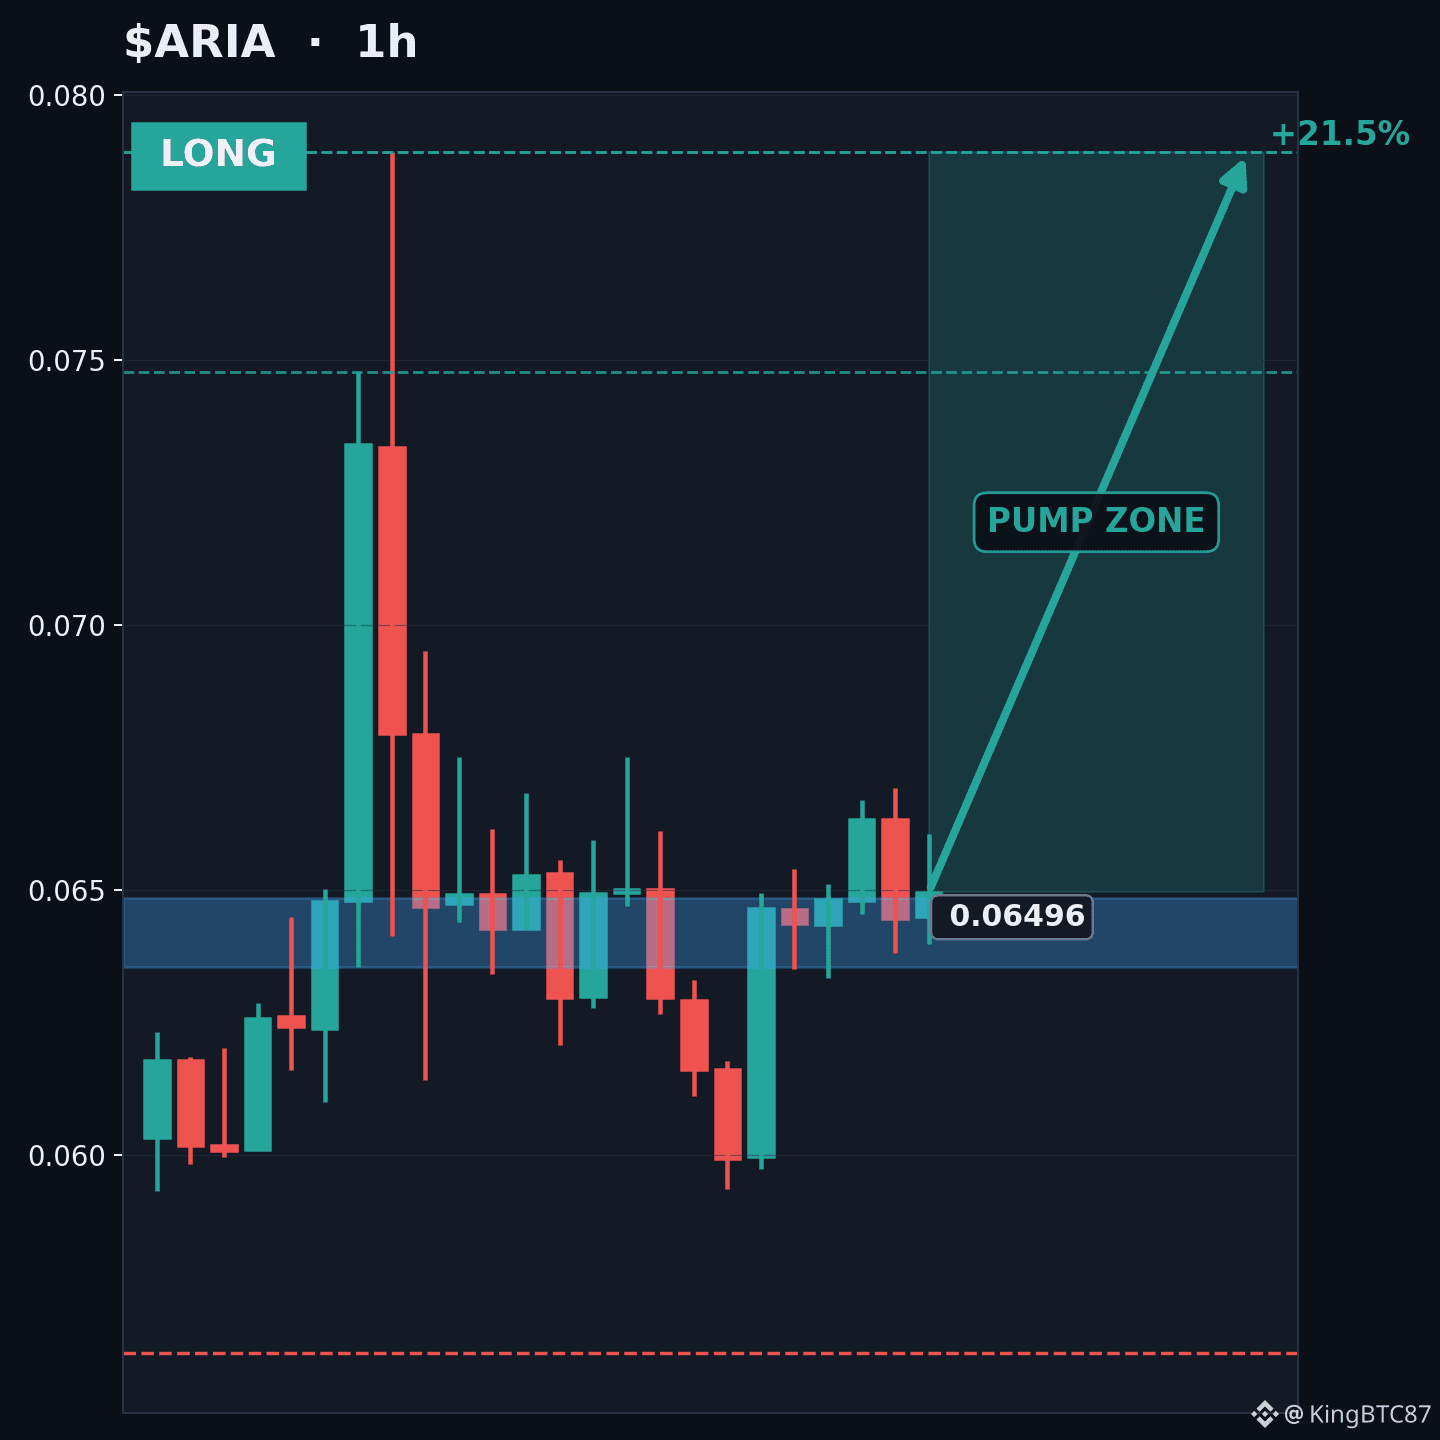
📈 $ARIA LONG on the 1H: 4 data points line up
🟢 Bias: LONG
📍 Entry: 0.063542 – 0.064843
🛑 Stop: 0.05627 (12.3% from entry)
🎯 TP1: 0.074772 (+16.5%)
🎯 TP2: 0.07892 (+22.9%)
📊 R:R to TP2: 1.86:1
Technical evidence:
• EMA20 0.063904 > EMA50 0.062238 > EMA200 0.052571: bullish trend structure
• Risk/reward to TP2 is 1.86:1 from the middle of the entry zone
• Nearest resistance 0.07892 is 22.9% from entry
• 1H regime is trending (ADX 26.4)
Indicators:
EMA20/50/200: 0.063904 / 0.062238 / 0.052571
RSI 49.4 | ATR 0.003251 | Volume 0.2x average
Watch-outs:
• Volume is only 0.2x average, so participation is thin.
Technical Setup Score: 80/95 (a rule-based rating of the setup, not a win probability)
⚠️ Invalid below 0.05627. Do not chase outside the entry zone.
Which of these data points would you weigh most?
#CryptoTrading
This is a technical read, not financial advice.
📈 $ARIA LONG on the 1H: 4 data points line up
🟢 Bias: LONG
📍 Entry: 0.063542 – 0.064843
🛑 Stop: 0.05627 (12.3% from entry)
🎯 TP1: 0.074772 (+16.5%)
🎯 TP2: 0.07892 (+22.9%)
📊 R:R to TP2: 1.86:1
Technical evidence:
• EMA20 0.063904 > EMA50 0.062238 > EMA200 0.052571: bullish trend structure
• Risk/reward to TP2 is 1.86:1 from the middle of the entry zone
• Nearest resistance 0.07892 is 22.9% from entry
• 1H regime is trending (ADX 26.4)
Indicators:
EMA20/50/200: 0.063904 / 0.062238 / 0.052571
RSI 49.4 | ATR 0.003251 | Volume 0.2x average
Watch-outs:
• Volume is only 0.2x average, so participation is thin.
Technical Setup Score: 80/95 (a rule-based rating of the setup, not a win probability)
⚠️ Invalid below 0.05627. Do not chase outside the entry zone.
Which of these data points would you weigh most?
#CryptoTrading
This is a technical read, not financial advice.
🟢 Bias: LONG
📍 Entry: 0.063542 – 0.064843
🛑 Stop: 0.05627 (12.3% from entry)
🎯 TP1: 0.074772 (+16.5%)
🎯 TP2: 0.07892 (+22.9%)
📊 R:R to TP2: 1.86:1
Technical evidence:
• EMA20 0.063904 > EMA50 0.062238 > EMA200 0.052571: bullish trend structure
• Risk/reward to TP2 is 1.86:1 from the middle of the entry zone
• Nearest resistance 0.07892 is 22.9% from entry
• 1H regime is trending (ADX 26.4)
Indicators:
EMA20/50/200: 0.063904 / 0.062238 / 0.052571
RSI 49.4 | ATR 0.003251 | Volume 0.2x average
Watch-outs:
• Volume is only 0.2x average, so participation is thin.
Technical Setup Score: 80/95 (a rule-based rating of the setup, not a win probability)
⚠️ Invalid below 0.05627. Do not chase outside the entry zone.
Which of these data points would you weigh most?
#CryptoTrading
This is a technical read, not financial advice.
1
·
--
Ver traducción
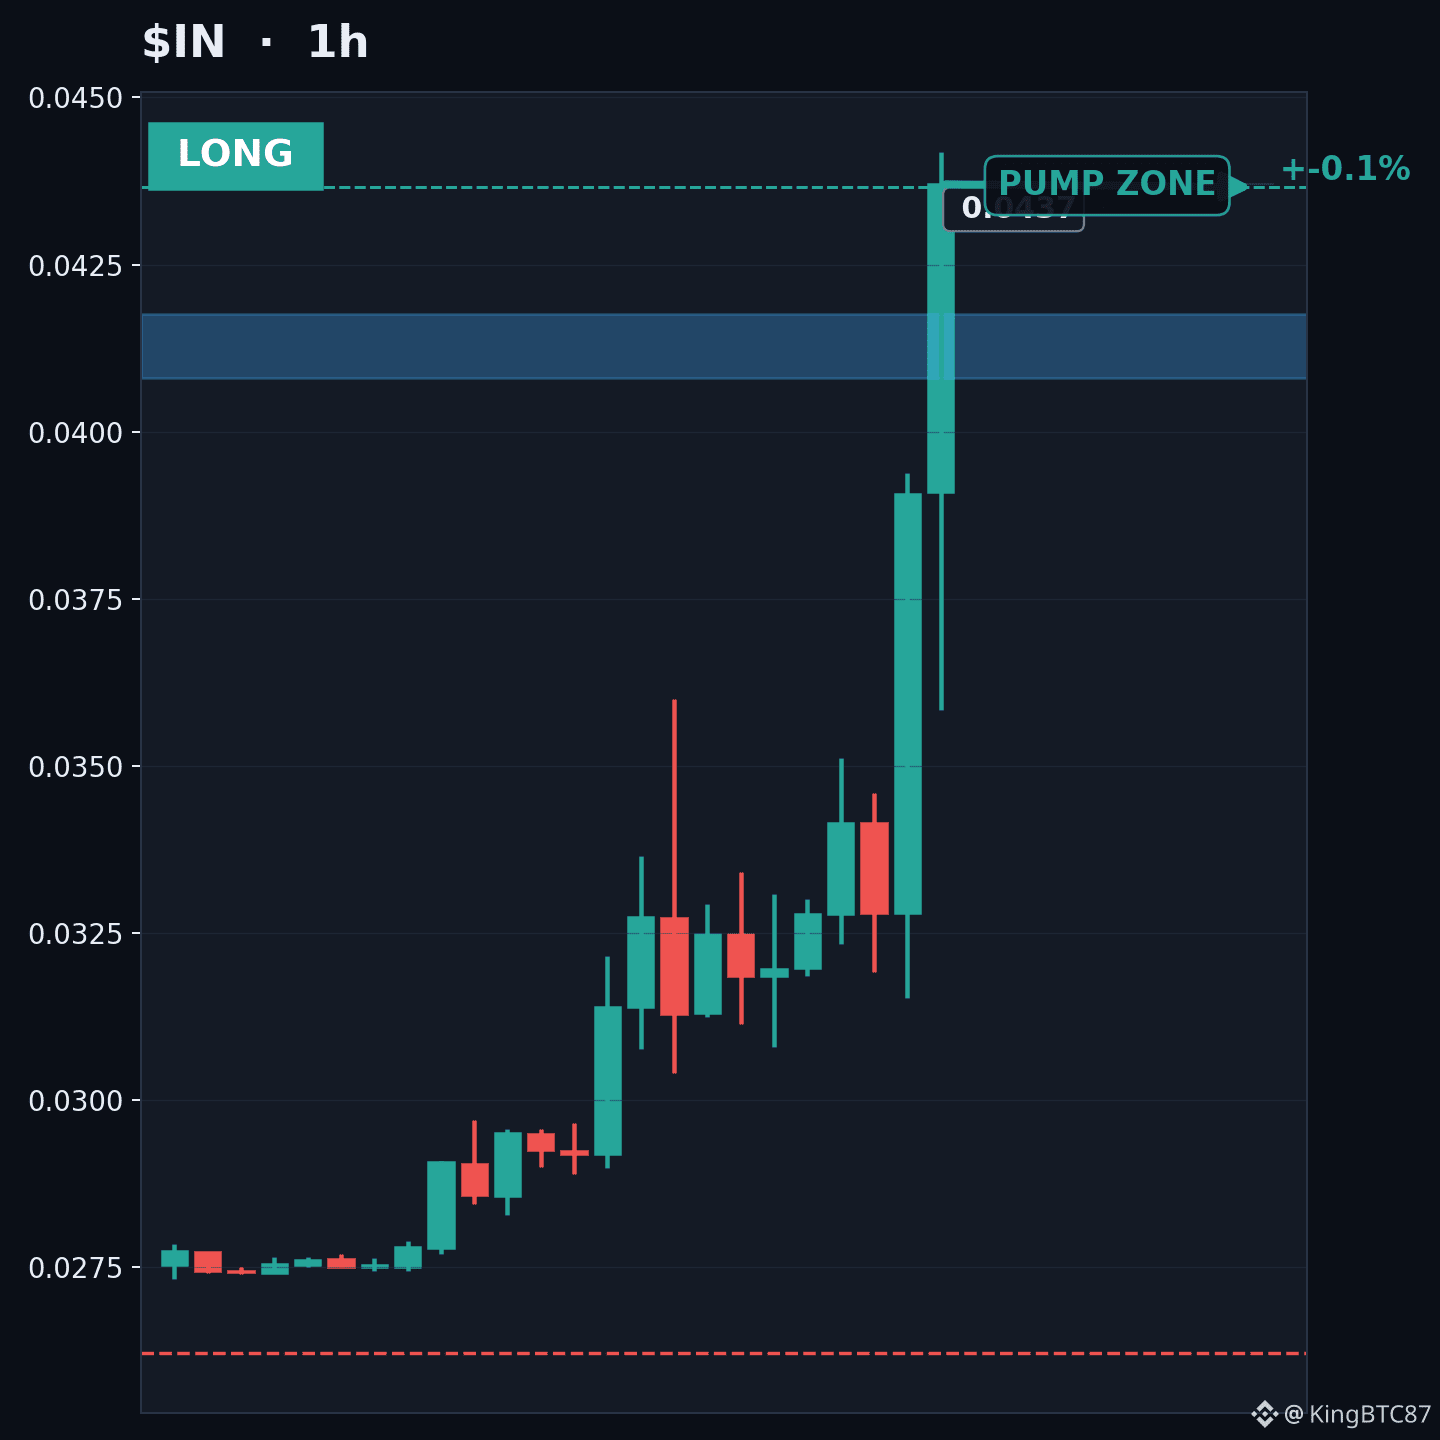
👀 $IN closed above 0.036 on the 1H. Is the retest worth trading?
IN closed above 0.036 on the latest closed candle with volume 7.5x its 20-candle average.
🟢 Bias: LONG while price holds above 0.036
📍 Entry: 0.040795 – 0.041761
🛑 Stop: 0.026217 (36.5% from entry)
🎯 TP1: 0.04366 (+5.8%)
📊 R:R to TP1: 0.16:1
Why now?
• EMA20 0.032493 > EMA50 0.030082 > EMA200 0.028552: bullish trend structure
⚠️ Invalid below 0.026217, or on a close back under 0.036. Do not chase outside the entry zone.
Chase it, wait for the retest, or pass on IN?
#CryptoTrading
This is a technical read, not financial advice.
👀 $IN closed above 0.036 on the 1H. Is the retest worth trading?
IN closed above 0.036 on the latest closed candle with volume 7.5x its 20-candle average.
🟢 Bias: LONG while price holds above 0.036
📍 Entry: 0.040795 – 0.041761
🛑 Stop: 0.026217 (36.5% from entry)
🎯 TP1: 0.04366 (+5.8%)
📊 R:R to TP1: 0.16:1
Why now?
• EMA20 0.032493 > EMA50 0.030082 > EMA200 0.028552: bullish trend structure
⚠️ Invalid below 0.026217, or on a close back under 0.036. Do not chase outside the entry zone.
Chase it, wait for the retest, or pass on IN?
#CryptoTrading
This is a technical read, not financial advice.
IN closed above 0.036 on the latest closed candle with volume 7.5x its 20-candle average.
🟢 Bias: LONG while price holds above 0.036
📍 Entry: 0.040795 – 0.041761
🛑 Stop: 0.026217 (36.5% from entry)
🎯 TP1: 0.04366 (+5.8%)
📊 R:R to TP1: 0.16:1
Why now?
• EMA20 0.032493 > EMA50 0.030082 > EMA200 0.028552: bullish trend structure
⚠️ Invalid below 0.026217, or on a close back under 0.036. Do not chase outside the entry zone.
Chase it, wait for the retest, or pass on IN?
#CryptoTrading
This is a technical read, not financial advice.
5
·
--
Ver traducción
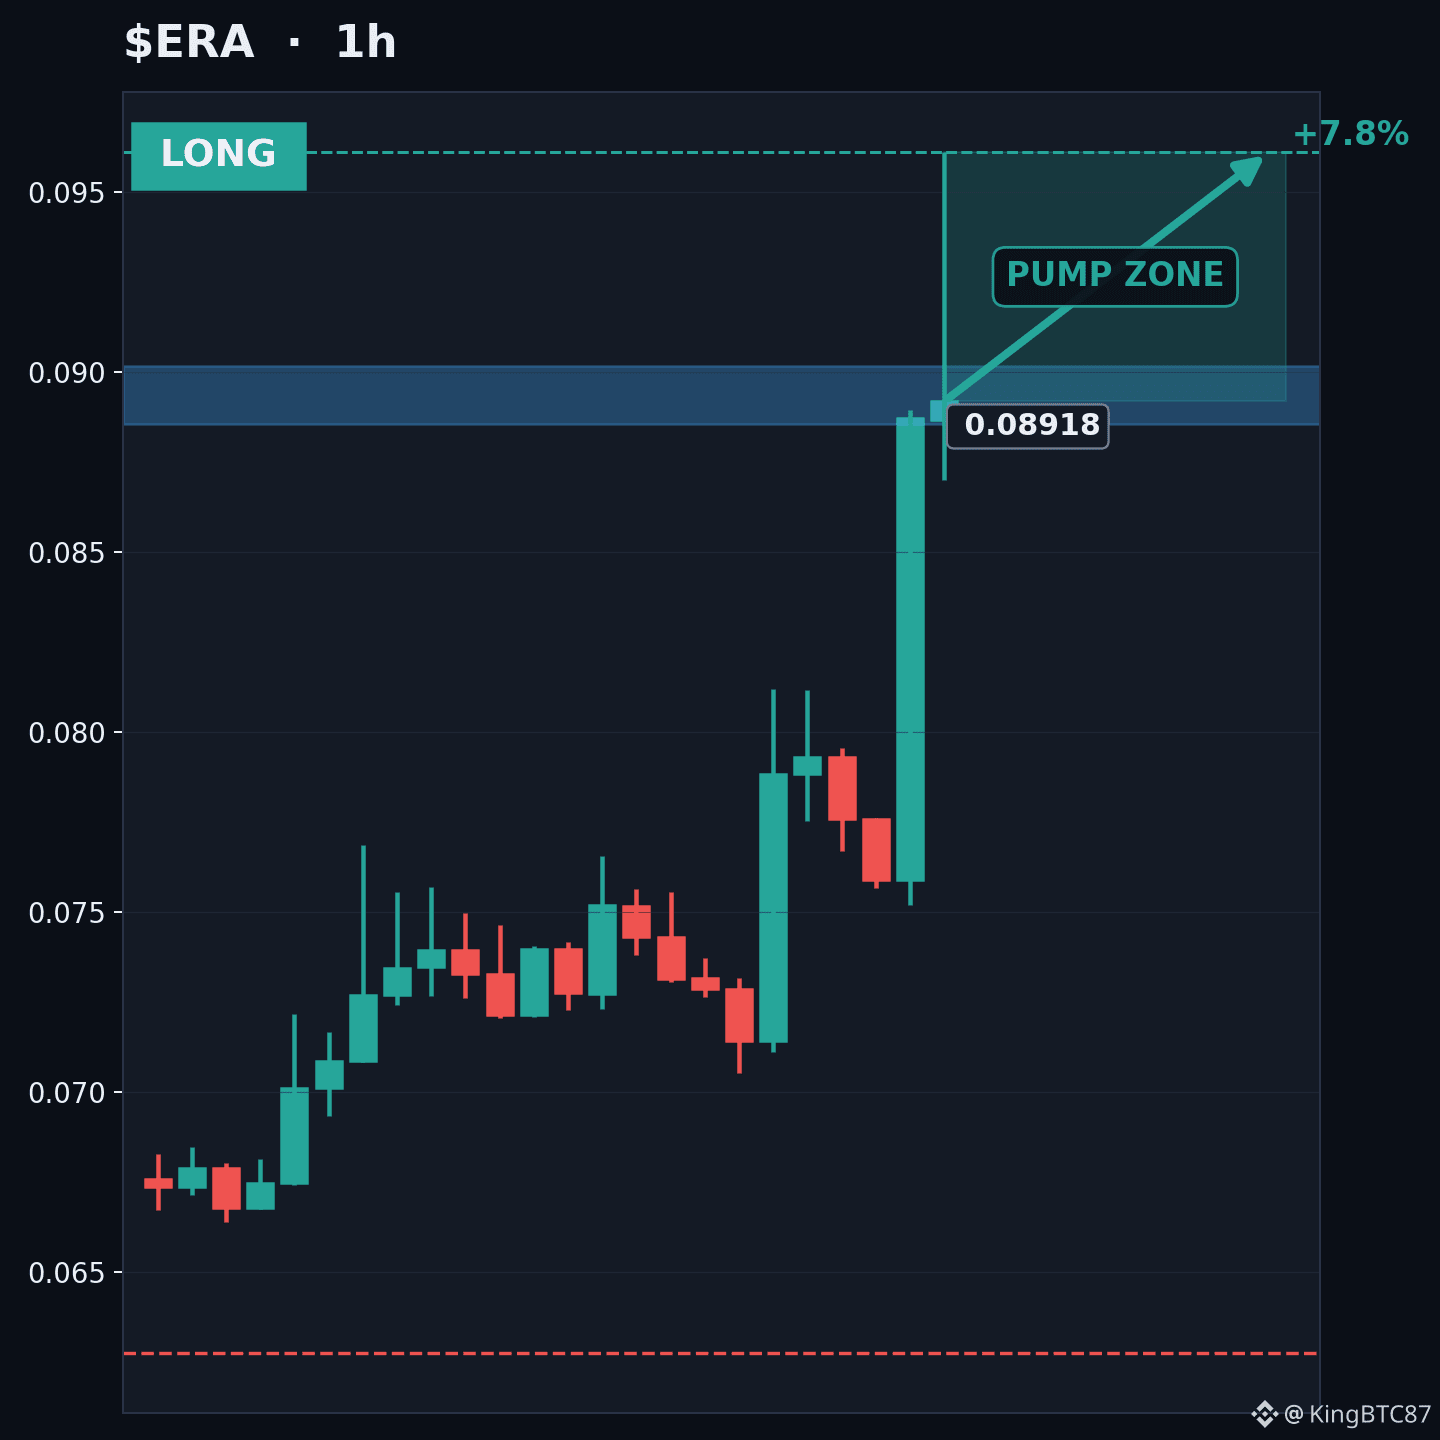
👀 $ERA closed above 0.08121 on the 1H. Is the retest worth trading?
ERA closed above 0.08121 on the latest closed candle with volume 5.16x its 20-candle average.
🟢 Bias: LONG while price holds above 0.08121
📍 Entry: 0.088567 – 0.090159
🛑 Stop: 0.062764 (29.8% from entry)
🎯 TP1: 0.0961 (+7.5%)
📊 R:R to TP1: 0.25:1
Why now?
• EMA20 0.076465 > EMA50 0.072865 > EMA200 0.068471: bullish trend structure
⚠️ Invalid below 0.062764, or on a close back under 0.08121. Do not chase outside the entry zone.
Chase it, wait for the retest, or pass on ERA?
#CryptoTrading
Not financial advice. Do your own research and size risk responsibly.
👀 $ERA closed above 0.08121 on the 1H. Is the retest worth trading?
ERA closed above 0.08121 on the latest closed candle with volume 5.16x its 20-candle average.
🟢 Bias: LONG while price holds above 0.08121
📍 Entry: 0.088567 – 0.090159
🛑 Stop: 0.062764 (29.8% from entry)
🎯 TP1: 0.0961 (+7.5%)
📊 R:R to TP1: 0.25:1
Why now?
• EMA20 0.076465 > EMA50 0.072865 > EMA200 0.068471: bullish trend structure
⚠️ Invalid below 0.062764, or on a close back under 0.08121. Do not chase outside the entry zone.
Chase it, wait for the retest, or pass on ERA?
#CryptoTrading
Not financial advice. Do your own research and size risk responsibly.
ERA closed above 0.08121 on the latest closed candle with volume 5.16x its 20-candle average.
🟢 Bias: LONG while price holds above 0.08121
📍 Entry: 0.088567 – 0.090159
🛑 Stop: 0.062764 (29.8% from entry)
🎯 TP1: 0.0961 (+7.5%)
📊 R:R to TP1: 0.25:1
Why now?
• EMA20 0.076465 > EMA50 0.072865 > EMA200 0.068471: bullish trend structure
⚠️ Invalid below 0.062764, or on a close back under 0.08121. Do not chase outside the entry zone.
Chase it, wait for the retest, or pass on ERA?
#CryptoTrading
Not financial advice. Do your own research and size risk responsibly.
6
·
--
Ver traducción
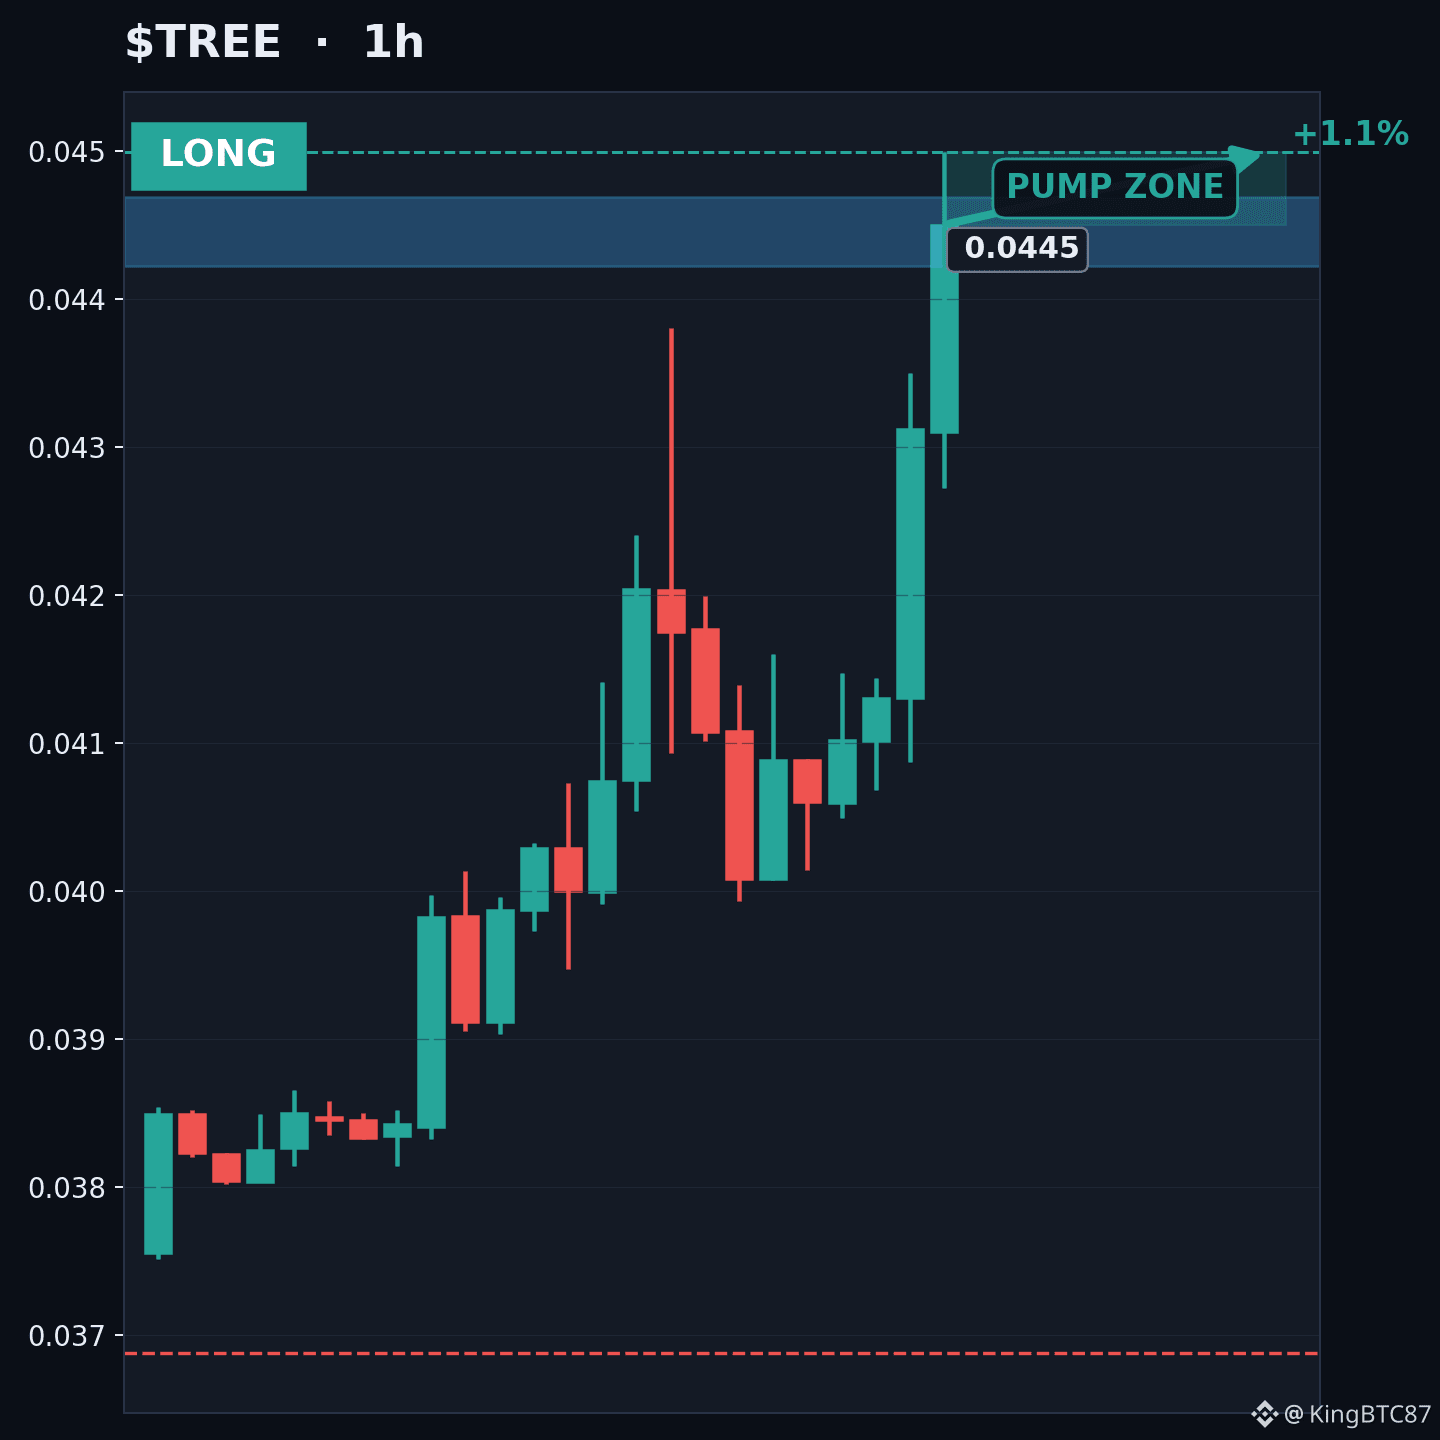
📈 $TREE LONG on the 1H: 5 data points line up
🟢 Bias: LONG
📍 Entry: 0.04422 – 0.044689
🛑 Stop: 0.036876 (17.0% from entry)
🎯 TP1: 0.04499 (+1.2%)
📊 R:R to TP1: 0.07:1
Technical evidence:
• Price is pressing 0.0438, but no closed 1H candle is above it yet. This is a potential breakout, not a confirmed one
• Current 1H volume is 3.32x its 20-candle average
• EMA20 0.040808 > EMA50 0.039568 > EMA200 0.038583: bullish trend structure
• Nearest resistance 0.04499 is 1.2% from entry
• 1H regime is trending (ADX 60.0)
Indicators:
EMA20/50/200: 0.040808 / 0.039568 / 0.038583
RSI 76.1 | ATR 0.001172 | Volume 3.32x average
Watch-outs:
• RSI 76.1 is already overbought, so the move may be stretched.
Technical Setup Score: 95/95 (a rule-based rating of the setup, not a win probability)
⚠️ Invalid below 0.036876. Do not chase outside the entry zone.
Which of these data points would you weigh most?
#CryptoTrading
Any setup can fail. DYOR and manage your risk.
📈 $TREE LONG on the 1H: 5 data points line up
🟢 Bias: LONG
📍 Entry: 0.04422 – 0.044689
🛑 Stop: 0.036876 (17.0% from entry)
🎯 TP1: 0.04499 (+1.2%)
📊 R:R to TP1: 0.07:1
Technical evidence:
• Price is pressing 0.0438, but no closed 1H candle is above it yet. This is a potential breakout, not a confirmed one
• Current 1H volume is 3.32x its 20-candle average
• EMA20 0.040808 > EMA50 0.039568 > EMA200 0.038583: bullish trend structure
• Nearest resistance 0.04499 is 1.2% from entry
• 1H regime is trending (ADX 60.0)
Indicators:
EMA20/50/200: 0.040808 / 0.039568 / 0.038583
RSI 76.1 | ATR 0.001172 | Volume 3.32x average
Watch-outs:
• RSI 76.1 is already overbought, so the move may be stretched.
Technical Setup Score: 95/95 (a rule-based rating of the setup, not a win probability)
⚠️ Invalid below 0.036876. Do not chase outside the entry zone.
Which of these data points would you weigh most?
#CryptoTrading
Any setup can fail. DYOR and manage your risk.
🟢 Bias: LONG
📍 Entry: 0.04422 – 0.044689
🛑 Stop: 0.036876 (17.0% from entry)
🎯 TP1: 0.04499 (+1.2%)
📊 R:R to TP1: 0.07:1
Technical evidence:
• Price is pressing 0.0438, but no closed 1H candle is above it yet. This is a potential breakout, not a confirmed one
• Current 1H volume is 3.32x its 20-candle average
• EMA20 0.040808 > EMA50 0.039568 > EMA200 0.038583: bullish trend structure
• Nearest resistance 0.04499 is 1.2% from entry
• 1H regime is trending (ADX 60.0)
Indicators:
EMA20/50/200: 0.040808 / 0.039568 / 0.038583
RSI 76.1 | ATR 0.001172 | Volume 3.32x average
Watch-outs:
• RSI 76.1 is already overbought, so the move may be stretched.
Technical Setup Score: 95/95 (a rule-based rating of the setup, not a win probability)
⚠️ Invalid below 0.036876. Do not chase outside the entry zone.
Which of these data points would you weigh most?
#CryptoTrading
Any setup can fail. DYOR and manage your risk.
4
·
--
Ver traducción
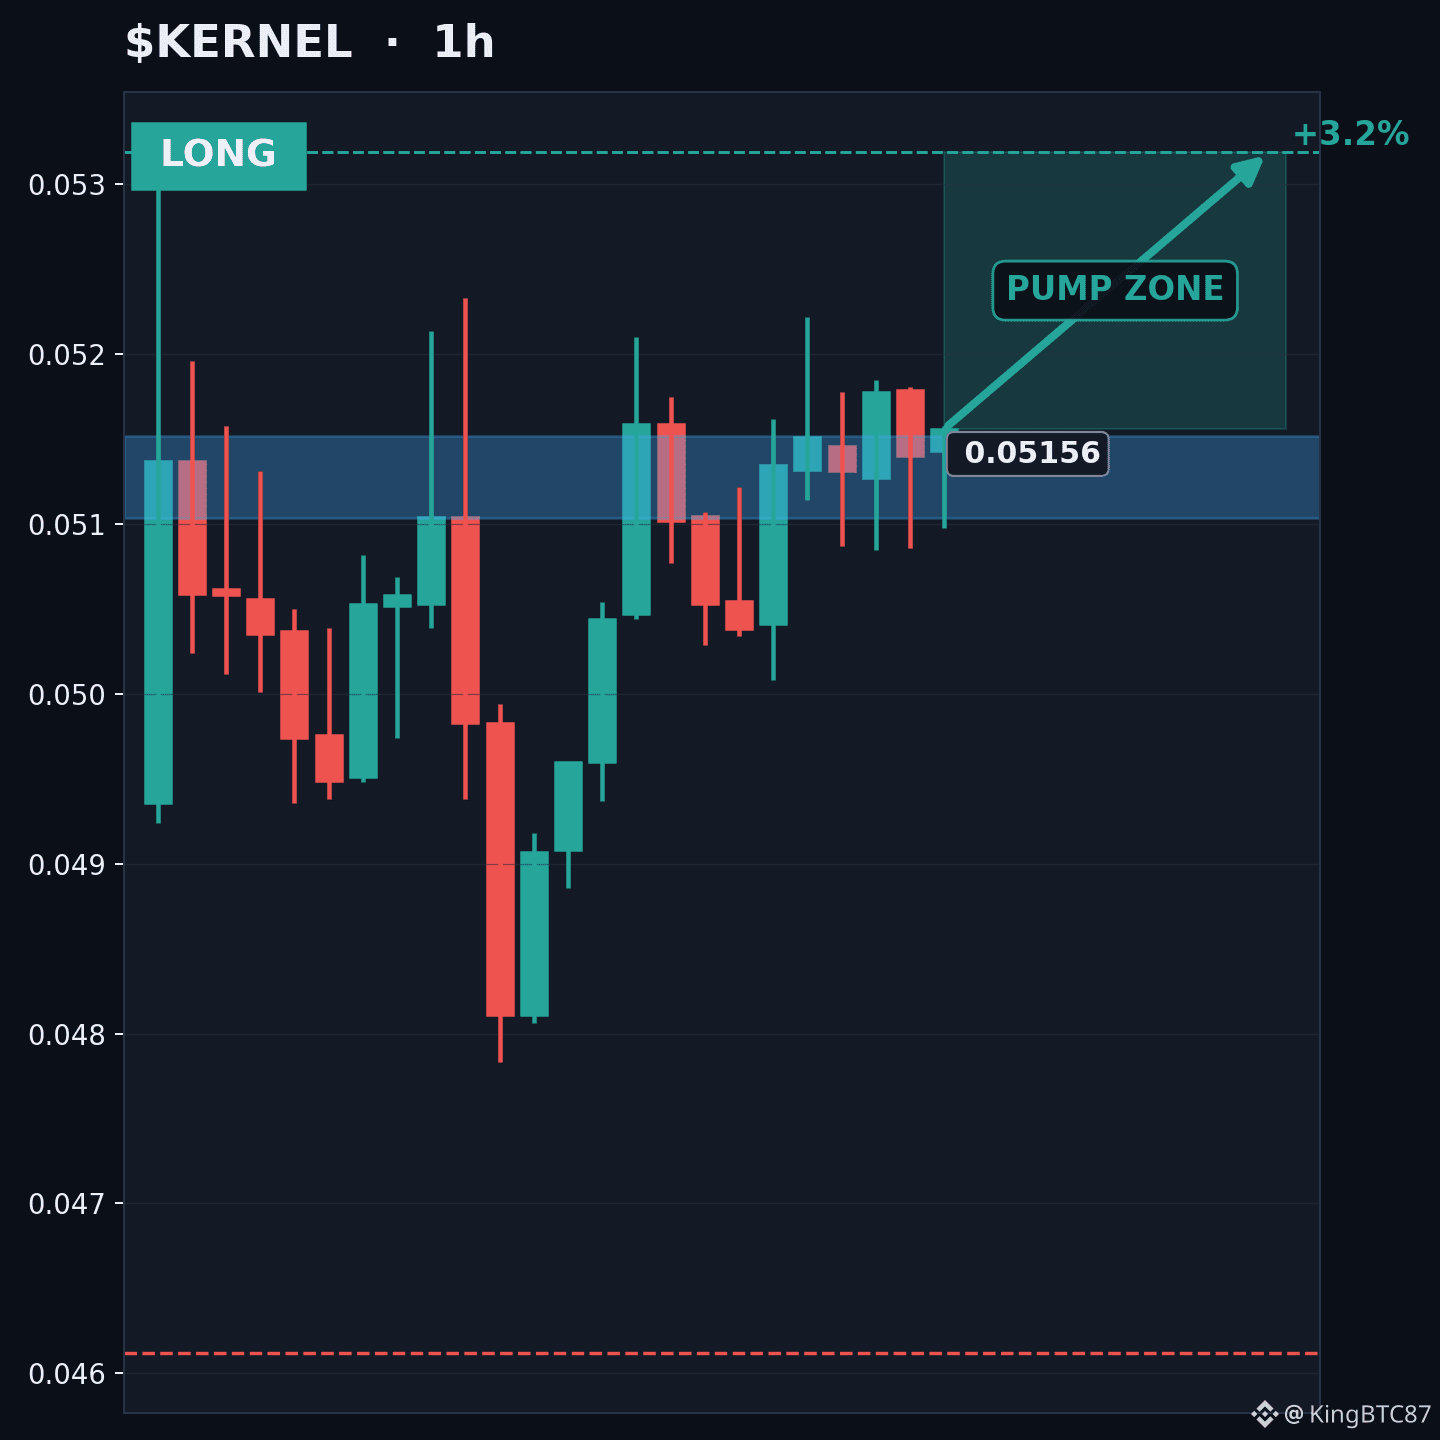
📈 $KERNEL LONG on the 1H: 4 data points line up
🟢 Bias: LONG
📍 Entry: 0.051038 – 0.05152
🛑 Stop: 0.046119 (10.1% from entry)
🎯 TP1: 0.05319 (+3.7%)
📊 R:R to TP1: 0.37:1
Technical evidence:
• EMA20 0.050687 > EMA50 0.04941 > EMA200 0.046146: bullish trend structure
• RSI 59.4 shows bullish momentum without being stretched
• Nearest resistance 0.05319 is 3.7% from entry
• 1H regime is trending (ADX 33.2)
Indicators:
EMA20/50/200: 0.050687 / 0.04941 / 0.046146
RSI 59.4 | ATR 0.001205 | Volume 0.29x average
Watch-outs:
• Volume is only 0.29x average, so participation is thin.
Technical Setup Score: 95/95 (a rule-based rating of the setup, not a win probability)
⚠️ Invalid below 0.046119. Do not chase outside the entry zone.
Which of these data points would you weigh most?
#CryptoTrading
Analysis, not advice. Trade your own plan and never risk more than you can afford to lose.
📈 $KERNEL LONG on the 1H: 4 data points line up
🟢 Bias: LONG
📍 Entry: 0.051038 – 0.05152
🛑 Stop: 0.046119 (10.1% from entry)
🎯 TP1: 0.05319 (+3.7%)
📊 R:R to TP1: 0.37:1
Technical evidence:
• EMA20 0.050687 > EMA50 0.04941 > EMA200 0.046146: bullish trend structure
• RSI 59.4 shows bullish momentum without being stretched
• Nearest resistance 0.05319 is 3.7% from entry
• 1H regime is trending (ADX 33.2)
Indicators:
EMA20/50/200: 0.050687 / 0.04941 / 0.046146
RSI 59.4 | ATR 0.001205 | Volume 0.29x average
Watch-outs:
• Volume is only 0.29x average, so participation is thin.
Technical Setup Score: 95/95 (a rule-based rating of the setup, not a win probability)
⚠️ Invalid below 0.046119. Do not chase outside the entry zone.
Which of these data points would you weigh most?
#CryptoTrading
Analysis, not advice. Trade your own plan and never risk more than you can afford to lose.
🟢 Bias: LONG
📍 Entry: 0.051038 – 0.05152
🛑 Stop: 0.046119 (10.1% from entry)
🎯 TP1: 0.05319 (+3.7%)
📊 R:R to TP1: 0.37:1
Technical evidence:
• EMA20 0.050687 > EMA50 0.04941 > EMA200 0.046146: bullish trend structure
• RSI 59.4 shows bullish momentum without being stretched
• Nearest resistance 0.05319 is 3.7% from entry
• 1H regime is trending (ADX 33.2)
Indicators:
EMA20/50/200: 0.050687 / 0.04941 / 0.046146
RSI 59.4 | ATR 0.001205 | Volume 0.29x average
Watch-outs:
• Volume is only 0.29x average, so participation is thin.
Technical Setup Score: 95/95 (a rule-based rating of the setup, not a win probability)
⚠️ Invalid below 0.046119. Do not chase outside the entry zone.
Which of these data points would you weigh most?
#CryptoTrading
Analysis, not advice. Trade your own plan and never risk more than you can afford to lose.
1
·
--
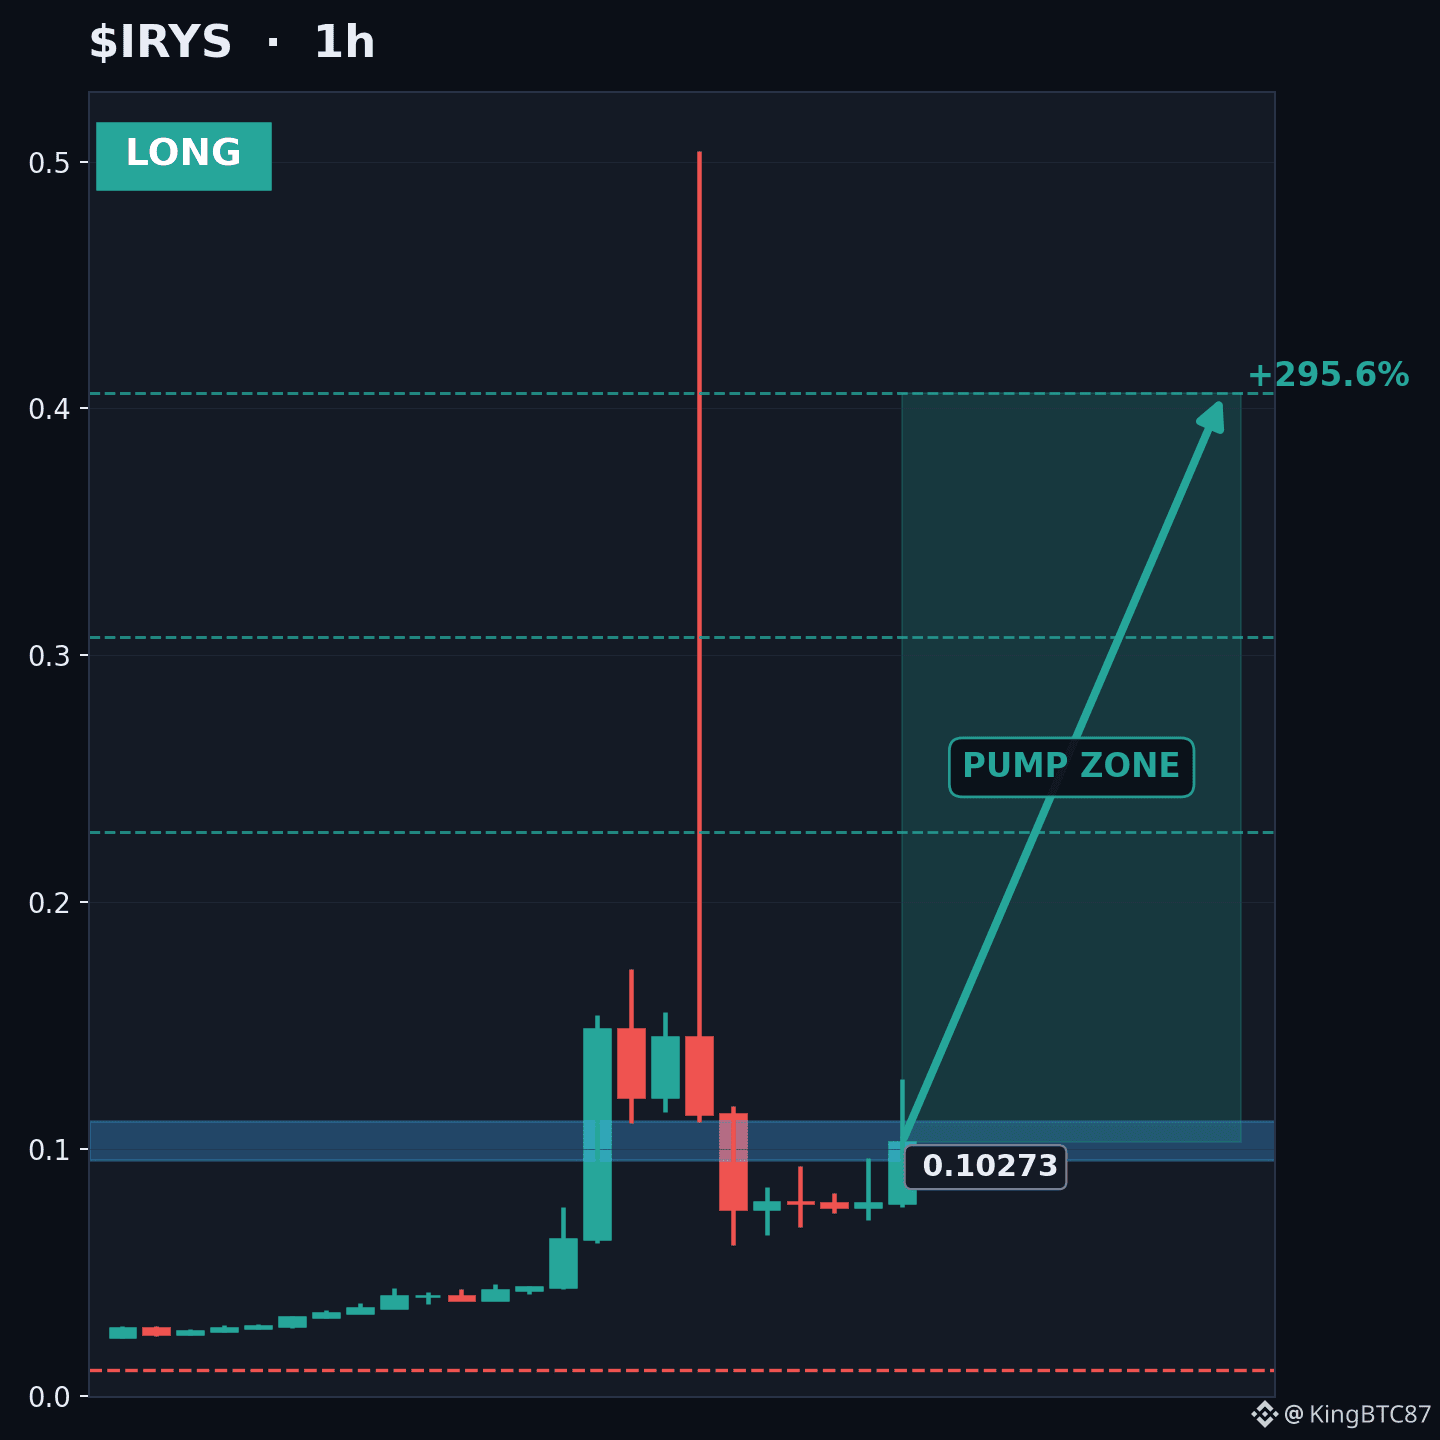
📈 $IRYS LARGO en 1H: 5 indicadores coinciden
🟢 Sesgo: LARGO
📍 Entrada: 0.095678 – 0.111395
🛑 Stop: 0.010442 (89.9% desde la entrada)
🎯 TP1: 0.228216 (+120.4%)
🎯 TP2: 0.307406 (+196.9%)
🎯 TP3: 0.406395 (+292.5%)
📊 Riesgo/beneficio hasta TP2: 2.19:1
Evidencia técnica:
• EMA20 0.074708 > EMA50 0.051253 > EMA200 0.02611: estructura de tendencia alcista
• La relación riesgo/beneficio hasta TP2 es de 2.19:1 desde el punto medio de la zona de entrada
• RSI 62.7 muestra un impulso alcista sin estar sobreextendido
• La resistencia más cercana, en 0.50406, está a un 386.8% de la entrada
• El régimen de 1H muestra tendencia (ADX 87.9)
Indicadores:
EMA20/50/200: 0.074708 / 0.051253 / 0.02611
RSI 62.7 | ATR 0.039291 | Volumen: 0.5x el promedio
Advertencias:
• El volumen es de solo 0.5x el promedio, así que la participación es escasa.
Puntuación de la configuración técnica: 95/95 (calificación basada en reglas de la configuración, no es una probabilidad de éxito)
⚠️ La configuración queda invalidada por debajo de 0.010442. No persigas el precio fuera de la zona de entrada.
¿Te convencen estas señales o le falta algo a IRYS?
#CryptoTrading
Cualquier configuración puede fallar. Investiga por tu cuenta y gestiona el riesgo.
📈 $IRYS LARGO en 1H: 5 indicadores coinciden
🟢 Sesgo: LARGO
📍 Entrada: 0.095678 – 0.111395
🛑 Stop: 0.010442 (89.9% desde la entrada)
🎯 TP1: 0.228216 (+120.4%)
🎯 TP2: 0.307406 (+196.9%)
🎯 TP3: 0.406395 (+292.5%)
📊 Riesgo/beneficio hasta TP2: 2.19:1
Evidencia técnica:
• EMA20 0.074708 > EMA50 0.051253 > EMA200 0.02611: estructura de tendencia alcista
• La relación riesgo/beneficio hasta TP2 es de 2.19:1 desde el punto medio de la zona de entrada
• RSI 62.7 muestra un impulso alcista sin estar sobreextendido
• La resistencia más cercana, en 0.50406, está a un 386.8% de la entrada
• El régimen de 1H muestra tendencia (ADX 87.9)
Indicadores:
EMA20/50/200: 0.074708 / 0.051253 / 0.02611
RSI 62.7 | ATR 0.039291 | Volumen: 0.5x el promedio
Advertencias:
• El volumen es de solo 0.5x el promedio, así que la participación es escasa.
Puntuación de la configuración técnica: 95/95 (calificación basada en reglas de la configuración, no es una probabilidad de éxito)
⚠️ La configuración queda invalidada por debajo de 0.010442. No persigas el precio fuera de la zona de entrada.
¿Te convencen estas señales o le falta algo a IRYS?
#CryptoTrading
Cualquier configuración puede fallar. Investiga por tu cuenta y gestiona el riesgo.
🟢 Sesgo: LARGO
📍 Entrada: 0.095678 – 0.111395
🛑 Stop: 0.010442 (89.9% desde la entrada)
🎯 TP1: 0.228216 (+120.4%)
🎯 TP2: 0.307406 (+196.9%)
🎯 TP3: 0.406395 (+292.5%)
📊 Riesgo/beneficio hasta TP2: 2.19:1
Evidencia técnica:
• EMA20 0.074708 > EMA50 0.051253 > EMA200 0.02611: estructura de tendencia alcista
• La relación riesgo/beneficio hasta TP2 es de 2.19:1 desde el punto medio de la zona de entrada
• RSI 62.7 muestra un impulso alcista sin estar sobreextendido
• La resistencia más cercana, en 0.50406, está a un 386.8% de la entrada
• El régimen de 1H muestra tendencia (ADX 87.9)
Indicadores:
EMA20/50/200: 0.074708 / 0.051253 / 0.02611
RSI 62.7 | ATR 0.039291 | Volumen: 0.5x el promedio
Advertencias:
• El volumen es de solo 0.5x el promedio, así que la participación es escasa.
Puntuación de la configuración técnica: 95/95 (calificación basada en reglas de la configuración, no es una probabilidad de éxito)
⚠️ La configuración queda invalidada por debajo de 0.010442. No persigas el precio fuera de la zona de entrada.
¿Te convencen estas señales o le falta algo a IRYS?
#CryptoTrading
Cualquier configuración puede fallar. Investiga por tu cuenta y gestiona el riesgo.
·
--
Ver traducción
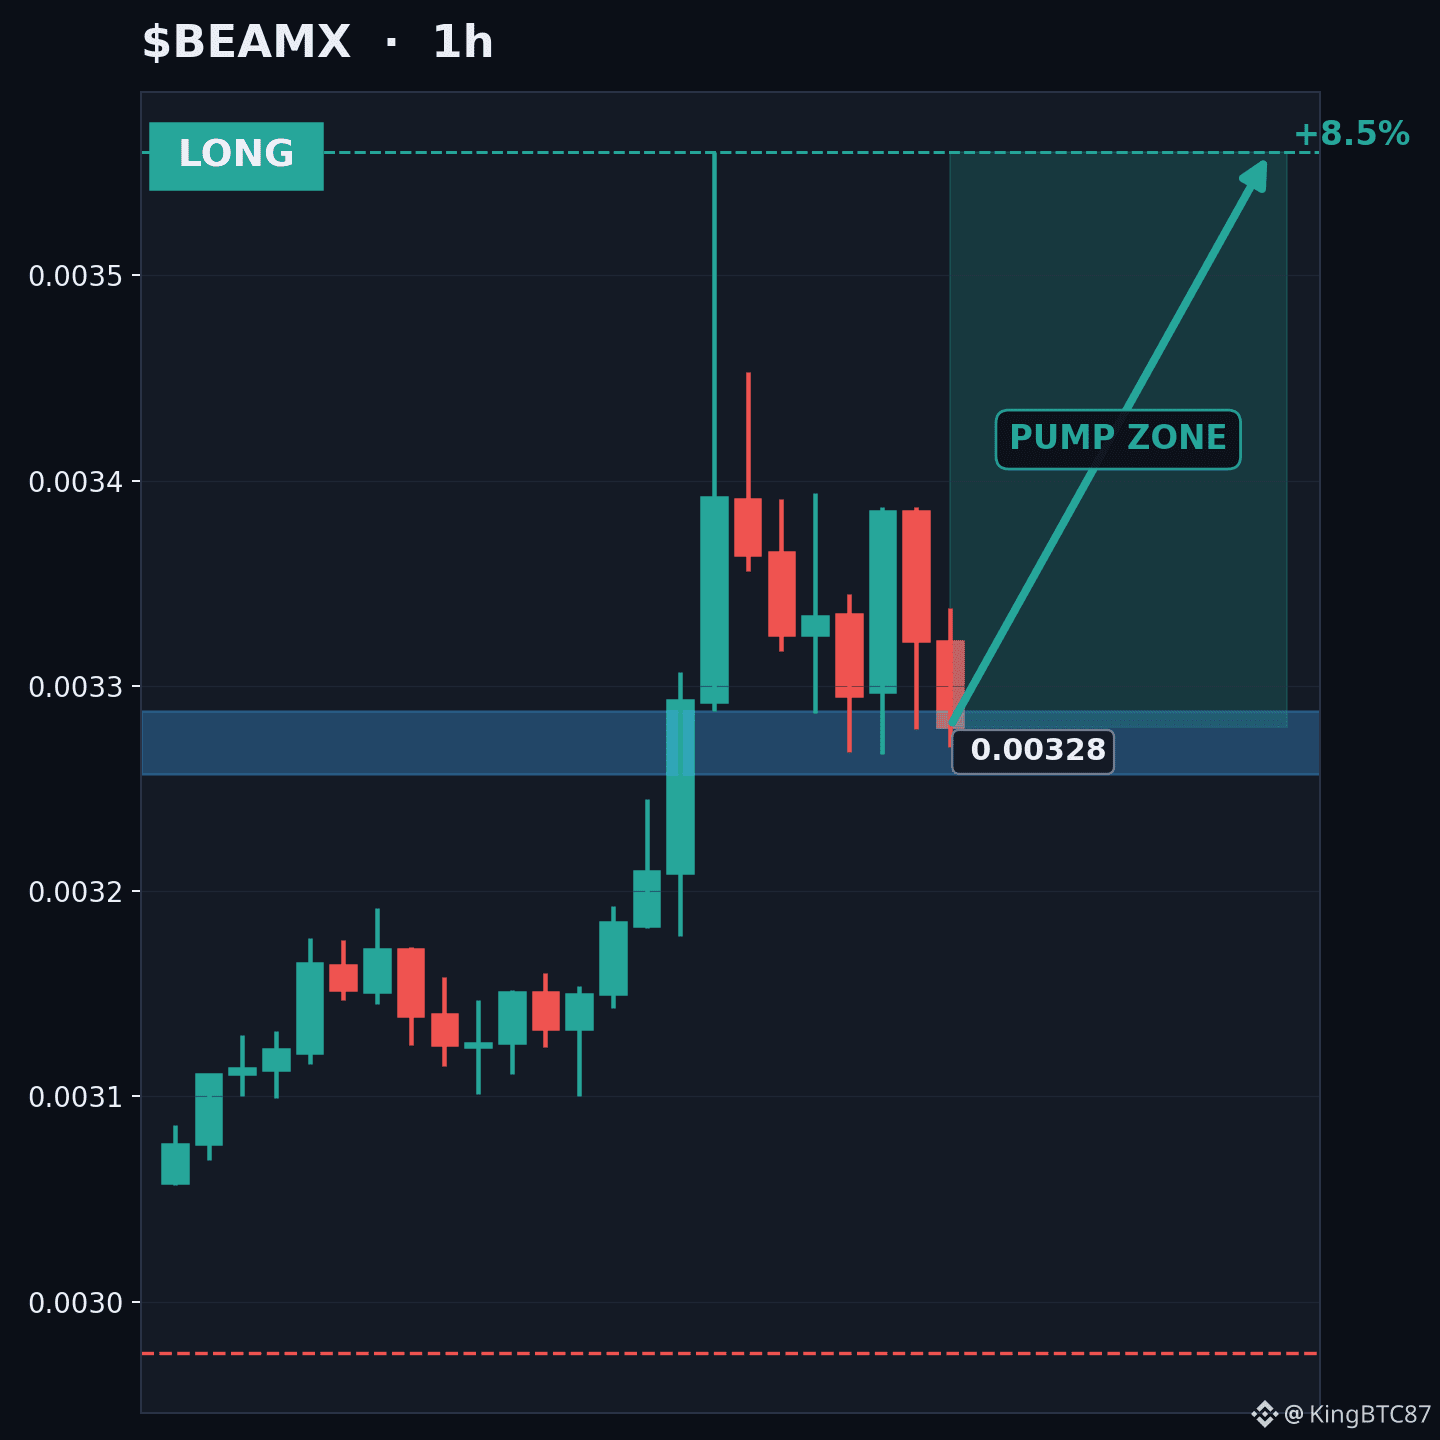
📈 $BEAMX LONG on the 1H: 4 data points line up
🟢 Bias: LONG
📍 Entry: 0.003257 – 0.003288
🛑 Stop: 0.002975 (9.1% from entry)
🎯 TP1: 0.00356 (+8.8%)
📊 R:R to TP1: 0.97:1
Technical evidence:
• EMA20 0.003252 > EMA50 0.003185 > EMA200 0.003068: bullish trend structure
• RSI 63.0 shows bullish momentum without being stretched
• Nearest resistance 0.00356 is 8.8% from entry
• 1H regime is trending (ADX 38.0)
Indicators:
EMA20/50/200: 0.003252 / 0.003185 / 0.003068
RSI 63.0 | ATR 0.000077 | Volume 0.48x average
Watch-outs:
• Volume is only 0.48x average, so participation is thin.
Technical Setup Score: 95/95 (a rule-based rating of the setup, not a win probability)
⚠️ Invalid below 0.002975. Do not chase outside the entry zone.
Would you take this setup as is, or wait for a pullback?
#CryptoTrading
Not financial advice. Do your own research and size risk responsibly.
📈 $BEAMX LONG on the 1H: 4 data points line up
🟢 Bias: LONG
📍 Entry: 0.003257 – 0.003288
🛑 Stop: 0.002975 (9.1% from entry)
🎯 TP1: 0.00356 (+8.8%)
📊 R:R to TP1: 0.97:1
Technical evidence:
• EMA20 0.003252 > EMA50 0.003185 > EMA200 0.003068: bullish trend structure
• RSI 63.0 shows bullish momentum without being stretched
• Nearest resistance 0.00356 is 8.8% from entry
• 1H regime is trending (ADX 38.0)
Indicators:
EMA20/50/200: 0.003252 / 0.003185 / 0.003068
RSI 63.0 | ATR 0.000077 | Volume 0.48x average
Watch-outs:
• Volume is only 0.48x average, so participation is thin.
Technical Setup Score: 95/95 (a rule-based rating of the setup, not a win probability)
⚠️ Invalid below 0.002975. Do not chase outside the entry zone.
Would you take this setup as is, or wait for a pullback?
#CryptoTrading
Not financial advice. Do your own research and size risk responsibly.
🟢 Bias: LONG
📍 Entry: 0.003257 – 0.003288
🛑 Stop: 0.002975 (9.1% from entry)
🎯 TP1: 0.00356 (+8.8%)
📊 R:R to TP1: 0.97:1
Technical evidence:
• EMA20 0.003252 > EMA50 0.003185 > EMA200 0.003068: bullish trend structure
• RSI 63.0 shows bullish momentum without being stretched
• Nearest resistance 0.00356 is 8.8% from entry
• 1H regime is trending (ADX 38.0)
Indicators:
EMA20/50/200: 0.003252 / 0.003185 / 0.003068
RSI 63.0 | ATR 0.000077 | Volume 0.48x average
Watch-outs:
• Volume is only 0.48x average, so participation is thin.
Technical Setup Score: 95/95 (a rule-based rating of the setup, not a win probability)
⚠️ Invalid below 0.002975. Do not chase outside the entry zone.
Would you take this setup as is, or wait for a pullback?
#CryptoTrading
Not financial advice. Do your own research and size risk responsibly.
·
--
Ver traducción
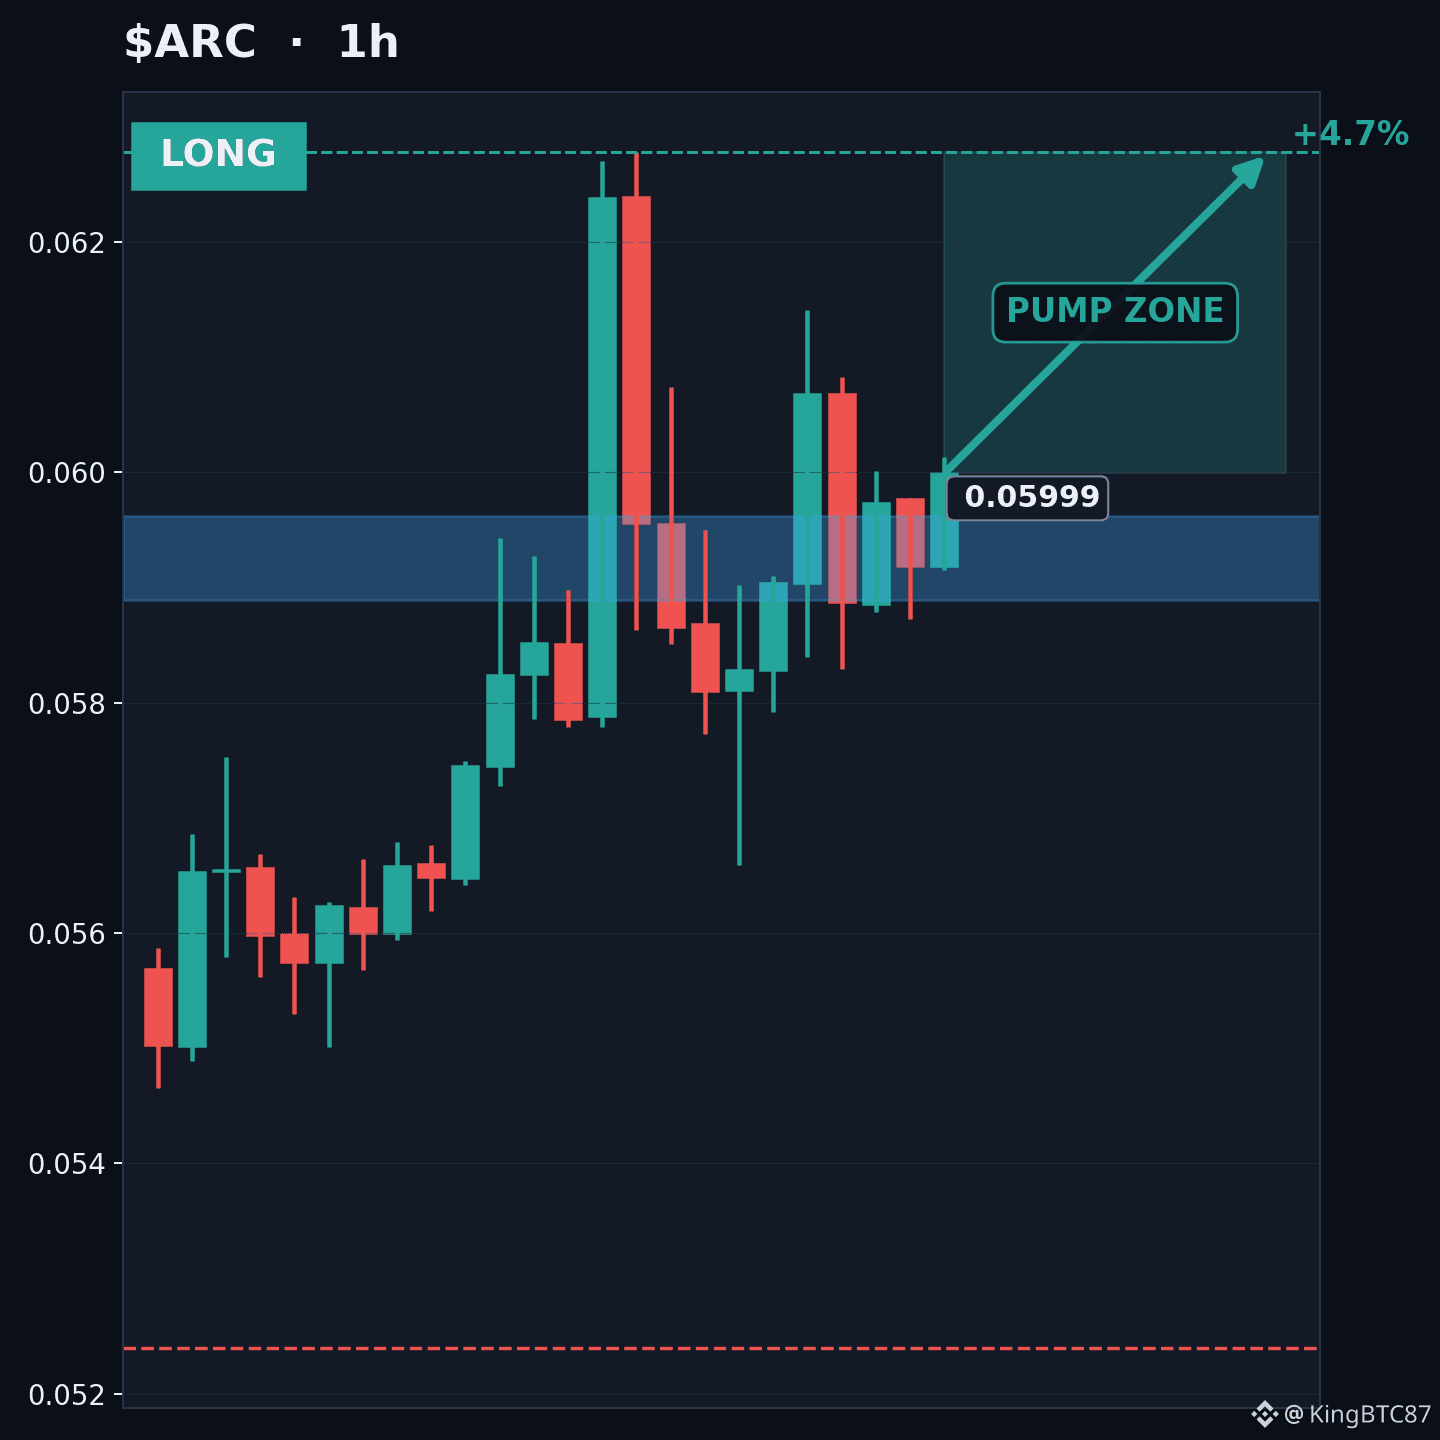
📈 $ARC LONG on the 1H: 4 data points line up
🟢 Bias: LONG
📍 Entry: 0.05889 – 0.059621
🛑 Stop: 0.052395 (11.6% from entry)
🎯 TP1: 0.06278 (+5.9%)
📊 R:R to TP1: 0.51:1
Technical evidence:
• EMA20 0.058529 > EMA50 0.057206 > EMA200 0.049668: bullish trend structure
• RSI 56.2 shows bullish momentum without being stretched
• Nearest resistance 0.06278 is 5.9% from entry
• 1H regime is trending (ADX 43.1)
Indicators:
EMA20/50/200: 0.058529 / 0.057206 / 0.049668
RSI 56.2 | ATR 0.001827 | Volume 0.26x average
Watch-outs:
• Volume is only 0.26x average, so participation is thin.
Technical Setup Score: 95/95 (a rule-based rating of the setup, not a win probability)
⚠️ Invalid below 0.052395. Do not chase outside the entry zone.
Which of these data points would you weigh most?
#CryptoTrading
Any setup can fail. DYOR and manage your risk.
📈 $ARC LONG on the 1H: 4 data points line up
🟢 Bias: LONG
📍 Entry: 0.05889 – 0.059621
🛑 Stop: 0.052395 (11.6% from entry)
🎯 TP1: 0.06278 (+5.9%)
📊 R:R to TP1: 0.51:1
Technical evidence:
• EMA20 0.058529 > EMA50 0.057206 > EMA200 0.049668: bullish trend structure
• RSI 56.2 shows bullish momentum without being stretched
• Nearest resistance 0.06278 is 5.9% from entry
• 1H regime is trending (ADX 43.1)
Indicators:
EMA20/50/200: 0.058529 / 0.057206 / 0.049668
RSI 56.2 | ATR 0.001827 | Volume 0.26x average
Watch-outs:
• Volume is only 0.26x average, so participation is thin.
Technical Setup Score: 95/95 (a rule-based rating of the setup, not a win probability)
⚠️ Invalid below 0.052395. Do not chase outside the entry zone.
Which of these data points would you weigh most?
#CryptoTrading
Any setup can fail. DYOR and manage your risk.
🟢 Bias: LONG
📍 Entry: 0.05889 – 0.059621
🛑 Stop: 0.052395 (11.6% from entry)
🎯 TP1: 0.06278 (+5.9%)
📊 R:R to TP1: 0.51:1
Technical evidence:
• EMA20 0.058529 > EMA50 0.057206 > EMA200 0.049668: bullish trend structure
• RSI 56.2 shows bullish momentum without being stretched
• Nearest resistance 0.06278 is 5.9% from entry
• 1H regime is trending (ADX 43.1)
Indicators:
EMA20/50/200: 0.058529 / 0.057206 / 0.049668
RSI 56.2 | ATR 0.001827 | Volume 0.26x average
Watch-outs:
• Volume is only 0.26x average, so participation is thin.
Technical Setup Score: 95/95 (a rule-based rating of the setup, not a win probability)
⚠️ Invalid below 0.052395. Do not chase outside the entry zone.
Which of these data points would you weigh most?
#CryptoTrading
Any setup can fail. DYOR and manage your risk.
2
·
--
Ver traducción
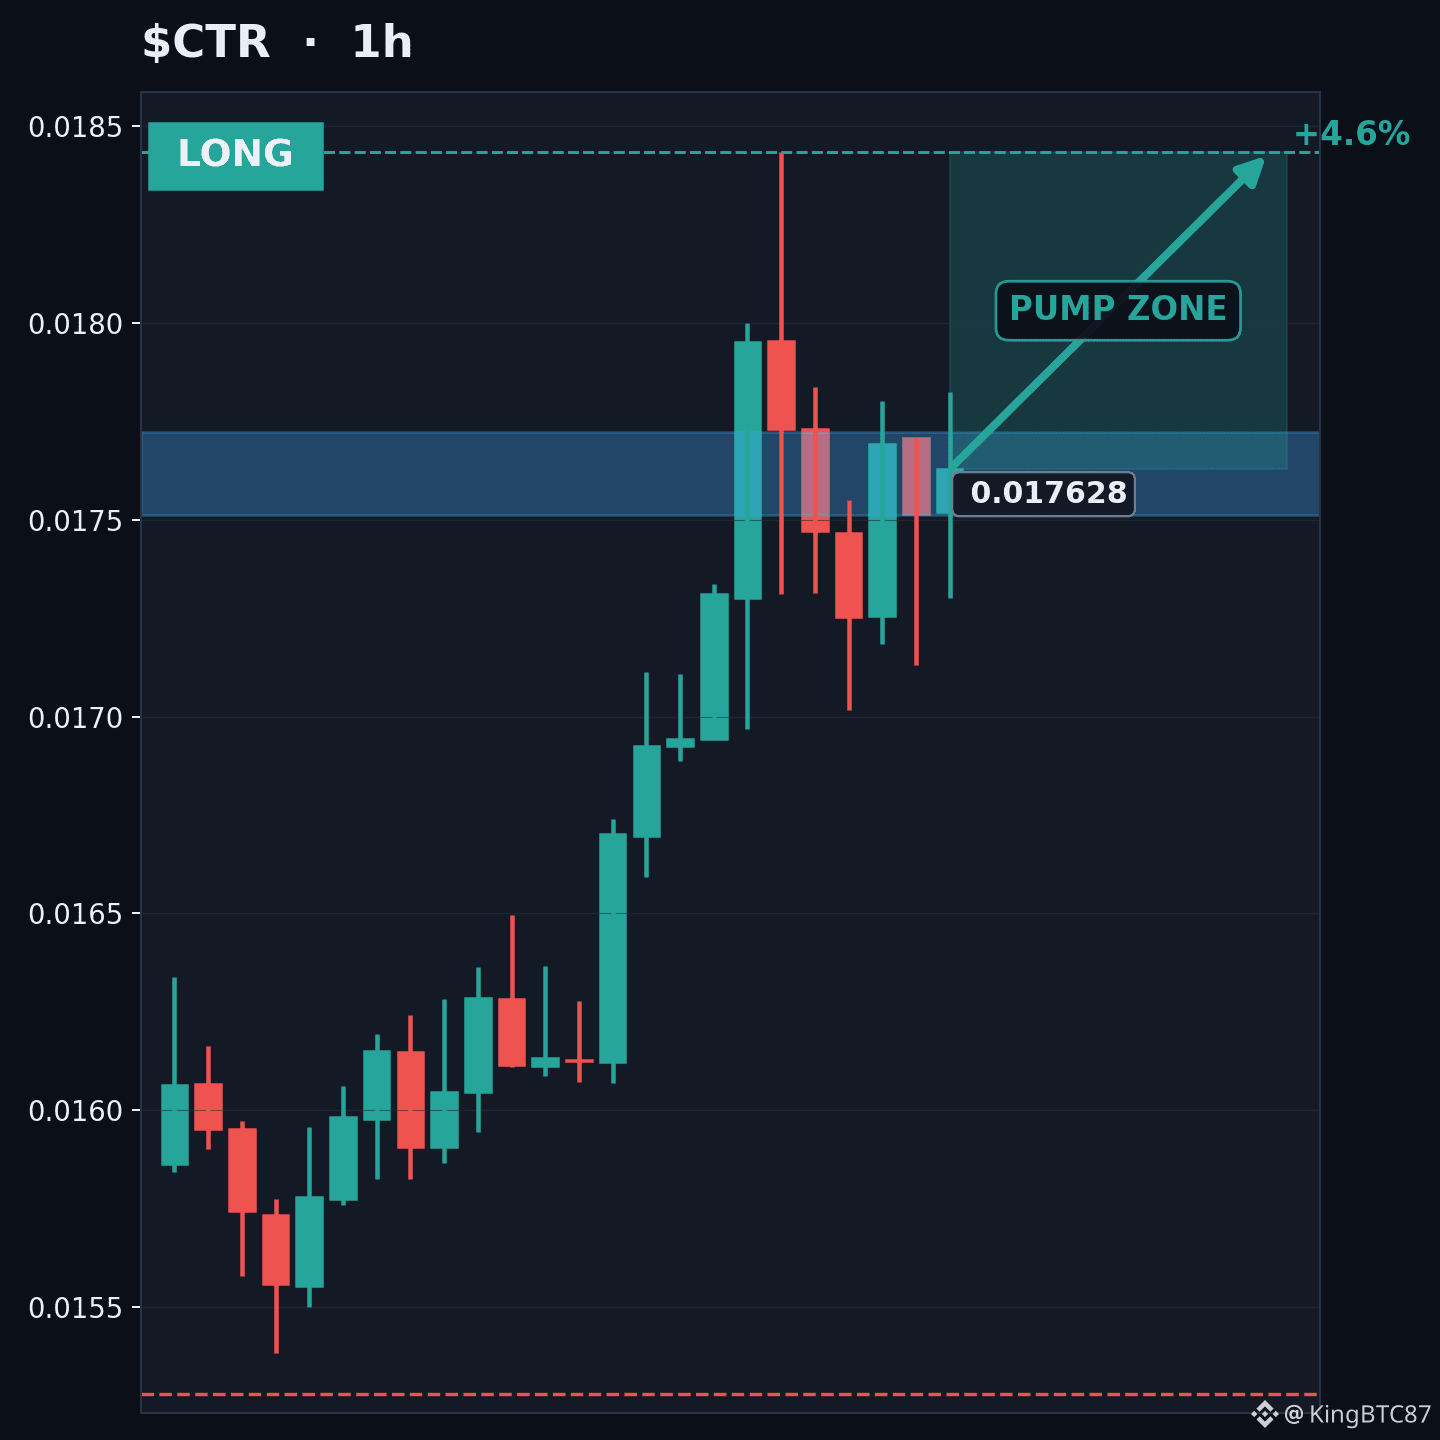
📈 $CTR LONG on the 1H: 4 data points line up
🟢 Bias: LONG
📍 Entry: 0.017513 – 0.017723
🛑 Stop: 0.015279 (13.3% from entry)
🎯 TP1: 0.018433 (+4.6%)
📊 R:R to TP1: 0.35:1
Technical evidence:
• EMA20 0.017015 > EMA50 0.016595 > EMA200 0.015441: bullish trend structure
• RSI 70.0 shows bullish momentum without being stretched
• Nearest resistance 0.018433 is 4.6% from entry
• 1H regime is trending (ADX 39.3)
Indicators:
EMA20/50/200: 0.017015 / 0.016595 / 0.015441
RSI 70.0 | ATR 0.000526 | Volume 0.57x average
Watch-outs:
• Volume is only 0.57x average, so participation is thin.
Technical Setup Score: 95/95 (a rule-based rating of the setup, not a win probability)
⚠️ Invalid below 0.015279. Do not chase outside the entry zone.
Do these signals convince you, or is something missing for CTR?
#CryptoTrading
Not financial advice. Do your own research and size risk responsibly.
📈 $CTR LONG on the 1H: 4 data points line up
🟢 Bias: LONG
📍 Entry: 0.017513 – 0.017723
🛑 Stop: 0.015279 (13.3% from entry)
🎯 TP1: 0.018433 (+4.6%)
📊 R:R to TP1: 0.35:1
Technical evidence:
• EMA20 0.017015 > EMA50 0.016595 > EMA200 0.015441: bullish trend structure
• RSI 70.0 shows bullish momentum without being stretched
• Nearest resistance 0.018433 is 4.6% from entry
• 1H regime is trending (ADX 39.3)
Indicators:
EMA20/50/200: 0.017015 / 0.016595 / 0.015441
RSI 70.0 | ATR 0.000526 | Volume 0.57x average
Watch-outs:
• Volume is only 0.57x average, so participation is thin.
Technical Setup Score: 95/95 (a rule-based rating of the setup, not a win probability)
⚠️ Invalid below 0.015279. Do not chase outside the entry zone.
Do these signals convince you, or is something missing for CTR?
#CryptoTrading
Not financial advice. Do your own research and size risk responsibly.
🟢 Bias: LONG
📍 Entry: 0.017513 – 0.017723
🛑 Stop: 0.015279 (13.3% from entry)
🎯 TP1: 0.018433 (+4.6%)
📊 R:R to TP1: 0.35:1
Technical evidence:
• EMA20 0.017015 > EMA50 0.016595 > EMA200 0.015441: bullish trend structure
• RSI 70.0 shows bullish momentum without being stretched
• Nearest resistance 0.018433 is 4.6% from entry
• 1H regime is trending (ADX 39.3)
Indicators:
EMA20/50/200: 0.017015 / 0.016595 / 0.015441
RSI 70.0 | ATR 0.000526 | Volume 0.57x average
Watch-outs:
• Volume is only 0.57x average, so participation is thin.
Technical Setup Score: 95/95 (a rule-based rating of the setup, not a win probability)
⚠️ Invalid below 0.015279. Do not chase outside the entry zone.
Do these signals convince you, or is something missing for CTR?
#CryptoTrading
Not financial advice. Do your own research and size risk responsibly.
·
--
Ver traducción
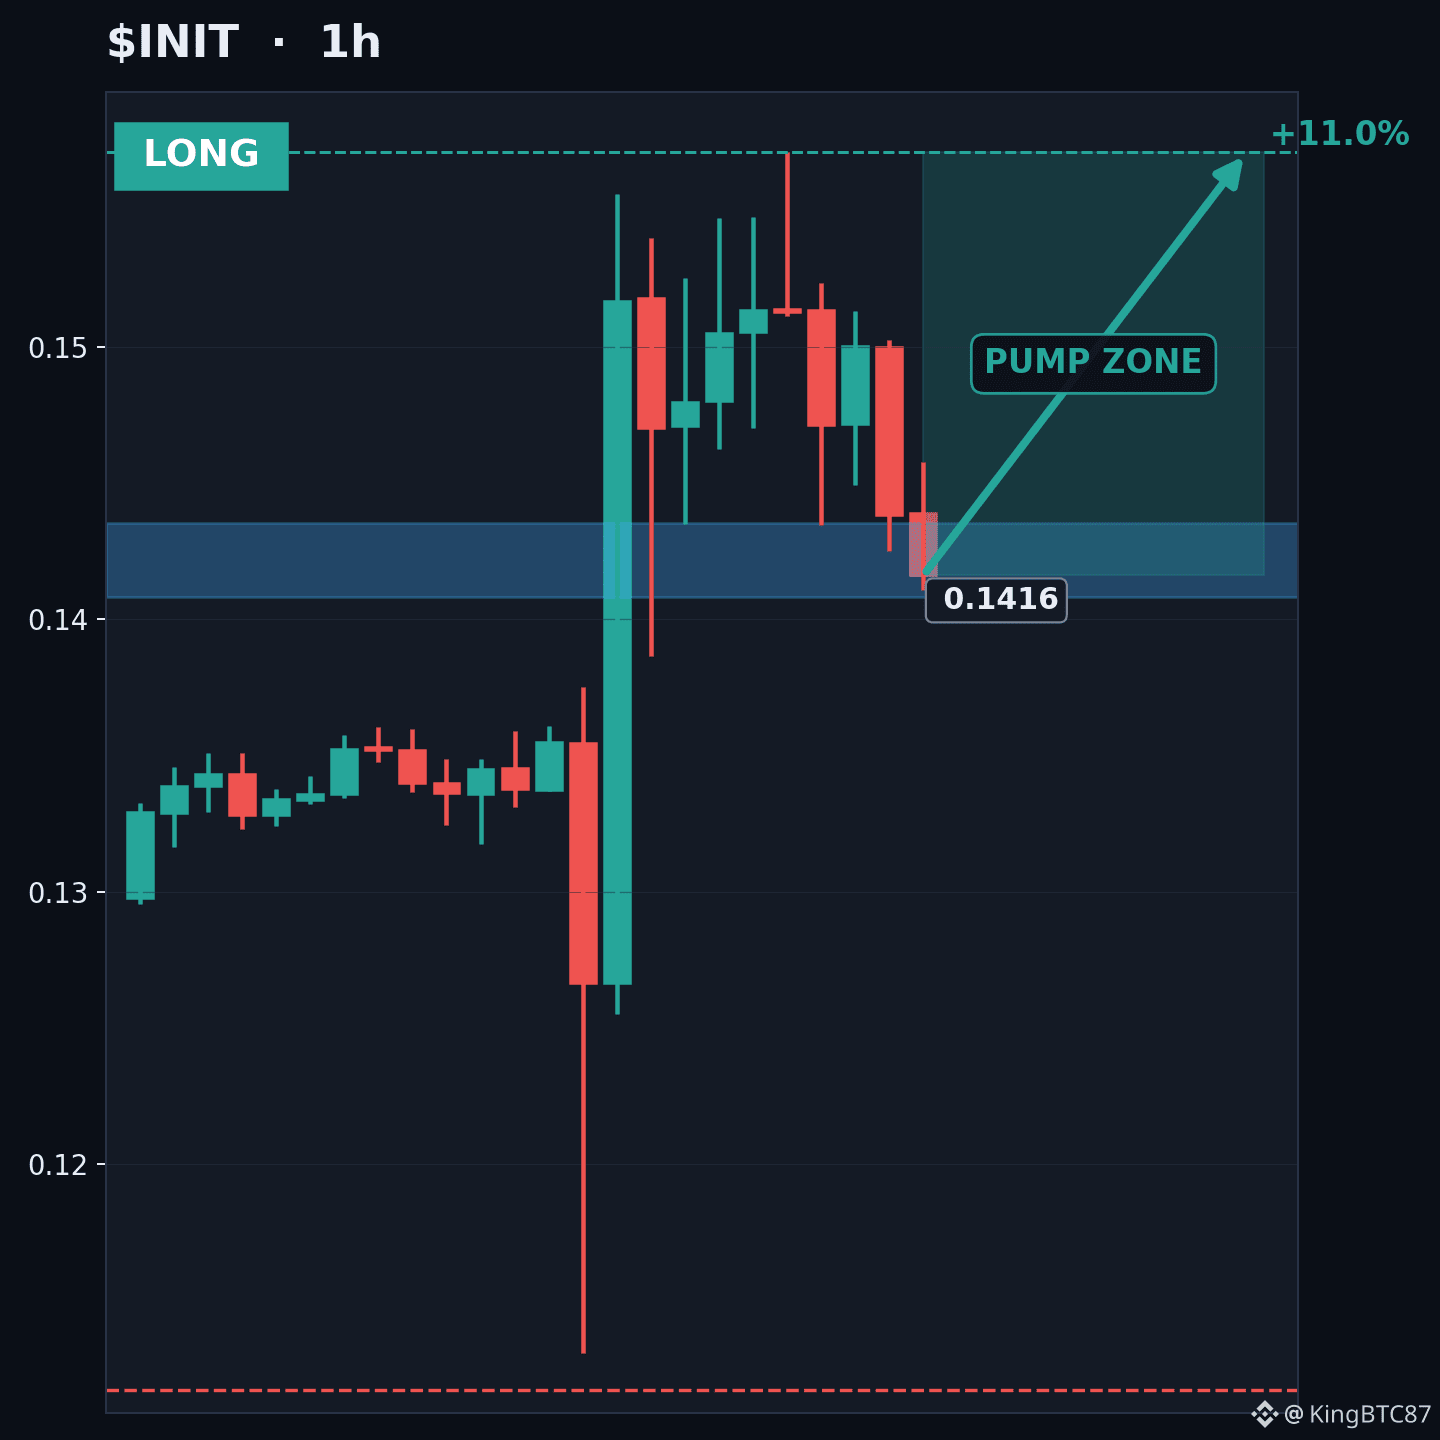
👀 $INIT is on the watchlist: a possible LONG on the 1H, not a confirmed setup yet
Technical Setup Score: 50/95. That is below the level this studio treats as a trade setup.
Why now?
• EMA20 0.14208 > EMA50 0.136076 > EMA200 0.129568: bullish trend structure
• RSI 58.0 shows bullish momentum without being stretched
Area to watch: 0.14081 – 0.143507. No stop or targets are offered until it is confirmed.
Would you add it to your watchlist?
#CryptoTrading
Any setup can fail. DYOR and manage your risk.
👀 $INIT is on the watchlist: a possible LONG on the 1H, not a confirmed setup yet
Technical Setup Score: 50/95. That is below the level this studio treats as a trade setup.
Why now?
• EMA20 0.14208 > EMA50 0.136076 > EMA200 0.129568: bullish trend structure
• RSI 58.0 shows bullish momentum without being stretched
Area to watch: 0.14081 – 0.143507. No stop or targets are offered until it is confirmed.
Would you add it to your watchlist?
#CryptoTrading
Any setup can fail. DYOR and manage your risk.
Technical Setup Score: 50/95. That is below the level this studio treats as a trade setup.
Why now?
• EMA20 0.14208 > EMA50 0.136076 > EMA200 0.129568: bullish trend structure
• RSI 58.0 shows bullish momentum without being stretched
Area to watch: 0.14081 – 0.143507. No stop or targets are offered until it is confirmed.
Would you add it to your watchlist?
#CryptoTrading
Any setup can fail. DYOR and manage your risk.
·
--
Ver traducción
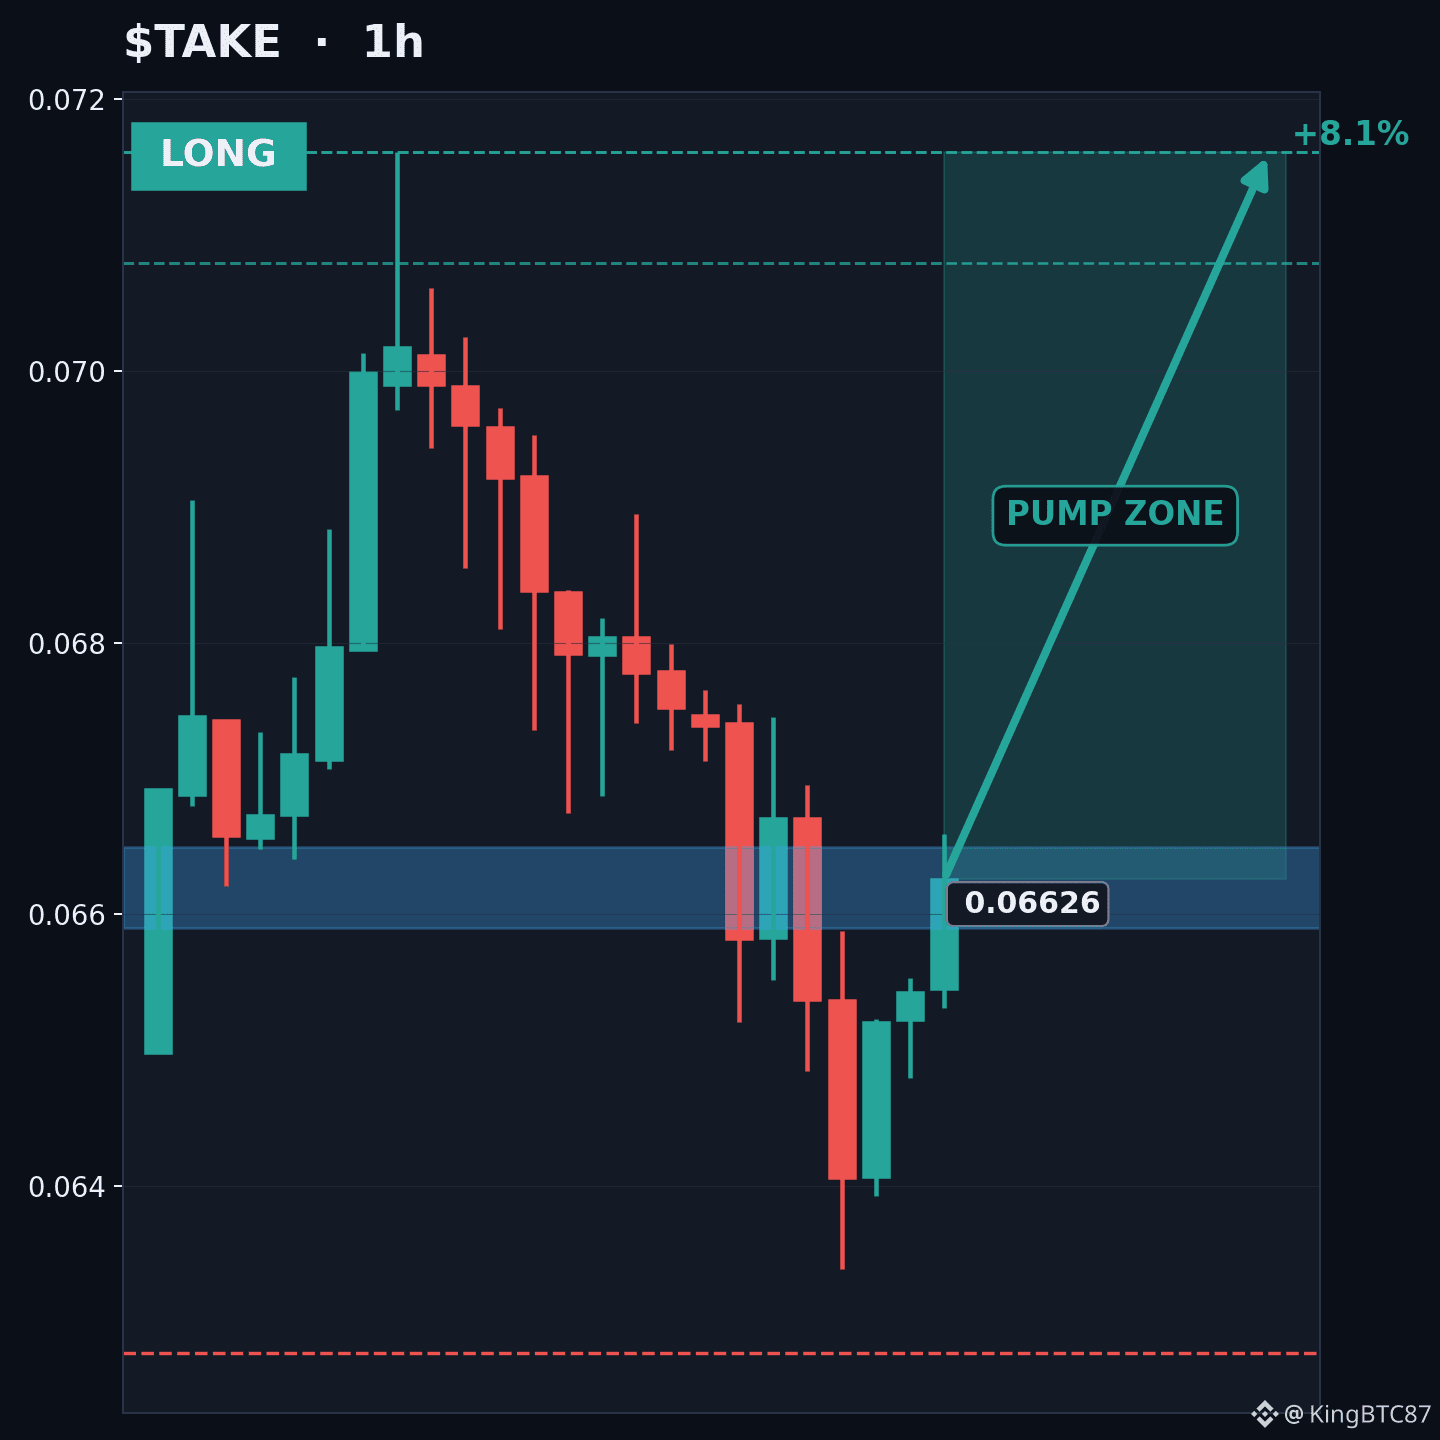
👀 $TAKE is on the watchlist: a possible LONG on the 1H, not a confirmed setup yet
Technical Setup Score: 50/95. That is below the level this studio treats as a trade setup.
Why now?
• RSI 34.0 is oversold; the last closed candle turned up
• EMA20 0.066541 > EMA50 0.065971 > EMA200 0.061364: bullish trend structure
Area to watch: 0.0659 – 0.066494. No stop or targets are offered until it is confirmed.
Would you add it to your watchlist?
#CryptoTrading
Any setup can fail. DYOR and manage your risk.
👀 $TAKE is on the watchlist: a possible LONG on the 1H, not a confirmed setup yet
Technical Setup Score: 50/95. That is below the level this studio treats as a trade setup.
Why now?
• RSI 34.0 is oversold; the last closed candle turned up
• EMA20 0.066541 > EMA50 0.065971 > EMA200 0.061364: bullish trend structure
Area to watch: 0.0659 – 0.066494. No stop or targets are offered until it is confirmed.
Would you add it to your watchlist?
#CryptoTrading
Any setup can fail. DYOR and manage your risk.
Technical Setup Score: 50/95. That is below the level this studio treats as a trade setup.
Why now?
• RSI 34.0 is oversold; the last closed candle turned up
• EMA20 0.066541 > EMA50 0.065971 > EMA200 0.061364: bullish trend structure
Area to watch: 0.0659 – 0.066494. No stop or targets are offered until it is confirmed.
Would you add it to your watchlist?
#CryptoTrading
Any setup can fail. DYOR and manage your risk.
1
·
--
Ver traducción
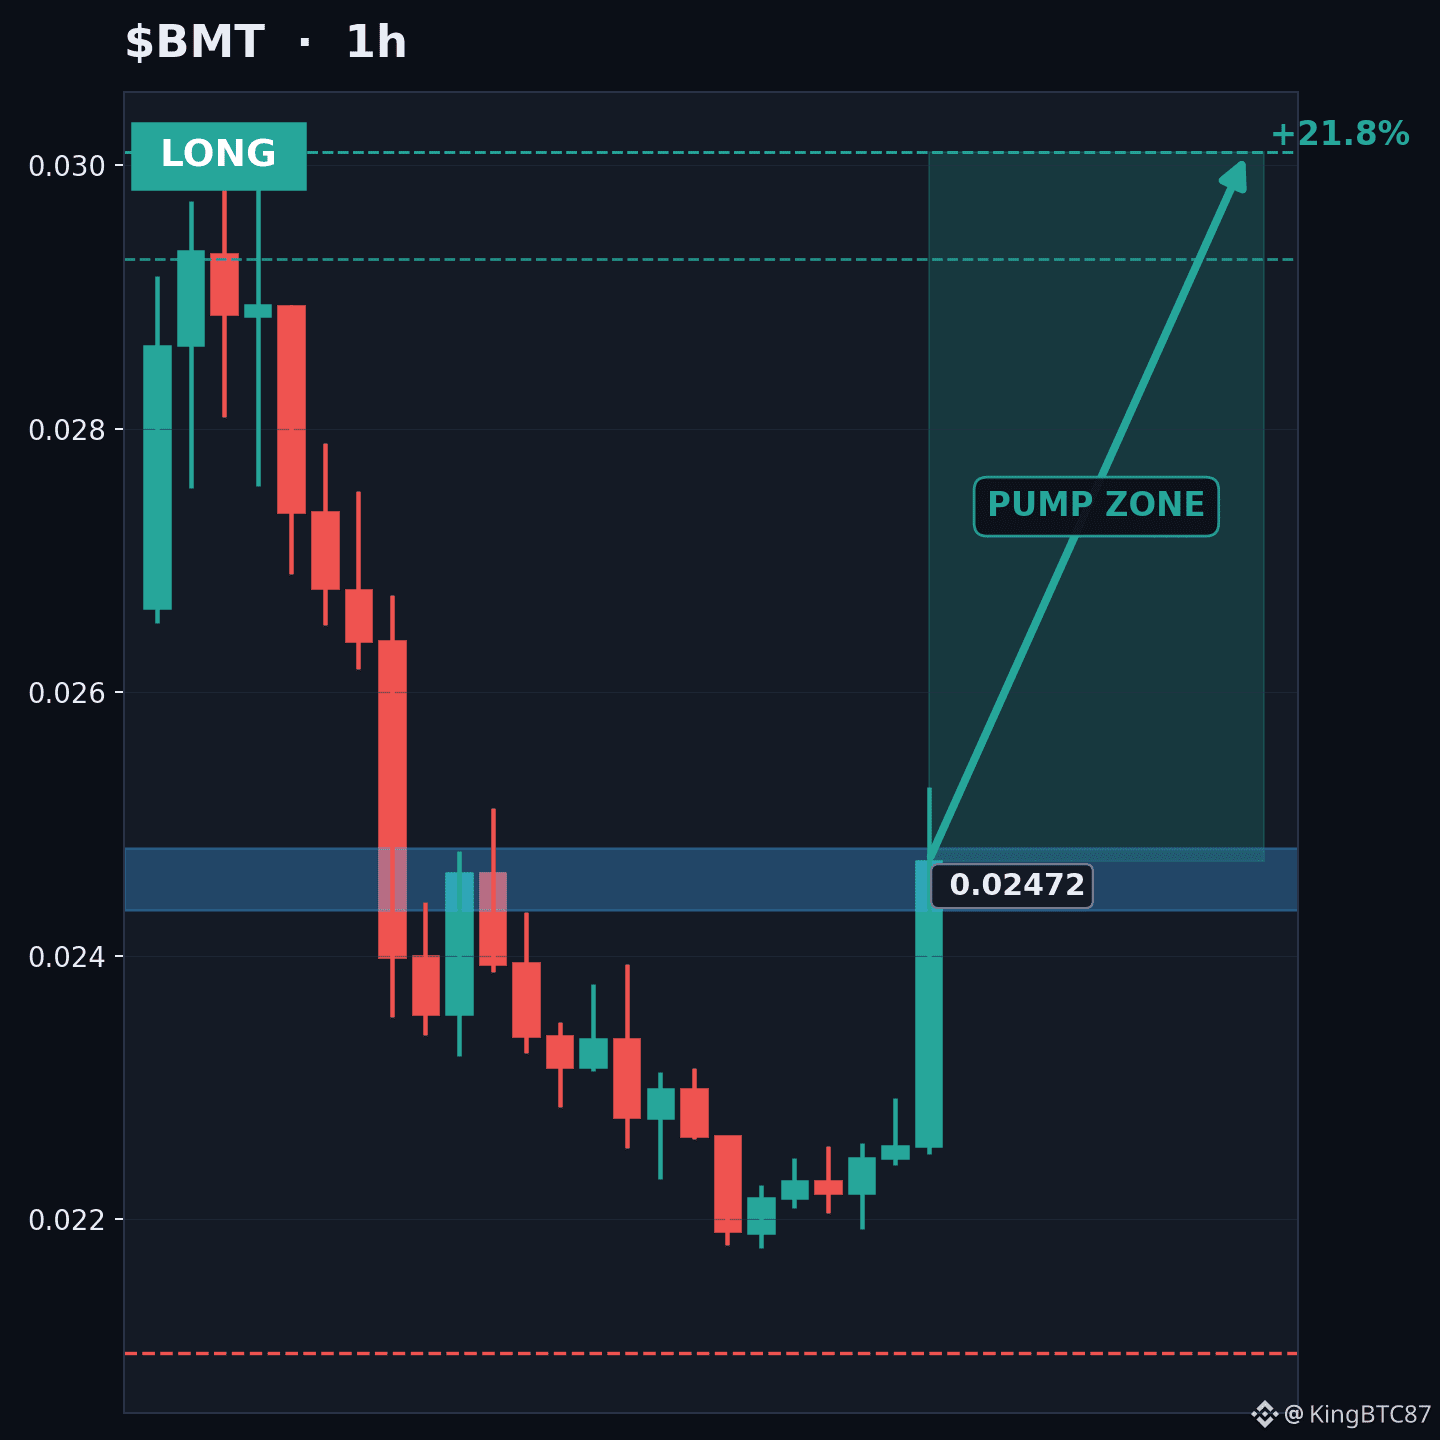
👀 $BMT is on the watchlist: a possible LONG on the 1H, not a confirmed setup yet
Technical Setup Score: 50/95. That is below the level this studio treats as a trade setup.
Why now?
• Risk/reward to TP2 is 1.53:1 from the middle of the entry zone
• RSI 51.0 shows bullish momentum without being stretched
Area to watch: 0.024352 – 0.024818. No stop or targets are offered until it is confirmed.
Would you add it to your watchlist?
#CryptoTrading
Analysis, not advice. Trade your own plan and never risk more than you can afford to lose.
👀 $BMT is on the watchlist: a possible LONG on the 1H, not a confirmed setup yet
Technical Setup Score: 50/95. That is below the level this studio treats as a trade setup.
Why now?
• Risk/reward to TP2 is 1.53:1 from the middle of the entry zone
• RSI 51.0 shows bullish momentum without being stretched
Area to watch: 0.024352 – 0.024818. No stop or targets are offered until it is confirmed.
Would you add it to your watchlist?
#CryptoTrading
Analysis, not advice. Trade your own plan and never risk more than you can afford to lose.
Technical Setup Score: 50/95. That is below the level this studio treats as a trade setup.
Why now?
• Risk/reward to TP2 is 1.53:1 from the middle of the entry zone
• RSI 51.0 shows bullish momentum without being stretched
Area to watch: 0.024352 – 0.024818. No stop or targets are offered until it is confirmed.
Would you add it to your watchlist?
#CryptoTrading
Analysis, not advice. Trade your own plan and never risk more than you can afford to lose.
·
--
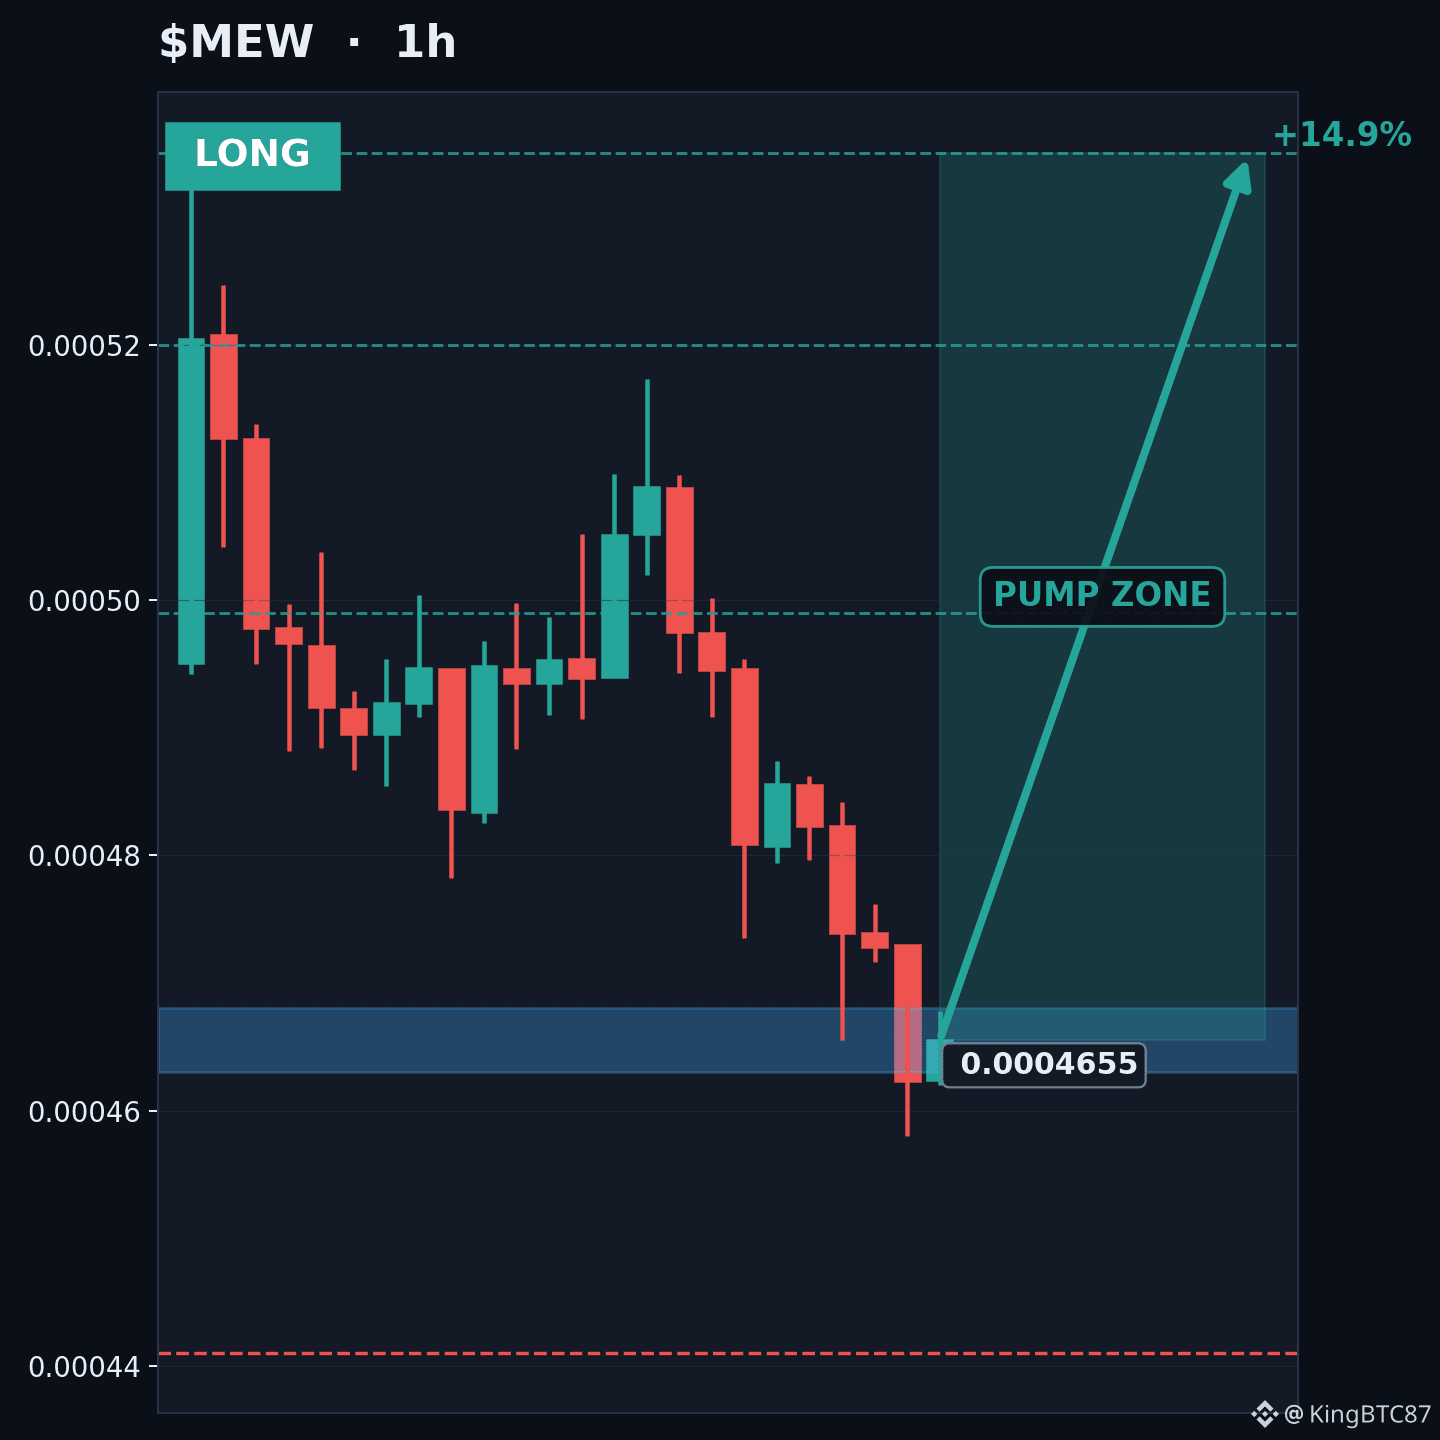
🔄 $MEW Seguimiento de posible reversión en 1H: RSI 32.8, sobreventa (el giro aún no está confirmado)
¿Por qué ahora?
• RSI 32.8 en zona de sobreventa
• EMA20 0.000484 > EMA50 0.000479 > EMA200 0.000451: estructura de tendencia alcista
🟢 Sesgo: intento de reversión en LARGO
📍 Entrada: 0.000463 – 0.000468
🛑 Stop: 0.000441 (5.3% desde la entrada)
🎯 TP1: 0.000499 (+7.2%)
🎯 TP2: 0.00052 (+11.7%)
🎯 TP3: 0.000535 (+14.9%)
📊 Relación riesgo/recompensa hasta TP2: 2.22:1
Confirmación a observar: una vela de 1H que cierre nuevamente por encima de 0.000468. Hasta entonces, esto es solo seguimiento, no una entrada.
⚠️ La idea queda invalidada por debajo de 0.000441. No persigas el precio fuera de la zona de entrada.
¿Esperarías al cierre de confirmación o lo dejarías pasar?
#TradingCripto
Esto es un análisis técnico, no asesoramiento financiero.
🔄 $MEW Seguimiento de posible reversión en 1H: RSI 32.8, sobreventa (el giro aún no está confirmado)
¿Por qué ahora?
• RSI 32.8 en zona de sobreventa
• EMA20 0.000484 > EMA50 0.000479 > EMA200 0.000451: estructura de tendencia alcista
🟢 Sesgo: intento de reversión en LARGO
📍 Entrada: 0.000463 – 0.000468
🛑 Stop: 0.000441 (5.3% desde la entrada)
🎯 TP1: 0.000499 (+7.2%)
🎯 TP2: 0.00052 (+11.7%)
🎯 TP3: 0.000535 (+14.9%)
📊 Relación riesgo/recompensa hasta TP2: 2.22:1
Confirmación a observar: una vela de 1H que cierre nuevamente por encima de 0.000468. Hasta entonces, esto es solo seguimiento, no una entrada.
⚠️ La idea queda invalidada por debajo de 0.000441. No persigas el precio fuera de la zona de entrada.
¿Esperarías al cierre de confirmación o lo dejarías pasar?
#TradingCripto
Esto es un análisis técnico, no asesoramiento financiero.
¿Por qué ahora?
• RSI 32.8 en zona de sobreventa
• EMA20 0.000484 > EMA50 0.000479 > EMA200 0.000451: estructura de tendencia alcista
🟢 Sesgo: intento de reversión en LARGO
📍 Entrada: 0.000463 – 0.000468
🛑 Stop: 0.000441 (5.3% desde la entrada)
🎯 TP1: 0.000499 (+7.2%)
🎯 TP2: 0.00052 (+11.7%)
🎯 TP3: 0.000535 (+14.9%)
📊 Relación riesgo/recompensa hasta TP2: 2.22:1
Confirmación a observar: una vela de 1H que cierre nuevamente por encima de 0.000468. Hasta entonces, esto es solo seguimiento, no una entrada.
⚠️ La idea queda invalidada por debajo de 0.000441. No persigas el precio fuera de la zona de entrada.
¿Esperarías al cierre de confirmación o lo dejarías pasar?
#TradingCripto
Esto es un análisis técnico, no asesoramiento financiero.
·
--
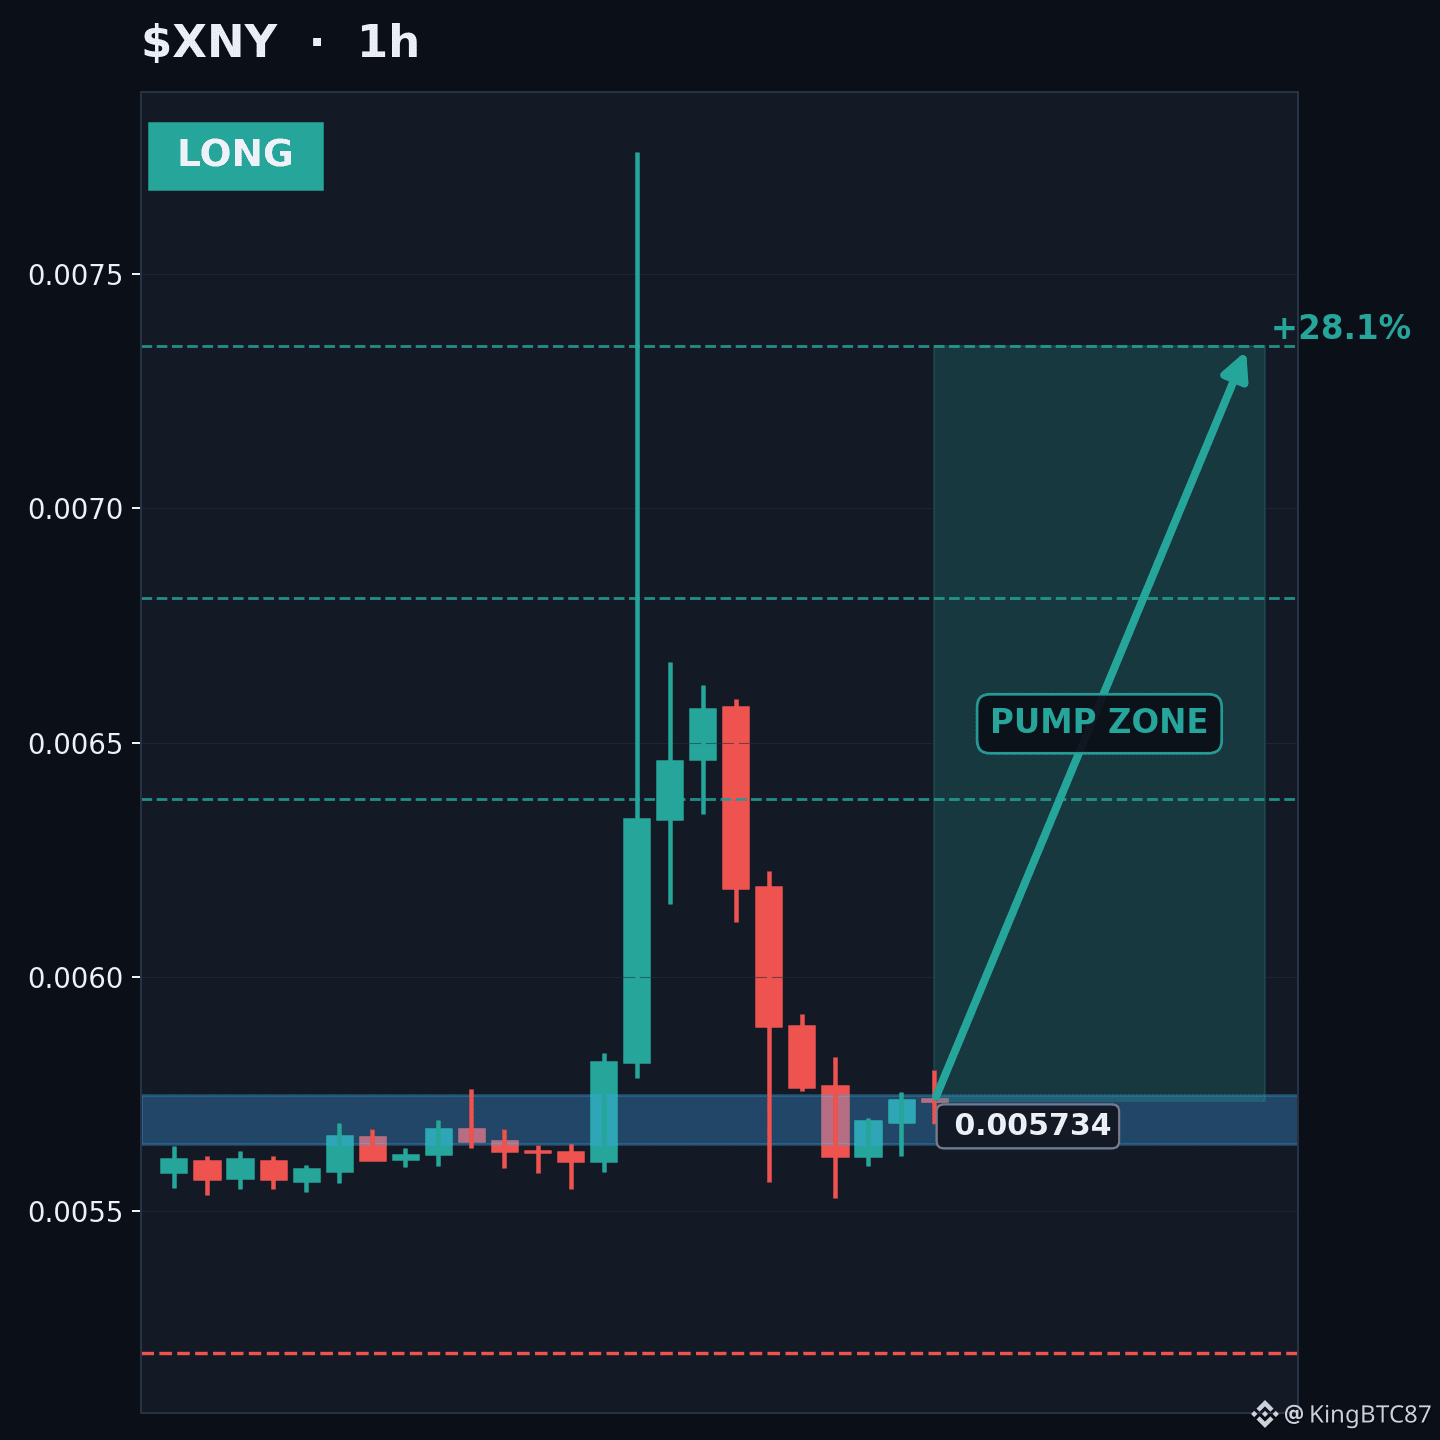
📈 $XNY LARGO en 1H: 5 datos coinciden
🟢 Sesgo: LARGO
📍 Entrada: 0.005642 – 0.005747
🛑 Stop: 0.005197 (8.7% desde la entrada)
🎯 TP1: 0.006379 (+12.0%)
🎯 TP2: 0.006809 (+19.6%)
🎯 TP3: 0.007346 (+29.0%)
📊 Riesgo/beneficio hasta TP2: 2.24:1
Evidencia técnica:
• EMA20 0.005808 > EMA50 0.00572 > EMA200 0.005449: estructura de tendencia alcista
• La relación riesgo/beneficio hasta TP2 es de 2.24:1 desde el punto medio de la zona de entrada
• RSI 52.0 muestra impulso alcista sin estar sobreextendido
• La resistencia más cercana, 0.00776, está a un 36.3% de la entrada
• El régimen de 1H está en tendencia (ADX 42.2)
Indicadores:
EMA20/50/200: 0.005808 / 0.00572 / 0.005449
RSI 52.0 | ATR 0.000262 | Volumen 0.18x del promedio
A tener en cuenta:
• El volumen es de solo 0.18x el promedio, por lo que la participación es escasa.
Puntuación de la configuración técnica: 90/95 (una valoración de la configuración basada en reglas, no una probabilidad de ganar)
⚠️ La configuración queda invalidada por debajo de 0.005197. No persigas el precio fuera de la zona de entrada.
¿Te convencen estas señales o le falta algo a XNY?
#CryptoTrading
Esto es un análisis técnico, no asesoramiento financiero.
📈 $XNY LARGO en 1H: 5 datos coinciden
🟢 Sesgo: LARGO
📍 Entrada: 0.005642 – 0.005747
🛑 Stop: 0.005197 (8.7% desde la entrada)
🎯 TP1: 0.006379 (+12.0%)
🎯 TP2: 0.006809 (+19.6%)
🎯 TP3: 0.007346 (+29.0%)
📊 Riesgo/beneficio hasta TP2: 2.24:1
Evidencia técnica:
• EMA20 0.005808 > EMA50 0.00572 > EMA200 0.005449: estructura de tendencia alcista
• La relación riesgo/beneficio hasta TP2 es de 2.24:1 desde el punto medio de la zona de entrada
• RSI 52.0 muestra impulso alcista sin estar sobreextendido
• La resistencia más cercana, 0.00776, está a un 36.3% de la entrada
• El régimen de 1H está en tendencia (ADX 42.2)
Indicadores:
EMA20/50/200: 0.005808 / 0.00572 / 0.005449
RSI 52.0 | ATR 0.000262 | Volumen 0.18x del promedio
A tener en cuenta:
• El volumen es de solo 0.18x el promedio, por lo que la participación es escasa.
Puntuación de la configuración técnica: 90/95 (una valoración de la configuración basada en reglas, no una probabilidad de ganar)
⚠️ La configuración queda invalidada por debajo de 0.005197. No persigas el precio fuera de la zona de entrada.
¿Te convencen estas señales o le falta algo a XNY?
#CryptoTrading
Esto es un análisis técnico, no asesoramiento financiero.
🟢 Sesgo: LARGO
📍 Entrada: 0.005642 – 0.005747
🛑 Stop: 0.005197 (8.7% desde la entrada)
🎯 TP1: 0.006379 (+12.0%)
🎯 TP2: 0.006809 (+19.6%)
🎯 TP3: 0.007346 (+29.0%)
📊 Riesgo/beneficio hasta TP2: 2.24:1
Evidencia técnica:
• EMA20 0.005808 > EMA50 0.00572 > EMA200 0.005449: estructura de tendencia alcista
• La relación riesgo/beneficio hasta TP2 es de 2.24:1 desde el punto medio de la zona de entrada
• RSI 52.0 muestra impulso alcista sin estar sobreextendido
• La resistencia más cercana, 0.00776, está a un 36.3% de la entrada
• El régimen de 1H está en tendencia (ADX 42.2)
Indicadores:
EMA20/50/200: 0.005808 / 0.00572 / 0.005449
RSI 52.0 | ATR 0.000262 | Volumen 0.18x del promedio
A tener en cuenta:
• El volumen es de solo 0.18x el promedio, por lo que la participación es escasa.
Puntuación de la configuración técnica: 90/95 (una valoración de la configuración basada en reglas, no una probabilidad de ganar)
⚠️ La configuración queda invalidada por debajo de 0.005197. No persigas el precio fuera de la zona de entrada.
¿Te convencen estas señales o le falta algo a XNY?
#CryptoTrading
Esto es un análisis técnico, no asesoramiento financiero.
2
·
--
Ver traducción
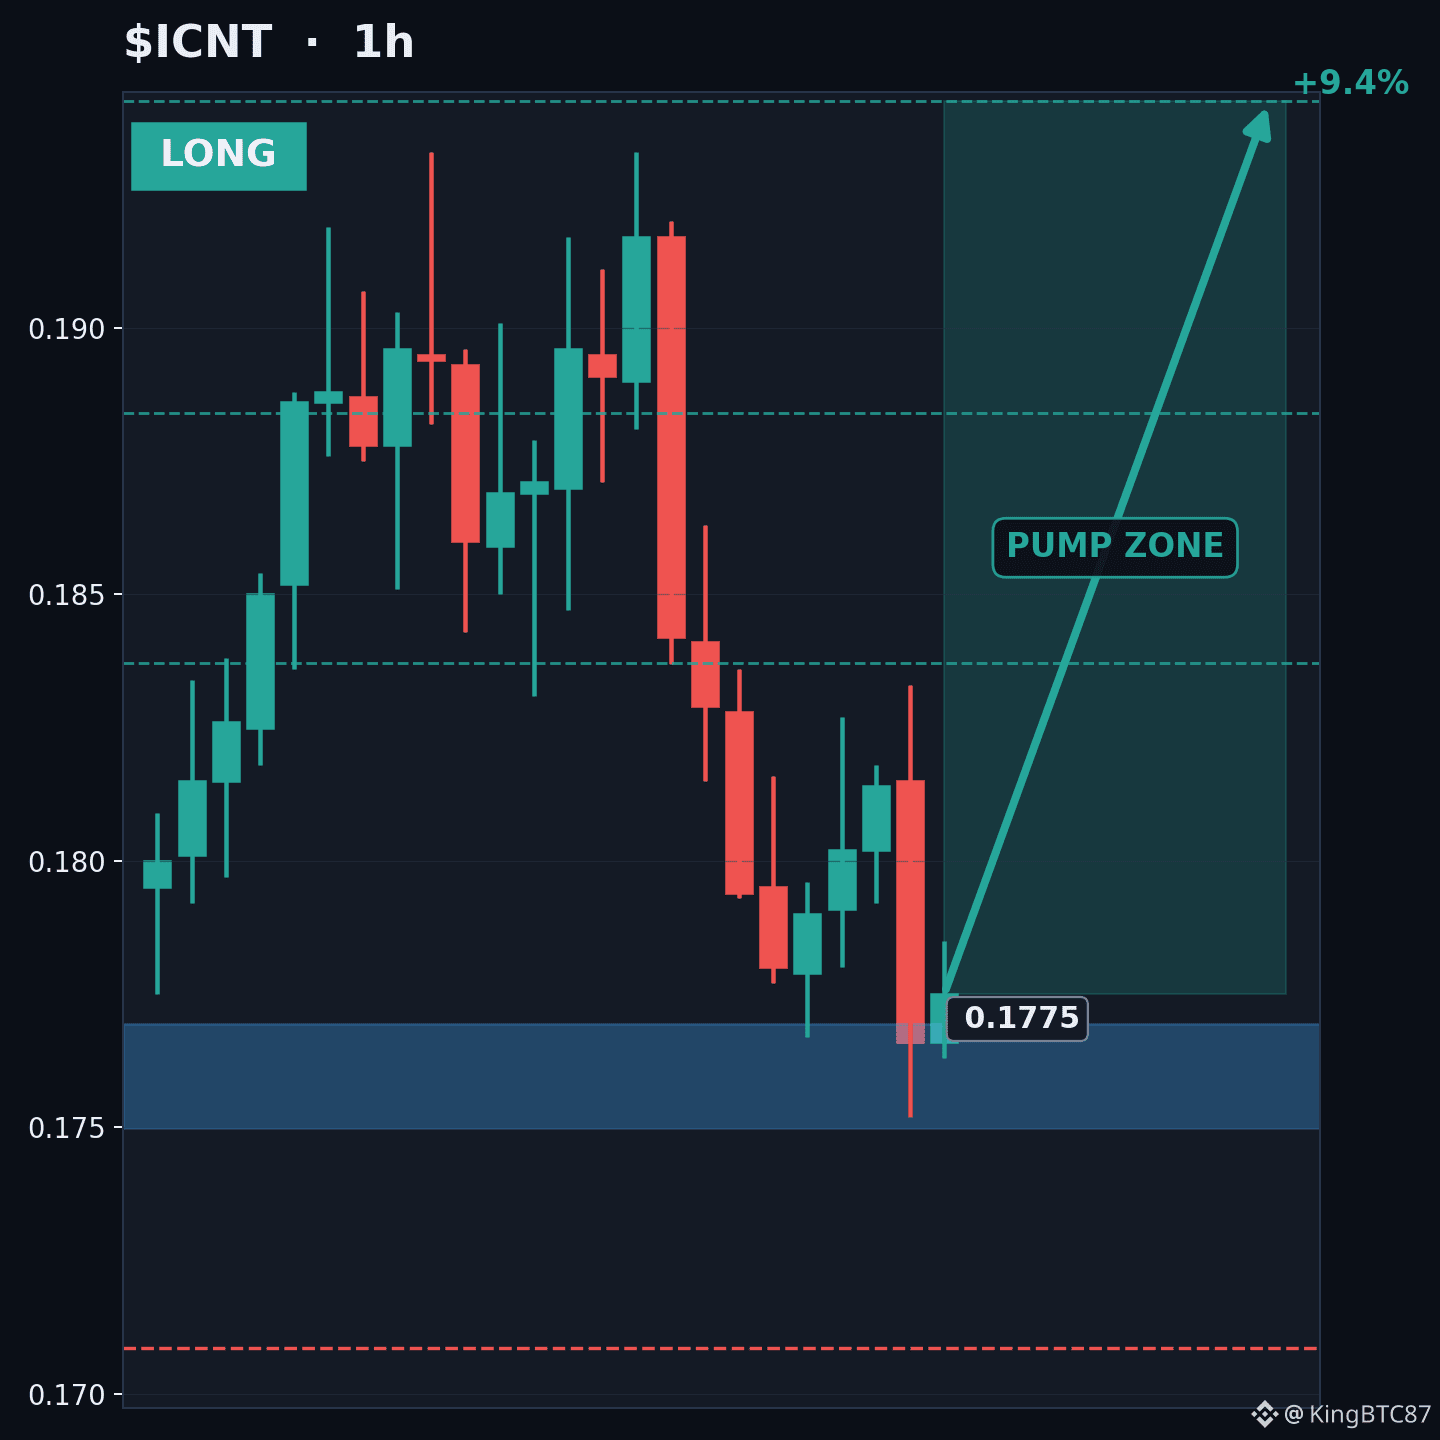
👀 $ICNT is on the watchlist: a possible LONG on the 1H, not a confirmed setup yet
Technical Setup Score: 50/95. That is below the level this studio treats as a trade setup.
Why now?
• RSI 33.8 is oversold; price is testing support 0.174
• Risk/reward to TP2 is 2.43:1 from the middle of the entry zone
Area to watch: 0.174994 – 0.176944. No stop or targets are offered until it is confirmed.
Would you add it to your watchlist?
#CryptoTrading
This is a technical read, not financial advice.
👀 $ICNT is on the watchlist: a possible LONG on the 1H, not a confirmed setup yet
Technical Setup Score: 50/95. That is below the level this studio treats as a trade setup.
Why now?
• RSI 33.8 is oversold; price is testing support 0.174
• Risk/reward to TP2 is 2.43:1 from the middle of the entry zone
Area to watch: 0.174994 – 0.176944. No stop or targets are offered until it is confirmed.
Would you add it to your watchlist?
#CryptoTrading
This is a technical read, not financial advice.
Technical Setup Score: 50/95. That is below the level this studio treats as a trade setup.
Why now?
• RSI 33.8 is oversold; price is testing support 0.174
• Risk/reward to TP2 is 2.43:1 from the middle of the entry zone
Area to watch: 0.174994 – 0.176944. No stop or targets are offered until it is confirmed.
Would you add it to your watchlist?
#CryptoTrading
This is a technical read, not financial advice.
3
Inicia sesión para explorar más contenidos
Únete a usuarios de criptomonedas de todo el mundo en Binance Square
⚡️ Obtén la información más reciente y útil sobre criptomonedas.
💬 Confía en el mayor exchange de criptomonedas del mundo.
👍 Descubre opiniones reales de creadores verificados.
Correo electrónico/número de teléfono
Temas en tendencia
BinanceWithdrawalScamWarning
46,419 visualizaciones
683 participa(n) en el debate
Binance advierte a los usuarios sobre estafas relacionadas con los retiros mientras reanuda sus servicios: nunca cobrará comisiones, venderá puestos en la cola ni pedirá que traslades fondos a una «bóveda»
Binance News
·15 «Me gusta»
·8.3k visualizaciones
USMidtermElections
613,138 visualizaciones
3,256 participa(n) en el debate
USOctoberNFP-AreRateCutsStillPossible
51,767 visualizaciones
550 participa(n) en el debate