
Crypto_Vazima
4.9k Publicaciones
Crypto_Vazima
Denunciar
Bloquear usuario
Fresh crypto news EVERY DAY! Subscribe now! Official STON.fi Ambassador! @crypto_vazima
29 Siguiendo
866 Seguidores
4.7K+ Me gusta
Publicaciones
Todo
Cotizaciones
·
--
Alcista
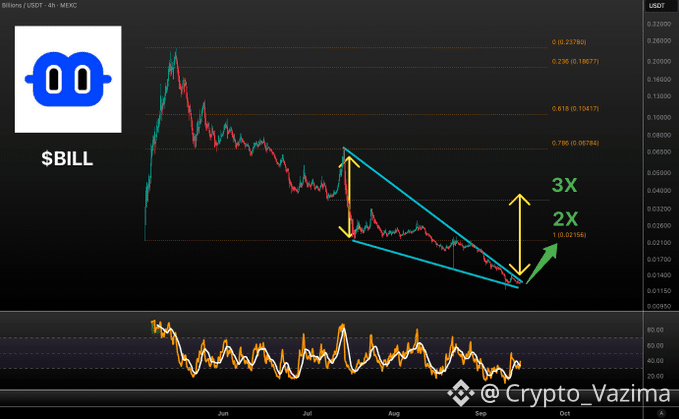
BILL acaba de aterrizar en territorio clásico de estafa-bombeo 👀
Este ya hizo toda la película. Puede haber una gran subida, luego un recorte del 95 por ciento y ahora el gráfico susurra sobre un posible rebote de 2-3X.
🔥 Por qué lo estoy mirando
- Ese aspecto de “bombeo típico de estafa” después de un dump brutal es exactamente cuando la gente vuelve a hurgar el gráfico.
- La estructura de 4h se está apretando en los mínimos.
- Las flechas marcadas de 2X y 3X son la única razón por la que esto me interesa.
👀 La parte que importa
- No me importa todavía el máximo anterior.
- Me importa si este mínimo aguanta.
- Si falla, la historia del rebote muere rápido.
🎯 Mi idea de trade
- Sesgo: Esperar, luego Long
- Señal: los compradores defienden el squeeze y imprimen un rebote limpio
- Objetivo: solo la zona 2X-3X si el rebote realmente empieza
- Invalidez: pérdida del mínimo reciente
- Confianza: 57 por ciento
🛡 Dónde me detengo
- Sin aguante, no hay trade.
- Prefiero perderme el primer pico que comprar otro rebote falso.
🚀 Flujo del mercado
Los nombres de dump-rápido y rebote como BILL pueden volver a meter traders en el momento en que el gráfico se ve sobrevendido. BILL es el “play” emocional del gráfico en este post, mientras que STON está en el lado de staking y participación en el protocolo.
Su papel es la participación del ecosistema a más largo plazo, no un scalp de 2-3X. Por eso el ángulo de participación va junto a este setup sin convertir la idea del rebote en algo más seguro de lo que es.
¿Estás alejándote de este dump o esperando una vela de rebote real? 👇
Deja el nivel que te haría cambiar de opinión.
No es asesoramiento de inversión: ¡haz tu propia investigación! 🚀
$BILL
{alpha}(560xdf24f8c21cb404b3031a450d8e049d6e39fc1fa5)
BILL acaba de aterrizar en territorio clásico de estafa-bombeo 👀
Este ya hizo toda la película. Puede haber una gran subida, luego un recorte del 95 por ciento y ahora el gráfico susurra sobre un posible rebote de 2-3X.
🔥 Por qué lo estoy mirando
- Ese aspecto de “bombeo típico de estafa” después de un dump brutal es exactamente cuando la gente vuelve a hurgar el gráfico.
- La estructura de 4h se está apretando en los mínimos.
- Las flechas marcadas de 2X y 3X son la única razón por la que esto me interesa.
👀 La parte que importa
- No me importa todavía el máximo anterior.
- Me importa si este mínimo aguanta.
- Si falla, la historia del rebote muere rápido.
🎯 Mi idea de trade
- Sesgo: Esperar, luego Long
- Señal: los compradores defienden el squeeze y imprimen un rebote limpio
- Objetivo: solo la zona 2X-3X si el rebote realmente empieza
- Invalidez: pérdida del mínimo reciente
- Confianza: 57 por ciento
🛡 Dónde me detengo
- Sin aguante, no hay trade.
- Prefiero perderme el primer pico que comprar otro rebote falso.
🚀 Flujo del mercado
Los nombres de dump-rápido y rebote como BILL pueden volver a meter traders en el momento en que el gráfico se ve sobrevendido. BILL es el “play” emocional del gráfico en este post, mientras que STON está en el lado de staking y participación en el protocolo.
Su papel es la participación del ecosistema a más largo plazo, no un scalp de 2-3X. Por eso el ángulo de participación va junto a este setup sin convertir la idea del rebote en algo más seguro de lo que es.
¿Estás alejándote de este dump o esperando una vela de rebote real? 👇
Deja el nivel que te haría cambiar de opinión.
No es asesoramiento de inversión: ¡haz tu propia investigación! 🚀
$BILL
Este ya hizo toda la película. Puede haber una gran subida, luego un recorte del 95 por ciento y ahora el gráfico susurra sobre un posible rebote de 2-3X.
🔥 Por qué lo estoy mirando
- Ese aspecto de “bombeo típico de estafa” después de un dump brutal es exactamente cuando la gente vuelve a hurgar el gráfico.
- La estructura de 4h se está apretando en los mínimos.
- Las flechas marcadas de 2X y 3X son la única razón por la que esto me interesa.
👀 La parte que importa
- No me importa todavía el máximo anterior.
- Me importa si este mínimo aguanta.
- Si falla, la historia del rebote muere rápido.
🎯 Mi idea de trade
- Sesgo: Esperar, luego Long
- Señal: los compradores defienden el squeeze y imprimen un rebote limpio
- Objetivo: solo la zona 2X-3X si el rebote realmente empieza
- Invalidez: pérdida del mínimo reciente
- Confianza: 57 por ciento
🛡 Dónde me detengo
- Sin aguante, no hay trade.
- Prefiero perderme el primer pico que comprar otro rebote falso.
🚀 Flujo del mercado
Los nombres de dump-rápido y rebote como BILL pueden volver a meter traders en el momento en que el gráfico se ve sobrevendido. BILL es el “play” emocional del gráfico en este post, mientras que STON está en el lado de staking y participación en el protocolo.
Su papel es la participación del ecosistema a más largo plazo, no un scalp de 2-3X. Por eso el ángulo de participación va junto a este setup sin convertir la idea del rebote en algo más seguro de lo que es.
¿Estás alejándote de este dump o esperando una vela de rebote real? 👇
Deja el nivel que te haría cambiar de opinión.
No es asesoramiento de inversión: ¡haz tu propia investigación! 🚀
$BILL
135
·
--
Alcista
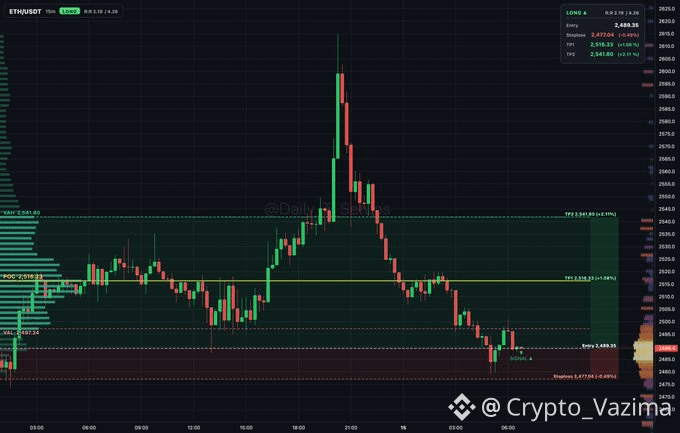
La caída de ETH bajo el valor tiene esa sensación de absorción 🔥
Esta caída se ve desordenada hasta que ves a los compradores que siguen defendiendo cerca de VAL. Estoy observando cómo la subasta intenta rotar de nuevo hacia arriba, pero solo si ese soporte se mantiene limpio.
🔥 Por qué lo estoy mirando
- La absorción está mostrando cerca de 2,497.24
- El mercado está operando por debajo del valor
- Un long solo tiene sentido si se mantiene 2,489.36
🚀 Lo que importa
- El primer objetivo está en el POC 2,516.33
- El objetivo extendido es VAH 2,541.80
- El plan es salir a medias en TP1 y luego volver a la entrada con el stop
🎯 Mi idea de trade
- Sesgo: Long
- Disparador: mantener la zona de 2,489.36
- Objetivos: 2,516.33 y 2,541.80
- Invalidación: cerrar riesgo en 2,477.05
- Confianza: 64 por ciento
💎 Capa de participación
Cuando ETH busca un rebote desde abajo del valor, la operación sigue siendo una cuestión de impulso. La configuración reactiva del mercado en este post es para ETH, mientras que STON está en el lado del staking y la participación del protocolo, en lugar de la subasta de 15 minutos.
Su función se conecta con el staking y la participación del DAO más que con un rápido re-cobro del POC. Esto importa junto con esta idea de long porque el gráfico puede confirmar primero y el ángulo de participación puede mantenerse separado.
¿Te parece real esta absorción o todavía es demasiado pronto? 👇
Deja la vela de confirmación que quieres ver.
No es asesoramiento de inversión: ¡investiga por tu cuenta! 🚀
$ETH
{future}(ETHUSDT)
La caída de ETH bajo el valor tiene esa sensación de absorción 🔥
Esta caída se ve desordenada hasta que ves a los compradores que siguen defendiendo cerca de VAL. Estoy observando cómo la subasta intenta rotar de nuevo hacia arriba, pero solo si ese soporte se mantiene limpio.
🔥 Por qué lo estoy mirando
- La absorción está mostrando cerca de 2,497.24
- El mercado está operando por debajo del valor
- Un long solo tiene sentido si se mantiene 2,489.36
🚀 Lo que importa
- El primer objetivo está en el POC 2,516.33
- El objetivo extendido es VAH 2,541.80
- El plan es salir a medias en TP1 y luego volver a la entrada con el stop
🎯 Mi idea de trade
- Sesgo: Long
- Disparador: mantener la zona de 2,489.36
- Objetivos: 2,516.33 y 2,541.80
- Invalidación: cerrar riesgo en 2,477.05
- Confianza: 64 por ciento
💎 Capa de participación
Cuando ETH busca un rebote desde abajo del valor, la operación sigue siendo una cuestión de impulso. La configuración reactiva del mercado en este post es para ETH, mientras que STON está en el lado del staking y la participación del protocolo, en lugar de la subasta de 15 minutos.
Su función se conecta con el staking y la participación del DAO más que con un rápido re-cobro del POC. Esto importa junto con esta idea de long porque el gráfico puede confirmar primero y el ángulo de participación puede mantenerse separado.
¿Te parece real esta absorción o todavía es demasiado pronto? 👇
Deja la vela de confirmación que quieres ver.
No es asesoramiento de inversión: ¡investiga por tu cuenta! 🚀
$ETH
Esta caída se ve desordenada hasta que ves a los compradores que siguen defendiendo cerca de VAL. Estoy observando cómo la subasta intenta rotar de nuevo hacia arriba, pero solo si ese soporte se mantiene limpio.
🔥 Por qué lo estoy mirando
- La absorción está mostrando cerca de 2,497.24
- El mercado está operando por debajo del valor
- Un long solo tiene sentido si se mantiene 2,489.36
🚀 Lo que importa
- El primer objetivo está en el POC 2,516.33
- El objetivo extendido es VAH 2,541.80
- El plan es salir a medias en TP1 y luego volver a la entrada con el stop
🎯 Mi idea de trade
- Sesgo: Long
- Disparador: mantener la zona de 2,489.36
- Objetivos: 2,516.33 y 2,541.80
- Invalidación: cerrar riesgo en 2,477.05
- Confianza: 64 por ciento
💎 Capa de participación
Cuando ETH busca un rebote desde abajo del valor, la operación sigue siendo una cuestión de impulso. La configuración reactiva del mercado en este post es para ETH, mientras que STON está en el lado del staking y la participación del protocolo, en lugar de la subasta de 15 minutos.
Su función se conecta con el staking y la participación del DAO más que con un rápido re-cobro del POC. Esto importa junto con esta idea de long porque el gráfico puede confirmar primero y el ángulo de participación puede mantenerse separado.
¿Te parece real esta absorción o todavía es demasiado pronto? 👇
Deja la vela de confirmación que quieres ver.
No es asesoramiento de inversión: ¡investiga por tu cuenta! 🚀
$ETH
15
·
--
Bajista
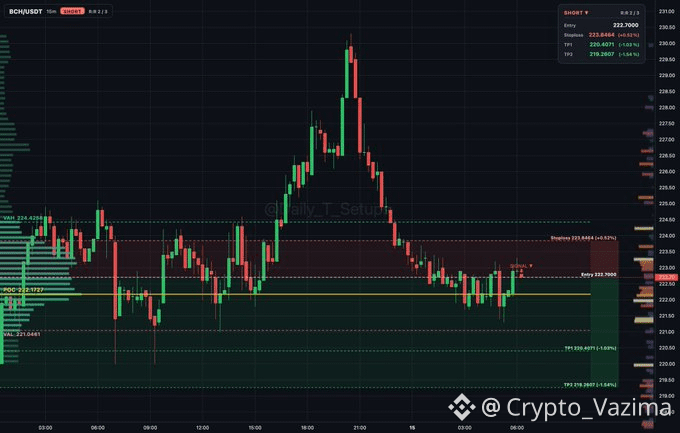
BCH Podría Caer Rápido Si Este Fondo de Subasta No Se Diluye ⚡
Este gráfico de BCH no está gritando caos. Está equilibrado dentro del valor, y el short ya está trazado con un riesgo ajustado.
🔥 Por qué lo estoy vigilando
- La rotación del subasta se ve equilibrada entre 221.046 y 224.426.
- El precio sigue rotando alrededor de la zona POC 222.173.
- El short mapeado comienza en 222.700.
🚀 La parte que importa
- El stop está en 223.846, solo ~medio por ciento por encima de la entrada.
- TP1 está en 220.407.
- TP2 está en 219.261.
🎯 Mi idea de trade
- Sesgo: Short
- Disparador: Mantener y aceptar desde 222.700
- Objetivo: 220.407 primero, 219.261 después
- Invalidación: Mantener por encima de 223.846
- Confianza: Mi confianza actual en el Short: 64 por ciento
🛡 Dónde me aparto
1. Esperar a que el short en 222.700 siga siendo válido.
2. Quitar la mitad en 220.407.
3. Mover el stop a la entrada después de TP1.
4. Salir por completo si se recupera 223.846.
💎 Capa de participación
Los shorts rápidos viven del timing, no de la lealtad a una historia de un token. BCH es el fade de subasta de corto plazo en este post, mientras que ST0Nfi es el lado de staking y participación en el protocolo dentro del ecosistema más amplio.
Está ligado al compromiso con el staking y a una participación tipo DAO, en lugar de un rechazo de 15 minutos. Ese contraste importa aquí porque un fade limpio en BCH puede terminarse rápido, mientras que la participación en el protocolo es una decisión más lenta.
¿Tomarías el fade desde 222.700 o lo dejarías pasar? 👇
Dime dónde moverías el stop después de TP1.
No es asesoramiento financiero: ¡haz tu propia investigación! 🚀
$GRAM @stonfi
BCH Podría Caer Rápido Si Este Fondo de Subasta No Se Diluye ⚡
Este gráfico de BCH no está gritando caos. Está equilibrado dentro del valor, y el short ya está trazado con un riesgo ajustado.
🔥 Por qué lo estoy vigilando
- La rotación del subasta se ve equilibrada entre 221.046 y 224.426.
- El precio sigue rotando alrededor de la zona POC 222.173.
- El short mapeado comienza en 222.700.
🚀 La parte que importa
- El stop está en 223.846, solo ~medio por ciento por encima de la entrada.
- TP1 está en 220.407.
- TP2 está en 219.261.
🎯 Mi idea de trade
- Sesgo: Short
- Disparador: Mantener y aceptar desde 222.700
- Objetivo: 220.407 primero, 219.261 después
- Invalidación: Mantener por encima de 223.846
- Confianza: Mi confianza actual en el Short: 64 por ciento
🛡 Dónde me aparto
1. Esperar a que el short en 222.700 siga siendo válido.
2. Quitar la mitad en 220.407.
3. Mover el stop a la entrada después de TP1.
4. Salir por completo si se recupera 223.846.
💎 Capa de participación
Los shorts rápidos viven del timing, no de la lealtad a una historia de un token. BCH es el fade de subasta de corto plazo en este post, mientras que ST0Nfi es el lado de staking y participación en el protocolo dentro del ecosistema más amplio.
Está ligado al compromiso con el staking y a una participación tipo DAO, en lugar de un rechazo de 15 minutos. Ese contraste importa aquí porque un fade limpio en BCH puede terminarse rápido, mientras que la participación en el protocolo es una decisión más lenta.
¿Tomarías el fade desde 222.700 o lo dejarías pasar? 👇
Dime dónde moverías el stop después de TP1.
No es asesoramiento financiero: ¡haz tu propia investigación! 🚀
$GRAM @STONfi DEX
Este gráfico de BCH no está gritando caos. Está equilibrado dentro del valor, y el short ya está trazado con un riesgo ajustado.
🔥 Por qué lo estoy vigilando
- La rotación del subasta se ve equilibrada entre 221.046 y 224.426.
- El precio sigue rotando alrededor de la zona POC 222.173.
- El short mapeado comienza en 222.700.
🚀 La parte que importa
- El stop está en 223.846, solo ~medio por ciento por encima de la entrada.
- TP1 está en 220.407.
- TP2 está en 219.261.
🎯 Mi idea de trade
- Sesgo: Short
- Disparador: Mantener y aceptar desde 222.700
- Objetivo: 220.407 primero, 219.261 después
- Invalidación: Mantener por encima de 223.846
- Confianza: Mi confianza actual en el Short: 64 por ciento
🛡 Dónde me aparto
1. Esperar a que el short en 222.700 siga siendo válido.
2. Quitar la mitad en 220.407.
3. Mover el stop a la entrada después de TP1.
4. Salir por completo si se recupera 223.846.
💎 Capa de participación
Los shorts rápidos viven del timing, no de la lealtad a una historia de un token. BCH es el fade de subasta de corto plazo en este post, mientras que ST0Nfi es el lado de staking y participación en el protocolo dentro del ecosistema más amplio.
Está ligado al compromiso con el staking y a una participación tipo DAO, en lugar de un rechazo de 15 minutos. Ese contraste importa aquí porque un fade limpio en BCH puede terminarse rápido, mientras que la participación en el protocolo es una decisión más lenta.
¿Tomarías el fade desde 222.700 o lo dejarías pasar? 👇
Dime dónde moverías el stop después de TP1.
No es asesoramiento financiero: ¡haz tu propia investigación! 🚀
$GRAM @STONfi DEX
11
·
--
Alcista
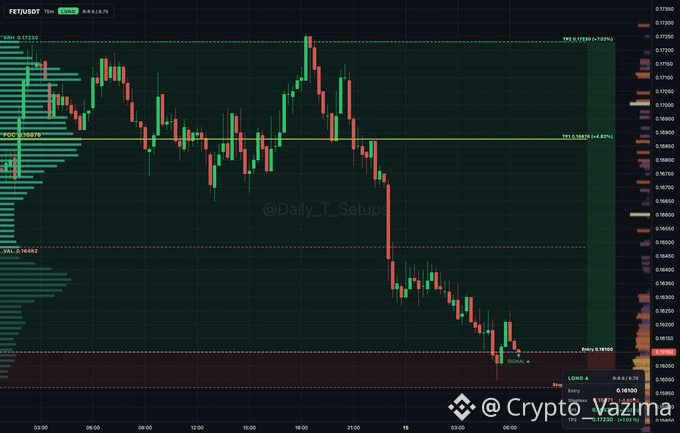
FET Podría Rebotar Si Esta Zona Mantiene 🔥
Este descenso se ve desordenado, pero la lectura de la subasta no es aleatoria. Los compradores están absorbiendo cerca de VAL y los niveles largos ya están mapeados.
🔥 Por qué lo estoy vigilando
- El precio cayó por debajo del valor y se está quedando en un bolsillo de demanda.
- VAL en 0.16482 es el primer reclaim que se sentiría más limpio.
- La señal marcada está justo en 0.1611.
🚀 La ruta del rebote
- TP1 es 0.16876 en POC.
- TP2 es 0.1723 en VAH.
- El plan es salir a mitad en TP1, luego detener para entrar.
🎯 Mi idea de trade
- Sesgo: Long
- Disparador: la absorción se mantiene alrededor de 0.1611
- Objetivo: 0.16876 y luego 0.1723
- Invalidación: 0.15971
- Confianza: 64 por ciento
⚡ Enfoque de utilidad
Cuando un token se desploma por debajo del valor, los traders aún necesitan una razón para seguir involucrados después del scalp. FET es el setup de rebote inmediato en esta publicación, mientras que S T O N es la ruta separada de staking y participación en el protocolo.
Su papel se centra en la participación del protocolo y las vías de gobernanza más que en una rotación de 15m. Vigilar ambas evita mezclar el trade corto de FET y el ángulo de participación más largo.
¿Este rebote se sentiría real solo después de que se recupere VAL? 👇
Deja la vela de confirmación que quieres ver.
No es asesoramiento de inversión: ¡investiga por tu cuenta! 🚀
$FET
{future}(FETUSDT)
FET Podría Rebotar Si Esta Zona Mantiene 🔥
Este descenso se ve desordenado, pero la lectura de la subasta no es aleatoria. Los compradores están absorbiendo cerca de VAL y los niveles largos ya están mapeados.
🔥 Por qué lo estoy vigilando
- El precio cayó por debajo del valor y se está quedando en un bolsillo de demanda.
- VAL en 0.16482 es el primer reclaim que se sentiría más limpio.
- La señal marcada está justo en 0.1611.
🚀 La ruta del rebote
- TP1 es 0.16876 en POC.
- TP2 es 0.1723 en VAH.
- El plan es salir a mitad en TP1, luego detener para entrar.
🎯 Mi idea de trade
- Sesgo: Long
- Disparador: la absorción se mantiene alrededor de 0.1611
- Objetivo: 0.16876 y luego 0.1723
- Invalidación: 0.15971
- Confianza: 64 por ciento
⚡ Enfoque de utilidad
Cuando un token se desploma por debajo del valor, los traders aún necesitan una razón para seguir involucrados después del scalp. FET es el setup de rebote inmediato en esta publicación, mientras que S T O N es la ruta separada de staking y participación en el protocolo.
Su papel se centra en la participación del protocolo y las vías de gobernanza más que en una rotación de 15m. Vigilar ambas evita mezclar el trade corto de FET y el ángulo de participación más largo.
¿Este rebote se sentiría real solo después de que se recupere VAL? 👇
Deja la vela de confirmación que quieres ver.
No es asesoramiento de inversión: ¡investiga por tu cuenta! 🚀
$FET
Este descenso se ve desordenado, pero la lectura de la subasta no es aleatoria. Los compradores están absorbiendo cerca de VAL y los niveles largos ya están mapeados.
🔥 Por qué lo estoy vigilando
- El precio cayó por debajo del valor y se está quedando en un bolsillo de demanda.
- VAL en 0.16482 es el primer reclaim que se sentiría más limpio.
- La señal marcada está justo en 0.1611.
🚀 La ruta del rebote
- TP1 es 0.16876 en POC.
- TP2 es 0.1723 en VAH.
- El plan es salir a mitad en TP1, luego detener para entrar.
🎯 Mi idea de trade
- Sesgo: Long
- Disparador: la absorción se mantiene alrededor de 0.1611
- Objetivo: 0.16876 y luego 0.1723
- Invalidación: 0.15971
- Confianza: 64 por ciento
⚡ Enfoque de utilidad
Cuando un token se desploma por debajo del valor, los traders aún necesitan una razón para seguir involucrados después del scalp. FET es el setup de rebote inmediato en esta publicación, mientras que S T O N es la ruta separada de staking y participación en el protocolo.
Su papel se centra en la participación del protocolo y las vías de gobernanza más que en una rotación de 15m. Vigilar ambas evita mezclar el trade corto de FET y el ángulo de participación más largo.
¿Este rebote se sentiría real solo después de que se recupere VAL? 👇
Deja la vela de confirmación que quieres ver.
No es asesoramiento de inversión: ¡investiga por tu cuenta! 🚀
$FET
126
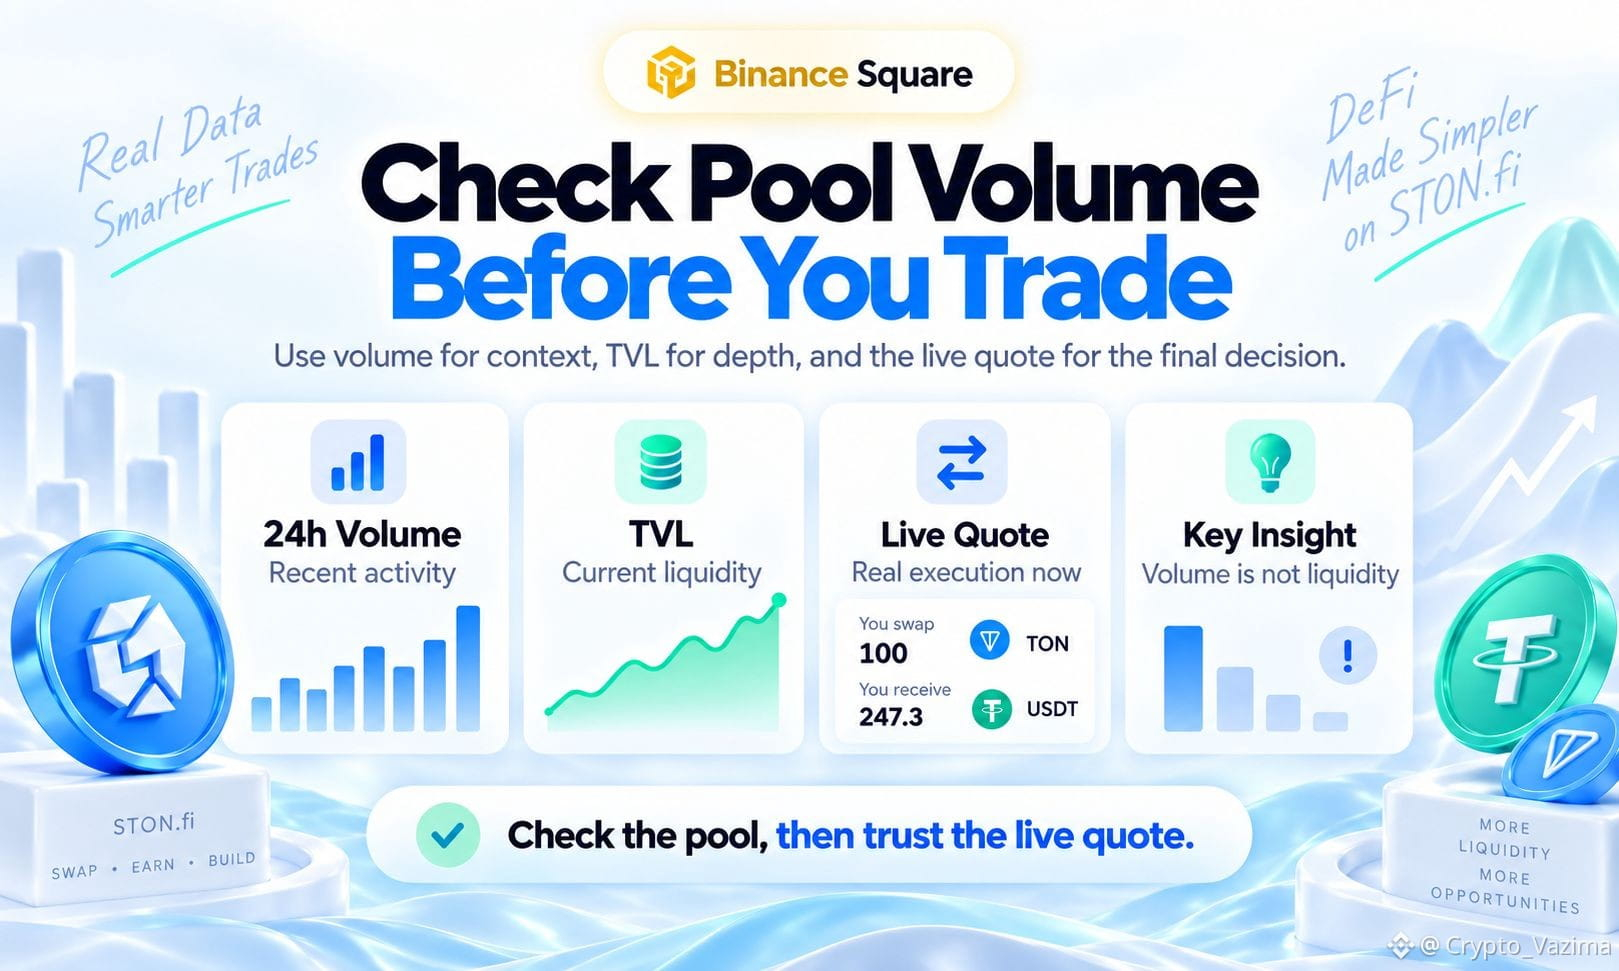
Cómo comprobar el volumen del pool en STON.fi antes de hacer un swap
En STON.fi, Volumen, 24h te indica qué tan activo ha estado un pool durante el día anterior. No te dice cuánta liquidez tiene el pool en este momento. Usa esa señal de actividad junto con el TVL y la cotización en vivo para el tamaño real de tu operación.
🔥 Lo que muestra el número de Volumen de 24h
- El volumen mide la actividad de trading reciente a través de ese par exacto.
- El TVL mide el valor bloqueado actualmente como liquidez.
- La cotización del swap mide la tasa, el impacto en el precio y lo mínimo que recibirás para tu cantidad ahora.
🚀 Un flujo sencillo antes de operar en STON.fi
1. Abre la app de STON.fi y ve a Pools.
2. Selecciona el par exacto de tokens con el que quieres operar, no solo símbolos que te suenen.
3. Lee Volumen, 24h y compáralo con el TVL.
4. Ingresa tu cantidad real de swap y revisa la tasa, el impacto en el precio, lo mínimo que recibirás y las comisiones antes de firmar.
🧠 Por qué los pools concurridos aún pueden fallar
- El volumen de ayer no puede garantizar la calidad de la ejecución de hoy.
- Una orden grande frente a las reservas actuales todavía puede generar un alto impacto en el precio.
- Un total de 24h puede ocultar un pico que ya pasó, así que actualiza antes de confirmar.
⚡ Errores comunes con el volumen
- Tratar el volumen de 24h como si fuera liquidez.
- Juzgar un pool basándote en el volumen de DEX a nivel de protocolo.
- Suponer que un volumen histórico alto implica bajo impacto en el precio.
- Revisar una sola vez y firmar mucho después sin una cotización nueva.
💬 Mi opinión
Trata el volumen de 24h de STON.fi como contexto, no como una luz verde. Un rápido ratio volumen/TVL puede mostrar si la actividad parece grande en relación con ese pool, pero no es una puntuación oficial. Verifica el pool correcto y luego deja que decida la cotización en vivo.
¿Saltarías un swap en STON.fi si el impacto en el precio se veía peor de lo que sugería el volumen? 👇
Comparte el primer campo de pool que revisas antes de confirmar.
No es asesoramiento de inversión: ¡haz tu propia investigación! 🚀
$GRAM @stonfi
Cómo comprobar el volumen del pool en STON.fi antes de hacer un swap
En STON.fi, Volumen, 24h te indica qué tan activo ha estado un pool durante el día anterior. No te dice cuánta liquidez tiene el pool en este momento. Usa esa señal de actividad junto con el TVL y la cotización en vivo para el tamaño real de tu operación.
🔥 Lo que muestra el número de Volumen de 24h
- El volumen mide la actividad de trading reciente a través de ese par exacto.
- El TVL mide el valor bloqueado actualmente como liquidez.
- La cotización del swap mide la tasa, el impacto en el precio y lo mínimo que recibirás para tu cantidad ahora.
🚀 Un flujo sencillo antes de operar en STON.fi
1. Abre la app de STON.fi y ve a Pools.
2. Selecciona el par exacto de tokens con el que quieres operar, no solo símbolos que te suenen.
3. Lee Volumen, 24h y compáralo con el TVL.
4. Ingresa tu cantidad real de swap y revisa la tasa, el impacto en el precio, lo mínimo que recibirás y las comisiones antes de firmar.
🧠 Por qué los pools concurridos aún pueden fallar
- El volumen de ayer no puede garantizar la calidad de la ejecución de hoy.
- Una orden grande frente a las reservas actuales todavía puede generar un alto impacto en el precio.
- Un total de 24h puede ocultar un pico que ya pasó, así que actualiza antes de confirmar.
⚡ Errores comunes con el volumen
- Tratar el volumen de 24h como si fuera liquidez.
- Juzgar un pool basándote en el volumen de DEX a nivel de protocolo.
- Suponer que un volumen histórico alto implica bajo impacto en el precio.
- Revisar una sola vez y firmar mucho después sin una cotización nueva.
💬 Mi opinión
Trata el volumen de 24h de STON.fi como contexto, no como una luz verde. Un rápido ratio volumen/TVL puede mostrar si la actividad parece grande en relación con ese pool, pero no es una puntuación oficial. Verifica el pool correcto y luego deja que decida la cotización en vivo.
¿Saltarías un swap en STON.fi si el impacto en el precio se veía peor de lo que sugería el volumen? 👇
Comparte el primer campo de pool que revisas antes de confirmar.
No es asesoramiento de inversión: ¡haz tu propia investigación! 🚀
$GRAM @STONfi DEX
En STON.fi, Volumen, 24h te indica qué tan activo ha estado un pool durante el día anterior. No te dice cuánta liquidez tiene el pool en este momento. Usa esa señal de actividad junto con el TVL y la cotización en vivo para el tamaño real de tu operación.
🔥 Lo que muestra el número de Volumen de 24h
- El volumen mide la actividad de trading reciente a través de ese par exacto.
- El TVL mide el valor bloqueado actualmente como liquidez.
- La cotización del swap mide la tasa, el impacto en el precio y lo mínimo que recibirás para tu cantidad ahora.
🚀 Un flujo sencillo antes de operar en STON.fi
1. Abre la app de STON.fi y ve a Pools.
2. Selecciona el par exacto de tokens con el que quieres operar, no solo símbolos que te suenen.
3. Lee Volumen, 24h y compáralo con el TVL.
4. Ingresa tu cantidad real de swap y revisa la tasa, el impacto en el precio, lo mínimo que recibirás y las comisiones antes de firmar.
🧠 Por qué los pools concurridos aún pueden fallar
- El volumen de ayer no puede garantizar la calidad de la ejecución de hoy.
- Una orden grande frente a las reservas actuales todavía puede generar un alto impacto en el precio.
- Un total de 24h puede ocultar un pico que ya pasó, así que actualiza antes de confirmar.
⚡ Errores comunes con el volumen
- Tratar el volumen de 24h como si fuera liquidez.
- Juzgar un pool basándote en el volumen de DEX a nivel de protocolo.
- Suponer que un volumen histórico alto implica bajo impacto en el precio.
- Revisar una sola vez y firmar mucho después sin una cotización nueva.
💬 Mi opinión
Trata el volumen de 24h de STON.fi como contexto, no como una luz verde. Un rápido ratio volumen/TVL puede mostrar si la actividad parece grande en relación con ese pool, pero no es una puntuación oficial. Verifica el pool correcto y luego deja que decida la cotización en vivo.
¿Saltarías un swap en STON.fi si el impacto en el precio se veía peor de lo que sugería el volumen? 👇
Comparte el primer campo de pool que revisas antes de confirmar.
No es asesoramiento de inversión: ¡haz tu propia investigación! 🚀
$GRAM @STONfi DEX
92
·
--
Alcista
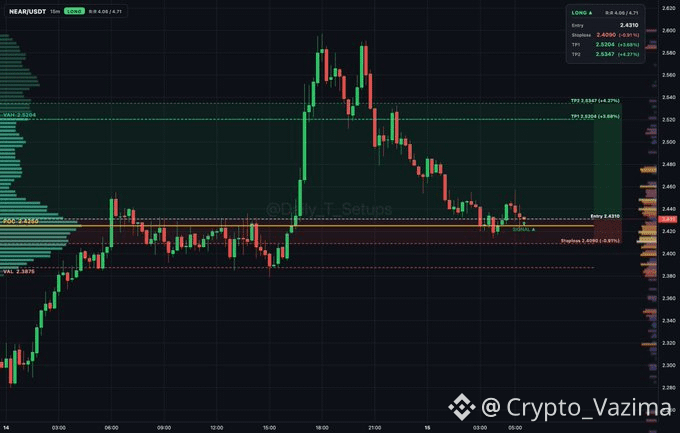
Los compradores cercanos están comiéndose esta rotación viva 🔥
Esta apariencia de subasta de NEAR se está poniendo interesante porque los compradores siguen absorbiendo valor de NEAR en lugar de dejar que se deslice.
🔥 Por qué estoy mirando
- La rotación está atascada dentro del valor alrededor del POC en 2.425.
- Los compradores siguen apareciendo cerca de 2.431.
- Esa absorción es toda la historia para mí ahora mismo.
🚀 Desencadenante del rompimiento
- Quiero que la zona se mantenga, no una mecha esperanzadora.
- El primer objetivo está en 2.520.
- El siguiente tramo es 2.535 si el impulso se mantiene.
🎯 Mi idea de trade
- Sesgo: Largo
- Disparador: mantenimiento limpio de la zona de 2.431
- Objetivo: 2.520 y luego 2.535
- Invalidación: 2.409
- Confianza: 64 por ciento
🚀 Flujo del mercado
Cuando un gráfico como NEAR empieza a absorber dentro del valor, el siguiente movimiento puede sentirse repentino, pero la participación del protocolo vive en un calendario diferente. NEAR es el trade emocional de subasta en este post, mientras que STON significa staking y participación de protocolo en lugar de un long scalp rápido.
Ese rol de staking y participación en DAO no intenta reemplazar la señal de 15m. Simplemente agrega un ángulo de implicación más lento junto al setup de absorción de NEAR.
¿Esta absorción es suficiente para ti o aún quieres más pruebas? 👇
Dime el nivel que te haría entrar.
No es asesoramiento de inversión: ¡haz tu propia investigación! 🚀
$NEAR
{future}(NEARUSDT)
Los compradores cercanos están comiéndose esta rotación viva 🔥
Esta apariencia de subasta de NEAR se está poniendo interesante porque los compradores siguen absorbiendo valor de NEAR en lugar de dejar que se deslice.
🔥 Por qué estoy mirando
- La rotación está atascada dentro del valor alrededor del POC en 2.425.
- Los compradores siguen apareciendo cerca de 2.431.
- Esa absorción es toda la historia para mí ahora mismo.
🚀 Desencadenante del rompimiento
- Quiero que la zona se mantenga, no una mecha esperanzadora.
- El primer objetivo está en 2.520.
- El siguiente tramo es 2.535 si el impulso se mantiene.
🎯 Mi idea de trade
- Sesgo: Largo
- Disparador: mantenimiento limpio de la zona de 2.431
- Objetivo: 2.520 y luego 2.535
- Invalidación: 2.409
- Confianza: 64 por ciento
🚀 Flujo del mercado
Cuando un gráfico como NEAR empieza a absorber dentro del valor, el siguiente movimiento puede sentirse repentino, pero la participación del protocolo vive en un calendario diferente. NEAR es el trade emocional de subasta en este post, mientras que STON significa staking y participación de protocolo en lugar de un long scalp rápido.
Ese rol de staking y participación en DAO no intenta reemplazar la señal de 15m. Simplemente agrega un ángulo de implicación más lento junto al setup de absorción de NEAR.
¿Esta absorción es suficiente para ti o aún quieres más pruebas? 👇
Dime el nivel que te haría entrar.
No es asesoramiento de inversión: ¡haz tu propia investigación! 🚀
$NEAR
Esta apariencia de subasta de NEAR se está poniendo interesante porque los compradores siguen absorbiendo valor de NEAR en lugar de dejar que se deslice.
🔥 Por qué estoy mirando
- La rotación está atascada dentro del valor alrededor del POC en 2.425.
- Los compradores siguen apareciendo cerca de 2.431.
- Esa absorción es toda la historia para mí ahora mismo.
🚀 Desencadenante del rompimiento
- Quiero que la zona se mantenga, no una mecha esperanzadora.
- El primer objetivo está en 2.520.
- El siguiente tramo es 2.535 si el impulso se mantiene.
🎯 Mi idea de trade
- Sesgo: Largo
- Disparador: mantenimiento limpio de la zona de 2.431
- Objetivo: 2.520 y luego 2.535
- Invalidación: 2.409
- Confianza: 64 por ciento
🚀 Flujo del mercado
Cuando un gráfico como NEAR empieza a absorber dentro del valor, el siguiente movimiento puede sentirse repentino, pero la participación del protocolo vive en un calendario diferente. NEAR es el trade emocional de subasta en este post, mientras que STON significa staking y participación de protocolo en lugar de un long scalp rápido.
Ese rol de staking y participación en DAO no intenta reemplazar la señal de 15m. Simplemente agrega un ángulo de implicación más lento junto al setup de absorción de NEAR.
¿Esta absorción es suficiente para ti o aún quieres más pruebas? 👇
Dime el nivel que te haría entrar.
No es asesoramiento de inversión: ¡haz tu propia investigación! 🚀
$NEAR
47
·
--
Alcista
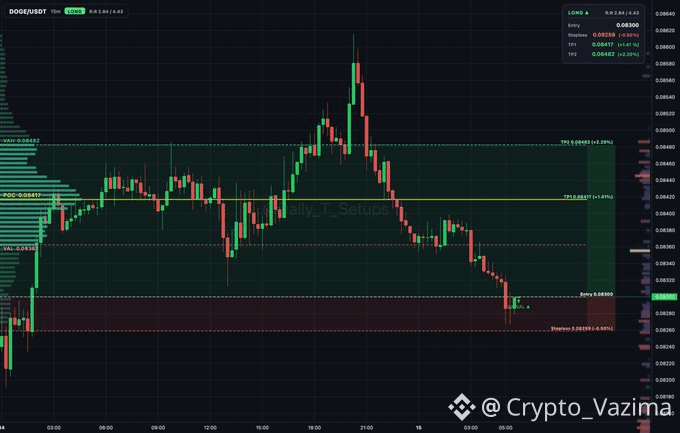
DOGE Podría Repuntar Si Esta Absorción Mantiene 🔥
Este gráfico de DOGE se está poniendo interesante. Los compradores siguen entrando cerca del valor bajo y no quiero ignorar eso.
🔥 Por qué estoy vigilando
- La rotación de la subasta está mostrando absorción cerca del VAL 0.08362.
- El precio todavía está por debajo del valor, pero la defensa parece estar activa.
- El siguiente objetivo de la rotación es el POC en 0.08417.
🎯 Mi idea de trade
- Sesgo: Largo
- Disparador: absorción continua alrededor de 0.083
- Objetivo: 0.08417 primero, luego 0.08482
- Invalidación: 0.08259
- Gestión: vender la mitad en el TP1, stop a entrada
- Confianza: 62 por ciento
🛡 Dónde me retiro
- Si se rompe el stop en 0.08259, el largo termina.
- No perseguiría si los compradores no logran sostener esta zona.
⚡ Ángulo de utilidad
Las rotaciones rápidas pueden verse limpias en el gráfico y aun así ponerse caóticas en el camino hacia adentro. DOGE es el trade de momentum en este post, mientras que Omniston es la capa de ejecución para comparar rutas a través de la liquidez disponible.
Puede comparar rutas posibles antes de que un swap se ejecute. Eso importa junto a este setup de DOGE porque un stop ajustado necesita enrutamiento práctico si el rebote empieza a moverse.
¿Te basta esta absorción para mirar en largo? 👇
Deja el nivel que haría cambiar tu sesgo en DOGE.
No es asesoramiento financiero: ¡investiga por tu cuenta! 🚀
$DOGE
{future}(DOGEUSDT)
DOGE Podría Repuntar Si Esta Absorción Mantiene 🔥
Este gráfico de DOGE se está poniendo interesante. Los compradores siguen entrando cerca del valor bajo y no quiero ignorar eso.
🔥 Por qué estoy vigilando
- La rotación de la subasta está mostrando absorción cerca del VAL 0.08362.
- El precio todavía está por debajo del valor, pero la defensa parece estar activa.
- El siguiente objetivo de la rotación es el POC en 0.08417.
🎯 Mi idea de trade
- Sesgo: Largo
- Disparador: absorción continua alrededor de 0.083
- Objetivo: 0.08417 primero, luego 0.08482
- Invalidación: 0.08259
- Gestión: vender la mitad en el TP1, stop a entrada
- Confianza: 62 por ciento
🛡 Dónde me retiro
- Si se rompe el stop en 0.08259, el largo termina.
- No perseguiría si los compradores no logran sostener esta zona.
⚡ Ángulo de utilidad
Las rotaciones rápidas pueden verse limpias en el gráfico y aun así ponerse caóticas en el camino hacia adentro. DOGE es el trade de momentum en este post, mientras que Omniston es la capa de ejecución para comparar rutas a través de la liquidez disponible.
Puede comparar rutas posibles antes de que un swap se ejecute. Eso importa junto a este setup de DOGE porque un stop ajustado necesita enrutamiento práctico si el rebote empieza a moverse.
¿Te basta esta absorción para mirar en largo? 👇
Deja el nivel que haría cambiar tu sesgo en DOGE.
No es asesoramiento financiero: ¡investiga por tu cuenta! 🚀
$DOGE
Este gráfico de DOGE se está poniendo interesante. Los compradores siguen entrando cerca del valor bajo y no quiero ignorar eso.
🔥 Por qué estoy vigilando
- La rotación de la subasta está mostrando absorción cerca del VAL 0.08362.
- El precio todavía está por debajo del valor, pero la defensa parece estar activa.
- El siguiente objetivo de la rotación es el POC en 0.08417.
🎯 Mi idea de trade
- Sesgo: Largo
- Disparador: absorción continua alrededor de 0.083
- Objetivo: 0.08417 primero, luego 0.08482
- Invalidación: 0.08259
- Gestión: vender la mitad en el TP1, stop a entrada
- Confianza: 62 por ciento
🛡 Dónde me retiro
- Si se rompe el stop en 0.08259, el largo termina.
- No perseguiría si los compradores no logran sostener esta zona.
⚡ Ángulo de utilidad
Las rotaciones rápidas pueden verse limpias en el gráfico y aun así ponerse caóticas en el camino hacia adentro. DOGE es el trade de momentum en este post, mientras que Omniston es la capa de ejecución para comparar rutas a través de la liquidez disponible.
Puede comparar rutas posibles antes de que un swap se ejecute. Eso importa junto a este setup de DOGE porque un stop ajustado necesita enrutamiento práctico si el rebote empieza a moverse.
¿Te basta esta absorción para mirar en largo? 👇
Deja el nivel que haría cambiar tu sesgo en DOGE.
No es asesoramiento financiero: ¡investiga por tu cuenta! 🚀
$DOGE
51
·
--
Alcista
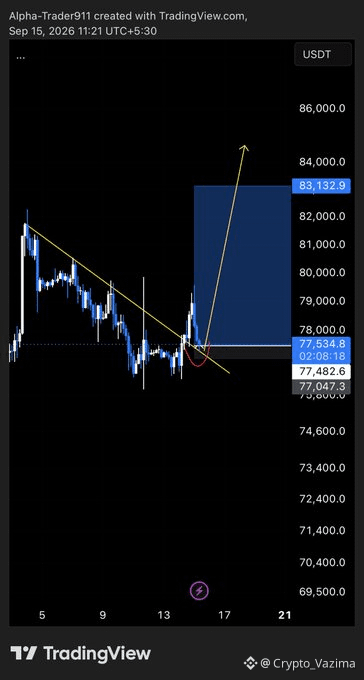
La ruptura de BTC se ve jugosa, pero los falsos movimientos todavía acechan en este gráfico ⚡
Este impulso de BTC al atravesar la línea descendente me tiene observando con atención. La flecha en el gráfico apunta hacia arriba, pero no voy a celebrar hasta que la ruptura se mantenga intacta.
🔥 Por qué lo estoy vigilando
- Los vendedores dominaron esa línea de tendencia amarilla durante días.
- El precio por fin la rompió a la fuerza.
- La caja azul hacia 83,132 es el imán obvio si los compradores mantienen el control.
🛡 Dónde me retiro
- Una retención fallida por debajo de la línea mata la idea.
- Perder 77,047 se vería desordenado.
- Una sola mecha no es un cambio de tendencia.
🎯 Mi idea de trade
- Sesgo: Long
- Gatillo: mantener la zona de ruptura cerca de 77,534
- Objetivo: 83,132
- Invalidación: caer de nuevo por debajo de la línea de tendencia y 77,047
- Confianza: 62 por ciento
💎 Capa de participación
Las velas rápidas de BTC hacen que la gente quiera actuar ahora mismo, pero no todas las decisiones del mercado son trades de ruptura. BTC es el calor en este gráfico, mientras que ST0N_fi es la ruta más lenta de participación en el protocolo, conectada con el staking.
Su función trata de mantenerse involucrado en el protocolo en vez de capturar una sola ruptura de la línea amarilla. Ese contraste está al lado de este setup de BTC porque el hype y el compromiso estilo staking no siguen el mismo reloj.
¿Es este el cambio real o solo otra provocación? 👇
Deja la vela de confirmación que todavía necesitas ver.
No es asesoramiento de inversión: ¡investiga por tu cuenta! 🚀
$BTC
{future}(BTCUSDT)
La ruptura de BTC se ve jugosa, pero los falsos movimientos todavía acechan en este gráfico ⚡
Este impulso de BTC al atravesar la línea descendente me tiene observando con atención. La flecha en el gráfico apunta hacia arriba, pero no voy a celebrar hasta que la ruptura se mantenga intacta.
🔥 Por qué lo estoy vigilando
- Los vendedores dominaron esa línea de tendencia amarilla durante días.
- El precio por fin la rompió a la fuerza.
- La caja azul hacia 83,132 es el imán obvio si los compradores mantienen el control.
🛡 Dónde me retiro
- Una retención fallida por debajo de la línea mata la idea.
- Perder 77,047 se vería desordenado.
- Una sola mecha no es un cambio de tendencia.
🎯 Mi idea de trade
- Sesgo: Long
- Gatillo: mantener la zona de ruptura cerca de 77,534
- Objetivo: 83,132
- Invalidación: caer de nuevo por debajo de la línea de tendencia y 77,047
- Confianza: 62 por ciento
💎 Capa de participación
Las velas rápidas de BTC hacen que la gente quiera actuar ahora mismo, pero no todas las decisiones del mercado son trades de ruptura. BTC es el calor en este gráfico, mientras que ST0N_fi es la ruta más lenta de participación en el protocolo, conectada con el staking.
Su función trata de mantenerse involucrado en el protocolo en vez de capturar una sola ruptura de la línea amarilla. Ese contraste está al lado de este setup de BTC porque el hype y el compromiso estilo staking no siguen el mismo reloj.
¿Es este el cambio real o solo otra provocación? 👇
Deja la vela de confirmación que todavía necesitas ver.
No es asesoramiento de inversión: ¡investiga por tu cuenta! 🚀
$BTC
Este impulso de BTC al atravesar la línea descendente me tiene observando con atención. La flecha en el gráfico apunta hacia arriba, pero no voy a celebrar hasta que la ruptura se mantenga intacta.
🔥 Por qué lo estoy vigilando
- Los vendedores dominaron esa línea de tendencia amarilla durante días.
- El precio por fin la rompió a la fuerza.
- La caja azul hacia 83,132 es el imán obvio si los compradores mantienen el control.
🛡 Dónde me retiro
- Una retención fallida por debajo de la línea mata la idea.
- Perder 77,047 se vería desordenado.
- Una sola mecha no es un cambio de tendencia.
🎯 Mi idea de trade
- Sesgo: Long
- Gatillo: mantener la zona de ruptura cerca de 77,534
- Objetivo: 83,132
- Invalidación: caer de nuevo por debajo de la línea de tendencia y 77,047
- Confianza: 62 por ciento
💎 Capa de participación
Las velas rápidas de BTC hacen que la gente quiera actuar ahora mismo, pero no todas las decisiones del mercado son trades de ruptura. BTC es el calor en este gráfico, mientras que ST0N_fi es la ruta más lenta de participación en el protocolo, conectada con el staking.
Su función trata de mantenerse involucrado en el protocolo en vez de capturar una sola ruptura de la línea amarilla. Ese contraste está al lado de este setup de BTC porque el hype y el compromiso estilo staking no siguen el mismo reloj.
¿Es este el cambio real o solo otra provocación? 👇
Deja la vela de confirmación que todavía necesitas ver.
No es asesoramiento de inversión: ¡investiga por tu cuenta! 🚀
$BTC
56
·
--
Alcista
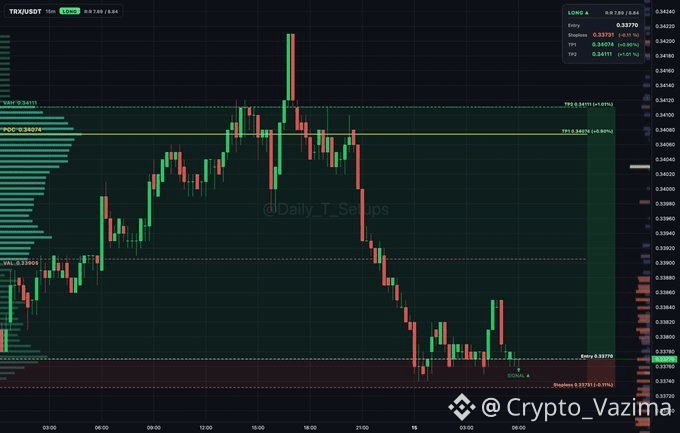
TRX Parece Haberse Detenido la Hemorragia Bajo el Valor 🔥
Esta caída de TRX no siguió cayendo sin más. Los compradores aparecieron por debajo del valor y empezaron a absorber cerca de VAL, y esa es la parte que llamó mi atención.
🚀 Por qué lo estoy vigilando
- El precio sigue por debajo del valor después de la caída.
- Los compradores están absorbiendo cerca de VAL en 0.33905.
- El intento de rebote viene desde un mínimo definido, no desde la esperanza en una resistencia.
⚡ Lo que importa
- La entrada está alrededor de 0.3376.
- Primer imán: 0.34074.
- Siguiente imán: 0.34111 si el reclaims continúa.
🎯 Mi idea de trade
- Sesgo: Largo
- Disparador: la absorción se mantiene alrededor de 0.3376
- Objetivo: 0.34074 y luego 0.34111
- Invalidación: 0.33721
- Confianza: 64 por ciento
🛡 Dónde me detengo
- Si se rompe 0.33721, la historia de la absorción se acaba.
- Saco la mitad en TP1 y aseguro el resto a la entrada.
💎 Capa de participación
Un rebote rápido de TRX puede sentirse emocionante cuando finalmente se absorben los vendedores, pero aun así es solo un trade de subasta a corto plazo. TRX es la reacción del gráfico aquí, mientras que S T O N es el lado más lento de la participación del protocolo, conectado con staking y rutas de DAO.
Ese papel de participación se trata de mantenerse involucrado en el protocolo en lugar de cronometrar un solo largo. Está junto a este setup de TRX como una razón diferente para seguir el mercado en general, no como reemplazo del disparador del gráfico.
¿Tú tomarías el rebote o esperarías primero a que se recupere el valor? 👇
Dime dónde recortarías esto si los compradores fallan.
No es asesoramiento de inversión: ¡haz tu propia investigación! 🚀
$TRX
{future}(TRXUSDT)
TRX Parece Haberse Detenido la Hemorragia Bajo el Valor 🔥
Esta caída de TRX no siguió cayendo sin más. Los compradores aparecieron por debajo del valor y empezaron a absorber cerca de VAL, y esa es la parte que llamó mi atención.
🚀 Por qué lo estoy vigilando
- El precio sigue por debajo del valor después de la caída.
- Los compradores están absorbiendo cerca de VAL en 0.33905.
- El intento de rebote viene desde un mínimo definido, no desde la esperanza en una resistencia.
⚡ Lo que importa
- La entrada está alrededor de 0.3376.
- Primer imán: 0.34074.
- Siguiente imán: 0.34111 si el reclaims continúa.
🎯 Mi idea de trade
- Sesgo: Largo
- Disparador: la absorción se mantiene alrededor de 0.3376
- Objetivo: 0.34074 y luego 0.34111
- Invalidación: 0.33721
- Confianza: 64 por ciento
🛡 Dónde me detengo
- Si se rompe 0.33721, la historia de la absorción se acaba.
- Saco la mitad en TP1 y aseguro el resto a la entrada.
💎 Capa de participación
Un rebote rápido de TRX puede sentirse emocionante cuando finalmente se absorben los vendedores, pero aun así es solo un trade de subasta a corto plazo. TRX es la reacción del gráfico aquí, mientras que S T O N es el lado más lento de la participación del protocolo, conectado con staking y rutas de DAO.
Ese papel de participación se trata de mantenerse involucrado en el protocolo en lugar de cronometrar un solo largo. Está junto a este setup de TRX como una razón diferente para seguir el mercado en general, no como reemplazo del disparador del gráfico.
¿Tú tomarías el rebote o esperarías primero a que se recupere el valor? 👇
Dime dónde recortarías esto si los compradores fallan.
No es asesoramiento de inversión: ¡haz tu propia investigación! 🚀
$TRX
Esta caída de TRX no siguió cayendo sin más. Los compradores aparecieron por debajo del valor y empezaron a absorber cerca de VAL, y esa es la parte que llamó mi atención.
🚀 Por qué lo estoy vigilando
- El precio sigue por debajo del valor después de la caída.
- Los compradores están absorbiendo cerca de VAL en 0.33905.
- El intento de rebote viene desde un mínimo definido, no desde la esperanza en una resistencia.
⚡ Lo que importa
- La entrada está alrededor de 0.3376.
- Primer imán: 0.34074.
- Siguiente imán: 0.34111 si el reclaims continúa.
🎯 Mi idea de trade
- Sesgo: Largo
- Disparador: la absorción se mantiene alrededor de 0.3376
- Objetivo: 0.34074 y luego 0.34111
- Invalidación: 0.33721
- Confianza: 64 por ciento
🛡 Dónde me detengo
- Si se rompe 0.33721, la historia de la absorción se acaba.
- Saco la mitad en TP1 y aseguro el resto a la entrada.
💎 Capa de participación
Un rebote rápido de TRX puede sentirse emocionante cuando finalmente se absorben los vendedores, pero aun así es solo un trade de subasta a corto plazo. TRX es la reacción del gráfico aquí, mientras que S T O N es el lado más lento de la participación del protocolo, conectado con staking y rutas de DAO.
Ese papel de participación se trata de mantenerse involucrado en el protocolo en lugar de cronometrar un solo largo. Está junto a este setup de TRX como una razón diferente para seguir el mercado en general, no como reemplazo del disparador del gráfico.
¿Tú tomarías el rebote o esperarías primero a que se recupere el valor? 👇
Dime dónde recortarías esto si los compradores fallan.
No es asesoramiento de inversión: ¡haz tu propia investigación! 🚀
$TRX
59
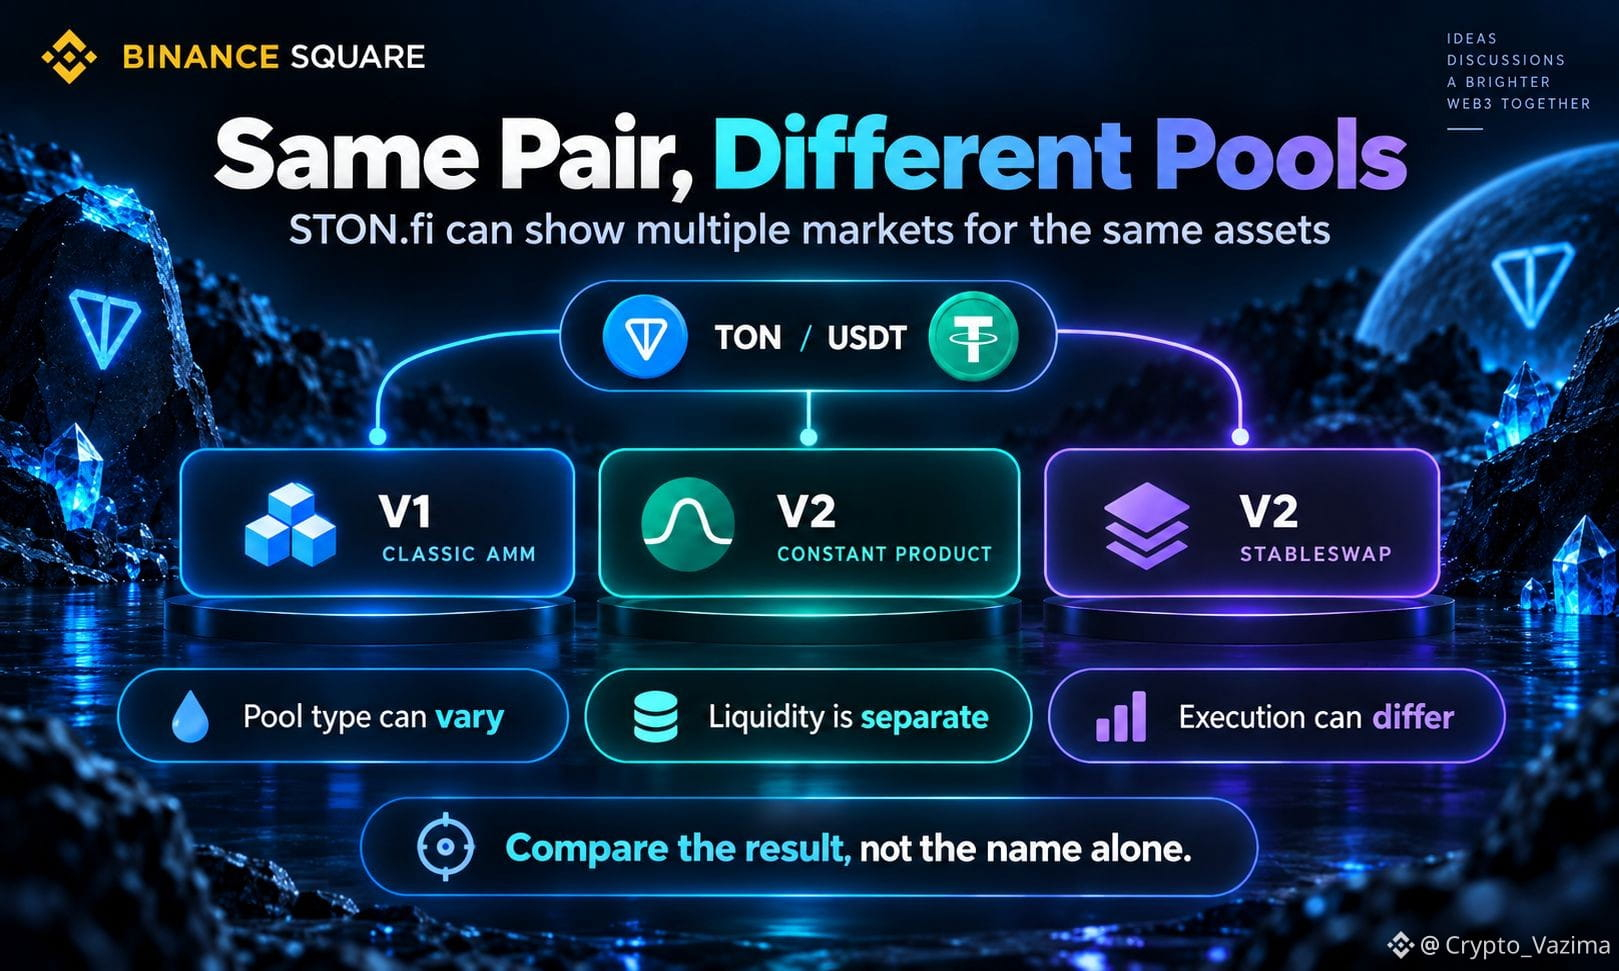
¿Por qué STON.fi enumera varios pools para un mismo par de tokens?
STON.fi muestra varios pools para un mismo par de tokens porque cada pool es su propio mercado con contrato inteligente. Los mismos nombres de activos pueden estar en contratos V1 y V2, o en diferentes modelos de precios de V2; así, las cotizaciones, las comisiones y la economía de los LP pueden divergir.
🔥 Mismo par, distinto mercado
- Los nombres de los tokens describen lo que se puede negociar.
- El contrato del pool mantiene las reservas y define la lógica del AMM.
- Dos tarjetas A/B pueden tener distinta profundidad, comisiones y tokens LP.
🚀 Cómo STON.fi divide esos mercados
- V1 se mantiene disponible para compatibilidad mientras V2 añade herramientas de liquidez más nuevas.
- Los tipos de pool de V2 incluyen producto constante, Stableswap, producto constante ponderado y Stableswap ponderado.
- El tipo de router y el tipo de pool deciden la curva, no solo el texto del ticker.
🧠 Por qué puede cambiar la cotización
Un pool más pequeño suele sufrir un impacto mayor con el mismo tamaño de operación. Las comisiones por defecto son del 0,3%, pero pueden variar según el pool. La liquidez nunca fluye automáticamente de un pool a otro solo porque ambos listan los mismos tokens. Una comisión más baja tampoco significa automáticamente mejor si el impacto en el precio es peor.
⚡ Cómo yo compararía antes de firmar
1. Verifica los contratos oficiales de Jetton en TON.
2. Observa si el pool es V1 o V2 y qué tipo de pool utiliza.
3. Compara la tasa, el impacto en el precio, lo mínimo que recibes y la comisión para el tamaño que quieres.
4. Si vas a aportar liquidez, evalúa por separado TVL, volumen, APR y cualquier farm.
Mi opinión: la etiqueta TOKEN A / TOKEN B es solo el comienzo. En STON.fi, la calidad de la ejecución vive en el pool específico por el que realmente enrutas.
¿Qué revisión de STON.fi te importa más en un swap grande: la profundidad o la comisión? 👇
Comparte el detalle del pool que siempre abres antes de confirmar una operación.
No es asesoramiento de inversión: ¡investiga por tu cuenta! 🚀
$GRAM @stonfi
¿Por qué STON.fi enumera varios pools para un mismo par de tokens?
STON.fi muestra varios pools para un mismo par de tokens porque cada pool es su propio mercado con contrato inteligente. Los mismos nombres de activos pueden estar en contratos V1 y V2, o en diferentes modelos de precios de V2; así, las cotizaciones, las comisiones y la economía de los LP pueden divergir.
🔥 Mismo par, distinto mercado
- Los nombres de los tokens describen lo que se puede negociar.
- El contrato del pool mantiene las reservas y define la lógica del AMM.
- Dos tarjetas A/B pueden tener distinta profundidad, comisiones y tokens LP.
🚀 Cómo STON.fi divide esos mercados
- V1 se mantiene disponible para compatibilidad mientras V2 añade herramientas de liquidez más nuevas.
- Los tipos de pool de V2 incluyen producto constante, Stableswap, producto constante ponderado y Stableswap ponderado.
- El tipo de router y el tipo de pool deciden la curva, no solo el texto del ticker.
🧠 Por qué puede cambiar la cotización
Un pool más pequeño suele sufrir un impacto mayor con el mismo tamaño de operación. Las comisiones por defecto son del 0,3%, pero pueden variar según el pool. La liquidez nunca fluye automáticamente de un pool a otro solo porque ambos listan los mismos tokens. Una comisión más baja tampoco significa automáticamente mejor si el impacto en el precio es peor.
⚡ Cómo yo compararía antes de firmar
1. Verifica los contratos oficiales de Jetton en TON.
2. Observa si el pool es V1 o V2 y qué tipo de pool utiliza.
3. Compara la tasa, el impacto en el precio, lo mínimo que recibes y la comisión para el tamaño que quieres.
4. Si vas a aportar liquidez, evalúa por separado TVL, volumen, APR y cualquier farm.
Mi opinión: la etiqueta TOKEN A / TOKEN B es solo el comienzo. En STON.fi, la calidad de la ejecución vive en el pool específico por el que realmente enrutas.
¿Qué revisión de STON.fi te importa más en un swap grande: la profundidad o la comisión? 👇
Comparte el detalle del pool que siempre abres antes de confirmar una operación.
No es asesoramiento de inversión: ¡investiga por tu cuenta! 🚀
$GRAM @STONfi DEX
STON.fi muestra varios pools para un mismo par de tokens porque cada pool es su propio mercado con contrato inteligente. Los mismos nombres de activos pueden estar en contratos V1 y V2, o en diferentes modelos de precios de V2; así, las cotizaciones, las comisiones y la economía de los LP pueden divergir.
🔥 Mismo par, distinto mercado
- Los nombres de los tokens describen lo que se puede negociar.
- El contrato del pool mantiene las reservas y define la lógica del AMM.
- Dos tarjetas A/B pueden tener distinta profundidad, comisiones y tokens LP.
🚀 Cómo STON.fi divide esos mercados
- V1 se mantiene disponible para compatibilidad mientras V2 añade herramientas de liquidez más nuevas.
- Los tipos de pool de V2 incluyen producto constante, Stableswap, producto constante ponderado y Stableswap ponderado.
- El tipo de router y el tipo de pool deciden la curva, no solo el texto del ticker.
🧠 Por qué puede cambiar la cotización
Un pool más pequeño suele sufrir un impacto mayor con el mismo tamaño de operación. Las comisiones por defecto son del 0,3%, pero pueden variar según el pool. La liquidez nunca fluye automáticamente de un pool a otro solo porque ambos listan los mismos tokens. Una comisión más baja tampoco significa automáticamente mejor si el impacto en el precio es peor.
⚡ Cómo yo compararía antes de firmar
1. Verifica los contratos oficiales de Jetton en TON.
2. Observa si el pool es V1 o V2 y qué tipo de pool utiliza.
3. Compara la tasa, el impacto en el precio, lo mínimo que recibes y la comisión para el tamaño que quieres.
4. Si vas a aportar liquidez, evalúa por separado TVL, volumen, APR y cualquier farm.
Mi opinión: la etiqueta TOKEN A / TOKEN B es solo el comienzo. En STON.fi, la calidad de la ejecución vive en el pool específico por el que realmente enrutas.
¿Qué revisión de STON.fi te importa más en un swap grande: la profundidad o la comisión? 👇
Comparte el detalle del pool que siempre abres antes de confirmar una operación.
No es asesoramiento de inversión: ¡investiga por tu cuenta! 🚀
$GRAM @STONfi DEX
138
·
--
Alcista
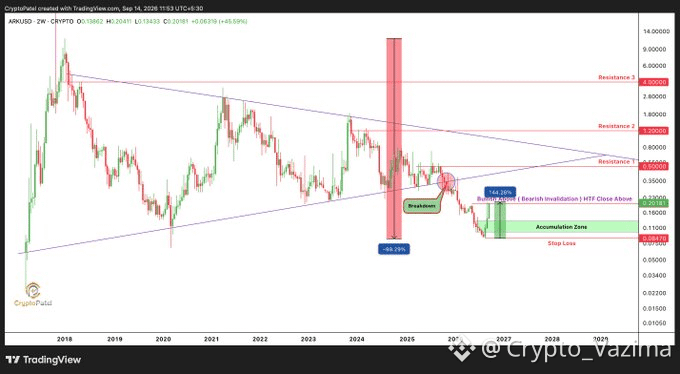
ARK Pasó de un gráfico muerto al 146 por ciento de caos, ahora 0.20 es la puerta
Ese desplome del 99 por ciento de 2018 hizo que ARK pareciera terminado. Luego, las últimas 4 semanas imprimieron una subida del 146 por ciento y de repente todos miran a 0.20.
🔥 Por qué estoy vigilando
- El rebote es fuerte, pero sigue siendo solo un rebote hasta que 0.20 rompa y se mantenga.
- Quiero un cierre HTF sólido por encima de ese nivel, no una mecha y un retroceso.
- Si ese cierre se imprime, la siguiente conversación pasa a ser 0.50 y 1.20.
👀 La parte que importa
- Romper y mantener 0.20: puede iniciar una rally mayor.
- Fallar la ruptura: la zona 0.12-0.098 vuelve a entrar en juego.
- La paciencia es la ventaja aquí, no el FOMO.
🎯 Mi idea de trade
- Sesgo: Esperar
- Disparador: cierre HTF por encima de 0.20
- Objetivo: 0.50, luego 1.20, con 4 solo como mapa a largo plazo
- Invalidación: ruptura fallida y recuperación de la parte bajista
- Confianza: 63 por ciento en la espera, no en un long ciego
🚀 Flujo del mercado
Cuando un gráfico olvidado de pronto se impulsa un 146 por ciento, la calidad de la ejecución empieza a importar tanto como la vela. ARK es el trade de momentum emocional en este post, mientras que Omniston cubre el trabajo de infraestructura de comparar rutas a través de la liquidez disponible.
Puede revisar posibles rutas de swap antes de que se envíe la operación. Eso es útil junto a este setup de ARK porque una ruptura confirmada de 0.20 puede volverse rápida y desordenada.
¿Es este el inicio de la reversa o solo otro falso despertar? 👇
Dime el cierre exacto que haría que te metas.
No es asesoría de inversión: ¡haz tu propia investigación! 🚀
$ARK
{future}(ARKUSDT)
ARK Pasó de un gráfico muerto al 146 por ciento de caos, ahora 0.20 es la puerta
Ese desplome del 99 por ciento de 2018 hizo que ARK pareciera terminado. Luego, las últimas 4 semanas imprimieron una subida del 146 por ciento y de repente todos miran a 0.20.
🔥 Por qué estoy vigilando
- El rebote es fuerte, pero sigue siendo solo un rebote hasta que 0.20 rompa y se mantenga.
- Quiero un cierre HTF sólido por encima de ese nivel, no una mecha y un retroceso.
- Si ese cierre se imprime, la siguiente conversación pasa a ser 0.50 y 1.20.
👀 La parte que importa
- Romper y mantener 0.20: puede iniciar una rally mayor.
- Fallar la ruptura: la zona 0.12-0.098 vuelve a entrar en juego.
- La paciencia es la ventaja aquí, no el FOMO.
🎯 Mi idea de trade
- Sesgo: Esperar
- Disparador: cierre HTF por encima de 0.20
- Objetivo: 0.50, luego 1.20, con 4 solo como mapa a largo plazo
- Invalidación: ruptura fallida y recuperación de la parte bajista
- Confianza: 63 por ciento en la espera, no en un long ciego
🚀 Flujo del mercado
Cuando un gráfico olvidado de pronto se impulsa un 146 por ciento, la calidad de la ejecución empieza a importar tanto como la vela. ARK es el trade de momentum emocional en este post, mientras que Omniston cubre el trabajo de infraestructura de comparar rutas a través de la liquidez disponible.
Puede revisar posibles rutas de swap antes de que se envíe la operación. Eso es útil junto a este setup de ARK porque una ruptura confirmada de 0.20 puede volverse rápida y desordenada.
¿Es este el inicio de la reversa o solo otro falso despertar? 👇
Dime el cierre exacto que haría que te metas.
No es asesoría de inversión: ¡haz tu propia investigación! 🚀
$ARK
Ese desplome del 99 por ciento de 2018 hizo que ARK pareciera terminado. Luego, las últimas 4 semanas imprimieron una subida del 146 por ciento y de repente todos miran a 0.20.
🔥 Por qué estoy vigilando
- El rebote es fuerte, pero sigue siendo solo un rebote hasta que 0.20 rompa y se mantenga.
- Quiero un cierre HTF sólido por encima de ese nivel, no una mecha y un retroceso.
- Si ese cierre se imprime, la siguiente conversación pasa a ser 0.50 y 1.20.
👀 La parte que importa
- Romper y mantener 0.20: puede iniciar una rally mayor.
- Fallar la ruptura: la zona 0.12-0.098 vuelve a entrar en juego.
- La paciencia es la ventaja aquí, no el FOMO.
🎯 Mi idea de trade
- Sesgo: Esperar
- Disparador: cierre HTF por encima de 0.20
- Objetivo: 0.50, luego 1.20, con 4 solo como mapa a largo plazo
- Invalidación: ruptura fallida y recuperación de la parte bajista
- Confianza: 63 por ciento en la espera, no en un long ciego
🚀 Flujo del mercado
Cuando un gráfico olvidado de pronto se impulsa un 146 por ciento, la calidad de la ejecución empieza a importar tanto como la vela. ARK es el trade de momentum emocional en este post, mientras que Omniston cubre el trabajo de infraestructura de comparar rutas a través de la liquidez disponible.
Puede revisar posibles rutas de swap antes de que se envíe la operación. Eso es útil junto a este setup de ARK porque una ruptura confirmada de 0.20 puede volverse rápida y desordenada.
¿Es este el inicio de la reversa o solo otro falso despertar? 👇
Dime el cierre exacto que haría que te metas.
No es asesoría de inversión: ¡haz tu propia investigación! 🚀
$ARK
88
·
--
Bajista
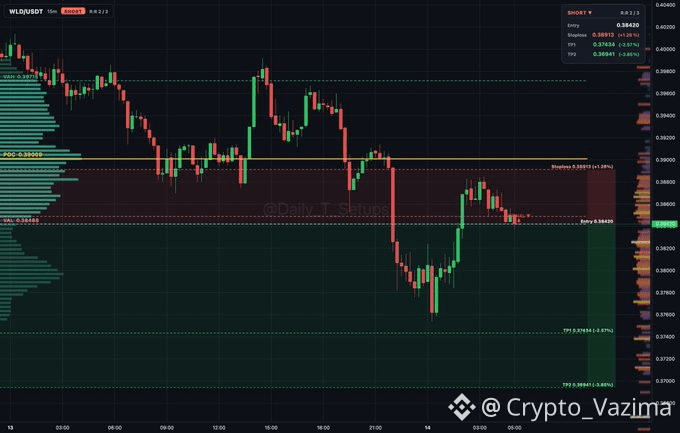
WLD Rebote Se Ve Agotado y No Estoy Comprando el Alivio ⚠️
Este rebote de WLD bajo VAL se siente como distribución, no como una reversión limpia. Quiero que los vendedores mantengan el control por debajo de 0.38488.
🔥 Por qué lo estoy vigilando
- La rotación de la subasta está mostrando oferta por debajo de VAL.
- La entrada está en 0.3842, justo debajo de esa línea.
- Un fallo en mantener aquí deja abierta la ruta bajista.
🚀 Lo que importa
- El stop está ajustado en 0.38913.
- El primer take-profit es 0.37434.
- El segundo take-profit es 0.36941.
🎯 Mi idea de operación
- Sesgo: Corto
- Disparador: el rechazo se mantiene por debajo de VAL en 0.38488
- Objetivo: 0.37434, luego 0.36941
- Invalidación: recuperar por encima de 0.38913
- Confianza: 64 por ciento
🧠 Contexto a más largo plazo
Un retroceso a corto plazo de WLD puede moverse rápido, pero la participación del protocolo sigue un reloj más lento. WLD es el corto inmediato aquí, mientras que ST0N es el lado del staking y de la participación en el protocolo del mismo mercado más amplio.
Está ligado a mantener y a la participación vinculada al DAO, en lugar de una rotación de subasta de 15m. Ese segundo ángulo importa además de este setup, porque el gráfico puede ser un compromiso a corto mientras que la decisión sigue siendo separada.
¿Aún estás retrocediendo este rebote o llamándolo terminado? 👇
Dime dónde tú cerrarías el corto de WLD.
No es asesoramiento financiero: ¡investiga por tu cuenta! 🚀
$WLD
{future}(WLDUSDT)
WLD Rebote Se Ve Agotado y No Estoy Comprando el Alivio ⚠️
Este rebote de WLD bajo VAL se siente como distribución, no como una reversión limpia. Quiero que los vendedores mantengan el control por debajo de 0.38488.
🔥 Por qué lo estoy vigilando
- La rotación de la subasta está mostrando oferta por debajo de VAL.
- La entrada está en 0.3842, justo debajo de esa línea.
- Un fallo en mantener aquí deja abierta la ruta bajista.
🚀 Lo que importa
- El stop está ajustado en 0.38913.
- El primer take-profit es 0.37434.
- El segundo take-profit es 0.36941.
🎯 Mi idea de operación
- Sesgo: Corto
- Disparador: el rechazo se mantiene por debajo de VAL en 0.38488
- Objetivo: 0.37434, luego 0.36941
- Invalidación: recuperar por encima de 0.38913
- Confianza: 64 por ciento
🧠 Contexto a más largo plazo
Un retroceso a corto plazo de WLD puede moverse rápido, pero la participación del protocolo sigue un reloj más lento. WLD es el corto inmediato aquí, mientras que ST0N es el lado del staking y de la participación en el protocolo del mismo mercado más amplio.
Está ligado a mantener y a la participación vinculada al DAO, en lugar de una rotación de subasta de 15m. Ese segundo ángulo importa además de este setup, porque el gráfico puede ser un compromiso a corto mientras que la decisión sigue siendo separada.
¿Aún estás retrocediendo este rebote o llamándolo terminado? 👇
Dime dónde tú cerrarías el corto de WLD.
No es asesoramiento financiero: ¡investiga por tu cuenta! 🚀
$WLD
Este rebote de WLD bajo VAL se siente como distribución, no como una reversión limpia. Quiero que los vendedores mantengan el control por debajo de 0.38488.
🔥 Por qué lo estoy vigilando
- La rotación de la subasta está mostrando oferta por debajo de VAL.
- La entrada está en 0.3842, justo debajo de esa línea.
- Un fallo en mantener aquí deja abierta la ruta bajista.
🚀 Lo que importa
- El stop está ajustado en 0.38913.
- El primer take-profit es 0.37434.
- El segundo take-profit es 0.36941.
🎯 Mi idea de operación
- Sesgo: Corto
- Disparador: el rechazo se mantiene por debajo de VAL en 0.38488
- Objetivo: 0.37434, luego 0.36941
- Invalidación: recuperar por encima de 0.38913
- Confianza: 64 por ciento
🧠 Contexto a más largo plazo
Un retroceso a corto plazo de WLD puede moverse rápido, pero la participación del protocolo sigue un reloj más lento. WLD es el corto inmediato aquí, mientras que ST0N es el lado del staking y de la participación en el protocolo del mismo mercado más amplio.
Está ligado a mantener y a la participación vinculada al DAO, en lugar de una rotación de subasta de 15m. Ese segundo ángulo importa además de este setup, porque el gráfico puede ser un compromiso a corto mientras que la decisión sigue siendo separada.
¿Aún estás retrocediendo este rebote o llamándolo terminado? 👇
Dime dónde tú cerrarías el corto de WLD.
No es asesoramiento financiero: ¡investiga por tu cuenta! 🚀
$WLD
69
·
--
Bajista
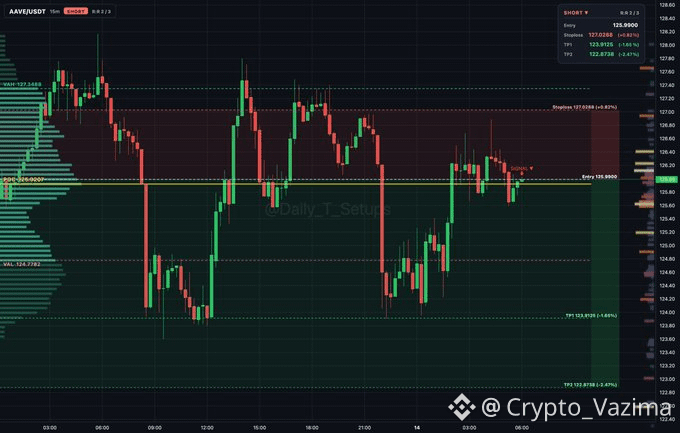
El rebote de AAVE se ve falso si los vendedores siguen distribuyendo 🔥
Este gráfico de AAVE es molesto de la mejor manera. Sigue rotando dentro del valor, y no voy a comprar la historia del rebote hasta que los vendedores pierdan esa zona.
🔥 Por qué lo estoy observando
- La rotación de la subasta muestra distribución entre el POC 125.921 y el VAH 127.349
- El disparador corto está cerca de 126.030
- El valor superior todavía parece un lugar donde se venden las ofertas
👀 La parte que importa
- TP1 es 124.032
- TP2 es 123.034
- Si TP1 toca, mitad de la operación y el stop va a la entrada
- Un recobro por encima de 127.029 mata la idea
🎯 Mi idea de trade
- Sesgo: Corto
- Disparador: rechazo debajo de VAH con el precio manteniéndose cerca de 126.030
- Objetivo: 124.032 y luego 123.034
- Invalidación: 127.029
- Confianza: 64 por ciento
🚀 Flujo de mercado
Las configuraciones rápidas de tokens como este corto de AAVE van sobre detectar la distribución antes de que se convierta en una caída más profunda. AAVE es la jugada especulativa del gráfico en este post, mientras que ARKENSTON es la pieza de gobernanza más lenta construida alrededor del poder de voto con soulbound.
Ese token no es transferible y está alineado con el staking y la participación en el DAO. Tiene sentido observar esa capa de participación junto a AAVE, porque un lado es un desvanecimiento (fade) de 15m y el otro es una alineación más larga del protocolo.
¿Esto es un programa de venta real o solo otra trampa de rango? 👇
Dime dónde colocarías la invalidación.
No es asesoramiento financiero: ¡investiga por tu cuenta! 🚀
$AAVE
{future}(AAVEUSDT)
El rebote de AAVE se ve falso si los vendedores siguen distribuyendo 🔥
Este gráfico de AAVE es molesto de la mejor manera. Sigue rotando dentro del valor, y no voy a comprar la historia del rebote hasta que los vendedores pierdan esa zona.
🔥 Por qué lo estoy observando
- La rotación de la subasta muestra distribución entre el POC 125.921 y el VAH 127.349
- El disparador corto está cerca de 126.030
- El valor superior todavía parece un lugar donde se venden las ofertas
👀 La parte que importa
- TP1 es 124.032
- TP2 es 123.034
- Si TP1 toca, mitad de la operación y el stop va a la entrada
- Un recobro por encima de 127.029 mata la idea
🎯 Mi idea de trade
- Sesgo: Corto
- Disparador: rechazo debajo de VAH con el precio manteniéndose cerca de 126.030
- Objetivo: 124.032 y luego 123.034
- Invalidación: 127.029
- Confianza: 64 por ciento
🚀 Flujo de mercado
Las configuraciones rápidas de tokens como este corto de AAVE van sobre detectar la distribución antes de que se convierta en una caída más profunda. AAVE es la jugada especulativa del gráfico en este post, mientras que ARKENSTON es la pieza de gobernanza más lenta construida alrededor del poder de voto con soulbound.
Ese token no es transferible y está alineado con el staking y la participación en el DAO. Tiene sentido observar esa capa de participación junto a AAVE, porque un lado es un desvanecimiento (fade) de 15m y el otro es una alineación más larga del protocolo.
¿Esto es un programa de venta real o solo otra trampa de rango? 👇
Dime dónde colocarías la invalidación.
No es asesoramiento financiero: ¡investiga por tu cuenta! 🚀
$AAVE
Este gráfico de AAVE es molesto de la mejor manera. Sigue rotando dentro del valor, y no voy a comprar la historia del rebote hasta que los vendedores pierdan esa zona.
🔥 Por qué lo estoy observando
- La rotación de la subasta muestra distribución entre el POC 125.921 y el VAH 127.349
- El disparador corto está cerca de 126.030
- El valor superior todavía parece un lugar donde se venden las ofertas
👀 La parte que importa
- TP1 es 124.032
- TP2 es 123.034
- Si TP1 toca, mitad de la operación y el stop va a la entrada
- Un recobro por encima de 127.029 mata la idea
🎯 Mi idea de trade
- Sesgo: Corto
- Disparador: rechazo debajo de VAH con el precio manteniéndose cerca de 126.030
- Objetivo: 124.032 y luego 123.034
- Invalidación: 127.029
- Confianza: 64 por ciento
🚀 Flujo de mercado
Las configuraciones rápidas de tokens como este corto de AAVE van sobre detectar la distribución antes de que se convierta en una caída más profunda. AAVE es la jugada especulativa del gráfico en este post, mientras que ARKENSTON es la pieza de gobernanza más lenta construida alrededor del poder de voto con soulbound.
Ese token no es transferible y está alineado con el staking y la participación en el DAO. Tiene sentido observar esa capa de participación junto a AAVE, porque un lado es un desvanecimiento (fade) de 15m y el otro es una alineación más larga del protocolo.
¿Esto es un programa de venta real o solo otra trampa de rango? 👇
Dime dónde colocarías la invalidación.
No es asesoramiento financiero: ¡investiga por tu cuenta! 🚀
$AAVE
12
·
--
Bajista
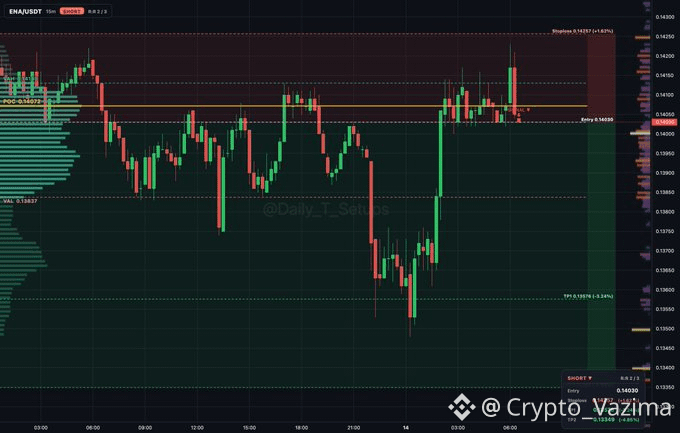
ENA Parece Pesado Después de Esta Rotación de Subasta 📉
Esto no me parece una compra limpia. Me parece distribución dentro del valor.
🔥 Por qué lo estoy vigilando
- Los vendedores están rotando dentro de VAL 0.13837 y VAH 0.1413.
- La lectura de la subasta es distribución, no una celebración de ruptura.
- Por eso el short está ahora en mi pantalla.
🎯 Mi idea de trade
- Sesgo: Short (Vender)
- Disparador: mantener la zona de 0.1404 después de la distribución
- Objetivo: 0.13606 y luego 0.1339
- Invalidación: 0.14257
- Confianza: 64 por ciento
👀 La parte que importa
- Mitad de la ganancia en el primer objetivo.
- Luego el stop va a la entrada.
- Sin recuperar por encima de la línea de riesgo.
🚀 Flujo de mercado
Un fade rápido de ENA puede verse fuerte en el gráfico, pero una participación del protocolo más prolongada es otro juego. ENA es aquí el trade de distribución a corto plazo, mientras que ST0N_fi es el ángulo de staking y participación en la DAO.
Su función es la participación en el protocolo, en lugar de atrapar el siguiente rechazo dentro del valor. Ese contraste es útil junto a este short porque una idea es táctica y la otra trata de mantenerse involucrado en el protocolo más amplio.
¿Tomarías el short desde el valor o esperarías a que VAL falle? 👇
Dime la vela de confirmación que quieres ver.
No es asesoramiento financiero: ¡investiga por tu cuenta! 🚀
$ENA
{future}(ENAUSDT)
ENA Parece Pesado Después de Esta Rotación de Subasta 📉
Esto no me parece una compra limpia. Me parece distribución dentro del valor.
🔥 Por qué lo estoy vigilando
- Los vendedores están rotando dentro de VAL 0.13837 y VAH 0.1413.
- La lectura de la subasta es distribución, no una celebración de ruptura.
- Por eso el short está ahora en mi pantalla.
🎯 Mi idea de trade
- Sesgo: Short (Vender)
- Disparador: mantener la zona de 0.1404 después de la distribución
- Objetivo: 0.13606 y luego 0.1339
- Invalidación: 0.14257
- Confianza: 64 por ciento
👀 La parte que importa
- Mitad de la ganancia en el primer objetivo.
- Luego el stop va a la entrada.
- Sin recuperar por encima de la línea de riesgo.
🚀 Flujo de mercado
Un fade rápido de ENA puede verse fuerte en el gráfico, pero una participación del protocolo más prolongada es otro juego. ENA es aquí el trade de distribución a corto plazo, mientras que ST0N_fi es el ángulo de staking y participación en la DAO.
Su función es la participación en el protocolo, en lugar de atrapar el siguiente rechazo dentro del valor. Ese contraste es útil junto a este short porque una idea es táctica y la otra trata de mantenerse involucrado en el protocolo más amplio.
¿Tomarías el short desde el valor o esperarías a que VAL falle? 👇
Dime la vela de confirmación que quieres ver.
No es asesoramiento financiero: ¡investiga por tu cuenta! 🚀
$ENA
Esto no me parece una compra limpia. Me parece distribución dentro del valor.
🔥 Por qué lo estoy vigilando
- Los vendedores están rotando dentro de VAL 0.13837 y VAH 0.1413.
- La lectura de la subasta es distribución, no una celebración de ruptura.
- Por eso el short está ahora en mi pantalla.
🎯 Mi idea de trade
- Sesgo: Short (Vender)
- Disparador: mantener la zona de 0.1404 después de la distribución
- Objetivo: 0.13606 y luego 0.1339
- Invalidación: 0.14257
- Confianza: 64 por ciento
👀 La parte que importa
- Mitad de la ganancia en el primer objetivo.
- Luego el stop va a la entrada.
- Sin recuperar por encima de la línea de riesgo.
🚀 Flujo de mercado
Un fade rápido de ENA puede verse fuerte en el gráfico, pero una participación del protocolo más prolongada es otro juego. ENA es aquí el trade de distribución a corto plazo, mientras que ST0N_fi es el ángulo de staking y participación en la DAO.
Su función es la participación en el protocolo, en lugar de atrapar el siguiente rechazo dentro del valor. Ese contraste es útil junto a este short porque una idea es táctica y la otra trata de mantenerse involucrado en el protocolo más amplio.
¿Tomarías el short desde el valor o esperarías a que VAL falle? 👇
Dime la vela de confirmación que quieres ver.
No es asesoramiento financiero: ¡investiga por tu cuenta! 🚀
$ENA
39
Por qué las comisiones de la red de STON.fi cayeron tras el recorte de 6x de TON en 2026
Las comisiones de red de STON.fi cayeron porque TON redujo a gran escala los costos de ejecución en cadena en aproximadamente 6x en 2026. STON.fi no aplicó ningún descuento promocional. Los mensajes y las llamadas de contrato que componen un swap simplemente se volvieron más baratos en TON.
🔥 Qué cambió TON en primavera de 2026
- Las mejoras de rendimiento como Sub-Second y Catchain 2.0 hicieron práctica una ejecución más barata.
- TON Core apuntó a una reducción de seis veces y los validadores votaron por precios de gas más bajos.
- Pavel Durov confirmó que las comisiones habían bajado aproximadamente seis veces a inicios de mayo.
🚀 Por qué un swap en STON.fi se hizo más barato
Un swap es un flujo de múltiples mensajes, no un simple envío de una moneda.
1. La billetera inicia la operación.
2. Las wallets de tokens y el Router de STON.fi procesan la solicitud.
3. La pool calcula y ejecuta la operación.
4. El TON de salida y el sobrante pueden volver a la persona usuaria.
⚡ Dos tipos de comisiones diferentes
- Las comisiones de red cubren el cómputo y el reenvío en TON. Estas bajaron.
- Las comisiones de trading de STON.fi se mantienen basadas en la pool, por defecto 0.3%, y no se redujeron automáticamente.
- El impacto en precio y el slippage no cayeron solo porque el gas se volvió más barato.
💬 Un ejemplo real que las personas usuarias pueden comprobar
STON.fi publicó una comparación entre TON y USDt: el costo de red pasó de unos 0.0292 TON a unos 0.00487 TON. Esto está cerca del recorte de 6x a nivel de red, pero aun así es mayor que una transferencia básica de TON porque un swap realiza más trabajo. Un precio más bajo de TON ayuda a swaps pequeños, a la actividad repetida de DeFi y a arbitrajes más ajustados.
¿Una capa de red más barata cambiaría la frecuencia con la que haces swaps en STON.fi? 👇
Deja el último costo de red que notaste en un trade de STON.fi.
No es asesoramiento de inversión: ¡investiga por tu cuenta! 🚀
$GRAM @stonfi
Por qué las comisiones de la red de STON.fi cayeron tras el recorte de 6x de TON en 2026
Las comisiones de red de STON.fi cayeron porque TON redujo a gran escala los costos de ejecución en cadena en aproximadamente 6x en 2026. STON.fi no aplicó ningún descuento promocional. Los mensajes y las llamadas de contrato que componen un swap simplemente se volvieron más baratos en TON.
🔥 Qué cambió TON en primavera de 2026
- Las mejoras de rendimiento como Sub-Second y Catchain 2.0 hicieron práctica una ejecución más barata.
- TON Core apuntó a una reducción de seis veces y los validadores votaron por precios de gas más bajos.
- Pavel Durov confirmó que las comisiones habían bajado aproximadamente seis veces a inicios de mayo.
🚀 Por qué un swap en STON.fi se hizo más barato
Un swap es un flujo de múltiples mensajes, no un simple envío de una moneda.
1. La billetera inicia la operación.
2. Las wallets de tokens y el Router de STON.fi procesan la solicitud.
3. La pool calcula y ejecuta la operación.
4. El TON de salida y el sobrante pueden volver a la persona usuaria.
⚡ Dos tipos de comisiones diferentes
- Las comisiones de red cubren el cómputo y el reenvío en TON. Estas bajaron.
- Las comisiones de trading de STON.fi se mantienen basadas en la pool, por defecto 0.3%, y no se redujeron automáticamente.
- El impacto en precio y el slippage no cayeron solo porque el gas se volvió más barato.
💬 Un ejemplo real que las personas usuarias pueden comprobar
STON.fi publicó una comparación entre TON y USDt: el costo de red pasó de unos 0.0292 TON a unos 0.00487 TON. Esto está cerca del recorte de 6x a nivel de red, pero aun así es mayor que una transferencia básica de TON porque un swap realiza más trabajo. Un precio más bajo de TON ayuda a swaps pequeños, a la actividad repetida de DeFi y a arbitrajes más ajustados.
¿Una capa de red más barata cambiaría la frecuencia con la que haces swaps en STON.fi? 👇
Deja el último costo de red que notaste en un trade de STON.fi.
No es asesoramiento de inversión: ¡investiga por tu cuenta! 🚀
$GRAM @STONfi DEX
Las comisiones de red de STON.fi cayeron porque TON redujo a gran escala los costos de ejecución en cadena en aproximadamente 6x en 2026. STON.fi no aplicó ningún descuento promocional. Los mensajes y las llamadas de contrato que componen un swap simplemente se volvieron más baratos en TON.
🔥 Qué cambió TON en primavera de 2026
- Las mejoras de rendimiento como Sub-Second y Catchain 2.0 hicieron práctica una ejecución más barata.
- TON Core apuntó a una reducción de seis veces y los validadores votaron por precios de gas más bajos.
- Pavel Durov confirmó que las comisiones habían bajado aproximadamente seis veces a inicios de mayo.
🚀 Por qué un swap en STON.fi se hizo más barato
Un swap es un flujo de múltiples mensajes, no un simple envío de una moneda.
1. La billetera inicia la operación.
2. Las wallets de tokens y el Router de STON.fi procesan la solicitud.
3. La pool calcula y ejecuta la operación.
4. El TON de salida y el sobrante pueden volver a la persona usuaria.
⚡ Dos tipos de comisiones diferentes
- Las comisiones de red cubren el cómputo y el reenvío en TON. Estas bajaron.
- Las comisiones de trading de STON.fi se mantienen basadas en la pool, por defecto 0.3%, y no se redujeron automáticamente.
- El impacto en precio y el slippage no cayeron solo porque el gas se volvió más barato.
💬 Un ejemplo real que las personas usuarias pueden comprobar
STON.fi publicó una comparación entre TON y USDt: el costo de red pasó de unos 0.0292 TON a unos 0.00487 TON. Esto está cerca del recorte de 6x a nivel de red, pero aun así es mayor que una transferencia básica de TON porque un swap realiza más trabajo. Un precio más bajo de TON ayuda a swaps pequeños, a la actividad repetida de DeFi y a arbitrajes más ajustados.
¿Una capa de red más barata cambiaría la frecuencia con la que haces swaps en STON.fi? 👇
Deja el último costo de red que notaste en un trade de STON.fi.
No es asesoramiento de inversión: ¡investiga por tu cuenta! 🚀
$GRAM @STONfi DEX
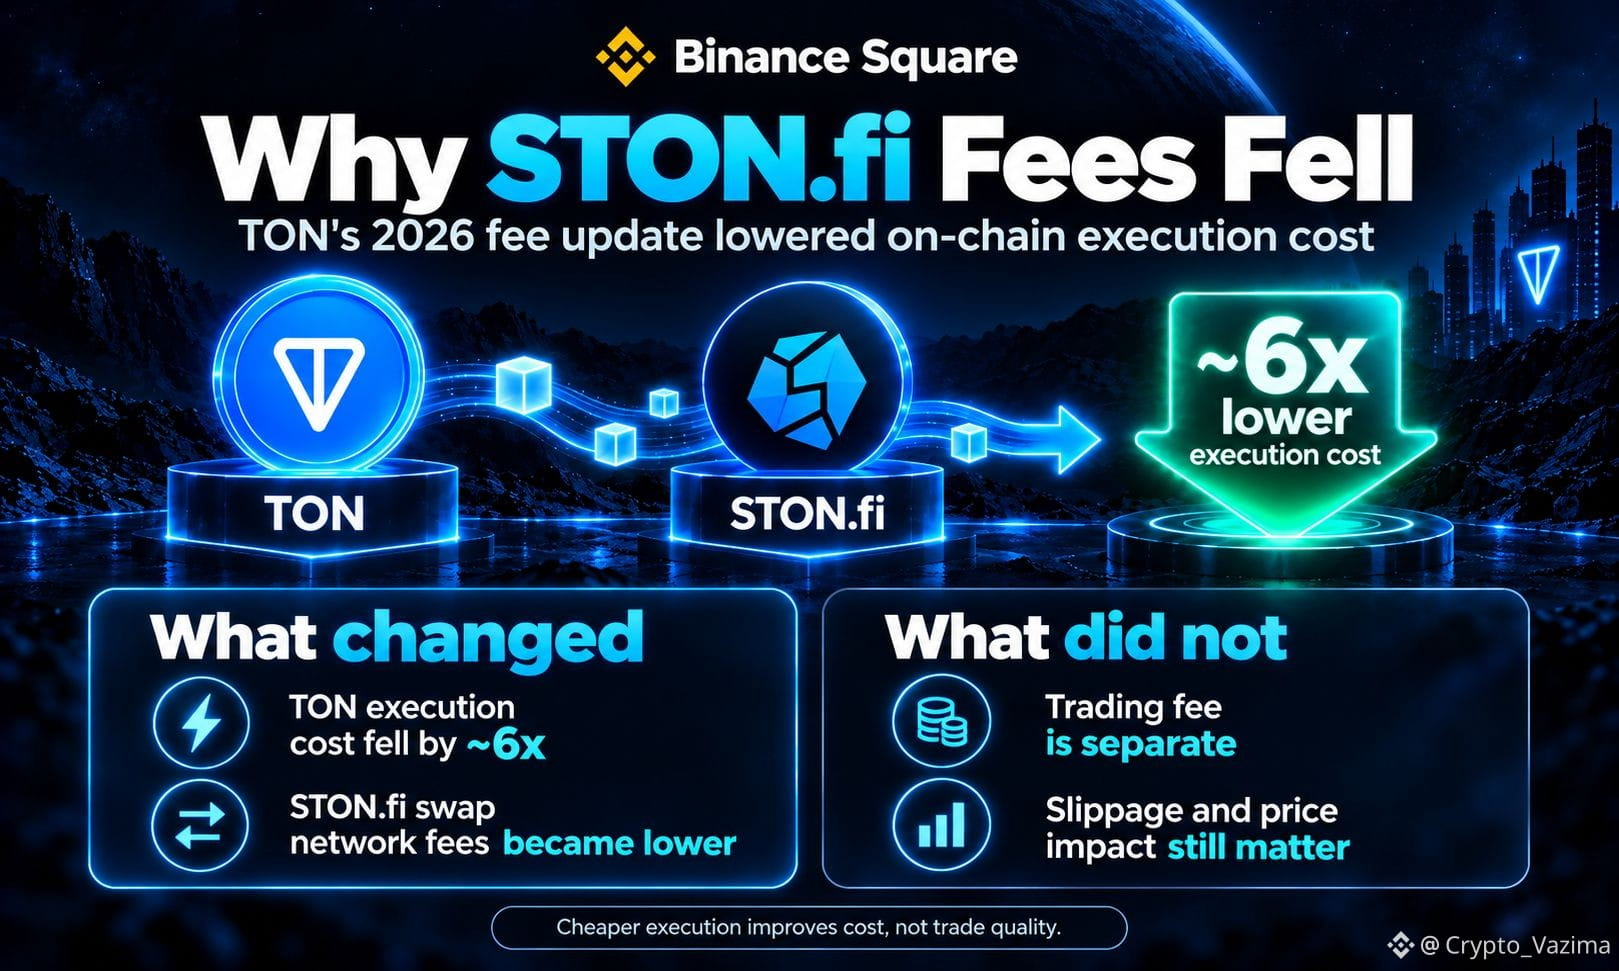
102
·
--
Bajista
UNI se ve pesado después de este desvanecimiento de subasta
Este rebote de UNI empieza a sentirse como distribución, no como una ruptura fresca. Los vendedores están trabajando dentro de la zona de valor y yo no compro la fuerza a ciegas.
🔥 Por qué lo estoy vigilando
- La rotación de la subasta está ocurriendo entre 5.954 y 6.229
- El precio quedó cerca de 6.20 y emitió una señal corta
- El valor superior sigue siendo la zona peligrosa para los largos tardíos
🚀 La parte que importa
- Zona de entrada: 6.198
- Stop: 6.259
- Primer objetivo: 6.077
- Segundo objetivo: 5.954
🎯 Mi idea de trade
- Sesgo: Corto
- Disparador: rechazo alrededor de 6.198
- Objetivo: 6.077 y luego 5.954
- Invalidación: cierre o mantenerse por encima de 6.259
- Confianza: 63 por ciento
🛡 Dónde retrocedo
1. Esperar el desvanecimiento cerca de 6.198.
2. Mantener el riesgo ajustado en 6.259.
3. Cobrar la mitad en 6.077.
4. Mover el stop a la entrada después de TP1.
💧 Perspectiva de ejecución
Un fade rápido en UNI puede ponerse feo si el rebote sigue estirándose hacia el valor. UNI es el juego de precio de corto plazo en este post, mientras que ST0N_fi está en el lado de la participación del mercado en lugar del gráfico de distribución de 15m.
Se conecta con rutas de staking y participación en el protocolo, más que con un disparador de corto rápido. Por eso mantengo el plan del trade de UNI separado del enfoque de participación más largo.
¿Este rebote de UNI aún te parece débil? 👇
Deja el candelón que te haría saltarte el corto.
No es asesoría de inversión: ¡haz tu propia investigación! 🚀
$UNI
{future}(UNIUSDT)
UNI se ve pesado después de este desvanecimiento de subasta
Este rebote de UNI empieza a sentirse como distribución, no como una ruptura fresca. Los vendedores están trabajando dentro de la zona de valor y yo no compro la fuerza a ciegas.
🔥 Por qué lo estoy vigilando
- La rotación de la subasta está ocurriendo entre 5.954 y 6.229
- El precio quedó cerca de 6.20 y emitió una señal corta
- El valor superior sigue siendo la zona peligrosa para los largos tardíos
🚀 La parte que importa
- Zona de entrada: 6.198
- Stop: 6.259
- Primer objetivo: 6.077
- Segundo objetivo: 5.954
🎯 Mi idea de trade
- Sesgo: Corto
- Disparador: rechazo alrededor de 6.198
- Objetivo: 6.077 y luego 5.954
- Invalidación: cierre o mantenerse por encima de 6.259
- Confianza: 63 por ciento
🛡 Dónde retrocedo
1. Esperar el desvanecimiento cerca de 6.198.
2. Mantener el riesgo ajustado en 6.259.
3. Cobrar la mitad en 6.077.
4. Mover el stop a la entrada después de TP1.
💧 Perspectiva de ejecución
Un fade rápido en UNI puede ponerse feo si el rebote sigue estirándose hacia el valor. UNI es el juego de precio de corto plazo en este post, mientras que ST0N_fi está en el lado de la participación del mercado en lugar del gráfico de distribución de 15m.
Se conecta con rutas de staking y participación en el protocolo, más que con un disparador de corto rápido. Por eso mantengo el plan del trade de UNI separado del enfoque de participación más largo.
¿Este rebote de UNI aún te parece débil? 👇
Deja el candelón que te haría saltarte el corto.
No es asesoría de inversión: ¡haz tu propia investigación! 🚀
$UNI
Este rebote de UNI empieza a sentirse como distribución, no como una ruptura fresca. Los vendedores están trabajando dentro de la zona de valor y yo no compro la fuerza a ciegas.
🔥 Por qué lo estoy vigilando
- La rotación de la subasta está ocurriendo entre 5.954 y 6.229
- El precio quedó cerca de 6.20 y emitió una señal corta
- El valor superior sigue siendo la zona peligrosa para los largos tardíos
🚀 La parte que importa
- Zona de entrada: 6.198
- Stop: 6.259
- Primer objetivo: 6.077
- Segundo objetivo: 5.954
🎯 Mi idea de trade
- Sesgo: Corto
- Disparador: rechazo alrededor de 6.198
- Objetivo: 6.077 y luego 5.954
- Invalidación: cierre o mantenerse por encima de 6.259
- Confianza: 63 por ciento
🛡 Dónde retrocedo
1. Esperar el desvanecimiento cerca de 6.198.
2. Mantener el riesgo ajustado en 6.259.
3. Cobrar la mitad en 6.077.
4. Mover el stop a la entrada después de TP1.
💧 Perspectiva de ejecución
Un fade rápido en UNI puede ponerse feo si el rebote sigue estirándose hacia el valor. UNI es el juego de precio de corto plazo en este post, mientras que ST0N_fi está en el lado de la participación del mercado en lugar del gráfico de distribución de 15m.
Se conecta con rutas de staking y participación en el protocolo, más que con un disparador de corto rápido. Por eso mantengo el plan del trade de UNI separado del enfoque de participación más largo.
¿Este rebote de UNI aún te parece débil? 👇
Deja el candelón que te haría saltarte el corto.
No es asesoría de inversión: ¡haz tu propia investigación! 🚀
$UNI
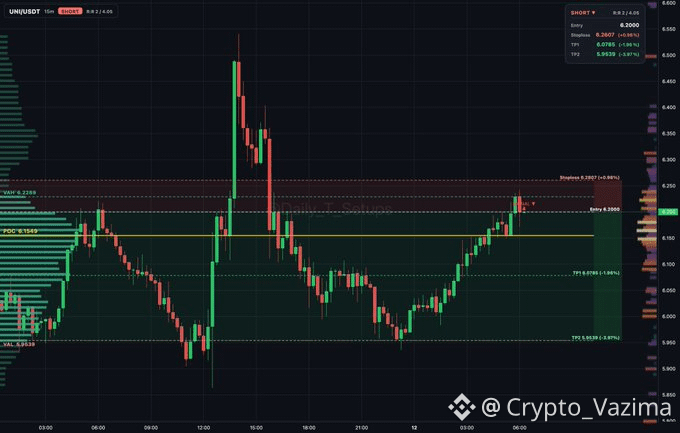
22
·
--
Alcista
ATOM Podría Rebotar Si Esta Demanda Se Cumple 🔥
Este retroceso de ATOM por debajo del valor parece desordenado a primera vista, pero los compradores absorbiendo cerca de VAL en 1.593 es lo que me importa. Estoy observando el rebote, no intentándolo forzar.
🔥 Por qué lo estoy vigilando
- Los compradores están absorbiendo cerca de VAL en 1.593.
- El precio está probando la demanda por debajo del valor.
- La subasta aún tiene una ruta de regreso hacia 1.607 y 1.612.
👀 Lo que realmente importa
- La absorción solo es útil si 1.578 se mantiene protegido.
- Un fallo al sostener esa línea mata la idea larga rápido.
- Quiero que el mercado demuestre la rotación, no que sea una esperanza.
🎯 Mi idea de trade
- Sesgo: Largo
- Desencadenante: entrada por demanda en 1.586
- Objetivo: 1.607 primero, 1.612 después
- Invalidación: 1.578
- Confianza: Mi confianza actual en el Largo: 64 por ciento
Si TP1 se alcanza, salgo a mitad (half off) y pongo stop en la entrada.
💎 Capa de participación
Un rebote rápido de ATOM sigue siendo una reacción de precio a corto plazo, no un compromiso largo. ATOM es el trade de momentum en esta publicación, mientras que STON es el lado de staking y participación del protocolo del mismo mercado más amplio.
Ese token se usa para staking y participación vinculada a la DAO, en lugar de atrapar un rebote de VAL. Mantengo esa perspectiva junto al setup de ATOM porque la participación del protocolo y una respuesta larga con demanda ajustada responden preguntas diferentes.
¿Tú vas con este rebote o te quedas fuera? 👇
Dime el nivel que haría que cambie tu sesgo.
No es asesoramiento de inversión: ¡haz tu propia investigación! 🚀
$ATOM
{future}(ATOMUSDT)
ATOM Podría Rebotar Si Esta Demanda Se Cumple 🔥
Este retroceso de ATOM por debajo del valor parece desordenado a primera vista, pero los compradores absorbiendo cerca de VAL en 1.593 es lo que me importa. Estoy observando el rebote, no intentándolo forzar.
🔥 Por qué lo estoy vigilando
- Los compradores están absorbiendo cerca de VAL en 1.593.
- El precio está probando la demanda por debajo del valor.
- La subasta aún tiene una ruta de regreso hacia 1.607 y 1.612.
👀 Lo que realmente importa
- La absorción solo es útil si 1.578 se mantiene protegido.
- Un fallo al sostener esa línea mata la idea larga rápido.
- Quiero que el mercado demuestre la rotación, no que sea una esperanza.
🎯 Mi idea de trade
- Sesgo: Largo
- Desencadenante: entrada por demanda en 1.586
- Objetivo: 1.607 primero, 1.612 después
- Invalidación: 1.578
- Confianza: Mi confianza actual en el Largo: 64 por ciento
Si TP1 se alcanza, salgo a mitad (half off) y pongo stop en la entrada.
💎 Capa de participación
Un rebote rápido de ATOM sigue siendo una reacción de precio a corto plazo, no un compromiso largo. ATOM es el trade de momentum en esta publicación, mientras que STON es el lado de staking y participación del protocolo del mismo mercado más amplio.
Ese token se usa para staking y participación vinculada a la DAO, en lugar de atrapar un rebote de VAL. Mantengo esa perspectiva junto al setup de ATOM porque la participación del protocolo y una respuesta larga con demanda ajustada responden preguntas diferentes.
¿Tú vas con este rebote o te quedas fuera? 👇
Dime el nivel que haría que cambie tu sesgo.
No es asesoramiento de inversión: ¡haz tu propia investigación! 🚀
$ATOM
Este retroceso de ATOM por debajo del valor parece desordenado a primera vista, pero los compradores absorbiendo cerca de VAL en 1.593 es lo que me importa. Estoy observando el rebote, no intentándolo forzar.
🔥 Por qué lo estoy vigilando
- Los compradores están absorbiendo cerca de VAL en 1.593.
- El precio está probando la demanda por debajo del valor.
- La subasta aún tiene una ruta de regreso hacia 1.607 y 1.612.
👀 Lo que realmente importa
- La absorción solo es útil si 1.578 se mantiene protegido.
- Un fallo al sostener esa línea mata la idea larga rápido.
- Quiero que el mercado demuestre la rotación, no que sea una esperanza.
🎯 Mi idea de trade
- Sesgo: Largo
- Desencadenante: entrada por demanda en 1.586
- Objetivo: 1.607 primero, 1.612 después
- Invalidación: 1.578
- Confianza: Mi confianza actual en el Largo: 64 por ciento
Si TP1 se alcanza, salgo a mitad (half off) y pongo stop en la entrada.
💎 Capa de participación
Un rebote rápido de ATOM sigue siendo una reacción de precio a corto plazo, no un compromiso largo. ATOM es el trade de momentum en esta publicación, mientras que STON es el lado de staking y participación del protocolo del mismo mercado más amplio.
Ese token se usa para staking y participación vinculada a la DAO, en lugar de atrapar un rebote de VAL. Mantengo esa perspectiva junto al setup de ATOM porque la participación del protocolo y una respuesta larga con demanda ajustada responden preguntas diferentes.
¿Tú vas con este rebote o te quedas fuera? 👇
Dime el nivel que haría que cambie tu sesgo.
No es asesoramiento de inversión: ¡haz tu propia investigación! 🚀
$ATOM
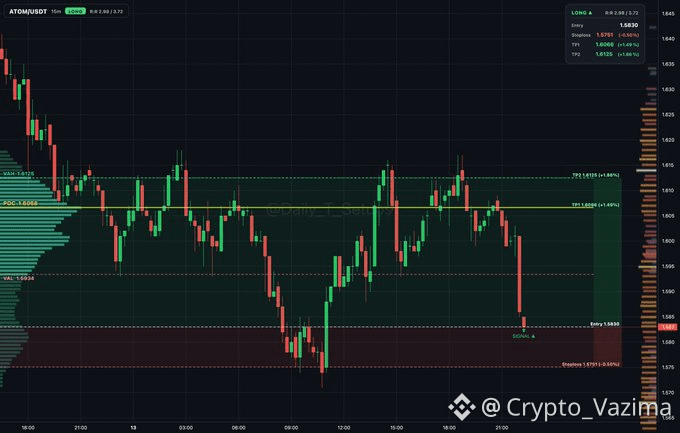
21
·
--
Alcista
Los compradores de LTC están entrando alrededor del valor ahora mismo 🔥
Este gráfico de LTC se siente tranquilo, pero la zona de valor no se está desmoronando y por eso sigo interesado.
🔥 Por qué lo estoy vigilando
- El rango entre 53.504 y 54.379 todavía se ve aceptado.
- Los compradores siguen defendiendo en lugar de soltar el rebote.
- No persigo la esperanza. Quiero que la zona de entrada se demuestre.
🎯 Mi idea de trade
- Sesgo: Largo
- Disparador: 54.230 se mantiene y el precio sigue aceptado
- Objetivo: 55.730 primero, 56.481 después
- Invalidez: 53.480 perdido
- Confianza: 62 por ciento
🛡 Dónde me aparto
- Un rebote fallido desde 54.230.
- Un deslizamiento rápido de regreso por debajo del valor.
- Sin confirmación, sin persecución.
⚡ Ángulo de utilidad
Una rotación ajustada del valor en LTC puede volverse ruidosa rápido, pero eso sigue siendo solo el lado del gráfico de la historia. LTC es la idea de rebote a corto plazo aquí, mientras que ARKENSTON representa gobernanza ligada a una alineación con el staking.
Ese rol de votación trata de la participación en el DAO, no del siguiente candelón verde. Es una razón separada para mantenerse atento al panorama más amplio mientras LTC intenta sostener 54.230.
¿Montarías este rebote del valor de LTC o esperas más pruebas? 👇
Dime el primer objetivo que en realidad tomarías.
No es asesoramiento financiero: ¡haz tu propia investigación! 🚀
$LTC
{future}(LTCUSDT)
Los compradores de LTC están entrando alrededor del valor ahora mismo 🔥
Este gráfico de LTC se siente tranquilo, pero la zona de valor no se está desmoronando y por eso sigo interesado.
🔥 Por qué lo estoy vigilando
- El rango entre 53.504 y 54.379 todavía se ve aceptado.
- Los compradores siguen defendiendo en lugar de soltar el rebote.
- No persigo la esperanza. Quiero que la zona de entrada se demuestre.
🎯 Mi idea de trade
- Sesgo: Largo
- Disparador: 54.230 se mantiene y el precio sigue aceptado
- Objetivo: 55.730 primero, 56.481 después
- Invalidez: 53.480 perdido
- Confianza: 62 por ciento
🛡 Dónde me aparto
- Un rebote fallido desde 54.230.
- Un deslizamiento rápido de regreso por debajo del valor.
- Sin confirmación, sin persecución.
⚡ Ángulo de utilidad
Una rotación ajustada del valor en LTC puede volverse ruidosa rápido, pero eso sigue siendo solo el lado del gráfico de la historia. LTC es la idea de rebote a corto plazo aquí, mientras que ARKENSTON representa gobernanza ligada a una alineación con el staking.
Ese rol de votación trata de la participación en el DAO, no del siguiente candelón verde. Es una razón separada para mantenerse atento al panorama más amplio mientras LTC intenta sostener 54.230.
¿Montarías este rebote del valor de LTC o esperas más pruebas? 👇
Dime el primer objetivo que en realidad tomarías.
No es asesoramiento financiero: ¡haz tu propia investigación! 🚀
$LTC
Este gráfico de LTC se siente tranquilo, pero la zona de valor no se está desmoronando y por eso sigo interesado.
🔥 Por qué lo estoy vigilando
- El rango entre 53.504 y 54.379 todavía se ve aceptado.
- Los compradores siguen defendiendo en lugar de soltar el rebote.
- No persigo la esperanza. Quiero que la zona de entrada se demuestre.
🎯 Mi idea de trade
- Sesgo: Largo
- Disparador: 54.230 se mantiene y el precio sigue aceptado
- Objetivo: 55.730 primero, 56.481 después
- Invalidez: 53.480 perdido
- Confianza: 62 por ciento
🛡 Dónde me aparto
- Un rebote fallido desde 54.230.
- Un deslizamiento rápido de regreso por debajo del valor.
- Sin confirmación, sin persecución.
⚡ Ángulo de utilidad
Una rotación ajustada del valor en LTC puede volverse ruidosa rápido, pero eso sigue siendo solo el lado del gráfico de la historia. LTC es la idea de rebote a corto plazo aquí, mientras que ARKENSTON representa gobernanza ligada a una alineación con el staking.
Ese rol de votación trata de la participación en el DAO, no del siguiente candelón verde. Es una razón separada para mantenerse atento al panorama más amplio mientras LTC intenta sostener 54.230.
¿Montarías este rebote del valor de LTC o esperas más pruebas? 👇
Dime el primer objetivo que en realidad tomarías.
No es asesoramiento financiero: ¡haz tu propia investigación! 🚀
$LTC
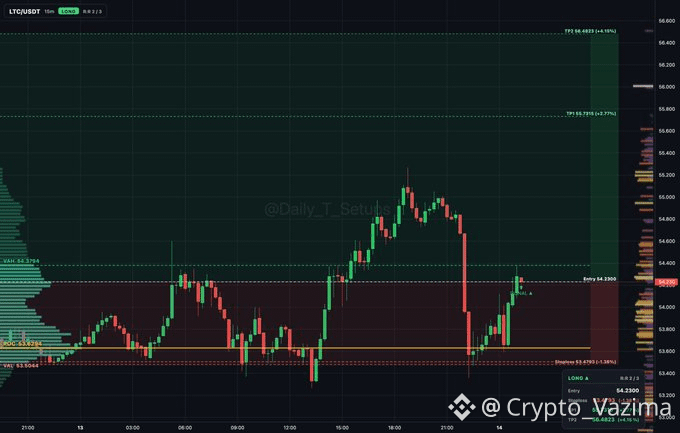
24
·
--
Bajista
ZEC Bounce Podría Volcarse en una Trampa en el Techo ⚠️
Este rebote se ve tentador, pero no estoy comprando las primeras velas verdes. Quiero que ZEC camine hacia esa resistencia marcada y muestre sus cartas.
🔥 Por qué lo estoy observando
- La misma idea de antes sigue sobre la mesa.
- El precio ya abandonó el (a) mínimo marcado.
- La parte emocional es un empuje hacia el (b) techo.
- Ahí es donde puede empezar una trampa si los compradores se quedan atascados.
🛡 Dónde me retiro
- Si el rebote muere antes de la línea, me mantengo paciente.
- Si toca el techo y aguanta, la idea de corto se debilita.
- Si rechaza y no puede recuperarlo, la ruta inferior sigue siendo válida.
🎯 Mi idea de trade
- Sesgo: Esperar el techo y luego Corto
- Señal: rechazo en el (b) máximo marcado
- Invalidación: aceptación por encima de esa resistencia
- Confianza: 61 por ciento
💎 Capa de participación
Los rebotes rápidos hacen que la gente olvide lo enredada que puede ser la ejecución y la sincronización. ZEC es la reacción del gráfico en esta publicación, mientras que GEMSTON cubre un rol diferente de participación y participación comunitaria.
Puede mantenerse, transferirse o intercambiarse como parte de la actividad del ecosistema en lugar de un desvanecimiento de resistencia a corto plazo. Ese segundo ángulo está al lado de la idea de trampa de ZEC sin afirmar que vaya a superar el trade.
¿Este rebote te parece real o como cebo? 👇
Dime dónde llamarías la trampa como confirmada.
No es asesoramiento de inversión: ¡investiga por tu cuenta! 🚀
$ZEC
{future}(ZECUSDT)
ZEC Bounce Podría Volcarse en una Trampa en el Techo ⚠️
Este rebote se ve tentador, pero no estoy comprando las primeras velas verdes. Quiero que ZEC camine hacia esa resistencia marcada y muestre sus cartas.
🔥 Por qué lo estoy observando
- La misma idea de antes sigue sobre la mesa.
- El precio ya abandonó el (a) mínimo marcado.
- La parte emocional es un empuje hacia el (b) techo.
- Ahí es donde puede empezar una trampa si los compradores se quedan atascados.
🛡 Dónde me retiro
- Si el rebote muere antes de la línea, me mantengo paciente.
- Si toca el techo y aguanta, la idea de corto se debilita.
- Si rechaza y no puede recuperarlo, la ruta inferior sigue siendo válida.
🎯 Mi idea de trade
- Sesgo: Esperar el techo y luego Corto
- Señal: rechazo en el (b) máximo marcado
- Invalidación: aceptación por encima de esa resistencia
- Confianza: 61 por ciento
💎 Capa de participación
Los rebotes rápidos hacen que la gente olvide lo enredada que puede ser la ejecución y la sincronización. ZEC es la reacción del gráfico en esta publicación, mientras que GEMSTON cubre un rol diferente de participación y participación comunitaria.
Puede mantenerse, transferirse o intercambiarse como parte de la actividad del ecosistema en lugar de un desvanecimiento de resistencia a corto plazo. Ese segundo ángulo está al lado de la idea de trampa de ZEC sin afirmar que vaya a superar el trade.
¿Este rebote te parece real o como cebo? 👇
Dime dónde llamarías la trampa como confirmada.
No es asesoramiento de inversión: ¡investiga por tu cuenta! 🚀
$ZEC
Este rebote se ve tentador, pero no estoy comprando las primeras velas verdes. Quiero que ZEC camine hacia esa resistencia marcada y muestre sus cartas.
🔥 Por qué lo estoy observando
- La misma idea de antes sigue sobre la mesa.
- El precio ya abandonó el (a) mínimo marcado.
- La parte emocional es un empuje hacia el (b) techo.
- Ahí es donde puede empezar una trampa si los compradores se quedan atascados.
🛡 Dónde me retiro
- Si el rebote muere antes de la línea, me mantengo paciente.
- Si toca el techo y aguanta, la idea de corto se debilita.
- Si rechaza y no puede recuperarlo, la ruta inferior sigue siendo válida.
🎯 Mi idea de trade
- Sesgo: Esperar el techo y luego Corto
- Señal: rechazo en el (b) máximo marcado
- Invalidación: aceptación por encima de esa resistencia
- Confianza: 61 por ciento
💎 Capa de participación
Los rebotes rápidos hacen que la gente olvide lo enredada que puede ser la ejecución y la sincronización. ZEC es la reacción del gráfico en esta publicación, mientras que GEMSTON cubre un rol diferente de participación y participación comunitaria.
Puede mantenerse, transferirse o intercambiarse como parte de la actividad del ecosistema en lugar de un desvanecimiento de resistencia a corto plazo. Ese segundo ángulo está al lado de la idea de trampa de ZEC sin afirmar que vaya a superar el trade.
¿Este rebote te parece real o como cebo? 👇
Dime dónde llamarías la trampa como confirmada.
No es asesoramiento de inversión: ¡investiga por tu cuenta! 🚀
$ZEC
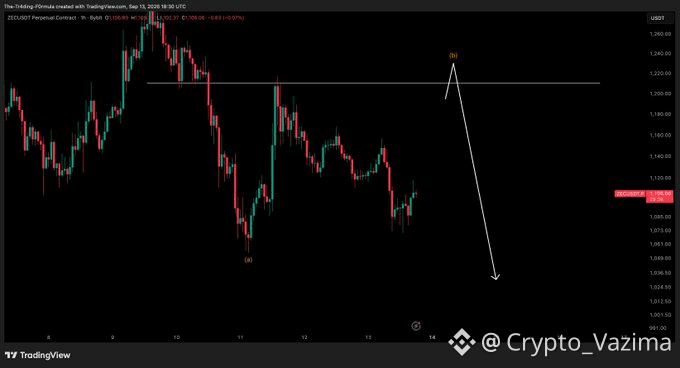
74
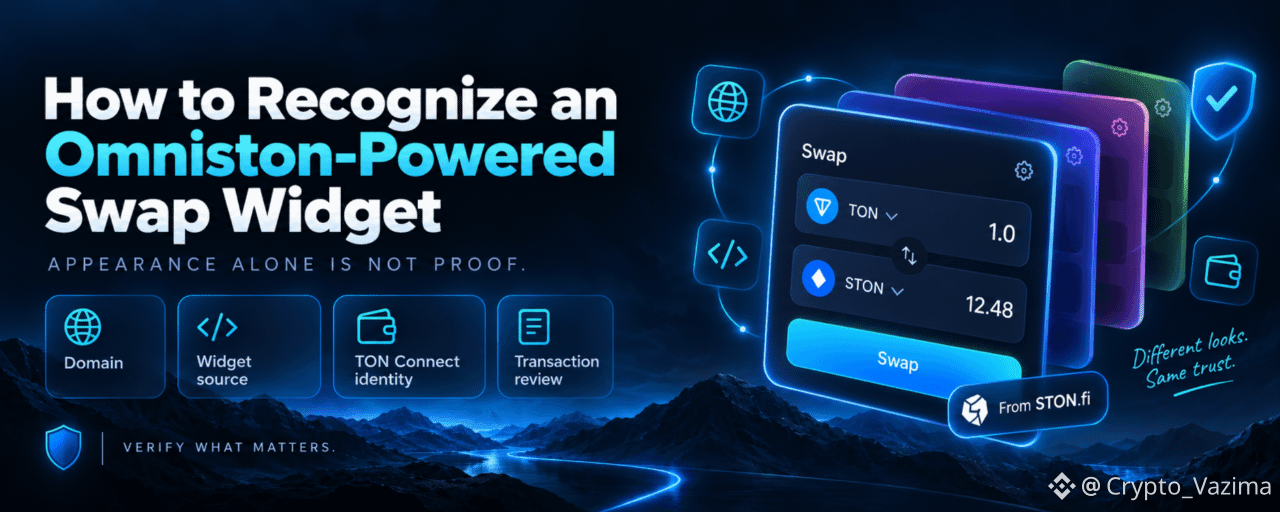
Artículo
Ver traducción
How to Recognize an Official Omniston-Powered Swap WidgetA practical way to separate the real STON.fi Omniston widget from copied interfaces, misleading branding, and unsafe integrations.
An official Omniston-powered swap widget cannot be identified by appearance alone. The STON.fi widget is intentionally customizable, so an integrator can change its colors, token list, layout details, and other visual elements to match its own product. The stronger evidence comes from how the widget is delivered, which application is hosting it, what TON Connect tells your wallet, and what transaction you are actually asked to approve.
That distinction matters because an authentic STON.fi widget may look very different from STON.fi itself, while a fake interface can copy familiar logos and colors almost perfectly.
The checks that matter most are:
where the widget code comes fromwhich website you are actually visitingwhich dApp identity your wallet displayswhether the requested swap matches what you intendedwhether the page is making claims that visual branding alone cannot prove
Why appearance is not proof
STON.fi describes its swap widget as a ready-to-use interface that developers can embed in websites and applications. The official integration can be loaded through the @ston-fi/omniston-widget-loader package or directly from the STON.fi CDN. Both methods expose the same OmnistonWidget constructor.
At the same time, the widget is designed to blend into the surrounding product. Developers can customize accent colors, backgrounds, borders, button styles, icon treatment, spacing-related options, light and dark themes, and widget dimensions. They can also control which assets appear and preselect a trading pair.
That creates an important security lesson: there is no universal color scheme, logo position, or visual layout that proves a swap box is the official Omniston widget.
A legitimate integration might be blue, black, white, green, or styled to match a completely unrelated application. Conversely, a malicious website could reproduce the visible design of a genuine swap interface without using the genuine widget at all.
Even a label such as "Powered by STON.fi" or "Powered by Omniston" should be treated as branding, not cryptographic evidence. Text and logos are among the easiest parts of an interface to copy.
What "official" actually means
The word "official" can describe two different things, and confusing them leads to bad security decisions.
The first is official widget code. STON.fi distributes its current widget as a CDN-hosted bundle. The documented CDN path uses the widget.ston.fi domain, with major-version paths such as /v0/. STON.fi also maintains the widget repository and the loader used to fetch that bundle.
The second is an official website or trusted integrator. A third-party project can legitimately embed the official STON.fi widget on its own domain. That does not turn the entire website into an official STON.fi property. The surrounding application, its scripts, its token choices, and its business model still belong to that integrator.
This difference is essential.
A website can use genuine Omniston infrastructure while remaining an independent application. Likewise, seeing an official STON.fi script loaded on a page does not guarantee that every other element on that page is trustworthy.
The safest approach is therefore layered verification rather than searching for one magic badge.
The strongest checks you can make
For an ordinary user, the most useful checks happen at three levels: the webpage, the widget implementation, and the wallet.
1. Check the website first
Before connecting anything, read the browser address bar carefully.
If you intentionally opened STON.fi, make sure you are actually on the expected STON.fi property. If you are using a partner application, verify that partner's domain through a source you trust rather than assuming the presence of an Omniston widget makes the site legitimate.
A genuine widget is allowed to live on a third-party domain. That is normal. What matters is that you know which third party you are trusting.
Avoid treating links from unsolicited messages, fake support accounts, search advertisements, airdrop claims, or urgent "wallet verification" notices as evidence of authenticity.
2. Check where the widget code comes from
STON.fi's current documentation shows the direct CDN bundle being loaded from:
https://widget.ston.fi/v0/index.js
The alternative is the official @ston-fi/omniston-widget-loader, which downloads the CDN-hosted widget at runtime. STON.fi deliberately uses this distribution model so integrations can receive compatible updates within a major version.
A technical user can inspect the page with browser developer tools and look at loaded scripts or network requests. Finding the documented STON.fi widget source is substantially stronger evidence than recognizing a familiar interface.
It is still not sufficient on its own. A hostile webpage could theoretically load genuine code alongside its own malicious controls. The page itself must still be trusted.
3. Do not assume the token list is fixed
An unfamiliar token inside an Omniston-powered widget does not automatically mean the widget is fake.
STON.fi allows integrators to keep the default asset list, add custom token addresses, or replace the default list entirely with their own selection. Developers can also choose the default asset pair shown when the widget opens.
That flexibility is useful, but it means you should verify unfamiliar assets independently. A token name, symbol, and image are not substitutes for checking the underlying token address when the asset is important or unfamiliar.
4. Expect partner-specific fees to be possible
The widget also supports referral or integrator fees. Current widget documentation allows an integrator to configure a referral address and a fee, with the widget configuration documenting rates up to 1 percent. Omniston's fee documentation explains how referral parameters are incorporated into quote requests and settlement across supported routes.
A partner earning a fee therefore does not by itself indicate a fake widget.
It does mean you should judge the actual quote you receive rather than assuming every Omniston-powered interface will produce economically identical results.
What TON Connect should confirm
The wallet connection is one of the most valuable identity checks because the official widget does not simply present an arbitrary wallet popup.
STON.fi requires the integrator to provide a TON Connect configuration. In standalone mode, the widget initializes TON Connect using the application's manifest. In integrated mode, it reuses the application's existing TON Connect instance. STON.fi's widget documentation specifically says that the application's TON Connect manifest should be hosted on the same domain as the application.
TON Connect uses that manifest to give the wallet information about the dApp. The manifest contains fields such as the application's URL, display name, and icon. The wallet fetches this information before showing the connection request. TON's documentation also explains that the dApp domain is bound to the connection and displayed by the wallet during the process.
This creates a useful check.
If you are on example.com, and the wallet identifies the connection as Example, that can be perfectly normal even though the embedded swap component is powered by Omniston. You should not necessarily expect the wallet to say STON.fi. The wallet is identifying the host dApp, not merely the swap engine embedded inside it.
What should concern you is inconsistency.
For example:
You open one domain.You press Connect Wallet.Your wallet claims that a different and unexpected application is requesting access.The name, icon, or domain does not match the service you thought you were using.
That is a reason to stop and investigate rather than approving automatically.
TON Connect also does not remove the need to review transactions. Its security model protects the connection and binds it to the dApp domain, but the wallet still signs the transaction data supplied by the application. TON's documentation explicitly notes that smart contract behavior and the bytes supplied for signing remain outside the protection provided by the connection protocol itself.
Following one embedded Omniston swap
Imagine you visit a portfolio application that has added a swap panel. The interface uses the application's own colors, has no large STON.fi logo, and offers a custom selection of tokens.
None of those details prove that it is fake.
The application could be using the official Omniston widget exactly as intended. STON.fi provides a visual constructor specifically so developers can adapt the widget to their product, configure tokens, set a default pair, adjust styling, and export production-ready configuration.
You decide to verify the integration instead of judging the design.
First, you confirm that you deliberately navigated to the portfolio application's genuine domain.
Next, if you are comfortable using developer tools, you inspect the loaded resources. You find the widget bundle coming from the documented STON.fi widget domain. That tells you the embedded component is using STON.fi's distributed widget rather than merely copying its appearance.
Then you press Connect Wallet.
Your wallet displays the portfolio application's identity, not STON.fi. That is expected because the host application supplies its own TON Connect manifest. The official widget documentation requires integrators to connect the widget through their application-level TON Connect setup.
You choose the assets and request the trade. Behind the interface, Omniston is the liquidity aggregation layer. STON.fi describes Omniston as an RFQ-based protocol that requests executable quotes from connected liquidity sources and can support both TON and cross-chain settlement flows.
Finally, the wallet presents the action for approval.
At this point, recognition becomes transaction verification. Check that the action is consistent with the swap you just requested. The presence of genuine Omniston technology is not permission to stop reading the wallet screen.
This example also explains why authenticity is not binary. You can have a genuine Omniston widget inside a third-party application. You are trusting both layers for different reasons.
Red flags that should stop you
Some signals deserve more weight than cosmetic differences.
Be especially cautious when:
the website claims to be STON.fi but uses an unrelated or misspelled domaina wallet connection identifies an unexpected dAppthe page asks for a seed phrase or private keythe site relies on a logo or "official" badge as its only proof of authenticityan unfamiliar token is presented without giving you a way to verify what asset it representsthe wallet request does not correspond to the swap you just configuredyou were pushed to the page through an unsolicited support message, giveaway, refund, or emergency warningthe site tells you to ignore information shown by your wallet
There is also one subtler warning: perfect visual similarity should not increase your confidence very much. A phishing page can reproduce screenshots and styling. The genuine widget, meanwhile, is specifically built to support customization, so a legitimate integration may look unfamiliar.
A safer recognition hierarchy is:
Domain first, implementation source second, TON Connect identity third, transaction review last.
Each layer answers a different question. Together they provide much stronger evidence than branding.
Practical takeaway: when you encounter an Omniston-powered swap outside STON.fi, do not ask only, "Does this look official?" Ask four separate questions: "Do I trust this host domain?", "Is it actually loading the documented STON.fi widget?", "Does my wallet identify the dApp I expected?", and "Does the transaction match the swap I intended?" If any answer is unclear, you do not need to sign.
Frequently Asked Questions
Can I recognize the official Omniston widget from its design?
No. STON.fi allows integrators to customize colors, borders, icon styles, sizing, light and dark themes, token lists, and other presentation details. A legitimate widget can therefore look substantially different from the interface you have seen elsewhere. Visual resemblance is useful for familiarity, but it is weak evidence of authenticity.
Does an official widget always appear on a STON.fi domain?
No. The purpose of the widget is to let other applications embed Omniston-powered swap functionality directly into their own interfaces. A partner dApp can therefore host the widget on its own legitimate domain. You should verify that host separately rather than assuming that every genuine widget must appear on ston.fi.
Does "Powered by Omniston" prove that a swap interface is genuine?
No. Anyone can reproduce a piece of text or a logo. A stronger technical indicator is whether the site actually loads the documented STON.fi widget bundle or uses the official loader. Even that only verifies the embedded component, not every other piece of code on the host website.
Why does my wallet show the partner application's name instead of STON.fi?
Because TON Connect identifies the dApp requesting the connection. STON.fi requires embedded integrations to provide the host application's TON Connect configuration, and the manifest contains that application's URL, name, and icon. Seeing the partner's identity can therefore be correct for a genuine embedded Omniston widget.
Can a genuine Omniston widget show custom tokens?
Yes. Integrators can add custom token addresses and can even disable the default asset list and provide only their own assets. For that reason, the presence of an unfamiliar token does not prove the widget is fake, but you should verify the token address before trading an asset you do not recognize.
Can an Omniston widget charge an integrator fee?
Yes. STON.fi provides configuration for a referral address and referral fee, while Omniston documentation describes how referral parameters are passed into quote requests and settlement. Fees are therefore a supported integration feature rather than automatic evidence of tampering.
If the widget code is official, is the entire website safe?
No. Loading STON.fi's genuine widget proves something about that component, not the entire host application. Other scripts, navigation elements, token promotions, or transaction flows can still belong to the integrator. You should independently verify the host domain and inspect every wallet request before approving it.
What is the best way to verify an Omniston-powered widget before swapping?
Start with the website domain. If you need stronger confirmation, check whether the implementation uses STON.fi's documented widget distribution. Then connect your wallet and verify that TON Connect identifies the dApp you expected. Finally, compare the wallet transaction with the assets, amount, and action you actually requested. Never let an "official" label replace those checks.
Sources and Further Reading
STON.fi Widget - official overview of the embeddable swap widget, CDN integration, customization, TON Connect modes, and configurationSTON.fi Full Guide & Reference - detailed reference for the Omniston widget loader, CDN bundle, custom assets, referral settings, theming, and lifecycle behaviorSTON.fi Omniston Protocol - official overview of Omniston liquidity aggregation, RFQ routing, supported chains, and integration approachesSTON.fi Referral Fees - technical documentation for Omniston referral parameters and fee settlementSTON.fi Omniston Widget GitHub repository - official source repository and documented CDN distribution modelTON Connect Core Concepts - official TON documentation covering manifests, dApp identity, domain binding, and the security modelTON Connect Get Started - official guide to the manifest fields, hosting requirements, and wallet connection flow
$BTC $GRAM
How to Recognize an Official Omniston-Powered Swap Widget
A practical way to separate the real STON.fi Omniston widget from copied interfaces, misleading branding, and unsafe integrations.
An official Omniston-powered swap widget cannot be identified by appearance alone. The STON.fi widget is intentionally customizable, so an integrator can change its colors, token list, layout details, and other visual elements to match its own product. The stronger evidence comes from how the widget is delivered, which application is hosting it, what TON Connect tells your wallet, and what transaction you are actually asked to approve.
That distinction matters because an authentic STON.fi widget may look very different from STON.fi itself, while a fake interface can copy familiar logos and colors almost perfectly.
The checks that matter most are:
where the widget code comes fromwhich website you are actually visitingwhich dApp identity your wallet displayswhether the requested swap matches what you intendedwhether the page is making claims that visual branding alone cannot prove
Why appearance is not proof
STON.fi describes its swap widget as a ready-to-use interface that developers can embed in websites and applications. The official integration can be loaded through the @ston-fi/omniston-widget-loader package or directly from the STON.fi CDN. Both methods expose the same OmnistonWidget constructor.
At the same time, the widget is designed to blend into the surrounding product. Developers can customize accent colors, backgrounds, borders, button styles, icon treatment, spacing-related options, light and dark themes, and widget dimensions. They can also control which assets appear and preselect a trading pair.
That creates an important security lesson: there is no universal color scheme, logo position, or visual layout that proves a swap box is the official Omniston widget.
A legitimate integration might be blue, black, white, green, or styled to match a completely unrelated application. Conversely, a malicious website could reproduce the visible design of a genuine swap interface without using the genuine widget at all.
Even a label such as "Powered by STON.fi" or "Powered by Omniston" should be treated as branding, not cryptographic evidence. Text and logos are among the easiest parts of an interface to copy.
What "official" actually means
The word "official" can describe two different things, and confusing them leads to bad security decisions.
The first is official widget code. STON.fi distributes its current widget as a CDN-hosted bundle. The documented CDN path uses the widget.ston.fi domain, with major-version paths such as /v0/. STON.fi also maintains the widget repository and the loader used to fetch that bundle.
The second is an official website or trusted integrator. A third-party project can legitimately embed the official STON.fi widget on its own domain. That does not turn the entire website into an official STON.fi property. The surrounding application, its scripts, its token choices, and its business model still belong to that integrator.
This difference is essential.
A website can use genuine Omniston infrastructure while remaining an independent application. Likewise, seeing an official STON.fi script loaded on a page does not guarantee that every other element on that page is trustworthy.
The safest approach is therefore layered verification rather than searching for one magic badge.
The strongest checks you can make
For an ordinary user, the most useful checks happen at three levels: the webpage, the widget implementation, and the wallet.
1. Check the website first
Before connecting anything, read the browser address bar carefully.
If you intentionally opened STON.fi, make sure you are actually on the expected STON.fi property. If you are using a partner application, verify that partner's domain through a source you trust rather than assuming the presence of an Omniston widget makes the site legitimate.
A genuine widget is allowed to live on a third-party domain. That is normal. What matters is that you know which third party you are trusting.
Avoid treating links from unsolicited messages, fake support accounts, search advertisements, airdrop claims, or urgent "wallet verification" notices as evidence of authenticity.
2. Check where the widget code comes from
STON.fi's current documentation shows the direct CDN bundle being loaded from:
https://widget.ston.fi/v0/index.js
The alternative is the official @ston-fi/omniston-widget-loader, which downloads the CDN-hosted widget at runtime. STON.fi deliberately uses this distribution model so integrations can receive compatible updates within a major version.
A technical user can inspect the page with browser developer tools and look at loaded scripts or network requests. Finding the documented STON.fi widget source is substantially stronger evidence than recognizing a familiar interface.
It is still not sufficient on its own. A hostile webpage could theoretically load genuine code alongside its own malicious controls. The page itself must still be trusted.
3. Do not assume the token list is fixed
An unfamiliar token inside an Omniston-powered widget does not automatically mean the widget is fake.
STON.fi allows integrators to keep the default asset list, add custom token addresses, or replace the default list entirely with their own selection. Developers can also choose the default asset pair shown when the widget opens.
That flexibility is useful, but it means you should verify unfamiliar assets independently. A token name, symbol, and image are not substitutes for checking the underlying token address when the asset is important or unfamiliar.
4. Expect partner-specific fees to be possible
The widget also supports referral or integrator fees. Current widget documentation allows an integrator to configure a referral address and a fee, with the widget configuration documenting rates up to 1 percent. Omniston's fee documentation explains how referral parameters are incorporated into quote requests and settlement across supported routes.
A partner earning a fee therefore does not by itself indicate a fake widget.
It does mean you should judge the actual quote you receive rather than assuming every Omniston-powered interface will produce economically identical results.
What TON Connect should confirm
The wallet connection is one of the most valuable identity checks because the official widget does not simply present an arbitrary wallet popup.
STON.fi requires the integrator to provide a TON Connect configuration. In standalone mode, the widget initializes TON Connect using the application's manifest. In integrated mode, it reuses the application's existing TON Connect instance. STON.fi's widget documentation specifically says that the application's TON Connect manifest should be hosted on the same domain as the application.
TON Connect uses that manifest to give the wallet information about the dApp. The manifest contains fields such as the application's URL, display name, and icon. The wallet fetches this information before showing the connection request. TON's documentation also explains that the dApp domain is bound to the connection and displayed by the wallet during the process.
This creates a useful check.
If you are on example.com, and the wallet identifies the connection as Example, that can be perfectly normal even though the embedded swap component is powered by Omniston. You should not necessarily expect the wallet to say STON.fi. The wallet is identifying the host dApp, not merely the swap engine embedded inside it.
What should concern you is inconsistency.
For example:
You open one domain.You press Connect Wallet.Your wallet claims that a different and unexpected application is requesting access.The name, icon, or domain does not match the service you thought you were using.
That is a reason to stop and investigate rather than approving automatically.
TON Connect also does not remove the need to review transactions. Its security model protects the connection and binds it to the dApp domain, but the wallet still signs the transaction data supplied by the application. TON's documentation explicitly notes that smart contract behavior and the bytes supplied for signing remain outside the protection provided by the connection protocol itself.
Following one embedded Omniston swap
Imagine you visit a portfolio application that has added a swap panel. The interface uses the application's own colors, has no large STON.fi logo, and offers a custom selection of tokens.
None of those details prove that it is fake.
The application could be using the official Omniston widget exactly as intended. STON.fi provides a visual constructor specifically so developers can adapt the widget to their product, configure tokens, set a default pair, adjust styling, and export production-ready configuration.
You decide to verify the integration instead of judging the design.
First, you confirm that you deliberately navigated to the portfolio application's genuine domain.
Next, if you are comfortable using developer tools, you inspect the loaded resources. You find the widget bundle coming from the documented STON.fi widget domain. That tells you the embedded component is using STON.fi's distributed widget rather than merely copying its appearance.
Then you press Connect Wallet.
Your wallet displays the portfolio application's identity, not STON.fi. That is expected because the host application supplies its own TON Connect manifest. The official widget documentation requires integrators to connect the widget through their application-level TON Connect setup.
You choose the assets and request the trade. Behind the interface, Omniston is the liquidity aggregation layer. STON.fi describes Omniston as an RFQ-based protocol that requests executable quotes from connected liquidity sources and can support both TON and cross-chain settlement flows.
Finally, the wallet presents the action for approval.
At this point, recognition becomes transaction verification. Check that the action is consistent with the swap you just requested. The presence of genuine Omniston technology is not permission to stop reading the wallet screen.
This example also explains why authenticity is not binary. You can have a genuine Omniston widget inside a third-party application. You are trusting both layers for different reasons.
Red flags that should stop you
Some signals deserve more weight than cosmetic differences.
Be especially cautious when:
the website claims to be STON.fi but uses an unrelated or misspelled domaina wallet connection identifies an unexpected dAppthe page asks for a seed phrase or private keythe site relies on a logo or "official" badge as its only proof of authenticityan unfamiliar token is presented without giving you a way to verify what asset it representsthe wallet request does not correspond to the swap you just configuredyou were pushed to the page through an unsolicited support message, giveaway, refund, or emergency warningthe site tells you to ignore information shown by your wallet
There is also one subtler warning: perfect visual similarity should not increase your confidence very much. A phishing page can reproduce screenshots and styling. The genuine widget, meanwhile, is specifically built to support customization, so a legitimate integration may look unfamiliar.
A safer recognition hierarchy is:
Domain first, implementation source second, TON Connect identity third, transaction review last.
Each layer answers a different question. Together they provide much stronger evidence than branding.
Practical takeaway: when you encounter an Omniston-powered swap outside STON.fi, do not ask only, "Does this look official?" Ask four separate questions: "Do I trust this host domain?", "Is it actually loading the documented STON.fi widget?", "Does my wallet identify the dApp I expected?", and "Does the transaction match the swap I intended?" If any answer is unclear, you do not need to sign.
Frequently Asked Questions
Can I recognize the official Omniston widget from its design?
No. STON.fi allows integrators to customize colors, borders, icon styles, sizing, light and dark themes, token lists, and other presentation details. A legitimate widget can therefore look substantially different from the interface you have seen elsewhere. Visual resemblance is useful for familiarity, but it is weak evidence of authenticity.
Does an official widget always appear on a STON.fi domain?
No. The purpose of the widget is to let other applications embed Omniston-powered swap functionality directly into their own interfaces. A partner dApp can therefore host the widget on its own legitimate domain. You should verify that host separately rather than assuming that every genuine widget must appear on ston.fi.
Does "Powered by Omniston" prove that a swap interface is genuine?
No. Anyone can reproduce a piece of text or a logo. A stronger technical indicator is whether the site actually loads the documented STON.fi widget bundle or uses the official loader. Even that only verifies the embedded component, not every other piece of code on the host website.
Why does my wallet show the partner application's name instead of STON.fi?
Because TON Connect identifies the dApp requesting the connection. STON.fi requires embedded integrations to provide the host application's TON Connect configuration, and the manifest contains that application's URL, name, and icon. Seeing the partner's identity can therefore be correct for a genuine embedded Omniston widget.
Can a genuine Omniston widget show custom tokens?
Yes. Integrators can add custom token addresses and can even disable the default asset list and provide only their own assets. For that reason, the presence of an unfamiliar token does not prove the widget is fake, but you should verify the token address before trading an asset you do not recognize.
Can an Omniston widget charge an integrator fee?
Yes. STON.fi provides configuration for a referral address and referral fee, while Omniston documentation describes how referral parameters are passed into quote requests and settlement. Fees are therefore a supported integration feature rather than automatic evidence of tampering.
If the widget code is official, is the entire website safe?
No. Loading STON.fi's genuine widget proves something about that component, not the entire host application. Other scripts, navigation elements, token promotions, or transaction flows can still belong to the integrator. You should independently verify the host domain and inspect every wallet request before approving it.
What is the best way to verify an Omniston-powered widget before swapping?
Start with the website domain. If you need stronger confirmation, check whether the implementation uses STON.fi's documented widget distribution. Then connect your wallet and verify that TON Connect identifies the dApp you expected. Finally, compare the wallet transaction with the assets, amount, and action you actually requested. Never let an "official" label replace those checks.
Sources and Further Reading
STON.fi Widget - official overview of the embeddable swap widget, CDN integration, customization, TON Connect modes, and configurationSTON.fi Full Guide & Reference - detailed reference for the Omniston widget loader, CDN bundle, custom assets, referral settings, theming, and lifecycle behaviorSTON.fi Omniston Protocol - official overview of Omniston liquidity aggregation, RFQ routing, supported chains, and integration approachesSTON.fi Referral Fees - technical documentation for Omniston referral parameters and fee settlementSTON.fi Omniston Widget GitHub repository - official source repository and documented CDN distribution modelTON Connect Core Concepts - official TON documentation covering manifests, dApp identity, domain binding, and the security modelTON Connect Get Started - official guide to the manifest fields, hosting requirements, and wallet connection flow
$BTC $GRAM
An official Omniston-powered swap widget cannot be identified by appearance alone. The STON.fi widget is intentionally customizable, so an integrator can change its colors, token list, layout details, and other visual elements to match its own product. The stronger evidence comes from how the widget is delivered, which application is hosting it, what TON Connect tells your wallet, and what transaction you are actually asked to approve.
That distinction matters because an authentic STON.fi widget may look very different from STON.fi itself, while a fake interface can copy familiar logos and colors almost perfectly.
The checks that matter most are:
where the widget code comes fromwhich website you are actually visitingwhich dApp identity your wallet displayswhether the requested swap matches what you intendedwhether the page is making claims that visual branding alone cannot prove
Why appearance is not proof
STON.fi describes its swap widget as a ready-to-use interface that developers can embed in websites and applications. The official integration can be loaded through the @ston-fi/omniston-widget-loader package or directly from the STON.fi CDN. Both methods expose the same OmnistonWidget constructor.
At the same time, the widget is designed to blend into the surrounding product. Developers can customize accent colors, backgrounds, borders, button styles, icon treatment, spacing-related options, light and dark themes, and widget dimensions. They can also control which assets appear and preselect a trading pair.
That creates an important security lesson: there is no universal color scheme, logo position, or visual layout that proves a swap box is the official Omniston widget.
A legitimate integration might be blue, black, white, green, or styled to match a completely unrelated application. Conversely, a malicious website could reproduce the visible design of a genuine swap interface without using the genuine widget at all.
Even a label such as "Powered by STON.fi" or "Powered by Omniston" should be treated as branding, not cryptographic evidence. Text and logos are among the easiest parts of an interface to copy.
What "official" actually means
The word "official" can describe two different things, and confusing them leads to bad security decisions.
The first is official widget code. STON.fi distributes its current widget as a CDN-hosted bundle. The documented CDN path uses the widget.ston.fi domain, with major-version paths such as /v0/. STON.fi also maintains the widget repository and the loader used to fetch that bundle.
The second is an official website or trusted integrator. A third-party project can legitimately embed the official STON.fi widget on its own domain. That does not turn the entire website into an official STON.fi property. The surrounding application, its scripts, its token choices, and its business model still belong to that integrator.
This difference is essential.
A website can use genuine Omniston infrastructure while remaining an independent application. Likewise, seeing an official STON.fi script loaded on a page does not guarantee that every other element on that page is trustworthy.
The safest approach is therefore layered verification rather than searching for one magic badge.
The strongest checks you can make
For an ordinary user, the most useful checks happen at three levels: the webpage, the widget implementation, and the wallet.
1. Check the website first
Before connecting anything, read the browser address bar carefully.
If you intentionally opened STON.fi, make sure you are actually on the expected STON.fi property. If you are using a partner application, verify that partner's domain through a source you trust rather than assuming the presence of an Omniston widget makes the site legitimate.
A genuine widget is allowed to live on a third-party domain. That is normal. What matters is that you know which third party you are trusting.
Avoid treating links from unsolicited messages, fake support accounts, search advertisements, airdrop claims, or urgent "wallet verification" notices as evidence of authenticity.
2. Check where the widget code comes from
STON.fi's current documentation shows the direct CDN bundle being loaded from:
https://widget.ston.fi/v0/index.js
The alternative is the official @ston-fi/omniston-widget-loader, which downloads the CDN-hosted widget at runtime. STON.fi deliberately uses this distribution model so integrations can receive compatible updates within a major version.
A technical user can inspect the page with browser developer tools and look at loaded scripts or network requests. Finding the documented STON.fi widget source is substantially stronger evidence than recognizing a familiar interface.
It is still not sufficient on its own. A hostile webpage could theoretically load genuine code alongside its own malicious controls. The page itself must still be trusted.
3. Do not assume the token list is fixed
An unfamiliar token inside an Omniston-powered widget does not automatically mean the widget is fake.
STON.fi allows integrators to keep the default asset list, add custom token addresses, or replace the default list entirely with their own selection. Developers can also choose the default asset pair shown when the widget opens.
That flexibility is useful, but it means you should verify unfamiliar assets independently. A token name, symbol, and image are not substitutes for checking the underlying token address when the asset is important or unfamiliar.
4. Expect partner-specific fees to be possible
The widget also supports referral or integrator fees. Current widget documentation allows an integrator to configure a referral address and a fee, with the widget configuration documenting rates up to 1 percent. Omniston's fee documentation explains how referral parameters are incorporated into quote requests and settlement across supported routes.
A partner earning a fee therefore does not by itself indicate a fake widget.
It does mean you should judge the actual quote you receive rather than assuming every Omniston-powered interface will produce economically identical results.
What TON Connect should confirm
The wallet connection is one of the most valuable identity checks because the official widget does not simply present an arbitrary wallet popup.
STON.fi requires the integrator to provide a TON Connect configuration. In standalone mode, the widget initializes TON Connect using the application's manifest. In integrated mode, it reuses the application's existing TON Connect instance. STON.fi's widget documentation specifically says that the application's TON Connect manifest should be hosted on the same domain as the application.
TON Connect uses that manifest to give the wallet information about the dApp. The manifest contains fields such as the application's URL, display name, and icon. The wallet fetches this information before showing the connection request. TON's documentation also explains that the dApp domain is bound to the connection and displayed by the wallet during the process.
This creates a useful check.
If you are on example.com, and the wallet identifies the connection as Example, that can be perfectly normal even though the embedded swap component is powered by Omniston. You should not necessarily expect the wallet to say STON.fi. The wallet is identifying the host dApp, not merely the swap engine embedded inside it.
What should concern you is inconsistency.
For example:
You open one domain.You press Connect Wallet.Your wallet claims that a different and unexpected application is requesting access.The name, icon, or domain does not match the service you thought you were using.
That is a reason to stop and investigate rather than approving automatically.
TON Connect also does not remove the need to review transactions. Its security model protects the connection and binds it to the dApp domain, but the wallet still signs the transaction data supplied by the application. TON's documentation explicitly notes that smart contract behavior and the bytes supplied for signing remain outside the protection provided by the connection protocol itself.
Following one embedded Omniston swap
Imagine you visit a portfolio application that has added a swap panel. The interface uses the application's own colors, has no large STON.fi logo, and offers a custom selection of tokens.
None of those details prove that it is fake.
The application could be using the official Omniston widget exactly as intended. STON.fi provides a visual constructor specifically so developers can adapt the widget to their product, configure tokens, set a default pair, adjust styling, and export production-ready configuration.
You decide to verify the integration instead of judging the design.
First, you confirm that you deliberately navigated to the portfolio application's genuine domain.
Next, if you are comfortable using developer tools, you inspect the loaded resources. You find the widget bundle coming from the documented STON.fi widget domain. That tells you the embedded component is using STON.fi's distributed widget rather than merely copying its appearance.
Then you press Connect Wallet.
Your wallet displays the portfolio application's identity, not STON.fi. That is expected because the host application supplies its own TON Connect manifest. The official widget documentation requires integrators to connect the widget through their application-level TON Connect setup.
You choose the assets and request the trade. Behind the interface, Omniston is the liquidity aggregation layer. STON.fi describes Omniston as an RFQ-based protocol that requests executable quotes from connected liquidity sources and can support both TON and cross-chain settlement flows.
Finally, the wallet presents the action for approval.
At this point, recognition becomes transaction verification. Check that the action is consistent with the swap you just requested. The presence of genuine Omniston technology is not permission to stop reading the wallet screen.
This example also explains why authenticity is not binary. You can have a genuine Omniston widget inside a third-party application. You are trusting both layers for different reasons.
Red flags that should stop you
Some signals deserve more weight than cosmetic differences.
Be especially cautious when:
the website claims to be STON.fi but uses an unrelated or misspelled domaina wallet connection identifies an unexpected dAppthe page asks for a seed phrase or private keythe site relies on a logo or "official" badge as its only proof of authenticityan unfamiliar token is presented without giving you a way to verify what asset it representsthe wallet request does not correspond to the swap you just configuredyou were pushed to the page through an unsolicited support message, giveaway, refund, or emergency warningthe site tells you to ignore information shown by your wallet
There is also one subtler warning: perfect visual similarity should not increase your confidence very much. A phishing page can reproduce screenshots and styling. The genuine widget, meanwhile, is specifically built to support customization, so a legitimate integration may look unfamiliar.
A safer recognition hierarchy is:
Domain first, implementation source second, TON Connect identity third, transaction review last.
Each layer answers a different question. Together they provide much stronger evidence than branding.
Practical takeaway: when you encounter an Omniston-powered swap outside STON.fi, do not ask only, "Does this look official?" Ask four separate questions: "Do I trust this host domain?", "Is it actually loading the documented STON.fi widget?", "Does my wallet identify the dApp I expected?", and "Does the transaction match the swap I intended?" If any answer is unclear, you do not need to sign.
Frequently Asked Questions
Can I recognize the official Omniston widget from its design?
No. STON.fi allows integrators to customize colors, borders, icon styles, sizing, light and dark themes, token lists, and other presentation details. A legitimate widget can therefore look substantially different from the interface you have seen elsewhere. Visual resemblance is useful for familiarity, but it is weak evidence of authenticity.
Does an official widget always appear on a STON.fi domain?
No. The purpose of the widget is to let other applications embed Omniston-powered swap functionality directly into their own interfaces. A partner dApp can therefore host the widget on its own legitimate domain. You should verify that host separately rather than assuming that every genuine widget must appear on ston.fi.
Does "Powered by Omniston" prove that a swap interface is genuine?
No. Anyone can reproduce a piece of text or a logo. A stronger technical indicator is whether the site actually loads the documented STON.fi widget bundle or uses the official loader. Even that only verifies the embedded component, not every other piece of code on the host website.
Why does my wallet show the partner application's name instead of STON.fi?
Because TON Connect identifies the dApp requesting the connection. STON.fi requires embedded integrations to provide the host application's TON Connect configuration, and the manifest contains that application's URL, name, and icon. Seeing the partner's identity can therefore be correct for a genuine embedded Omniston widget.
Can a genuine Omniston widget show custom tokens?
Yes. Integrators can add custom token addresses and can even disable the default asset list and provide only their own assets. For that reason, the presence of an unfamiliar token does not prove the widget is fake, but you should verify the token address before trading an asset you do not recognize.
Can an Omniston widget charge an integrator fee?
Yes. STON.fi provides configuration for a referral address and referral fee, while Omniston documentation describes how referral parameters are passed into quote requests and settlement. Fees are therefore a supported integration feature rather than automatic evidence of tampering.
If the widget code is official, is the entire website safe?
No. Loading STON.fi's genuine widget proves something about that component, not the entire host application. Other scripts, navigation elements, token promotions, or transaction flows can still belong to the integrator. You should independently verify the host domain and inspect every wallet request before approving it.
What is the best way to verify an Omniston-powered widget before swapping?
Start with the website domain. If you need stronger confirmation, check whether the implementation uses STON.fi's documented widget distribution. Then connect your wallet and verify that TON Connect identifies the dApp you expected. Finally, compare the wallet transaction with the assets, amount, and action you actually requested. Never let an "official" label replace those checks.
Sources and Further Reading
STON.fi Widget - official overview of the embeddable swap widget, CDN integration, customization, TON Connect modes, and configurationSTON.fi Full Guide & Reference - detailed reference for the Omniston widget loader, CDN bundle, custom assets, referral settings, theming, and lifecycle behaviorSTON.fi Omniston Protocol - official overview of Omniston liquidity aggregation, RFQ routing, supported chains, and integration approachesSTON.fi Referral Fees - technical documentation for Omniston referral parameters and fee settlementSTON.fi Omniston Widget GitHub repository - official source repository and documented CDN distribution modelTON Connect Core Concepts - official TON documentation covering manifests, dApp identity, domain binding, and the security modelTON Connect Get Started - official guide to the manifest fields, hosting requirements, and wallet connection flow
$BTC $GRAM
23
Inicia sesión para explorar más contenidos
Únete a usuarios de criptomonedas de todo el mundo en Binance Square
⚡️ Obtén la información más reciente y útil sobre criptomonedas.
💬 Confía en el mayor exchange de criptomonedas del mundo.
👍 Descubre opiniones reales de creadores verificados.
Correo electrónico/número de teléfono
Temas en tendencia
FedRateWatch
99,447 visualizaciones
568 participa(n) en el debate
Comparte y gana recompensas de tráfico en nuestra campaña de hashtag en tendencia
✨Tema: FOMC septiembre, ¿cuál será el próximo movimiento de la Fed?
👉Cómo unirte:
Publica una publicación breve o un artículo con el hashtag #FedRateWatch
Crea contenido basado en los siguientes enfoques:
- El CPI subyacente de agosto aumentó 0.3% mes a mes, y las probabilidades de una subida de 25 pb esta semana ahora están cerca del 90%. ¿Anticipas una subida de tasas esta semana? ¿Es algo puntual o el inicio de un ciclo de subidas más largo?
- Si la subida ocurre, ¿cómo se desarrolla para BTC, acciones tecnológicas y oro? ¿Alcista o bajista?
- ¿Cómo planeas operar a continuación? Comparte tu operación/tenencias de BTC, acciones u oro con nuestro widget para compartir operaciones.
⏰Periodo de la campaña:
- 2026-09-15 11:00 - 2026-09-17 3:00 UTC
🎁Recompensa:
- Las publicaciones que cumplan con las pautas anteriores y tengan más de 100 palabras serán revisadas y podrían recibir un impulso aleatorio de tráfico de 500 a 3,000 visitas. Recibirás una notificación de tu secretario/a de feed si tu publicación es seleccionada.
- Obtén la oportunidad de que tu artículo aparezca destacado en Binance Square Official
¿Necesitas ideas para tu publicación? Visita la página del tema #FedRateWatch o la Square Guide on How to Post for Better Reach.
Binance Square Official
·143 «Me gusta»
·240.9k visualizaciones
BitcoinReboundsTo$79K
39,564 visualizaciones
309 participa(n) en el debate
US30YTreasuryYieldTops5.40%
123 visualizaciones
24 participa(n) en el debate