

HolderStat
167 Publicaciones

HolderStat
Denunciar
Bloquear usuario
Telegram for more ideas: https://t.me/holderstat
0 Siguiendo
1 Seguidores
11 Me gusta
Publicaciones
·
--
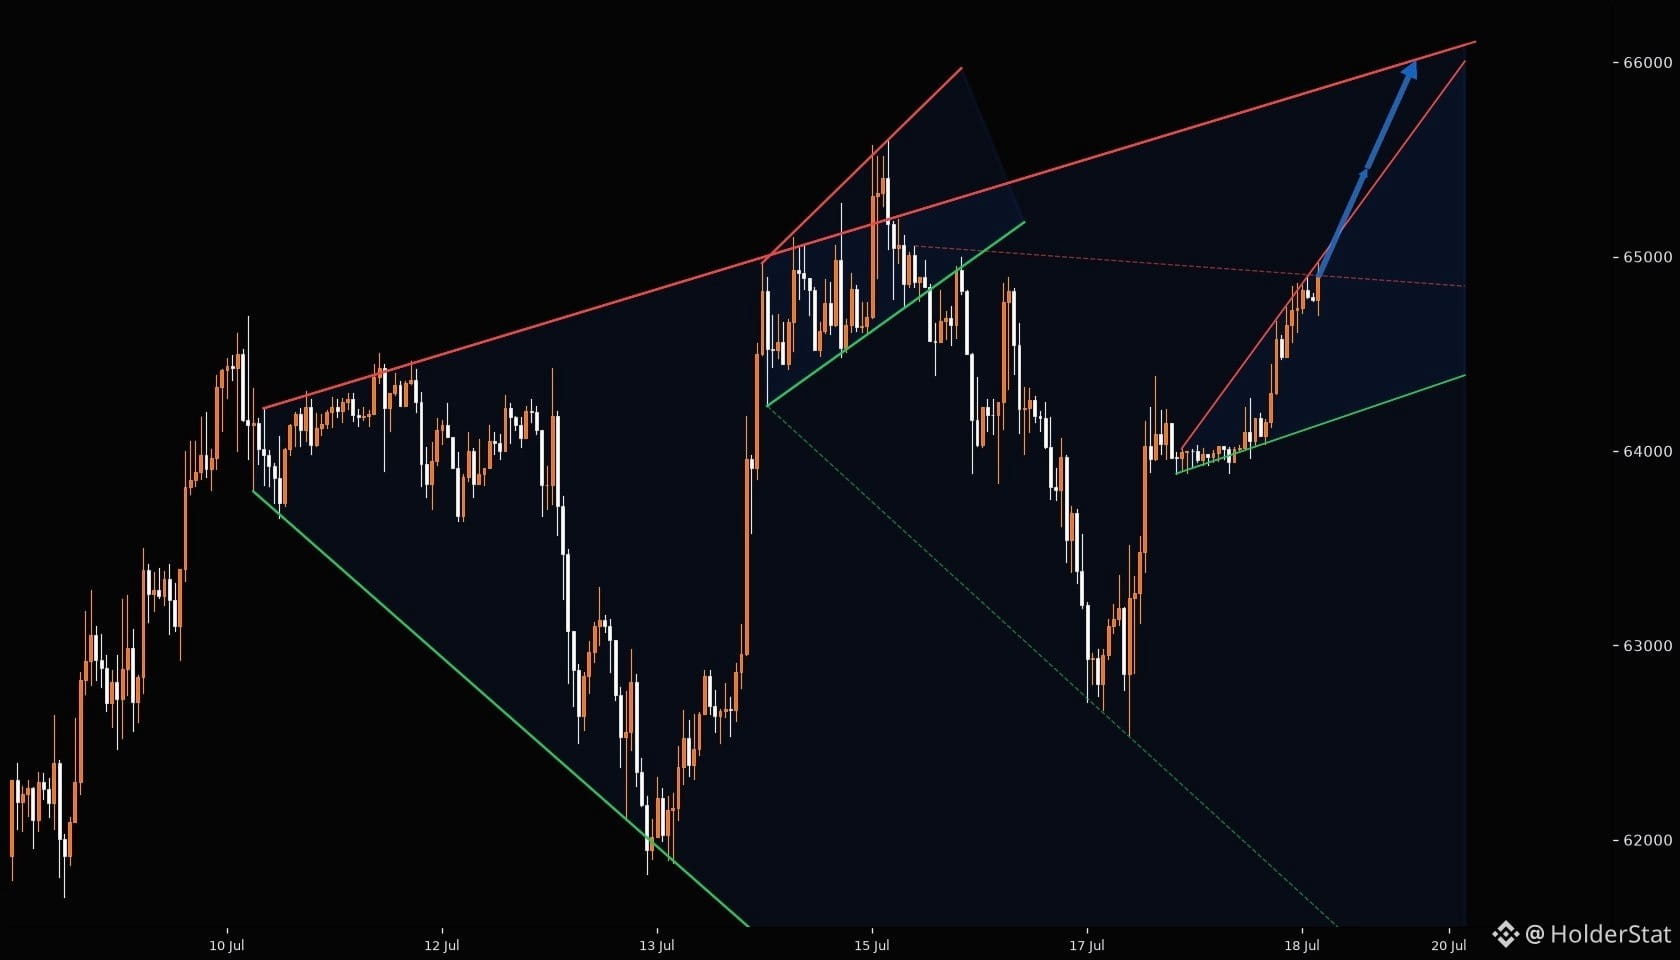
🟢 BTCUSDT 30m – Carga de ruptura de cuña 📍 Precio: $64,895 ⚡ Configuración: Cuña ascendente grande con una puntuación de construcción de 12.0 — 8 toques en la resistencia, 6 en el soporte. El precio se está comprimiendo hacia el vértice. 🔺 Patrón: El objetivo de la cuña alcista se proyecta hacia $65,988. Se detectaron 4 patrones, calificación promedio 9.75. 🔑 Resistencia: Zona $66,090 (línea de tendencia con 8 toques) 🛡️ Soporte: Zona de soporte más cercana $64,390 (6 toques) — por debajo, $63,884 es el siguiente nivel clave. 🚨 Trampa de liquidez: Una ruptura falsa por debajo de $64,390 podría atrapar a los shorts antes de un impulso al alza. 🎯 Objetivo: $65,988 🚨 Invalidación: Cierre por debajo de $64,390 ⏳ Plan: Largo en la revalidación del soporte con un stop por debajo de $64,300. Observa un cierre fuerte por encima de $65,000 para confirmación.
🟢 BTCUSDT 30m – Carga de ruptura de cuña 📍 Precio: $64,895 ⚡ Configuración: Cuña ascendente grande con una puntuación de construcción de 12.0 — 8 toques en la resistencia, 6 en el soporte. El precio se está comprimiendo hacia el vértice. 🔺 Patrón: El objetivo de la cuña alcista se proyecta hacia $65,988. Se detectaron 4 patrones, calificación promedio 9.75. 🔑 Resistencia: Zona $66,090 (línea de tendencia con 8 toques) 🛡️ Soporte: Zona de soporte más cercana $64,390 (6 toques) — por debajo, $63,884 es el siguiente nivel clave. 🚨 Trampa de liquidez: Una ruptura falsa por debajo de $64,390 podría atrapar a los shorts antes de un impulso al alza. 🎯 Objetivo: $65,988 🚨 Invalidación: Cierre por debajo de $64,390 ⏳ Plan: Largo en la revalidación del soporte con un stop por debajo de $64,300. Observa un cierre fuerte por encima de $65,000 para confirmación.
55
·
--
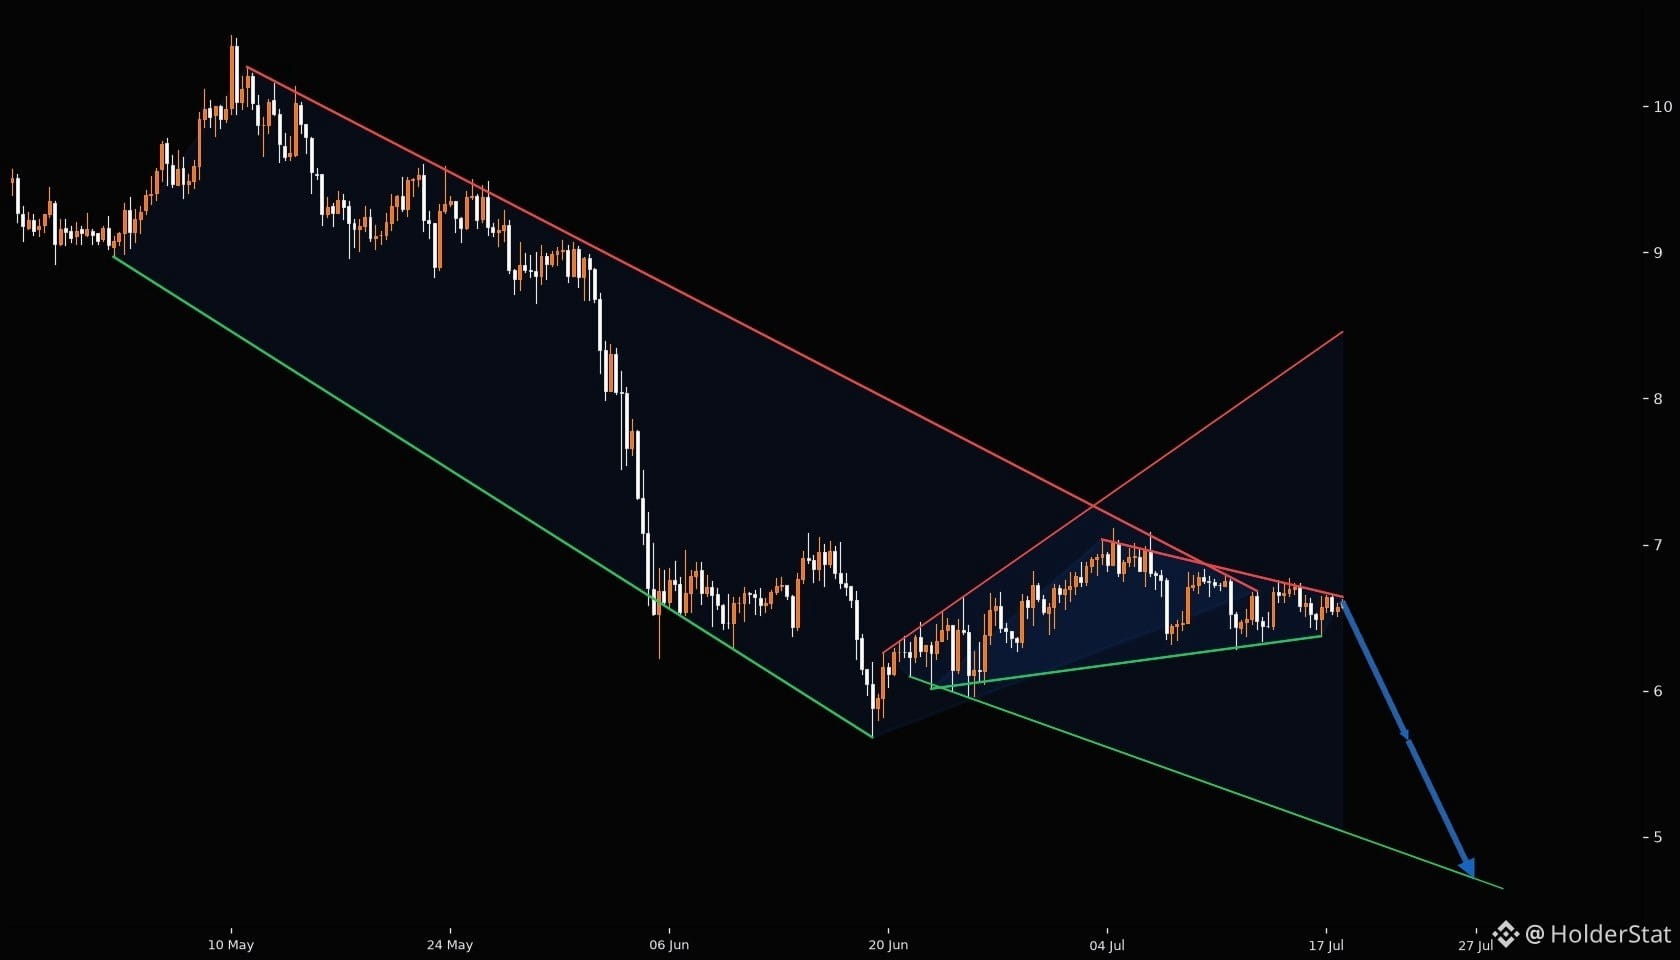
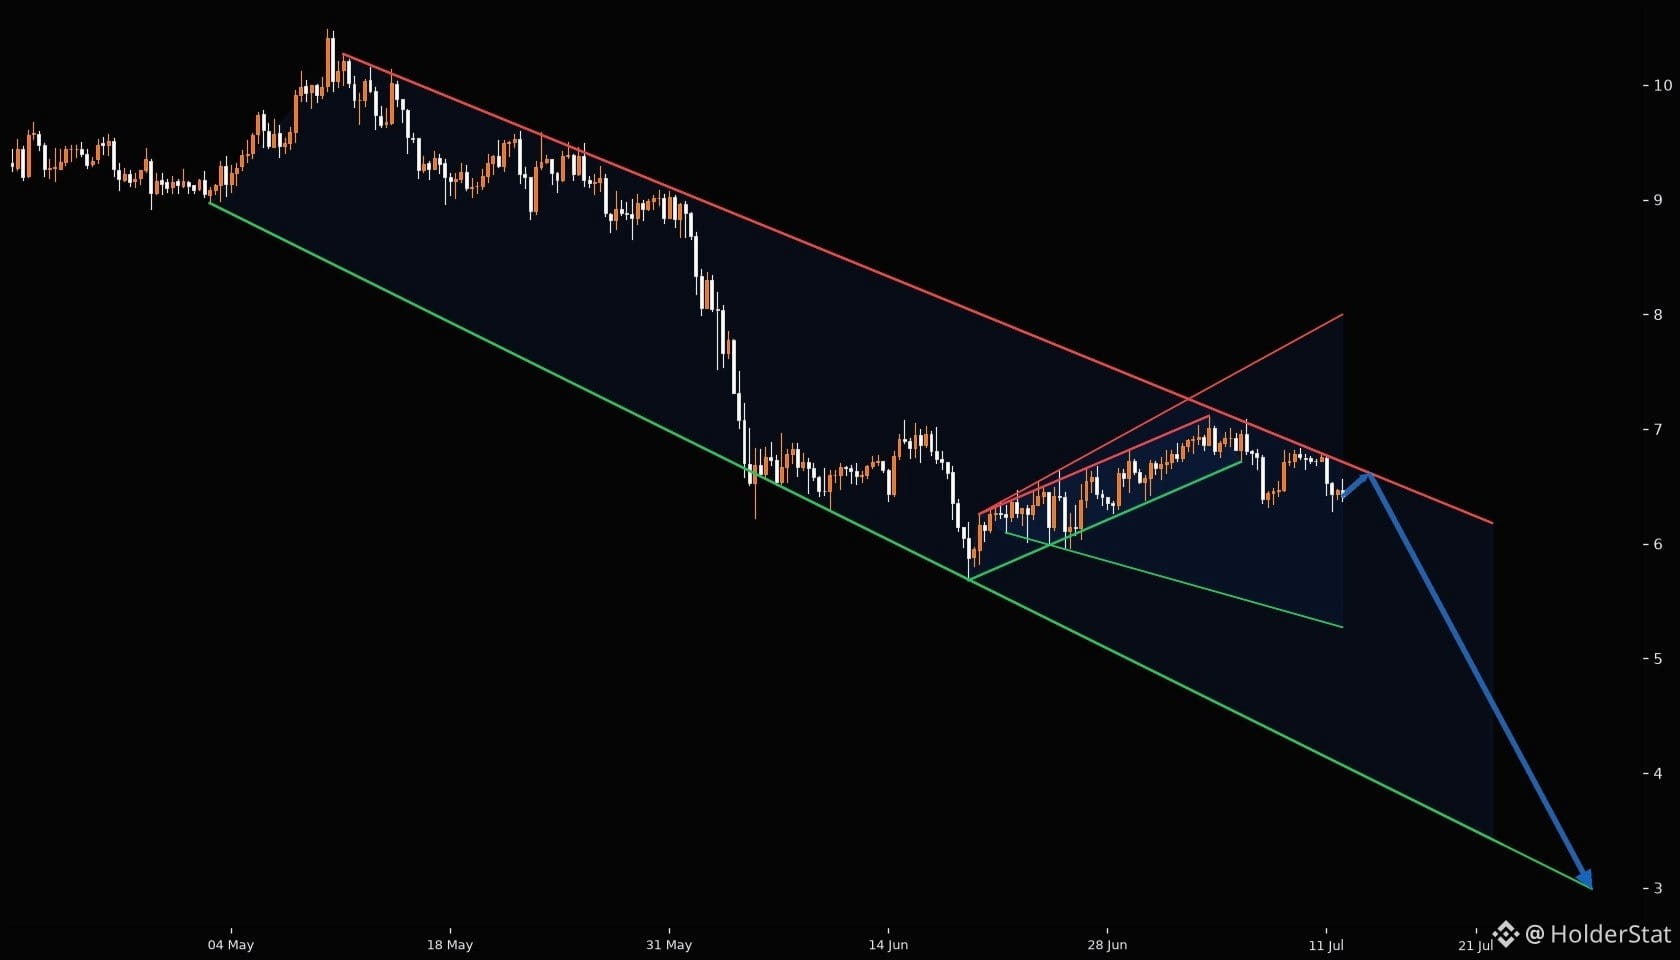
⚡ AVAXUSDT 4H – DESGLOSE DE BEARISH WEDGE 📍 Precio: $6.611 🔺 Patrón: Gran Cuña Caída (234 barras) – 7 toques en soporte, 16 en resistencia. Puntuación 16. El precio está rompiendo por debajo del soporte de la cuña. 🛡️ Soporte: $5.681 (fuerte, 7 toques, 0 rupturas) 🔑 Resistencia: $6.683 (16 toques, 1 ruptura – zona de resistencia más cercana) 🚨 Trampa de Liquidez: El precio rechazó la resistencia de $6.683 múltiples veces; es probable que la liquidez por encima se haya barrido. 🎯 Objetivo: $5.773 (proyección de la cuña) 🚨 Invalidación: Cierre por encima de $6.683 invalida la perspectiva bajista. ⏳ Plan: Vender en la retest de $6.60-6.68, stop por encima de $6.70, objetivo $5.77. Riesgo ajustado.
⚡ AVAXUSDT 4H – DESGLOSE DE BEARISH WEDGE 📍 Precio: $6.611 🔺 Patrón: Gran Cuña Caída (234 barras) – 7 toques en soporte, 16 en resistencia. Puntuación 16. El precio está rompiendo por debajo del soporte de la cuña. 🛡️ Soporte: $5.681 (fuerte, 7 toques, 0 rupturas) 🔑 Resistencia: $6.683 (16 toques, 1 ruptura – zona de resistencia más cercana) 🚨 Trampa de Liquidez: El precio rechazó la resistencia de $6.683 múltiples veces; es probable que la liquidez por encima se haya barrido. 🎯 Objetivo: $5.773 (proyección de la cuña) 🚨 Invalidación: Cierre por encima de $6.683 invalida la perspectiva bajista. ⏳ Plan: Vender en la retest de $6.60-6.68, stop por encima de $6.70, objetivo $5.77. Riesgo ajustado.
77
·
--
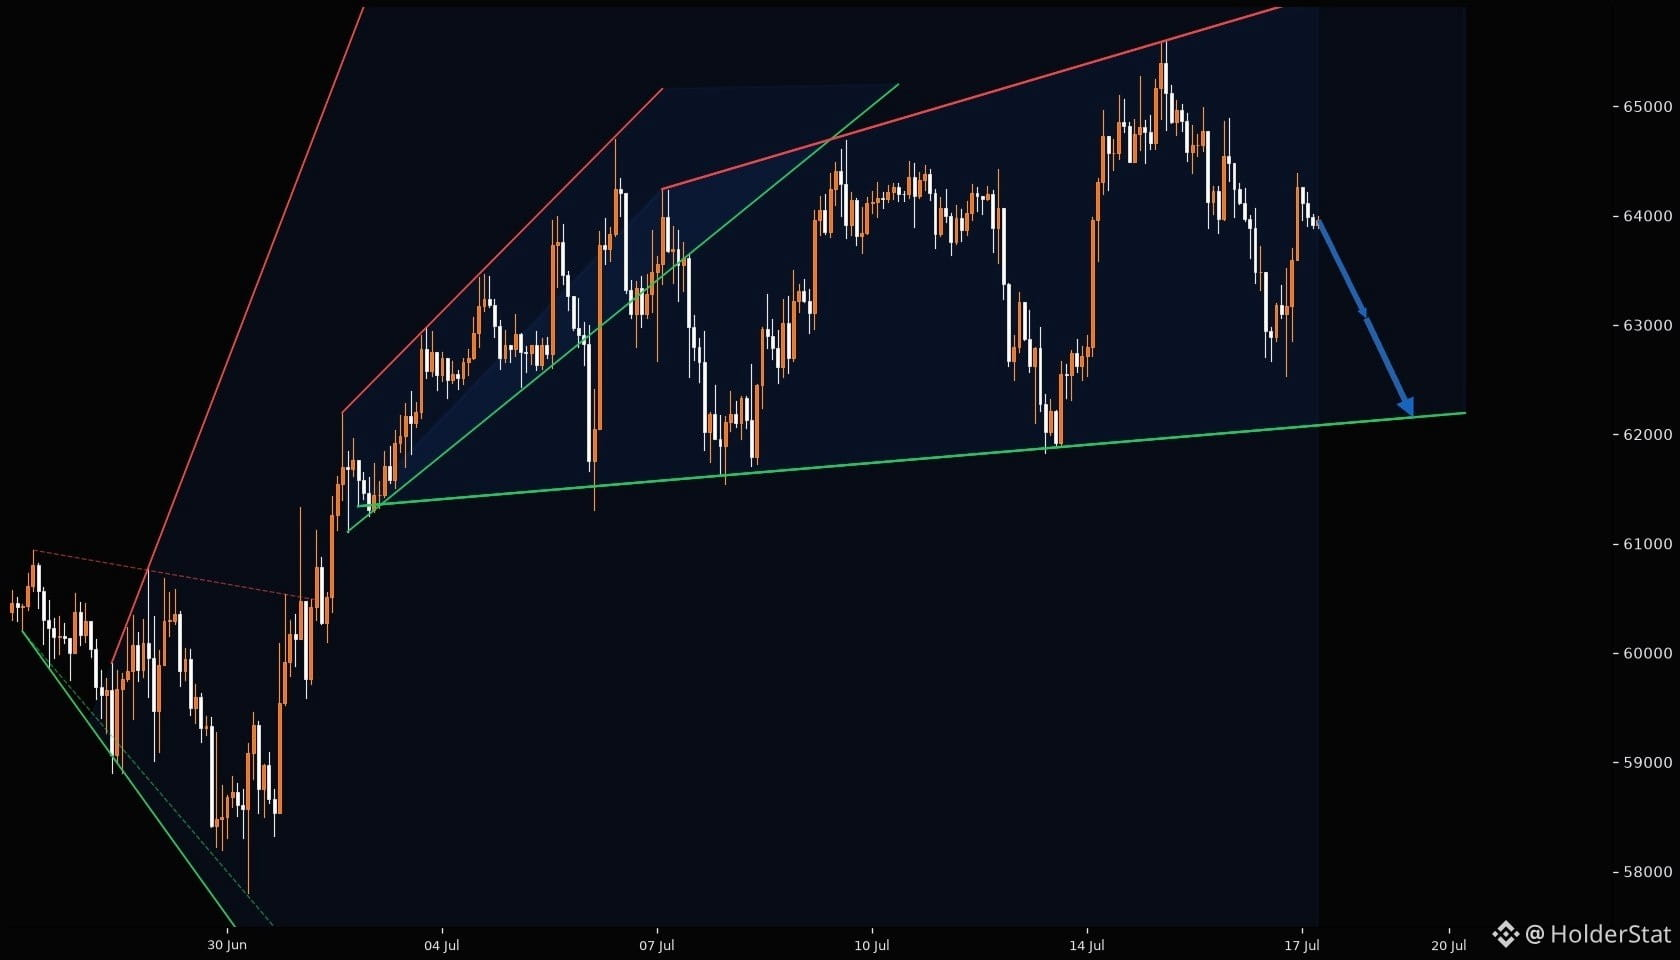
⚡ BTC/USDT – CARGANDO ROTURA ALCISTA DE WEDGE EN 1H 📍 Precio: $63,960 🔺 Patrón: Gran cuña ascendente (151 barras) – se estrecha hacia el ápice 🛡️ Soporte: $62,194 (línea de tendencia con 8 toques, fuerte durante 267 barras) 🔑 Resistencia: $65,600 (carril superior de la cuña, línea con 7 toques) 🎯 Objetivo: $65,600 🚨 Invalidación: Caída por debajo de $62,194 ⏳ Plan: El precio rebota desde la zona de soporte del $SPX con 8 toques limpios. La compresión de la cuña favorece una resolución al alza. Un impulso por encima de $64,300 confirma la rotura. El objetivo está en la línea de resistencia $65,600. Vigila una trampa de liquidez por debajo de $62,000 antes del movimiento. Sesgo: Alcista
⚡ BTC/USDT – CARGANDO ROTURA ALCISTA DE WEDGE EN 1H 📍 Precio: $63,960 🔺 Patrón: Gran cuña ascendente (151 barras) – se estrecha hacia el ápice 🛡️ Soporte: $62,194 (línea de tendencia con 8 toques, fuerte durante 267 barras) 🔑 Resistencia: $65,600 (carril superior de la cuña, línea con 7 toques) 🎯 Objetivo: $65,600 🚨 Invalidación: Caída por debajo de $62,194 ⏳ Plan: El precio rebota desde la zona de soporte del $SPX con 8 toques limpios. La compresión de la cuña favorece una resolución al alza. Un impulso por encima de $64,300 confirma la rotura. El objetivo está en la línea de resistencia $65,600. Vigila una trampa de liquidez por debajo de $62,000 antes del movimiento. Sesgo: Alcista
55
·
--
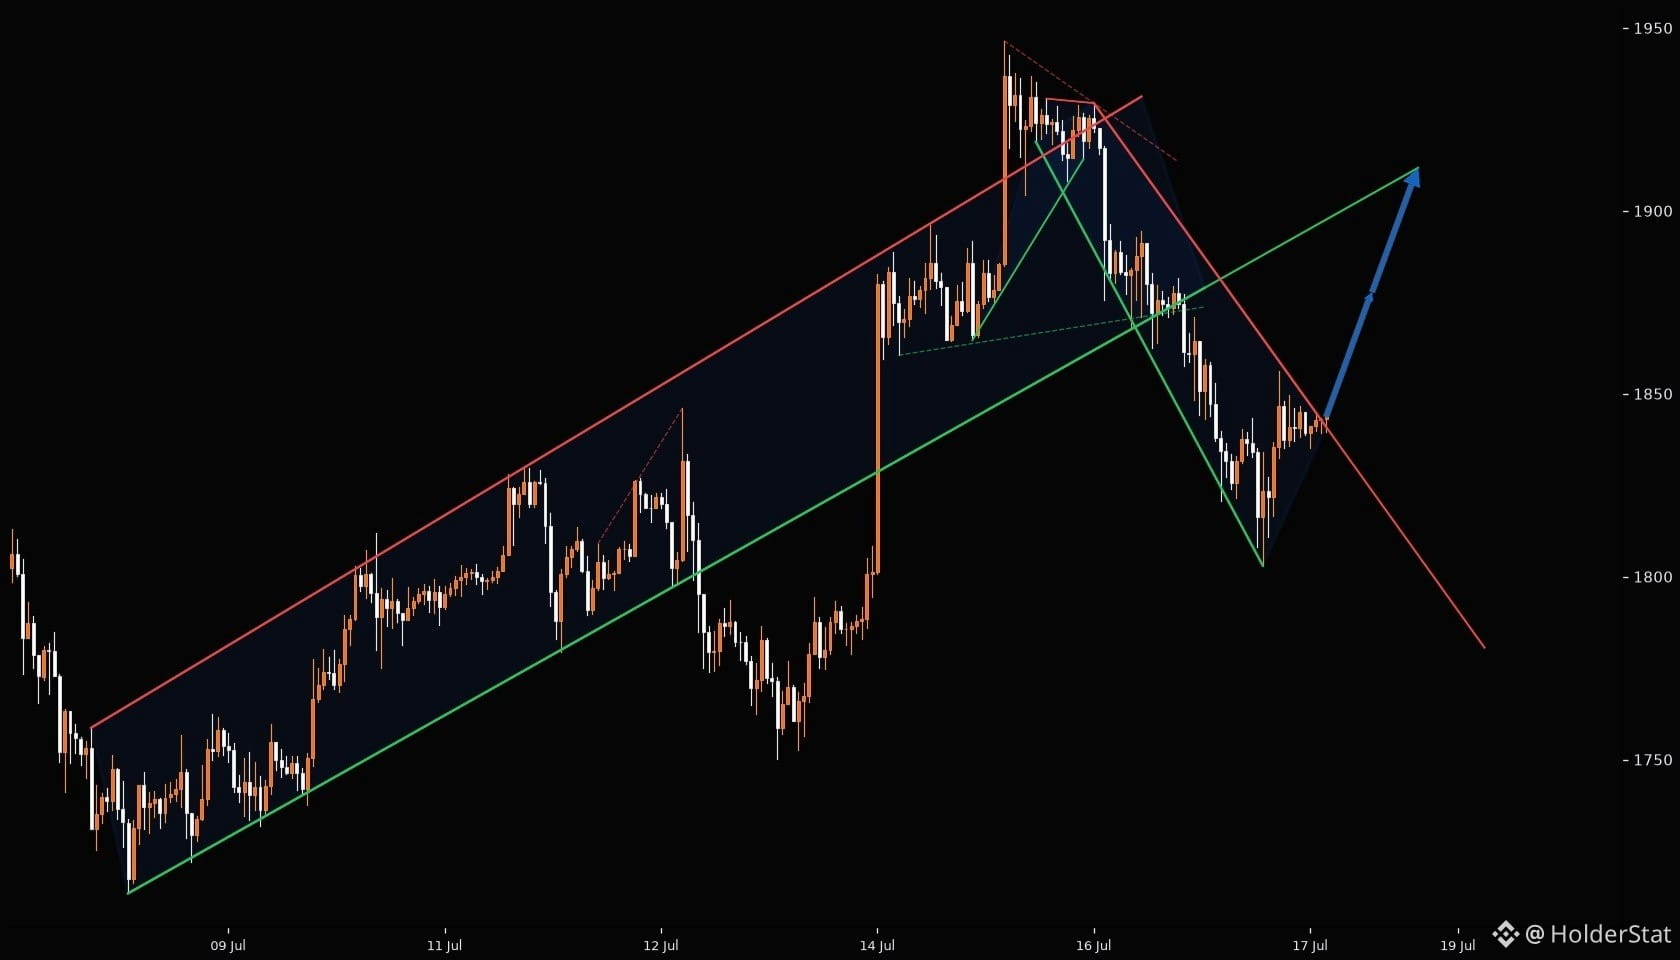
⚡ $ETH 30M: LA PRESIÓN DEL WEDGE SE ESTÁ ACUMULANDO ⚠️ Ethereum se está comprimiendo cerca de una zona de decisión. El gráfico se está ajustando, y justo aquí es donde normalmente empiezan a formarse trampas de liquidez. 📍 Estructura actual: el precio está reaccionando alrededor de la base local más reciente. Los compradores aún tienen soporte, pero el movimiento necesita confirmación antes de llamarlo “limpio”. 🔺 Lectura del patrón: en 30M se está construyendo una compresión. Pequeños wedges dentro de una estructura más grande pueden provocar un falso rompimiento brusco antes del movimiento real. 🔑 Resistencia a vigilar: el clúster marcado más cercano es la primera prueba. Un barrido rápido por encima puede atrapar a compradores tardíos si no acompaña el volumen. 🛡️ Soporte por debajo: si la zona defendida sigue aguantando, puede acumularse presión alcista. Si se rompe, el mercado podría rápidamente buscar el bolsillo de liquidez más profundo. 🎯 Plan principal: esperar a que el wedge se resuelva. La operación no está en el ruido: está en la reacción alrededor de los niveles marcados. ⏳ Paciencia. Primero que se imprima el rompimiento o el rechazo. No hace falta perseguir la primera vela. $ETH #ETH análisis de precio
⚡ $ETH 30M: LA PRESIÓN DEL WEDGE SE ESTÁ ACUMULANDO ⚠️ Ethereum se está comprimiendo cerca de una zona de decisión. El gráfico se está ajustando, y justo aquí es donde normalmente empiezan a formarse trampas de liquidez. 📍 Estructura actual: el precio está reaccionando alrededor de la base local más reciente. Los compradores aún tienen soporte, pero el movimiento necesita confirmación antes de llamarlo “limpio”. 🔺 Lectura del patrón: en 30M se está construyendo una compresión. Pequeños wedges dentro de una estructura más grande pueden provocar un falso rompimiento brusco antes del movimiento real. 🔑 Resistencia a vigilar: el clúster marcado más cercano es la primera prueba. Un barrido rápido por encima puede atrapar a compradores tardíos si no acompaña el volumen. 🛡️ Soporte por debajo: si la zona defendida sigue aguantando, puede acumularse presión alcista. Si se rompe, el mercado podría rápidamente buscar el bolsillo de liquidez más profundo. 🎯 Plan principal: esperar a que el wedge se resuelva. La operación no está en el ruido: está en la reacción alrededor de los niveles marcados. ⏳ Paciencia. Primero que se imprima el rompimiento o el rechazo. No hace falta perseguir la primera vela. $ETH #ETH análisis de precio
74
·
--
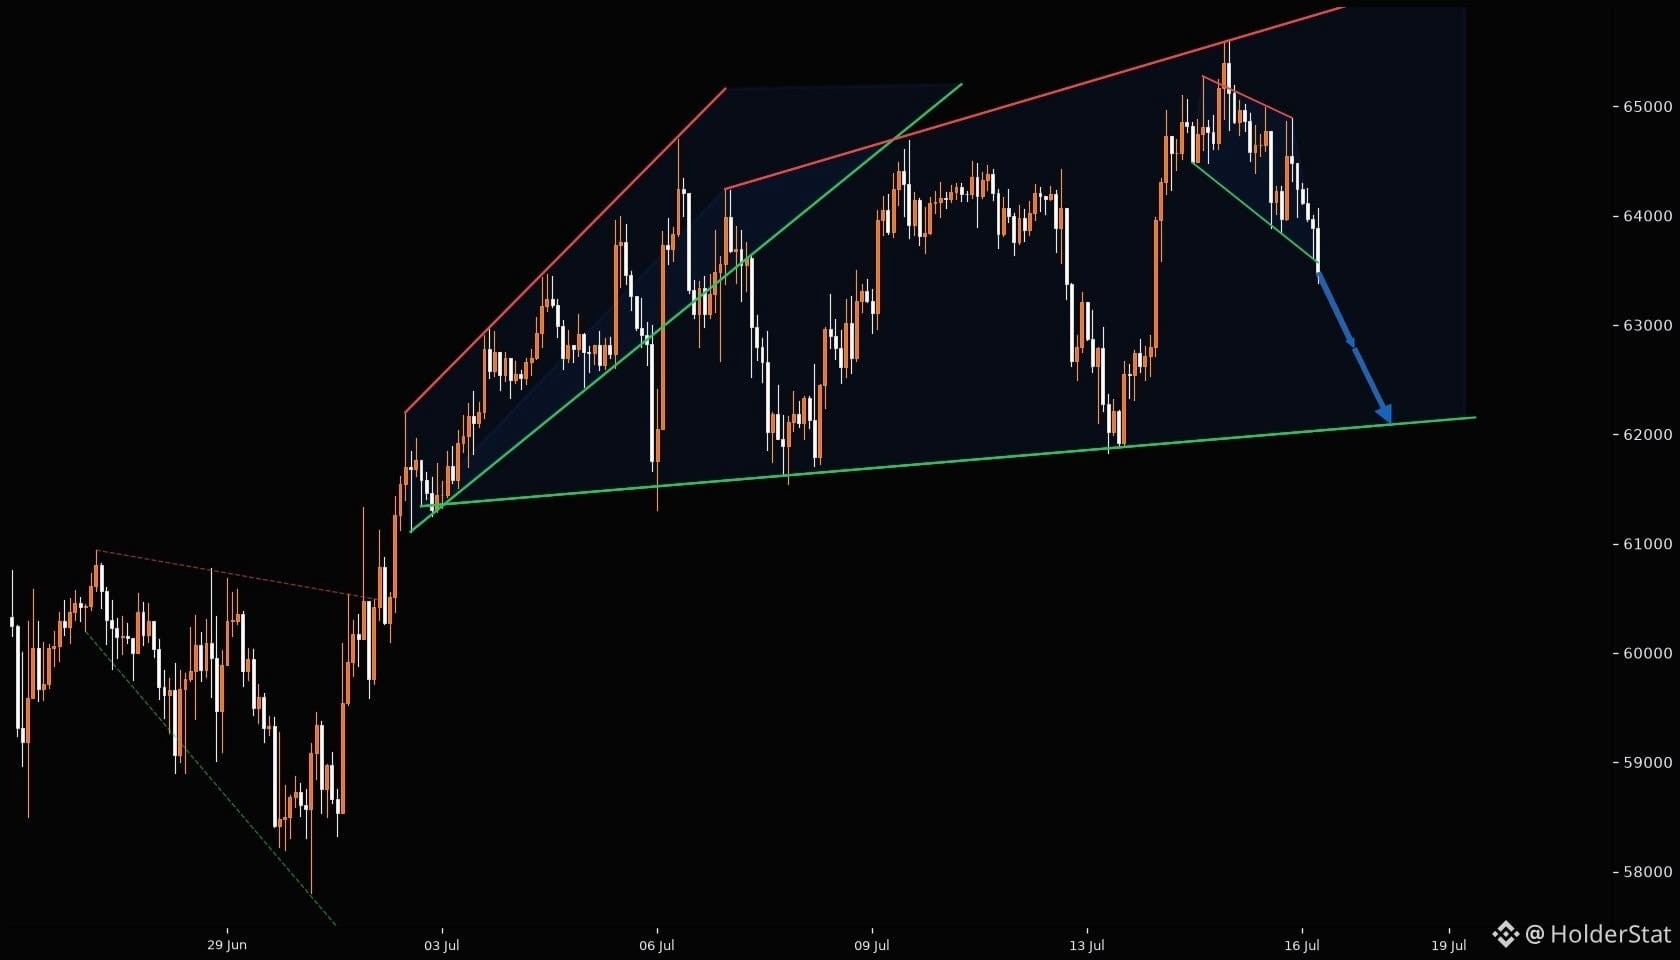
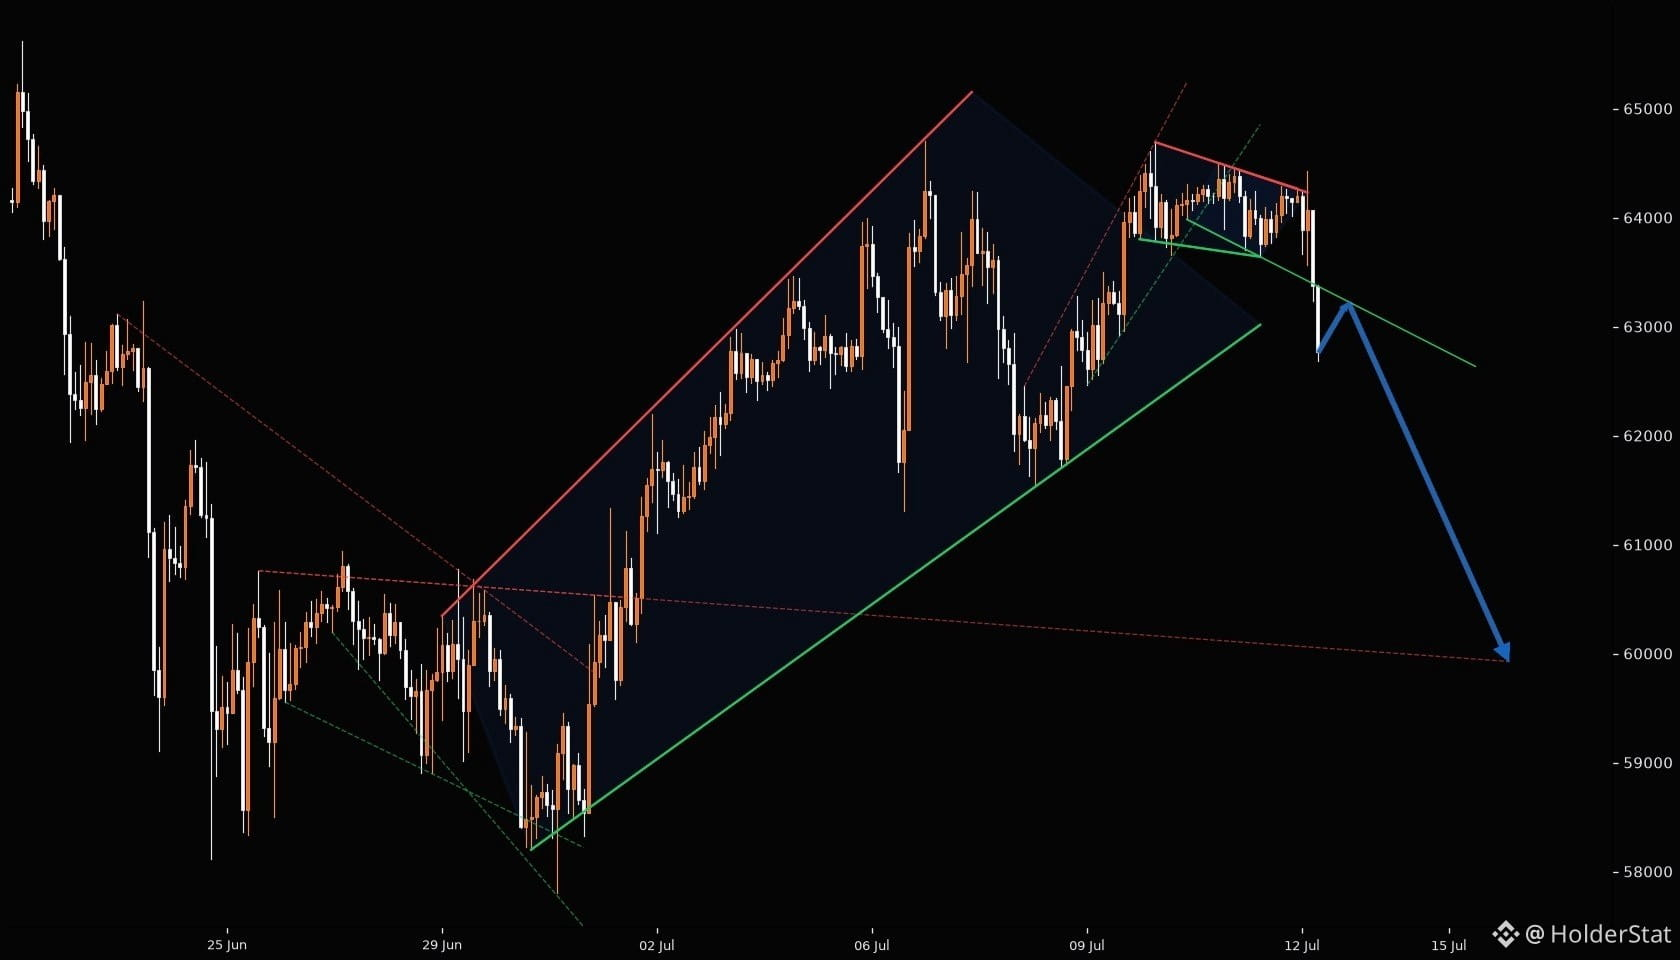
⚡ BTC/USDT 1H — SESGO BAJISTA ACTIVO 📍 Precio: 63,482 🔺 Patrón: Ruptura de cuña desde un soporte ascendente de 267 velas. El precio atravesó la línea de tendencia inferior después de múltiples toques: trampa de liquidez confirmada. 🔑 Resistencia: zona 64,300 (conjunto de resistencias más cercano) | 64,700 (mayor) 🛡️ Soporte: 62,146 (soporte estructural) | 61,882 (zona de pivote fuerte) 🎯 Objetivo: 62,565 🚨 Invalidación: Por encima de 64,300 con volumen ⏳ Plan: Precio por debajo de la zona de soporte rota. Re-test de 63,700-64,000 es una ventana de entrada corta. Primer tramo a 62,565. Si falla, el siguiente soporte es 61,882. La tendencia se está debilitando: el impulso favorece la baja.
⚡ BTC/USDT 1H — SESGO BAJISTA ACTIVO 📍 Precio: 63,482 🔺 Patrón: Ruptura de cuña desde un soporte ascendente de 267 velas. El precio atravesó la línea de tendencia inferior después de múltiples toques: trampa de liquidez confirmada. 🔑 Resistencia: zona 64,300 (conjunto de resistencias más cercano) | 64,700 (mayor) 🛡️ Soporte: 62,146 (soporte estructural) | 61,882 (zona de pivote fuerte) 🎯 Objetivo: 62,565 🚨 Invalidación: Por encima de 64,300 con volumen ⏳ Plan: Precio por debajo de la zona de soporte rota. Re-test de 63,700-64,000 es una ventana de entrada corta. Primer tramo a 62,565. Si falla, el siguiente soporte es 61,882. La tendencia se está debilitando: el impulso favorece la baja.
51
·
--
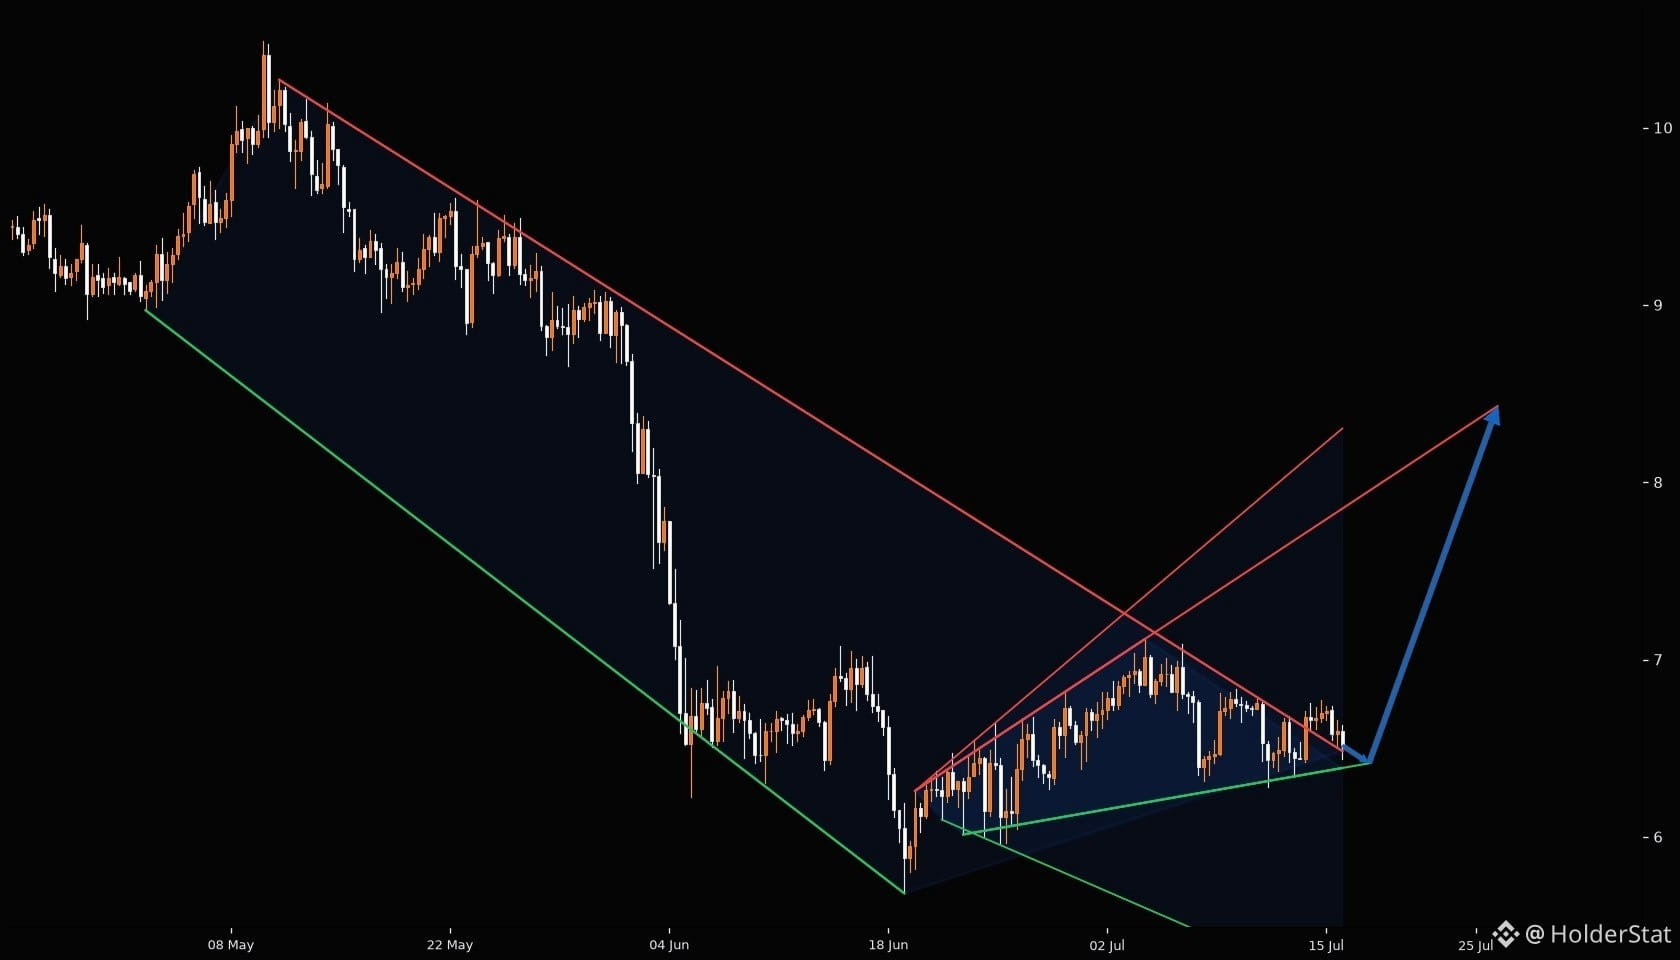
⚡ CONFIGURACIÓN: AVAXUSDT – 4H HUNDIMIENTO DE CUÑA BAJISTA 📍 Precio: $6.519 🔺 Patrón: Cuña descendente grande – solapamiento de 234 barras, 16 toques en la resistencia. El precio rompió por debajo del soporte de la cuña en $5.68 y ahora está probando nuevamente la cara inferior de la estructura rota. 🔑 Resistencia: $6.48 – $6.68 (zona de resistencia de la cuña, línea de 16 toques + resistencia secundaria en $6.68) 🛡️ Soporte: $6.34 – $6.39 (zona de soporte más cercana desde múltiples líneas de pivote). Soporte clave en $5.68 (piso de la cuña). ⚡ Configuración: El precio está por debajo de la línea de tendencia de resistencia principal después de un intento fallido de mantenerla. La ruptura de la cuña apunta al movimiento medido hacia abajo. Posible trampa de liquidez si
⚡ CONFIGURACIÓN: AVAXUSDT – 4H HUNDIMIENTO DE CUÑA BAJISTA 📍 Precio: $6.519 🔺 Patrón: Cuña descendente grande – solapamiento de 234 barras, 16 toques en la resistencia. El precio rompió por debajo del soporte de la cuña en $5.68 y ahora está probando nuevamente la cara inferior de la estructura rota. 🔑 Resistencia: $6.48 – $6.68 (zona de resistencia de la cuña, línea de 16 toques + resistencia secundaria en $6.68) 🛡️ Soporte: $6.34 – $6.39 (zona de soporte más cercana desde múltiples líneas de pivote). Soporte clave en $5.68 (piso de la cuña). ⚡ Configuración: El precio está por debajo de la línea de tendencia de resistencia principal después de un intento fallido de mantenerla. La ruptura de la cuña apunta al movimiento medido hacia abajo. Posible trampa de liquidez si
72
·
--
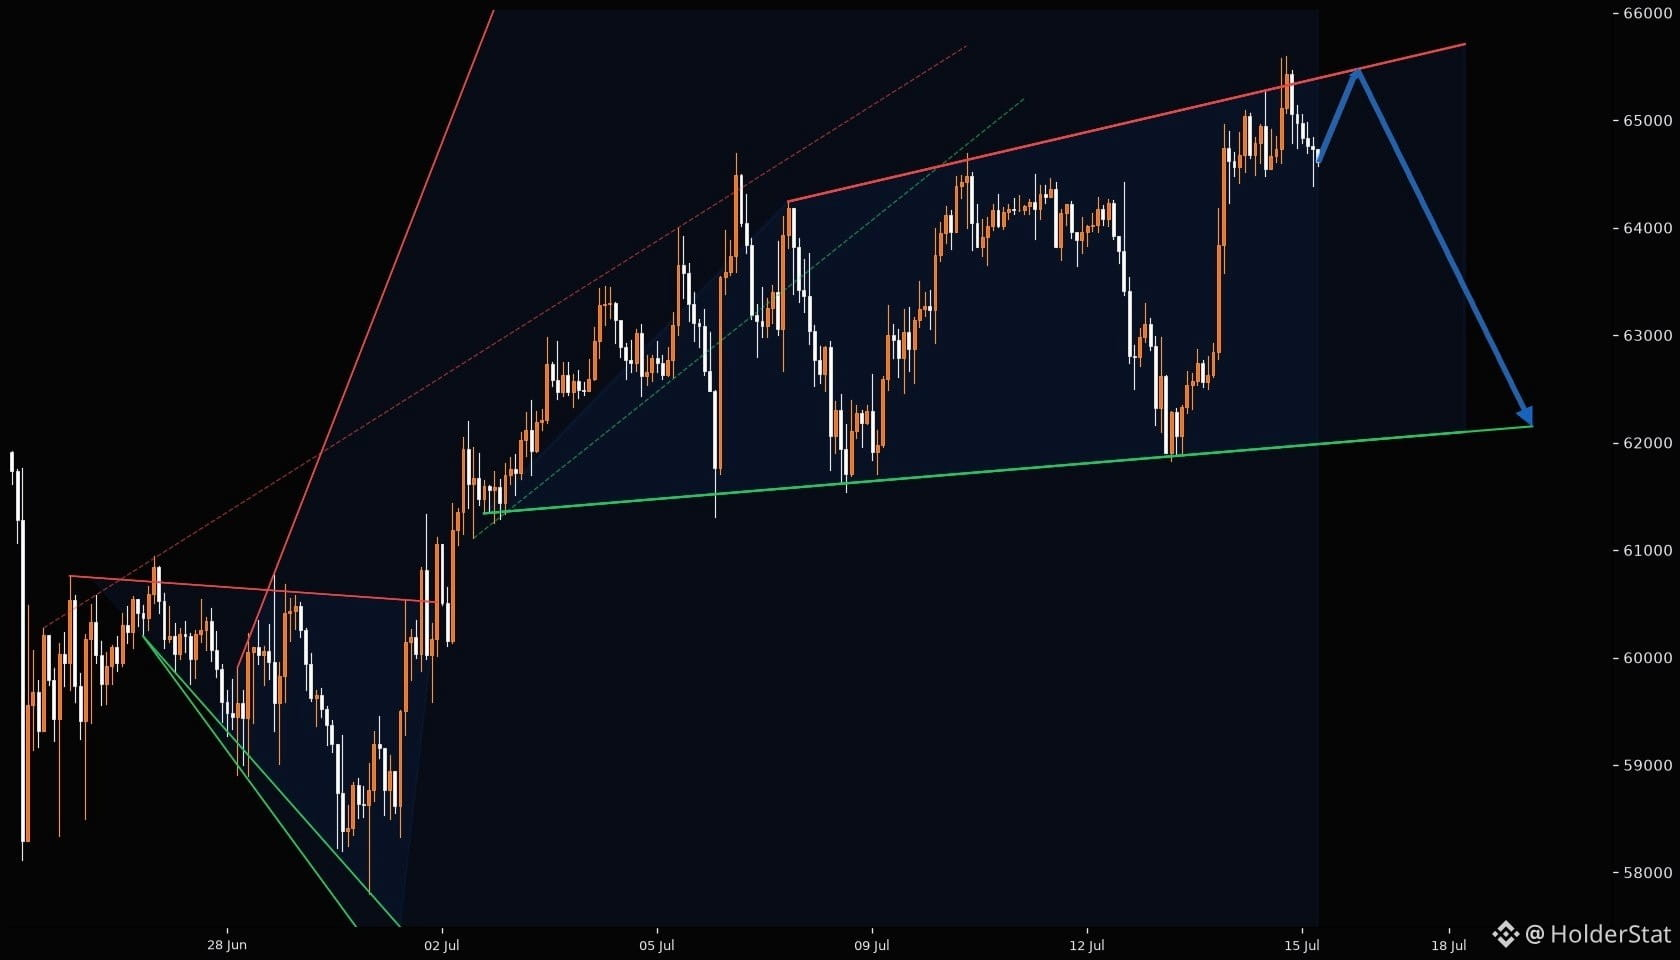
Se trata de BTCUSDT en un marco temporal de 1 hora. La flecha apunta hacia arriba, el precio actual es 64613.99 y el objetivo es 65600. Se observan patrones como una cuña grande (¿cuña ascendente?) y cuñas medianas. La tendencia es alcista según la flecha. Es necesario extraer los niveles clave: líneas de soporte y resistencia. La resistencia con la puntuación más alta es 6.5 (ID 4 y 11). Líneas de soporte: puntuación más alta 6.0 (id 1) con precio final 62099.63, pero también observe el soporte id 4 con puntuación 5.0 y precio final 65201.2 (¿está cerca del precio actual? En realidad, 65201 está por encima del precio actual, ¿así que es una resistencia? Espere, la línea de soporte id 4 tiene un precio final de 65201.21, ¿pero es una línea de soporte? Eso parece extraño porque está por encima del precio actual. Pero es una línea de soporte con pendiente positiva, por lo que es un soporte ascendente que podría estar cerca del precio actual. Sin embargo, para simplificar, deberíamos usar las zonas de soporte/resistencia más cercanas...
Se trata de BTCUSDT en un marco temporal de 1 hora. La flecha apunta hacia arriba, el precio actual es 64613.99 y el objetivo es 65600. Se observan patrones como una cuña grande (¿cuña ascendente?) y cuñas medianas. La tendencia es alcista según la flecha. Es necesario extraer los niveles clave: líneas de soporte y resistencia. La resistencia con la puntuación más alta es 6.5 (ID 4 y 11). Líneas de soporte: puntuación más alta 6.0 (id 1) con precio final 62099.63, pero también observe el soporte id 4 con puntuación 5.0 y precio final 65201.2 (¿está cerca del precio actual? En realidad, 65201 está por encima del precio actual, ¿así que es una resistencia? Espere, la línea de soporte id 4 tiene un precio final de 65201.21, ¿pero es una línea de soporte? Eso parece extraño porque está por encima del precio actual. Pero es una línea de soporte con pendiente positiva, por lo que es un soporte ascendente que podría estar cerca del precio actual. Sin embargo, para simplificar, deberíamos usar las zonas de soporte/resistencia más cercanas...
54
·
--
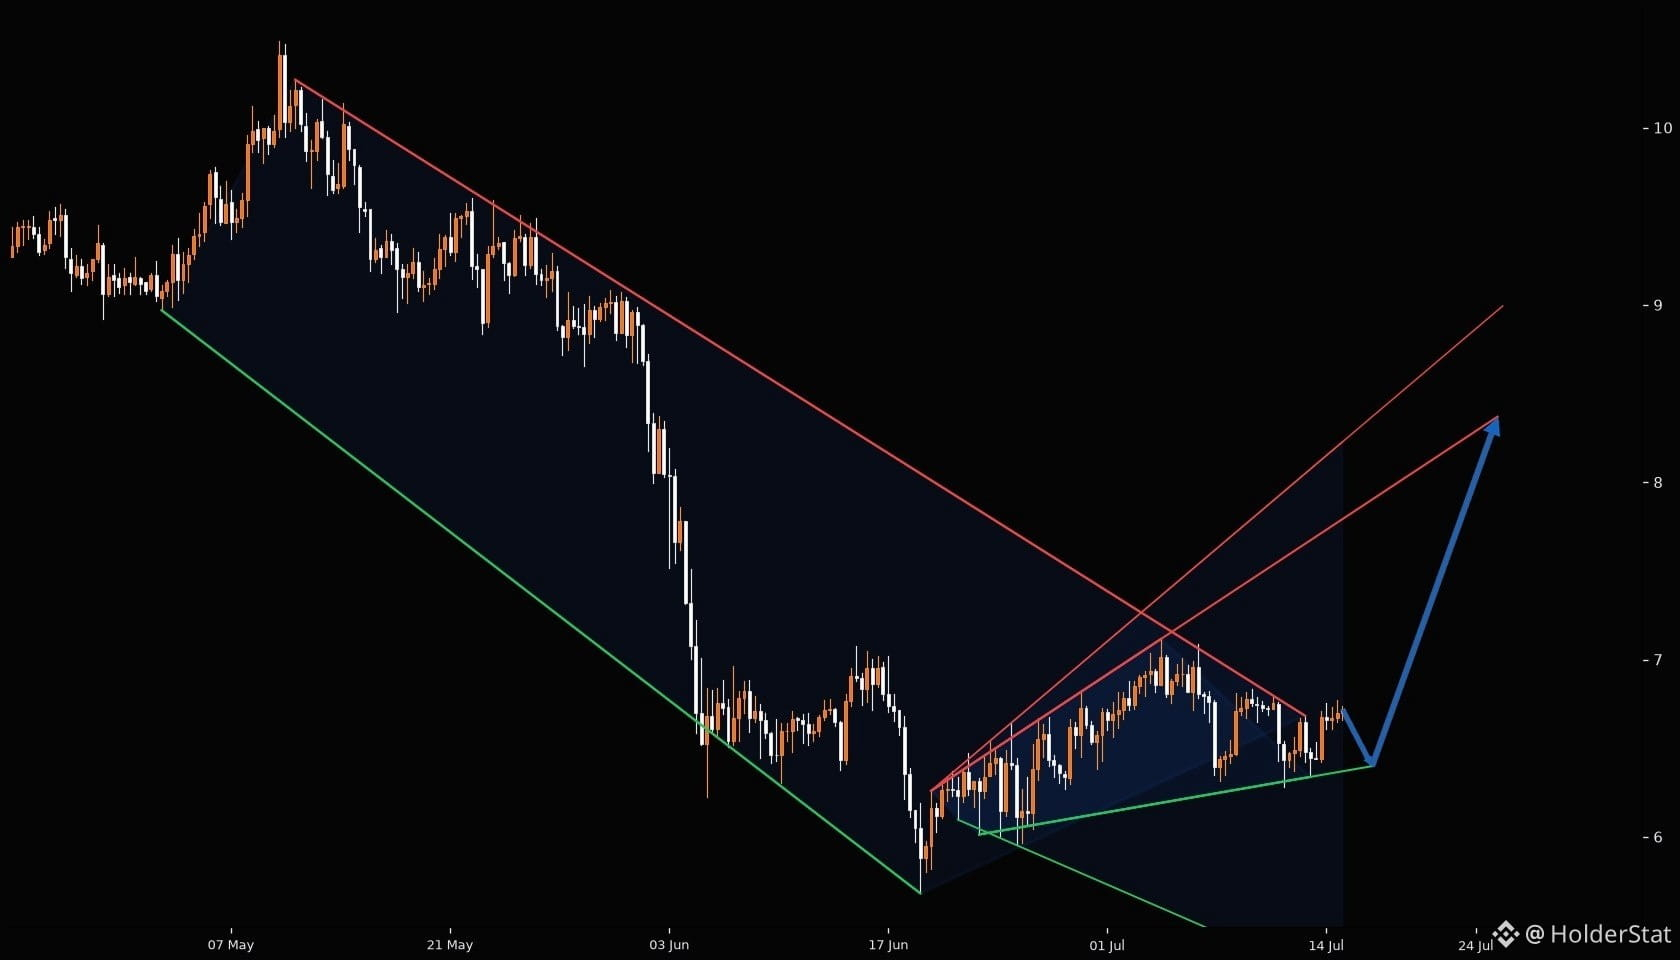
⚡ Configuración: AVAXUSDT – 4h Ruptura Alcista en Progreso 📍 Precio: 6.722 🔺 Patrón: Gran Ruptura de Cuña Descendente La cuña formada durante más de 400 velas, con 16 toques en la resistencia y 7 en el soporte. El precio ya ha empujado por encima de la línea de tendencia bajista. 🔑 Resistencia: 6.683 (línea de resistencia de la cuña, ahora invertida como soporte) Por encima de eso, la zona de resistencia más cercana está en 7.088 🛡️ Soporte: 5.681 (línea de soporte de la cuña) Soporte más cercano en 6.338 🎯 Objetivo: 6.952 🚨 Invalidación: Un cierre nuevamente por debajo de 6.683 atraparía a los compradores tardíos y anularía la ruptura. ⏳ Plan: Vigila una retención limpia por encima de 6.683. Un retesteo de este nivel como soporte confirmaría el movimiento. El objetivo es la siguiente zona de resistencia cerca de 6.95. Si el precio rechaza en 7.088, se espera un retroceso con presión hacia el soporte.
⚡ Configuración: AVAXUSDT – 4h Ruptura Alcista en Progreso 📍 Precio: 6.722 🔺 Patrón: Gran Ruptura de Cuña Descendente La cuña formada durante más de 400 velas, con 16 toques en la resistencia y 7 en el soporte. El precio ya ha empujado por encima de la línea de tendencia bajista. 🔑 Resistencia: 6.683 (línea de resistencia de la cuña, ahora invertida como soporte) Por encima de eso, la zona de resistencia más cercana está en 7.088 🛡️ Soporte: 5.681 (línea de soporte de la cuña) Soporte más cercano en 6.338 🎯 Objetivo: 6.952 🚨 Invalidación: Un cierre nuevamente por debajo de 6.683 atraparía a los compradores tardíos y anularía la ruptura. ⏳ Plan: Vigila una retención limpia por encima de 6.683. Un retesteo de este nivel como soporte confirmaría el movimiento. El objetivo es la siguiente zona de resistencia cerca de 6.95. Si el precio rechaza en 7.088, se espera un retroceso con presión hacia el soporte.
66
·
--
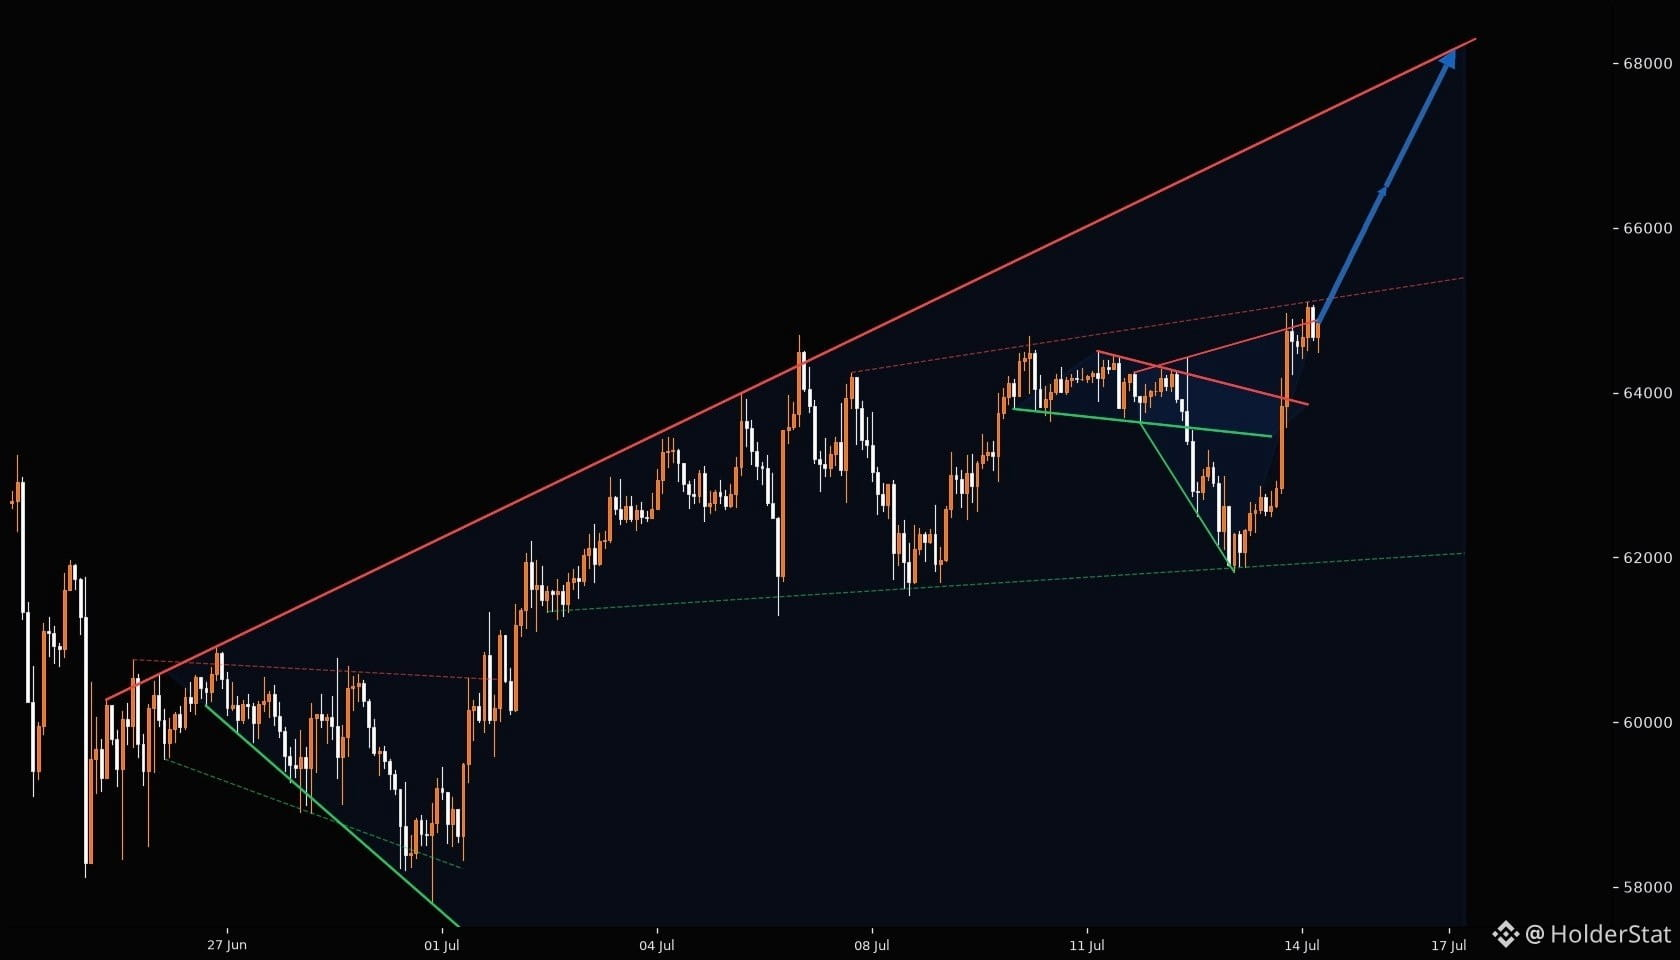
⚡ $BTC 1H: LA PRESIÓN DEL WEDGE SE ESTÁ ACUMULANDO ⚠️ Bitcoin está coiling cerca de una zona de decisión. El gráfico se está ajustando, y este es exactamente el punto donde normalmente empiezan a formarse las trampas de liquidez. 📍 Estructura actual: el precio reacciona alrededor de la base local más reciente. Los compradores aún tienen soporte, pero el movimiento necesita confirmación antes de llamarlo limpio. 🔺 Lectura del patrón: la compresión se está formando en 1H. Pequeños wedges dentro de una estructura mayor pueden provocar un fakeout brusco antes del movimiento real. 🔑 Resistencia a vigilar: el clúster más cercano marcado es el primer test. Un barrido rápido por encima puede atrapar a compradores tardíos si el volumen no acompaña. 🛡️ Soporte por debajo: si la zona defendida mantiene, la presión alcista puede acumularse. Si se rompe, el mercado podría ir rápidamente en busca del bolsillo de liquidez más profundo. 🎯 Plan principal: espera a que el wedge se resuelva. La operación no está en el ruido: está en la reacción alrededor de los niveles marcados. ⏳ Paciencia. Deja que primero se imprima la ruptura o el rechazo. No hace falta perseguir la primera vela. $BTC #BTC price analysis
⚡ $BTC 1H: LA PRESIÓN DEL WEDGE SE ESTÁ ACUMULANDO ⚠️ Bitcoin está coiling cerca de una zona de decisión. El gráfico se está ajustando, y este es exactamente el punto donde normalmente empiezan a formarse las trampas de liquidez. 📍 Estructura actual: el precio reacciona alrededor de la base local más reciente. Los compradores aún tienen soporte, pero el movimiento necesita confirmación antes de llamarlo limpio. 🔺 Lectura del patrón: la compresión se está formando en 1H. Pequeños wedges dentro de una estructura mayor pueden provocar un fakeout brusco antes del movimiento real. 🔑 Resistencia a vigilar: el clúster más cercano marcado es el primer test. Un barrido rápido por encima puede atrapar a compradores tardíos si el volumen no acompaña. 🛡️ Soporte por debajo: si la zona defendida mantiene, la presión alcista puede acumularse. Si se rompe, el mercado podría ir rápidamente en busca del bolsillo de liquidez más profundo. 🎯 Plan principal: espera a que el wedge se resuelva. La operación no está en el ruido: está en la reacción alrededor de los niveles marcados. ⏳ Paciencia. Deja que primero se imprima la ruptura o el rechazo. No hace falta perseguir la primera vela. $BTC #BTC price analysis
68
·
--
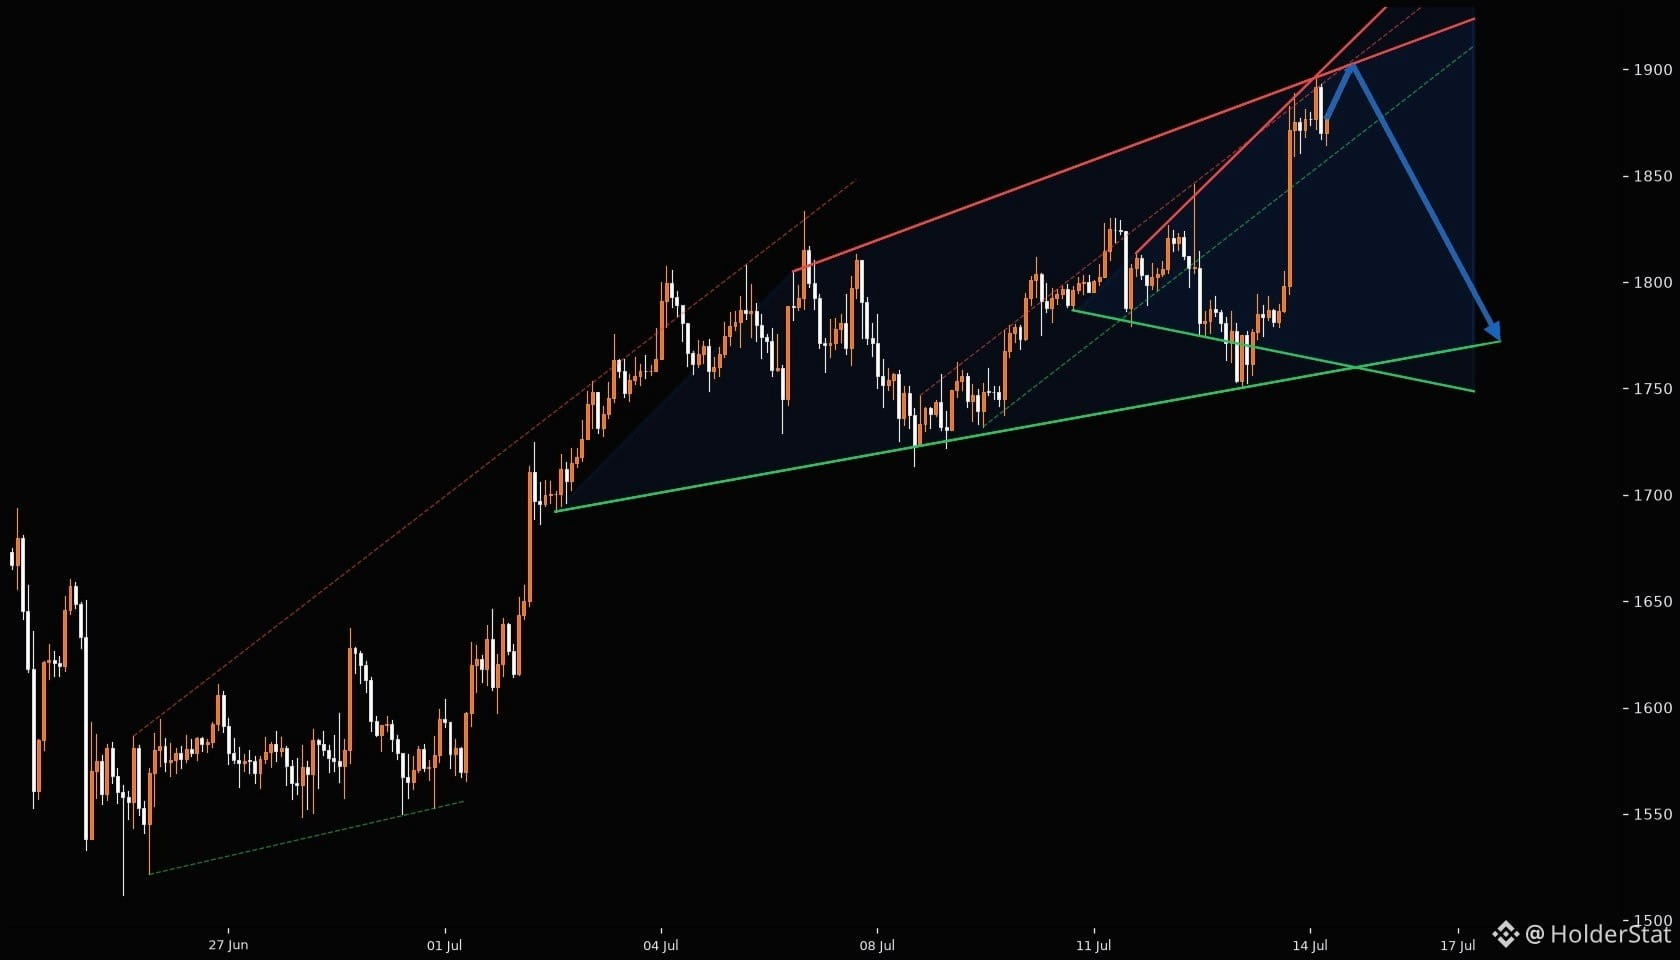
⚡ $ETH 1H: LA PRESIÓN DE LA CUÑA SE ESTÁ ACUMULANDO ⚠️ Ethereum está a punto de decidir cerca de una zona crítica. El gráfico se está apretando, y justo aquí es donde normalmente empiezan a formarse las trampas de liquidez. 📍 Estructura actual: el precio está reaccionando alrededor de la base local más reciente. Los compradores aún tienen soporte, pero el movimiento necesita confirmación antes de llamarlo limpio. 🔺 Lectura del patrón: la compresión se está formando en 1H. Las cuñas pequeñas dentro de una estructura mayor pueden provocar un falso rompimiento brusco antes del movimiento real. 🔑 Resistencia a vigilar: el clúster marcado más cercano es la primera prueba. Un barrido rápido por encima puede atrapar a los compradores tardíos si el volumen no acompaña. 🛡️ Soporte por debajo: si la zona defendida sigue manteniéndose, la presión alcista puede acumularse. Si se rompe, el mercado puede buscar rápidamente el bolsillo de liquidez más profundo. 🎯 Plan principal: espera a que la cuña se resuelva. La operación no está en el ruido — está en la reacción alrededor de los niveles marcados. ⏳ Paciencia. Deja que primero aparezca el rompimiento o el rechazo. No hace falta perseguir la primera vela. $ETH #ETH análisis de precio
⚡ $ETH 1H: LA PRESIÓN DE LA CUÑA SE ESTÁ ACUMULANDO ⚠️ Ethereum está a punto de decidir cerca de una zona crítica. El gráfico se está apretando, y justo aquí es donde normalmente empiezan a formarse las trampas de liquidez. 📍 Estructura actual: el precio está reaccionando alrededor de la base local más reciente. Los compradores aún tienen soporte, pero el movimiento necesita confirmación antes de llamarlo limpio. 🔺 Lectura del patrón: la compresión se está formando en 1H. Las cuñas pequeñas dentro de una estructura mayor pueden provocar un falso rompimiento brusco antes del movimiento real. 🔑 Resistencia a vigilar: el clúster marcado más cercano es la primera prueba. Un barrido rápido por encima puede atrapar a los compradores tardíos si el volumen no acompaña. 🛡️ Soporte por debajo: si la zona defendida sigue manteniéndose, la presión alcista puede acumularse. Si se rompe, el mercado puede buscar rápidamente el bolsillo de liquidez más profundo. 🎯 Plan principal: espera a que la cuña se resuelva. La operación no está en el ruido — está en la reacción alrededor de los niveles marcados. ⏳ Paciencia. Deja que primero aparezca el rompimiento o el rechazo. No hace falta perseguir la primera vela. $ETH #ETH análisis de precio
63
·
--
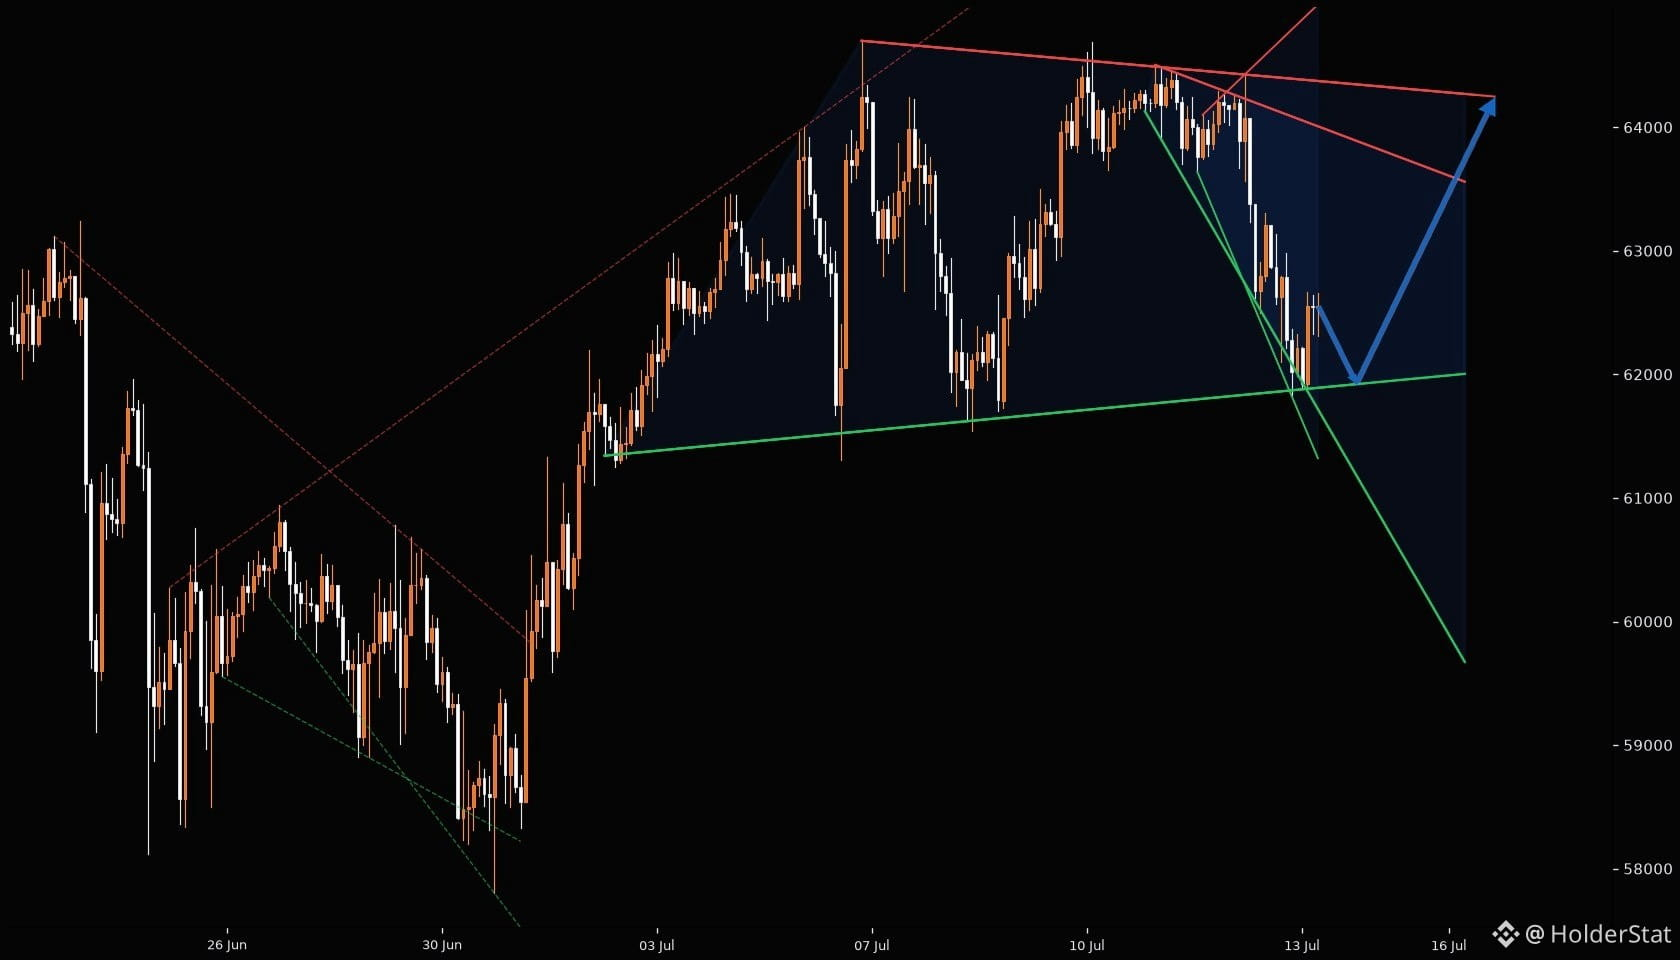
⚡ $BTC 1H: LA PRESIÓN DEL WEDGE SE ESTÁ ACUMULANDO ⚠️ Bitcoin se está enroscando cerca de una zona de decisión. El gráfico se está estrechando y esta es exactamente la zona donde normalmente comienzan a formarse trampas de liquidez. 📍 Estructura actual: el precio reacciona alrededor de la base local más reciente. Los compradores aún tienen soporte, pero el movimiento necesita confirmación antes de llamarlo limpio. 🔺 Lectura del patrón: la compresión se está formando en 1H. Pequeños wedges dentro de una estructura mayor pueden provocar un falso desvío brusco antes del movimiento real. 🔑 Resistencia a vigilar: el clúster marcado más cercano es la primera prueba. Un barrido rápido por encima puede atrapar a compradores tardíos si no acompaña el volumen. 🛡️ Soporte por debajo: si la zona defendida sigue manteniéndose, la presión alcista puede aumentar. Si se rompe, el mercado puede buscar rápidamente el bolsillo de liquidez más profundo. 🎯 Plan principal: espera a que el wedge se resuelva. La operación no está en el ruido: está en la reacción alrededor de los niveles marcados. ⏳ Paciencia. Deja que primero se imprima la ruptura o el rechazo. No hace falta perseguir la primera vela. $BTC $BTC análisis de precio
⚡ $BTC 1H: LA PRESIÓN DEL WEDGE SE ESTÁ ACUMULANDO ⚠️ Bitcoin se está enroscando cerca de una zona de decisión. El gráfico se está estrechando y esta es exactamente la zona donde normalmente comienzan a formarse trampas de liquidez. 📍 Estructura actual: el precio reacciona alrededor de la base local más reciente. Los compradores aún tienen soporte, pero el movimiento necesita confirmación antes de llamarlo limpio. 🔺 Lectura del patrón: la compresión se está formando en 1H. Pequeños wedges dentro de una estructura mayor pueden provocar un falso desvío brusco antes del movimiento real. 🔑 Resistencia a vigilar: el clúster marcado más cercano es la primera prueba. Un barrido rápido por encima puede atrapar a compradores tardíos si no acompaña el volumen. 🛡️ Soporte por debajo: si la zona defendida sigue manteniéndose, la presión alcista puede aumentar. Si se rompe, el mercado puede buscar rápidamente el bolsillo de liquidez más profundo. 🎯 Plan principal: espera a que el wedge se resuelva. La operación no está en el ruido: está en la reacción alrededor de los niveles marcados. ⏳ Paciencia. Deja que primero se imprima la ruptura o el rechazo. No hace falta perseguir la primera vela. $BTC $BTC análisis de precio
60
·
--
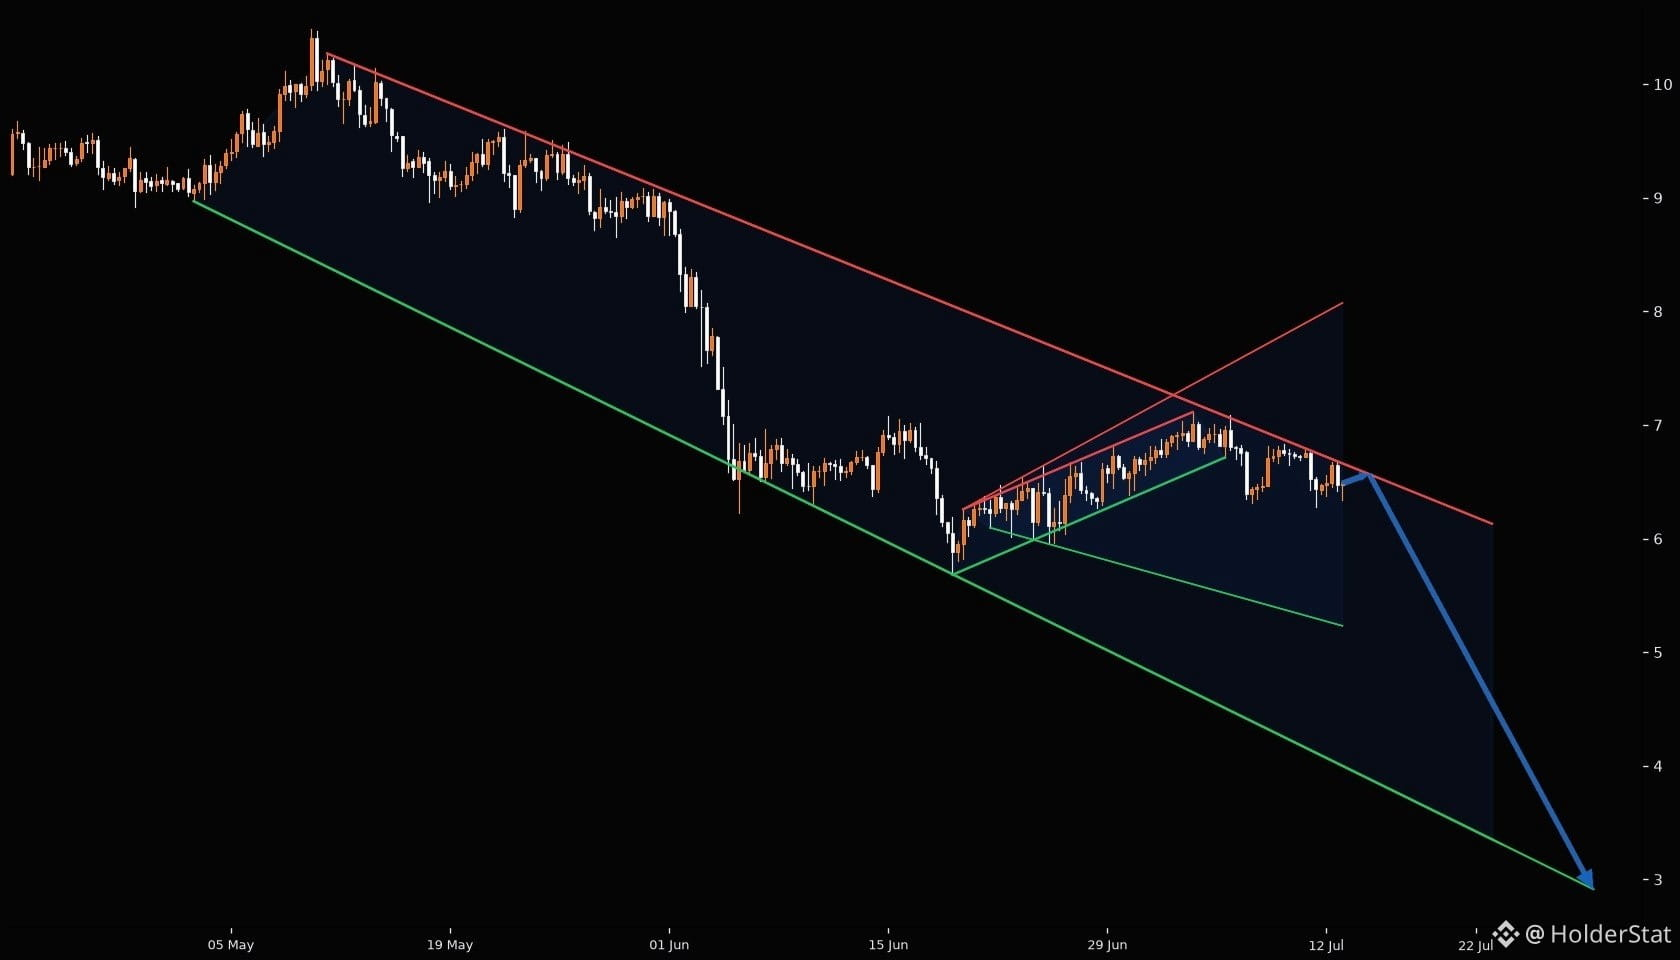
⚡ $AVAX 4H: LA PRESIÓN DEL WEDGE SE ESTÁ ACUMULANDO ⚠️ Avalanche se está arremolinando cerca de una zona de decisión. El gráfico se está ajustando, y este es exactamente el punto donde normalmente empiezan a formarse trampas de liquidez. 📍 Estructura actual: el precio está reaccionando alrededor de la base local más reciente. Los compradores aún tienen soporte, pero el movimiento necesita confirmación antes de llamarlo limpio. 🔺 Lectura del patrón: la compresión se está acumulando en 4H. Las cuñas pequeñas dentro de una estructura más grande pueden provocar un fakeout brusco antes del movimiento real. 🔑 Resistencia a vigilar: el clúster marcado más cercano es la primera prueba. Un barrido rápido por encima puede atrapar a compradores tardíos si el volumen no acompaña. 🛡️ Soporte por debajo: si la zona defendida sigue aguantando, la presión alcista puede aumentar. Si se rompe, el mercado podría buscar rápidamente el bolsillo de liquidez más profundo. 🎯 Plan principal: espera a que la cuña se resuelva. La operación no está en el ruido: está en la reacción alrededor de los niveles marcados. ⏳ Paciencia. Deja que primero se imprima la ruptura o el rechazo. No hace falta perseguir la primera vela. $AVAX #AVAX análisis de precio
⚡ $AVAX 4H: LA PRESIÓN DEL WEDGE SE ESTÁ ACUMULANDO ⚠️ Avalanche se está arremolinando cerca de una zona de decisión. El gráfico se está ajustando, y este es exactamente el punto donde normalmente empiezan a formarse trampas de liquidez. 📍 Estructura actual: el precio está reaccionando alrededor de la base local más reciente. Los compradores aún tienen soporte, pero el movimiento necesita confirmación antes de llamarlo limpio. 🔺 Lectura del patrón: la compresión se está acumulando en 4H. Las cuñas pequeñas dentro de una estructura más grande pueden provocar un fakeout brusco antes del movimiento real. 🔑 Resistencia a vigilar: el clúster marcado más cercano es la primera prueba. Un barrido rápido por encima puede atrapar a compradores tardíos si el volumen no acompaña. 🛡️ Soporte por debajo: si la zona defendida sigue aguantando, la presión alcista puede aumentar. Si se rompe, el mercado podría buscar rápidamente el bolsillo de liquidez más profundo. 🎯 Plan principal: espera a que la cuña se resuelva. La operación no está en el ruido: está en la reacción alrededor de los niveles marcados. ⏳ Paciencia. Deja que primero se imprima la ruptura o el rechazo. No hace falta perseguir la primera vela. $AVAX #AVAX análisis de precio
71
·
--
⚡ $BTC 1H: SE ESTÁ ACUMULANDO PRESIÓN EN FORMA DE CUÑA ⚠️ Bitcoin se está arrollando cerca de una zona de decisión. El gráfico se está estrechando, y justo aquí es donde normalmente empiezan a formarse trampas de liquidez. 📍 Estructura actual: el precio está reaccionando alrededor de la base local más reciente. Los compradores aún tienen soporte, pero el movimiento necesita confirmación antes de considerarlo limpio. 🔺 Lectura del patrón: la compresión se está formando en 1H. Pequeñas cuñas dentro de una estructura mayor pueden provocar un falso movimiento brusco antes del movimiento real. 🔑 Resistencia a vigilar: el clúster más cercano marcado es la primera prueba. Un barrido rápido por encima puede atrapar a compradores tardíos si no acompaña el volumen. 🛡️ Soporte por debajo: si la zona defendida mantiene el control, la presión alcista puede aumentar. Si se rompe, el mercado podría buscar rápidamente el bolsillo de liquidez más profundo. 🎯 Plan principal: espera a que la cuña se resuelva. La operación no está en el ruido: está en la reacción alrededor de los niveles marcados. ⏳ Paciencia. Deja que primero se imprima la ruptura o el rechazo. No hace falta perseguir la primera vela. $BTC #BTC análisis de precio
⚡ $BTC 1H: SE ESTÁ ACUMULANDO PRESIÓN EN FORMA DE CUÑA ⚠️ Bitcoin se está arrollando cerca de una zona de decisión. El gráfico se está estrechando, y justo aquí es donde normalmente empiezan a formarse trampas de liquidez. 📍 Estructura actual: el precio está reaccionando alrededor de la base local más reciente. Los compradores aún tienen soporte, pero el movimiento necesita confirmación antes de considerarlo limpio. 🔺 Lectura del patrón: la compresión se está formando en 1H. Pequeñas cuñas dentro de una estructura mayor pueden provocar un falso movimiento brusco antes del movimiento real. 🔑 Resistencia a vigilar: el clúster más cercano marcado es la primera prueba. Un barrido rápido por encima puede atrapar a compradores tardíos si no acompaña el volumen. 🛡️ Soporte por debajo: si la zona defendida mantiene el control, la presión alcista puede aumentar. Si se rompe, el mercado podría buscar rápidamente el bolsillo de liquidez más profundo. 🎯 Plan principal: espera a que la cuña se resuelva. La operación no está en el ruido: está en la reacción alrededor de los niveles marcados. ⏳ Paciencia. Deja que primero se imprima la ruptura o el rechazo. No hace falta perseguir la primera vela. $BTC #BTC análisis de precio
45
·
--
$AVAX 4H: LA PRESIÓN DEL WEDGE ESTÁ EN CONSTRUCCIÓN ⚠️ Avalanche se está compactando cerca de una zona de decisión. El gráfico se está ajustando, y este es exactamente el punto donde normalmente empiezan a formarse trampas de liquidez. 📍 Estructura actual: el precio está reaccionando alrededor de la base local más reciente. Los compradores aún tienen soporte, pero el movimiento necesita confirmación antes de considerarlo limpio. 🔺 Lectura del patrón: la compresión está aumentando en 4H. Pequeños wedges dentro de una estructura mayor pueden provocar un falso avance brusco antes del movimiento real. 🔑 Resistencia a vigilar: el clúster marcado más cercano es la primera prueba. Un barrido rápido por encima puede atrapar a los compradores tardíos si el volumen no acompaña. 🛡️ Soporte por debajo: si la zona defendida sigue manteniéndose, la presión alcista puede aumentar. Si se rompe, el mercado podría buscar rápidamente el bolsillo de liquidez más profundo. 🎯 Plan principal: esperar a que el wedge se resuelva. La operación no está en el ruido: está en la reacción alrededor de los niveles marcados. ⏳ Paciencia. Deja que primero se imprima el rompimiento o el rechazo. No hace falta perseguir la primera vela. $AVAX #AVAX análisis de precio
$AVAX 4H: LA PRESIÓN DEL WEDGE ESTÁ EN CONSTRUCCIÓN ⚠️ Avalanche se está compactando cerca de una zona de decisión. El gráfico se está ajustando, y este es exactamente el punto donde normalmente empiezan a formarse trampas de liquidez. 📍 Estructura actual: el precio está reaccionando alrededor de la base local más reciente. Los compradores aún tienen soporte, pero el movimiento necesita confirmación antes de considerarlo limpio. 🔺 Lectura del patrón: la compresión está aumentando en 4H. Pequeños wedges dentro de una estructura mayor pueden provocar un falso avance brusco antes del movimiento real. 🔑 Resistencia a vigilar: el clúster marcado más cercano es la primera prueba. Un barrido rápido por encima puede atrapar a los compradores tardíos si el volumen no acompaña. 🛡️ Soporte por debajo: si la zona defendida sigue manteniéndose, la presión alcista puede aumentar. Si se rompe, el mercado podría buscar rápidamente el bolsillo de liquidez más profundo. 🎯 Plan principal: esperar a que el wedge se resuelva. La operación no está en el ruido: está en la reacción alrededor de los niveles marcados. ⏳ Paciencia. Deja que primero se imprima el rompimiento o el rechazo. No hace falta perseguir la primera vela. $AVAX #AVAX análisis de precio
58
·
--
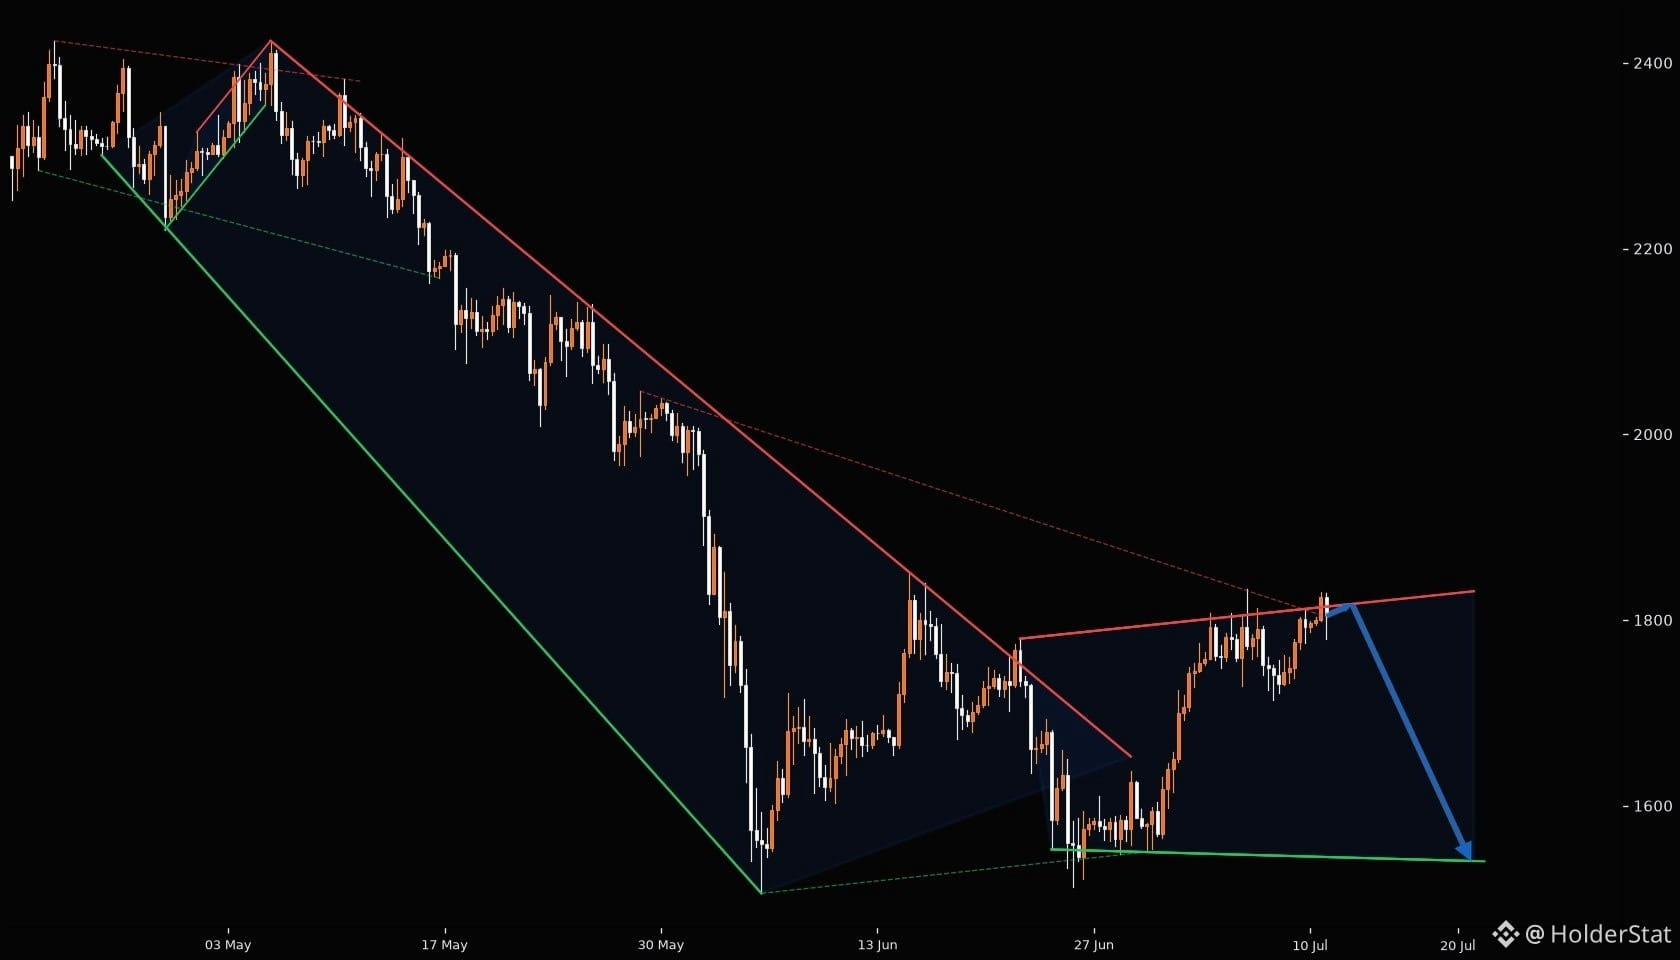
⚡ $ETH 4H: LA PRESIÓN DE LA CUÑA SE ESTÁ ACUMULANDO ⚠️ Ethereum se está ajustando cerca de una zona de decisión. El gráfico se está comprimiendo, y este es exactamente el punto donde normalmente empiezan a formarse trampas de liquidez. 📍 Estructura actual: el precio está reaccionando alrededor de la base local más reciente. Los compradores aún tienen soporte, pero el movimiento necesita confirmación antes de considerarlo limpio. 🔺 Lectura del patrón: la compresión se está formando en 4H. Las cuñas pequeñas dentro de una estructura mayor pueden provocar un falso avance brusco antes del movimiento real. 🔑 Resistencia a vigilar: el clúster marcado más cercano es la primera prueba. Un barrido rápido por encima puede atrapar a los compradores tardíos si el volumen no acompaña. 🛡️ Soporte por debajo: si la zona defendida sigue manteniéndose, la presión alcista puede aumentar. Si se rompe, el mercado podría buscar rápidamente el bolsillo de liquidez más profundo. 🎯 Plan principal: esperar a que la cuña se resuelva. La operación no está en el ruido; está en la reacción alrededor de los niveles marcados. ⏳ Paciencia. Primero deja que se imprima la ruptura o el rechazo. No hace falta perseguir la primera vela. $ETH #ETH price analysis
⚡ $ETH 4H: LA PRESIÓN DE LA CUÑA SE ESTÁ ACUMULANDO ⚠️ Ethereum se está ajustando cerca de una zona de decisión. El gráfico se está comprimiendo, y este es exactamente el punto donde normalmente empiezan a formarse trampas de liquidez. 📍 Estructura actual: el precio está reaccionando alrededor de la base local más reciente. Los compradores aún tienen soporte, pero el movimiento necesita confirmación antes de considerarlo limpio. 🔺 Lectura del patrón: la compresión se está formando en 4H. Las cuñas pequeñas dentro de una estructura mayor pueden provocar un falso avance brusco antes del movimiento real. 🔑 Resistencia a vigilar: el clúster marcado más cercano es la primera prueba. Un barrido rápido por encima puede atrapar a los compradores tardíos si el volumen no acompaña. 🛡️ Soporte por debajo: si la zona defendida sigue manteniéndose, la presión alcista puede aumentar. Si se rompe, el mercado podría buscar rápidamente el bolsillo de liquidez más profundo. 🎯 Plan principal: esperar a que la cuña se resuelva. La operación no está en el ruido; está en la reacción alrededor de los niveles marcados. ⏳ Paciencia. Primero deja que se imprima la ruptura o el rechazo. No hace falta perseguir la primera vela. $ETH #ETH price analysis
71
·
--
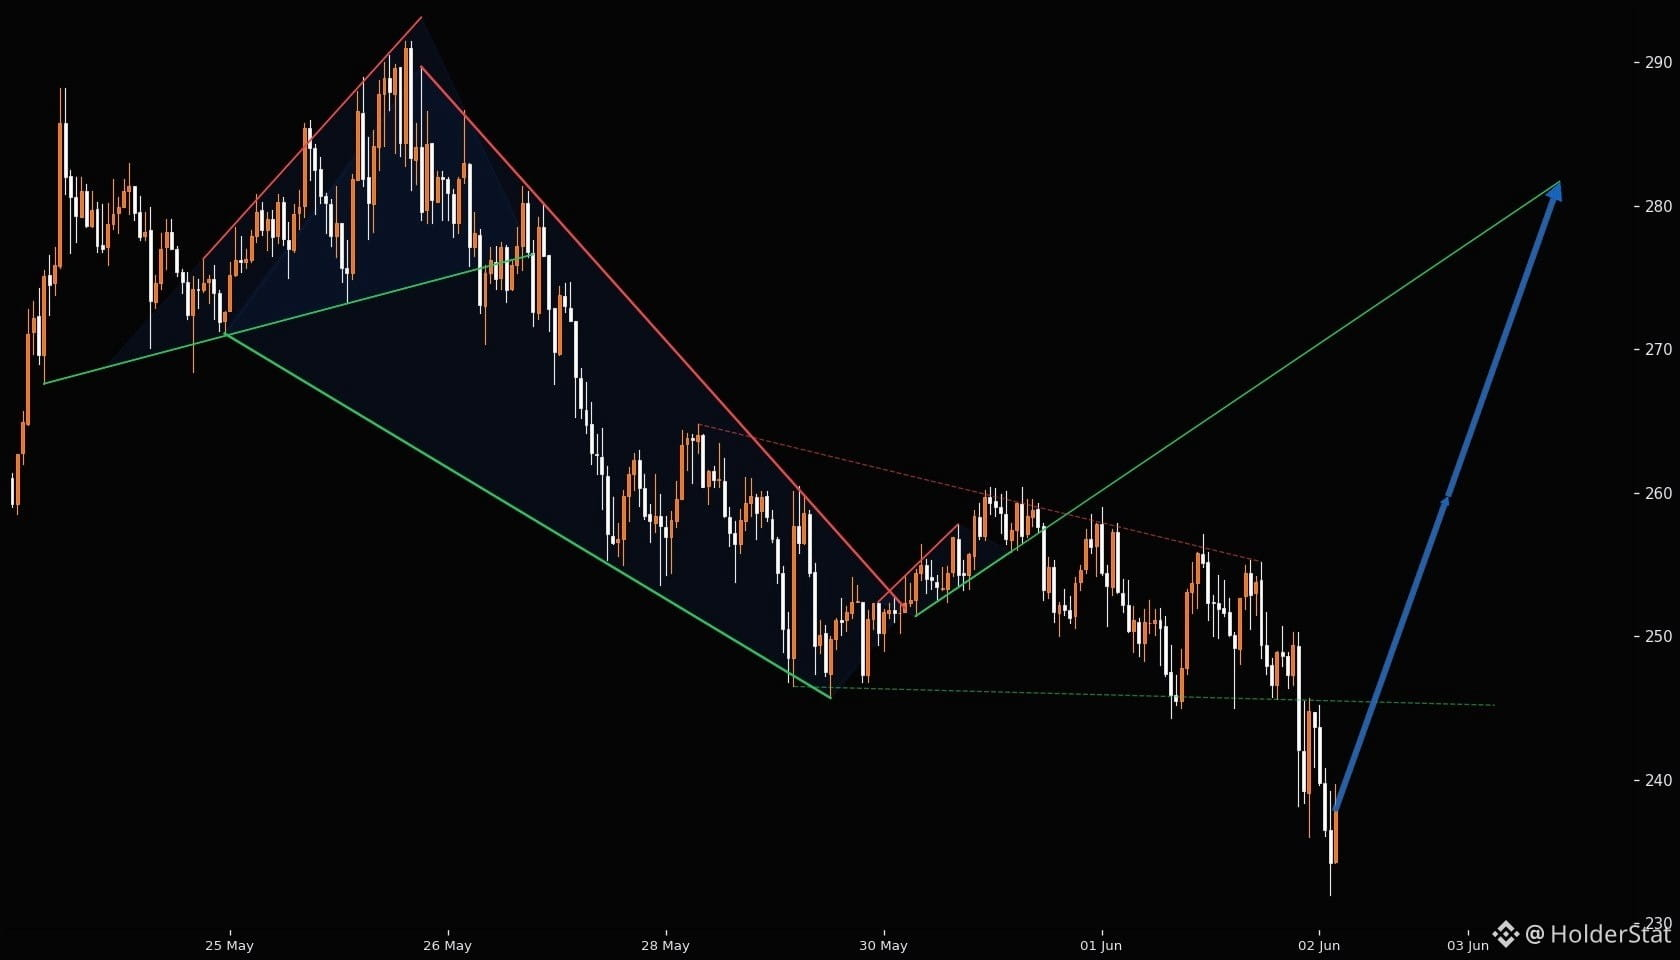
Revisión de Estructura: Donde el Mercado Está Defendiendo $TAO en 1h está dando una lectura de estructura-principal. La idea principal no es perseguir la última vela, sino entender dónde el mercado ya ha mostrado defensa. Veo 17 líneas de soporte contra 12 líneas de resistencia, con 17 áreas de soporte y 12 áreas de resistencia lo suficientemente fuertes como para pasar el filtro de pivote. Para el estilo de HolderStat, la parte importante es la base: si el precio sigue respetando la zona defendida, los compradores aún tienen un lugar para recargar. Si esa base se rompe, el mismo nivel puede convertirse rápidamente en presión. Hay 3 zonas de patrones visibles, así que el gráfico no es un ruido aleatorio; es un mapa de dónde es probable que la liquidez esté esperando. Lectura actual: el soporte controla la estructura actual. Observa la próxima reacción cerca de la línea más cercana antes de llamar al movimiento. ✅Más análisis aquí: t.me/holderstat $TAO #Bittensor #Análisis de Precio de TAO#
Revisión de Estructura: Donde el Mercado Está Defendiendo $TAO en 1h está dando una lectura de estructura-principal. La idea principal no es perseguir la última vela, sino entender dónde el mercado ya ha mostrado defensa. Veo 17 líneas de soporte contra 12 líneas de resistencia, con 17 áreas de soporte y 12 áreas de resistencia lo suficientemente fuertes como para pasar el filtro de pivote. Para el estilo de HolderStat, la parte importante es la base: si el precio sigue respetando la zona defendida, los compradores aún tienen un lugar para recargar. Si esa base se rompe, el mismo nivel puede convertirse rápidamente en presión. Hay 3 zonas de patrones visibles, así que el gráfico no es un ruido aleatorio; es un mapa de dónde es probable que la liquidez esté esperando. Lectura actual: el soporte controla la estructura actual. Observa la próxima reacción cerca de la línea más cercana antes de llamar al movimiento. ✅Más análisis aquí: t.me/holderstat $TAO #Bittensor #Análisis de Precio de TAO#
·
--
Mapa de Holders de $SUI: El soporte está contando la historia. $SUI en 30m está dando una lectura basada en la estructura. La idea principal es no perseguir la última vela, sino entender dónde el mercado ya ha mostrado defensa. Veo 17 líneas de soporte contra 13 líneas de resistencia, con 17 áreas de soporte y 13 áreas de resistencia lo suficientemente fuertes como para pasar el filtro de pivote. Para el estilo de HolderStat, la parte importante es la base: si el precio sigue respetando la zona defendida, los compradores aún tienen un lugar para recargar. Si esa base se rompe, el mismo nivel puede convertirse rápidamente en presión. Hay 2 zonas de patrones visibles, así que el gráfico no es ruido aleatorio; es un mapa de dónde es probable que la liquidez esté esperando. Lectura actual: el soporte controla la estructura actual. Observa la próxima reacción cerca de la línea más cercana antes de llamar al movimiento. ✅Más análisis aquí: t.me/holderstat $SUI #Sui #Análisis de Precio de $SUI
Mapa de Holders de $SUI: El soporte está contando la historia. $SUI en 30m está dando una lectura basada en la estructura. La idea principal es no perseguir la última vela, sino entender dónde el mercado ya ha mostrado defensa. Veo 17 líneas de soporte contra 13 líneas de resistencia, con 17 áreas de soporte y 13 áreas de resistencia lo suficientemente fuertes como para pasar el filtro de pivote. Para el estilo de HolderStat, la parte importante es la base: si el precio sigue respetando la zona defendida, los compradores aún tienen un lugar para recargar. Si esa base se rompe, el mismo nivel puede convertirse rápidamente en presión. Hay 2 zonas de patrones visibles, así que el gráfico no es ruido aleatorio; es un mapa de dónde es probable que la liquidez esté esperando. Lectura actual: el soporte controla la estructura actual. Observa la próxima reacción cerca de la línea más cercana antes de llamar al movimiento. ✅Más análisis aquí: t.me/holderstat $SUI #Sui #Análisis de Precio de $SUI
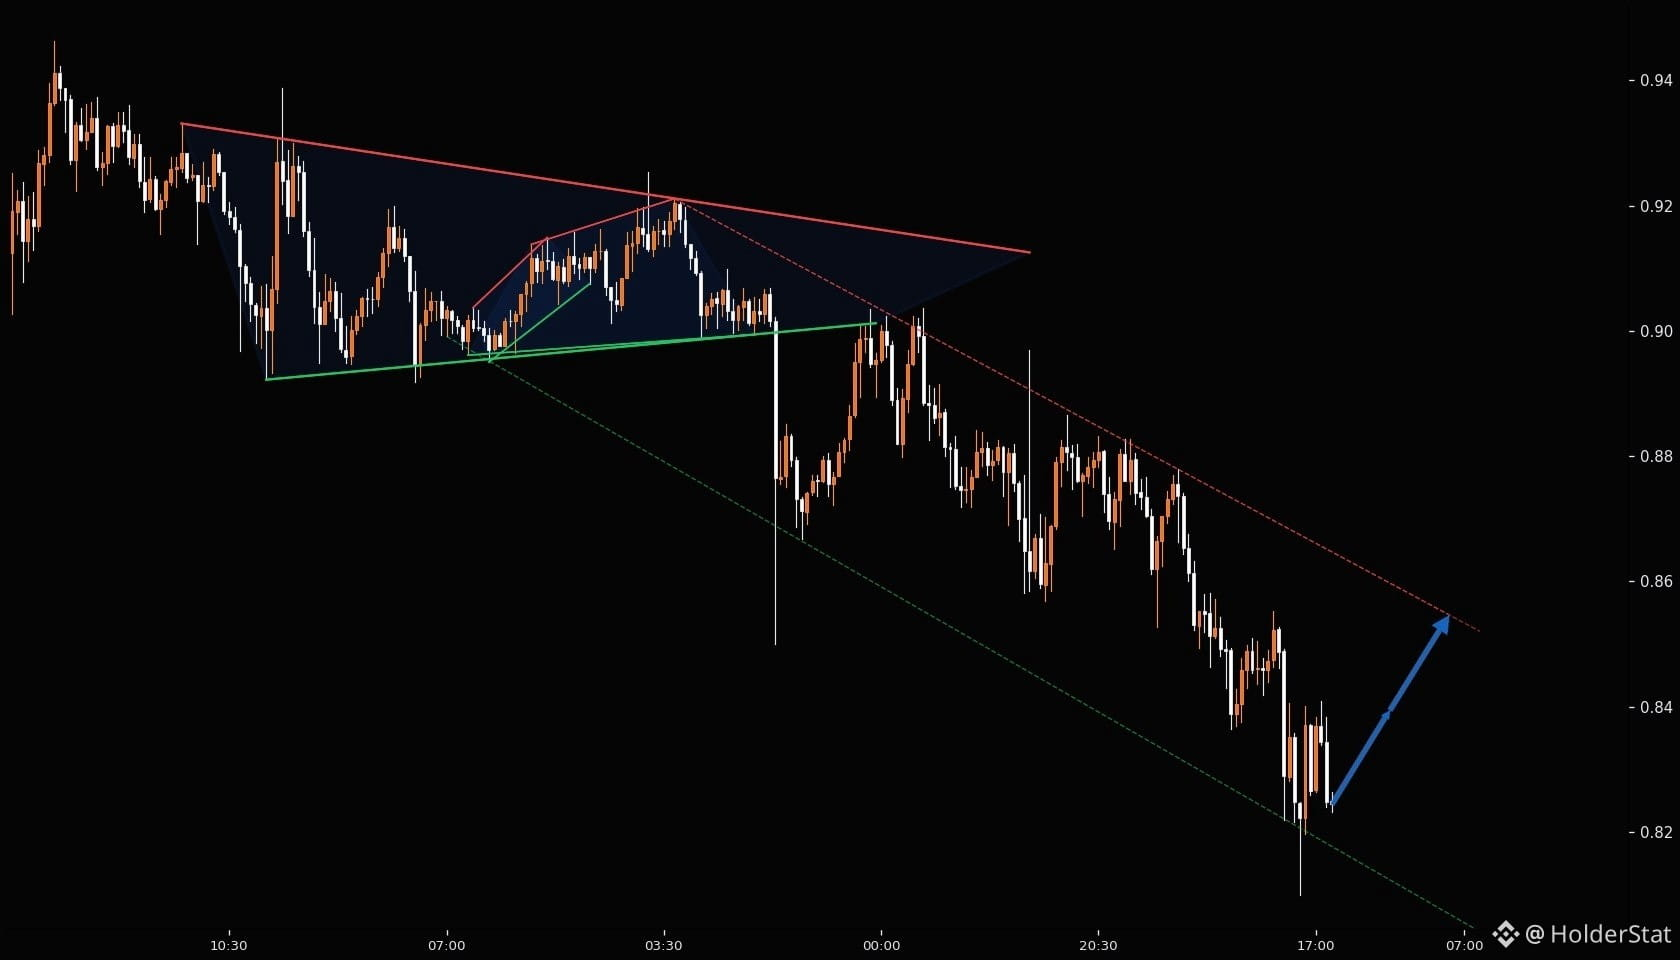
·
--
$TRX Base Watch: El Nivel Que Importa Ahora $TRX en 8h está dando una lectura de estructura inicial. La idea principal es no perseguir la última vela, sino entender dónde el mercado ya ha mostrado defensa. Veo 12 líneas de soporte contra 15 líneas de resistencia, con 12 áreas de soporte y 15 áreas de resistencia lo suficientemente fuertes como para pasar el filtro de pivote. Para el estilo HolderStat, la parte importante es la base: si el precio sigue respetando la zona defendida, los compradores todavía tienen un lugar para recargar. Si esa base se rompe, el mismo nivel puede convertirse rápidamente en presión. Hay 1 zonas de patrón visibles, así que el gráfico no es ruido aleatorio; es un mapa de dónde la liquidez probablemente está esperando. Lectura actual: la resistencia es la principal zona de presión. Observa la próxima reacción cerca de la línea más cercana antes de llamar el movimiento. ✅Más análisis aquí: t.me/holderstat #TRX #TRON #Análisis de Precio TRX#
$TRX Base Watch: El Nivel Que Importa Ahora $TRX en 8h está dando una lectura de estructura inicial. La idea principal es no perseguir la última vela, sino entender dónde el mercado ya ha mostrado defensa. Veo 12 líneas de soporte contra 15 líneas de resistencia, con 12 áreas de soporte y 15 áreas de resistencia lo suficientemente fuertes como para pasar el filtro de pivote. Para el estilo HolderStat, la parte importante es la base: si el precio sigue respetando la zona defendida, los compradores todavía tienen un lugar para recargar. Si esa base se rompe, el mismo nivel puede convertirse rápidamente en presión. Hay 1 zonas de patrón visibles, así que el gráfico no es ruido aleatorio; es un mapa de dónde la liquidez probablemente está esperando. Lectura actual: la resistencia es la principal zona de presión. Observa la próxima reacción cerca de la línea más cercana antes de llamar el movimiento. ✅Más análisis aquí: t.me/holderstat #TRX #TRON #Análisis de Precio TRX#
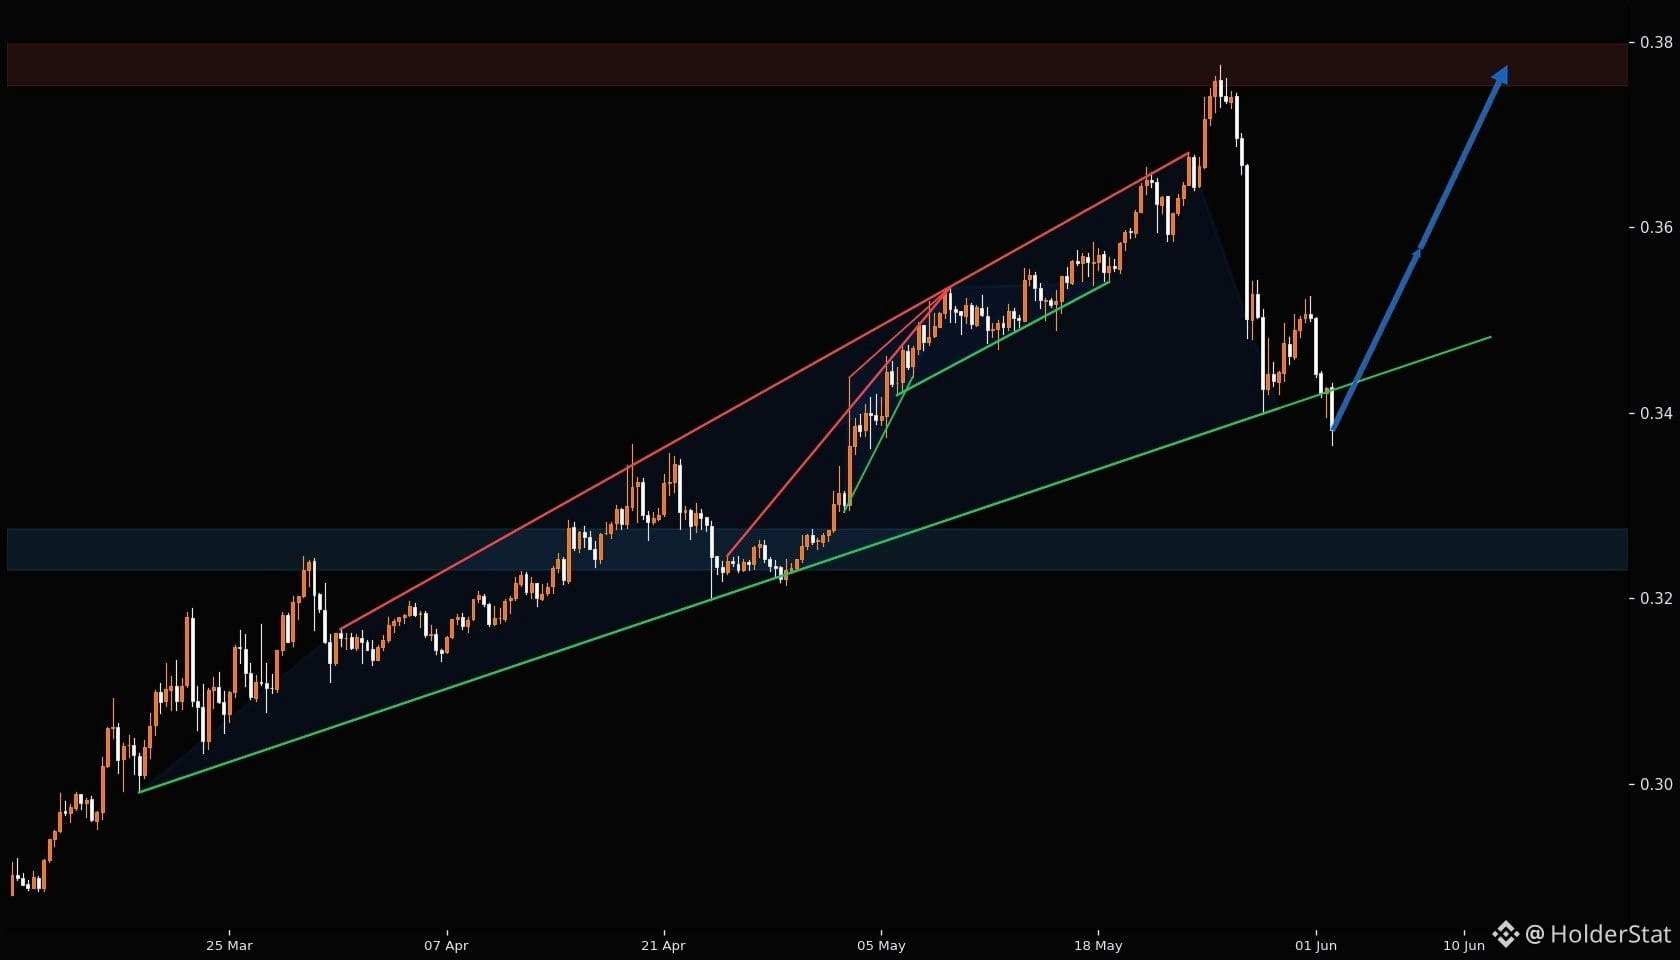
71
·
--
$BCH Mapa de Holders: El Soporte Está Contando la Historia $BCH en 2h está dando una lectura de estructura-principal. La idea clave es no perseguir la última vela, sino entender dónde el mercado ya ha mostrado defensa. Veo 15 líneas de soporte contra 16 líneas de resistencia, con 15 áreas de soporte y 16 áreas de resistencia lo suficientemente fuertes como para pasar el filtro de pivote. Para el estilo de HolderStat, la parte importante es la base: si el precio sigue respetando la zona defendida, los compradores aún tienen un lugar para recargar. Si esa base se rompe, el mismo nivel puede convertirse rápidamente en presión. Hay 2 zonas de patrones visibles, así que el gráfico no es ruido aleatorio; es un mapa de dónde es probable que la liquidez esté esperando. Lectura actual: la resistencia es la principal zona de presión. Observa la próxima reacción cerca de la línea más cercana antes de llamar al movimiento. ✅Más análisis aquí : t.me/holderstat $BCH #BitcoinCash #AnálisisDePrecioBCH
$BCH Mapa de Holders: El Soporte Está Contando la Historia $BCH en 2h está dando una lectura de estructura-principal. La idea clave es no perseguir la última vela, sino entender dónde el mercado ya ha mostrado defensa. Veo 15 líneas de soporte contra 16 líneas de resistencia, con 15 áreas de soporte y 16 áreas de resistencia lo suficientemente fuertes como para pasar el filtro de pivote. Para el estilo de HolderStat, la parte importante es la base: si el precio sigue respetando la zona defendida, los compradores aún tienen un lugar para recargar. Si esa base se rompe, el mismo nivel puede convertirse rápidamente en presión. Hay 2 zonas de patrones visibles, así que el gráfico no es ruido aleatorio; es un mapa de dónde es probable que la liquidez esté esperando. Lectura actual: la resistencia es la principal zona de presión. Observa la próxima reacción cerca de la línea más cercana antes de llamar al movimiento. ✅Más análisis aquí : t.me/holderstat $BCH #BitcoinCash #AnálisisDePrecioBCH
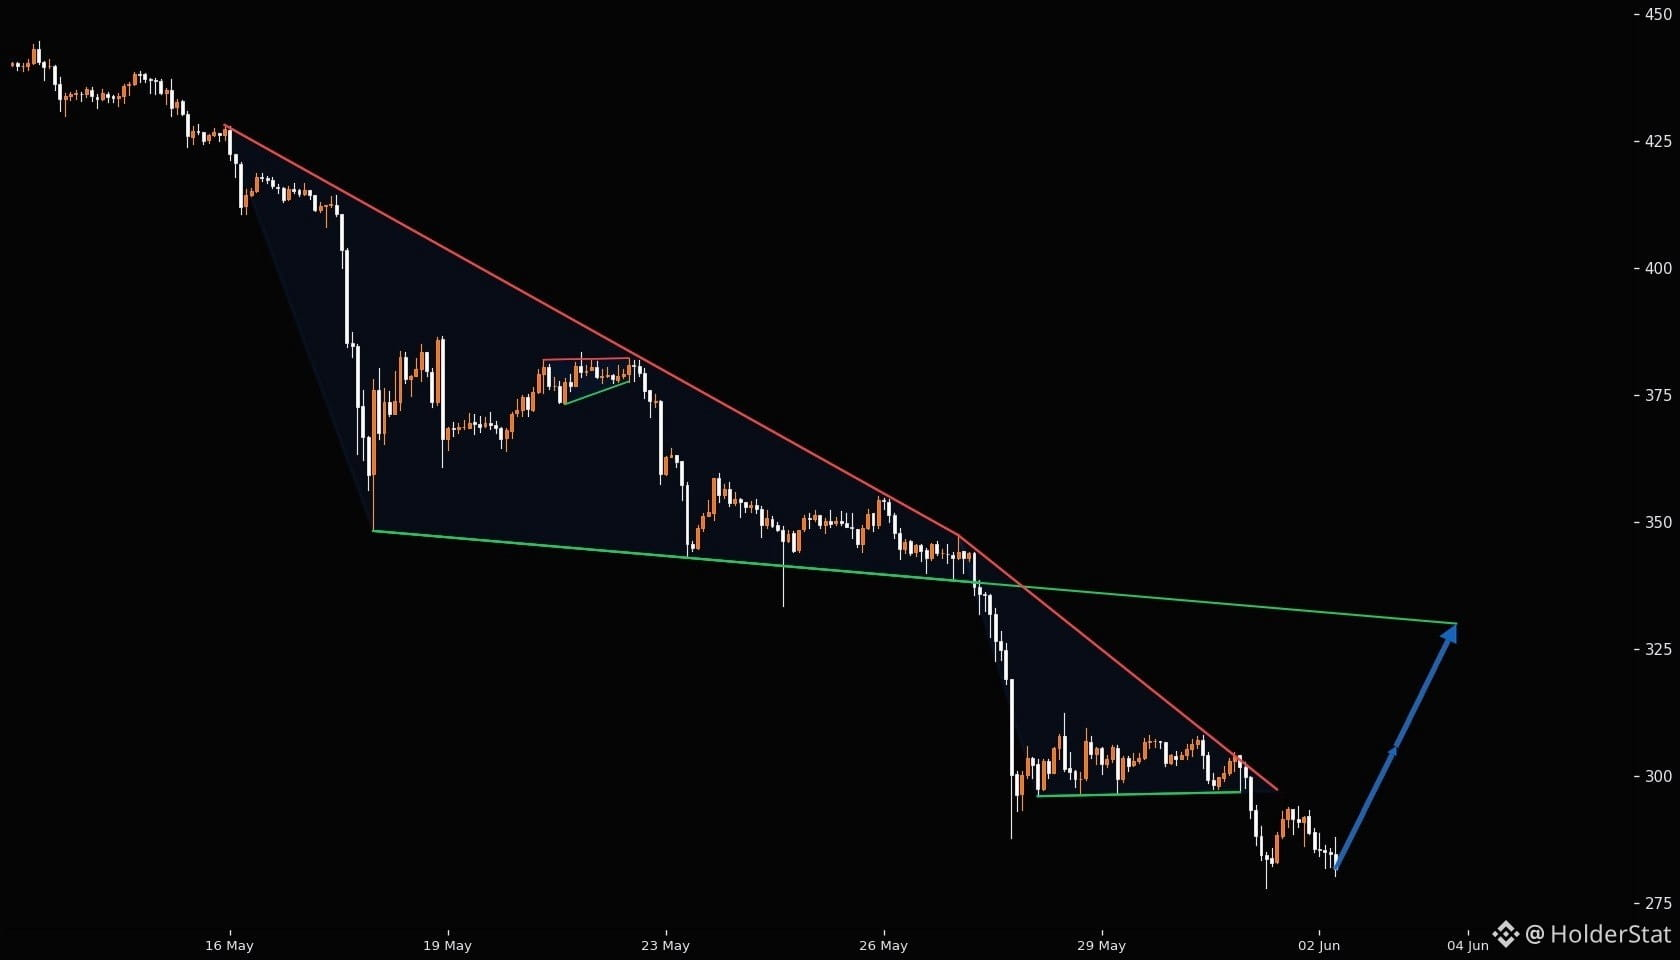
2
·
--
Mapa de Holder de $POL: El soporte está contando la historia. $POL en 1h está dando una lectura estructural-principal. La idea principal es no perseguir la última candela, sino entender dónde el mercado ya ha mostrado defensa. Veo 12 líneas de soporte contra 14 líneas de resistencia, con 12 áreas de soporte y 14 áreas de resistencia lo suficientemente fuertes como para pasar el filtro de pivote. Para el estilo de HolderStat, la parte importante es la base: si el precio sigue respetando la zona defendida, los compradores aún tienen un lugar para recargar. Si esa base se rompe, el mismo nivel puede convertirse rápidamente en presión. Hay 2 zonas de patrones visibles, así que el gráfico no es ruido aleatorio; es un mapa de dónde la liquidez probablemente esté esperando. Lectura actual: la resistencia es la principal zona de presión. Observa la próxima reacción cerca de la línea más cercana antes de llamar el movimiento. ✅Más análisis aquí: t.me/holderstat $POL #Polygon #Análisis de Precio de $POL
Mapa de Holder de $POL: El soporte está contando la historia. $POL en 1h está dando una lectura estructural-principal. La idea principal es no perseguir la última candela, sino entender dónde el mercado ya ha mostrado defensa. Veo 12 líneas de soporte contra 14 líneas de resistencia, con 12 áreas de soporte y 14 áreas de resistencia lo suficientemente fuertes como para pasar el filtro de pivote. Para el estilo de HolderStat, la parte importante es la base: si el precio sigue respetando la zona defendida, los compradores aún tienen un lugar para recargar. Si esa base se rompe, el mismo nivel puede convertirse rápidamente en presión. Hay 2 zonas de patrones visibles, así que el gráfico no es ruido aleatorio; es un mapa de dónde la liquidez probablemente esté esperando. Lectura actual: la resistencia es la principal zona de presión. Observa la próxima reacción cerca de la línea más cercana antes de llamar el movimiento. ✅Más análisis aquí: t.me/holderstat $POL #Polygon #Análisis de Precio de $POL
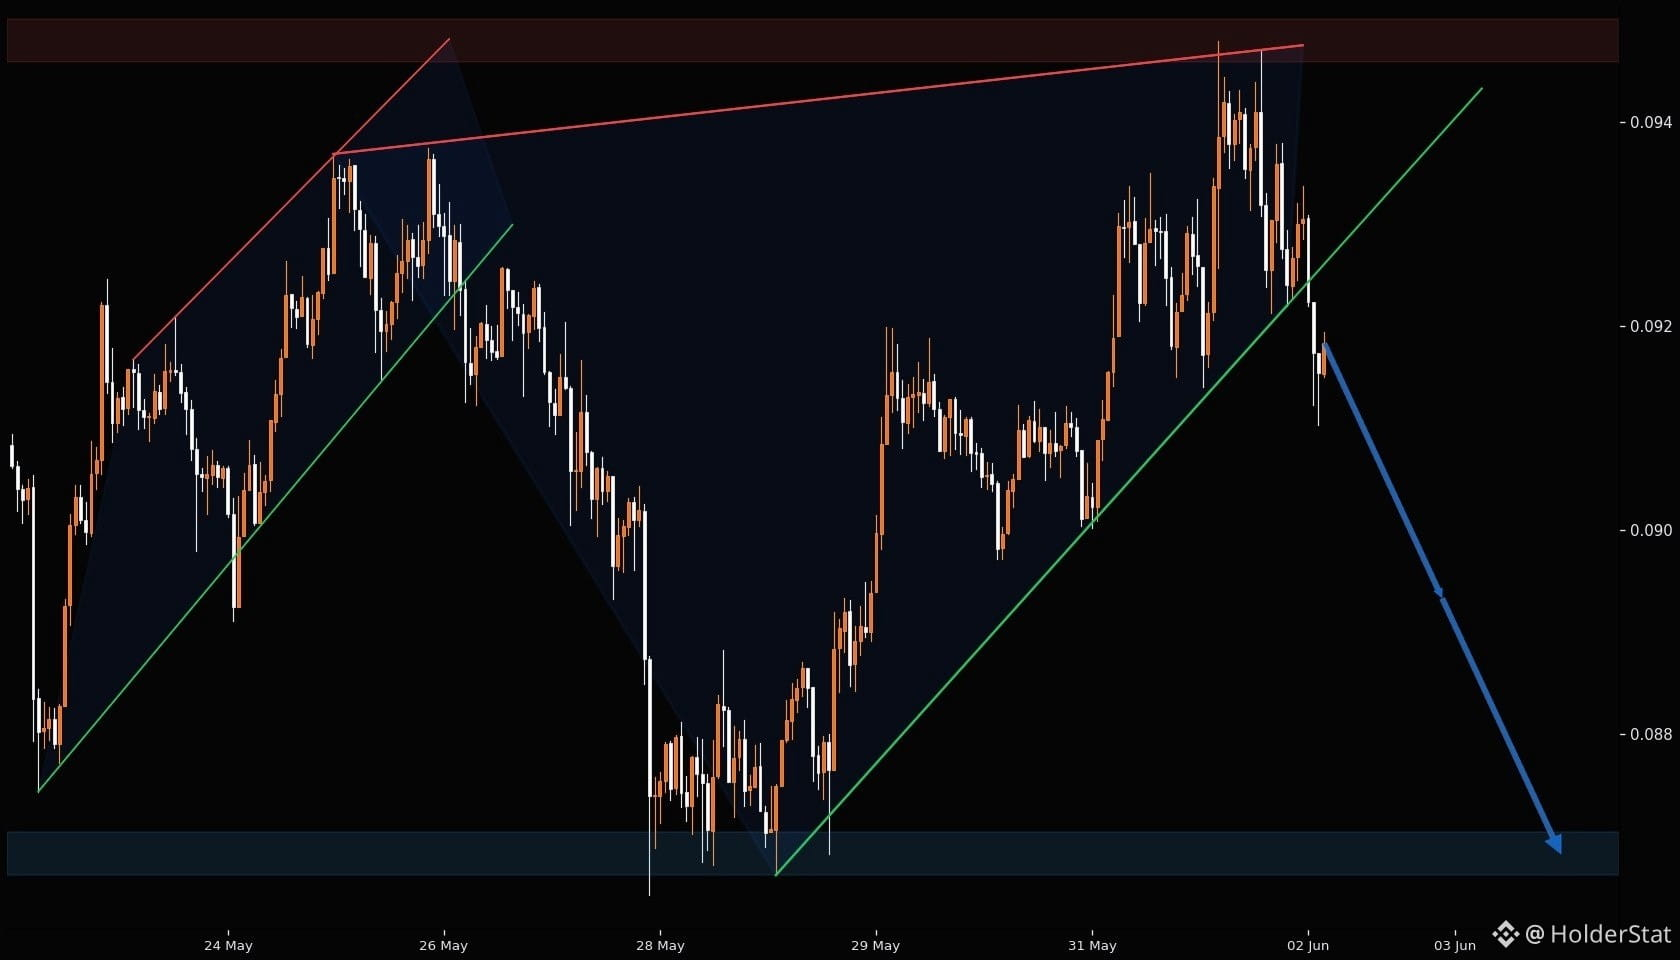
Inicia sesión para explorar más contenidos
Únete a usuarios de criptomonedas de todo el mundo en Binance Square
⚡️ Obtén la información más reciente y útil sobre criptomonedas.
💬 Confía en el mayor exchange de criptomonedas del mundo.
👍 Descubre opiniones reales de creadores verificados.
Correo electrónico/número de teléfono
Temas en tendencia
BitcoinClears$85200
50 visualizaciones
42 participa(n) en el debate
#BitcoinClears$85200
🚨 Bitcoin vuelve a estar por encima de $85,200.
$BTC está cotizando alrededor de la zona de $85K mientras los mercados más amplios reaccionan a nuevos datos económicos de EE. UU.
La franja de $85K–$86K es ahora la zona a vigilar. Los traders buscan confirmación mediante volumen en spot, acción del precio, open interest, funding y flujos de ETF, mientras que la dominancia de BTC sigue siendo otra métrica clave.
Lo importante: un movimiento por encima de un nivel no confirma automáticamente un breakout sostenido. La confirmación de precio + volumen es lo que importa antes de sacar conclusiones más fuertes.
$BTC
| $ARK | $MOVR | $QNT
#Bitcoin #BTC #cryptotrading #CryptoMarket #BinanceSquare
S1R0Z
·0 «Me gusta»
·19 visualizaciones
AltcoinSeasonIndexHoldsAbove60For5Days
2,139 visualizaciones
288 participa(n) en el debate
BitcoinSlipsBelow$84000
1,154 visualizaciones
74 participa(n) en el debate