

Joshua Brown 007
3k Publicaciones

Joshua Brown 007
Denunciar
Bloquear usuario
I am a forward-thinking crypto advisor with a strong grasp of blockchain innovation and digital asset management. @JavedJatt331726
Abrir operación
Trader de alta frecuencia
2.6 años
1.2K+ Siguiendo
15.7K+ Seguidores
6.5K+ Me gusta
Publicaciones
Cartera
Todo
Cotizaciones
Vídeos
Directo
#QNT Short cuero cabelludo
Entrada 272
SL 278
TP 251
TP 233
Condiciones de invalidación:
Configuración corta: Se invalida si el precio cierra por encima de 278 en el gráfico de 15m.
Configuración larga: Se invalida si el precio cae por debajo de 260.
{future}(QNTUSDT)
#QNT Short cuero cabelludo
Entrada 272
SL 278
TP 251
TP 233
Condiciones de invalidación:
Configuración corta: Se invalida si el precio cierra por encima de 278 en el gráfico de 15m.
Configuración larga: Se invalida si el precio cae por debajo de 260.
Entrada 272
SL 278
TP 251
TP 233
Condiciones de invalidación:
Configuración corta: Se invalida si el precio cierra por encima de 278 en el gráfico de 15m.
Configuración larga: Se invalida si el precio cae por debajo de 260.
86
Artículo
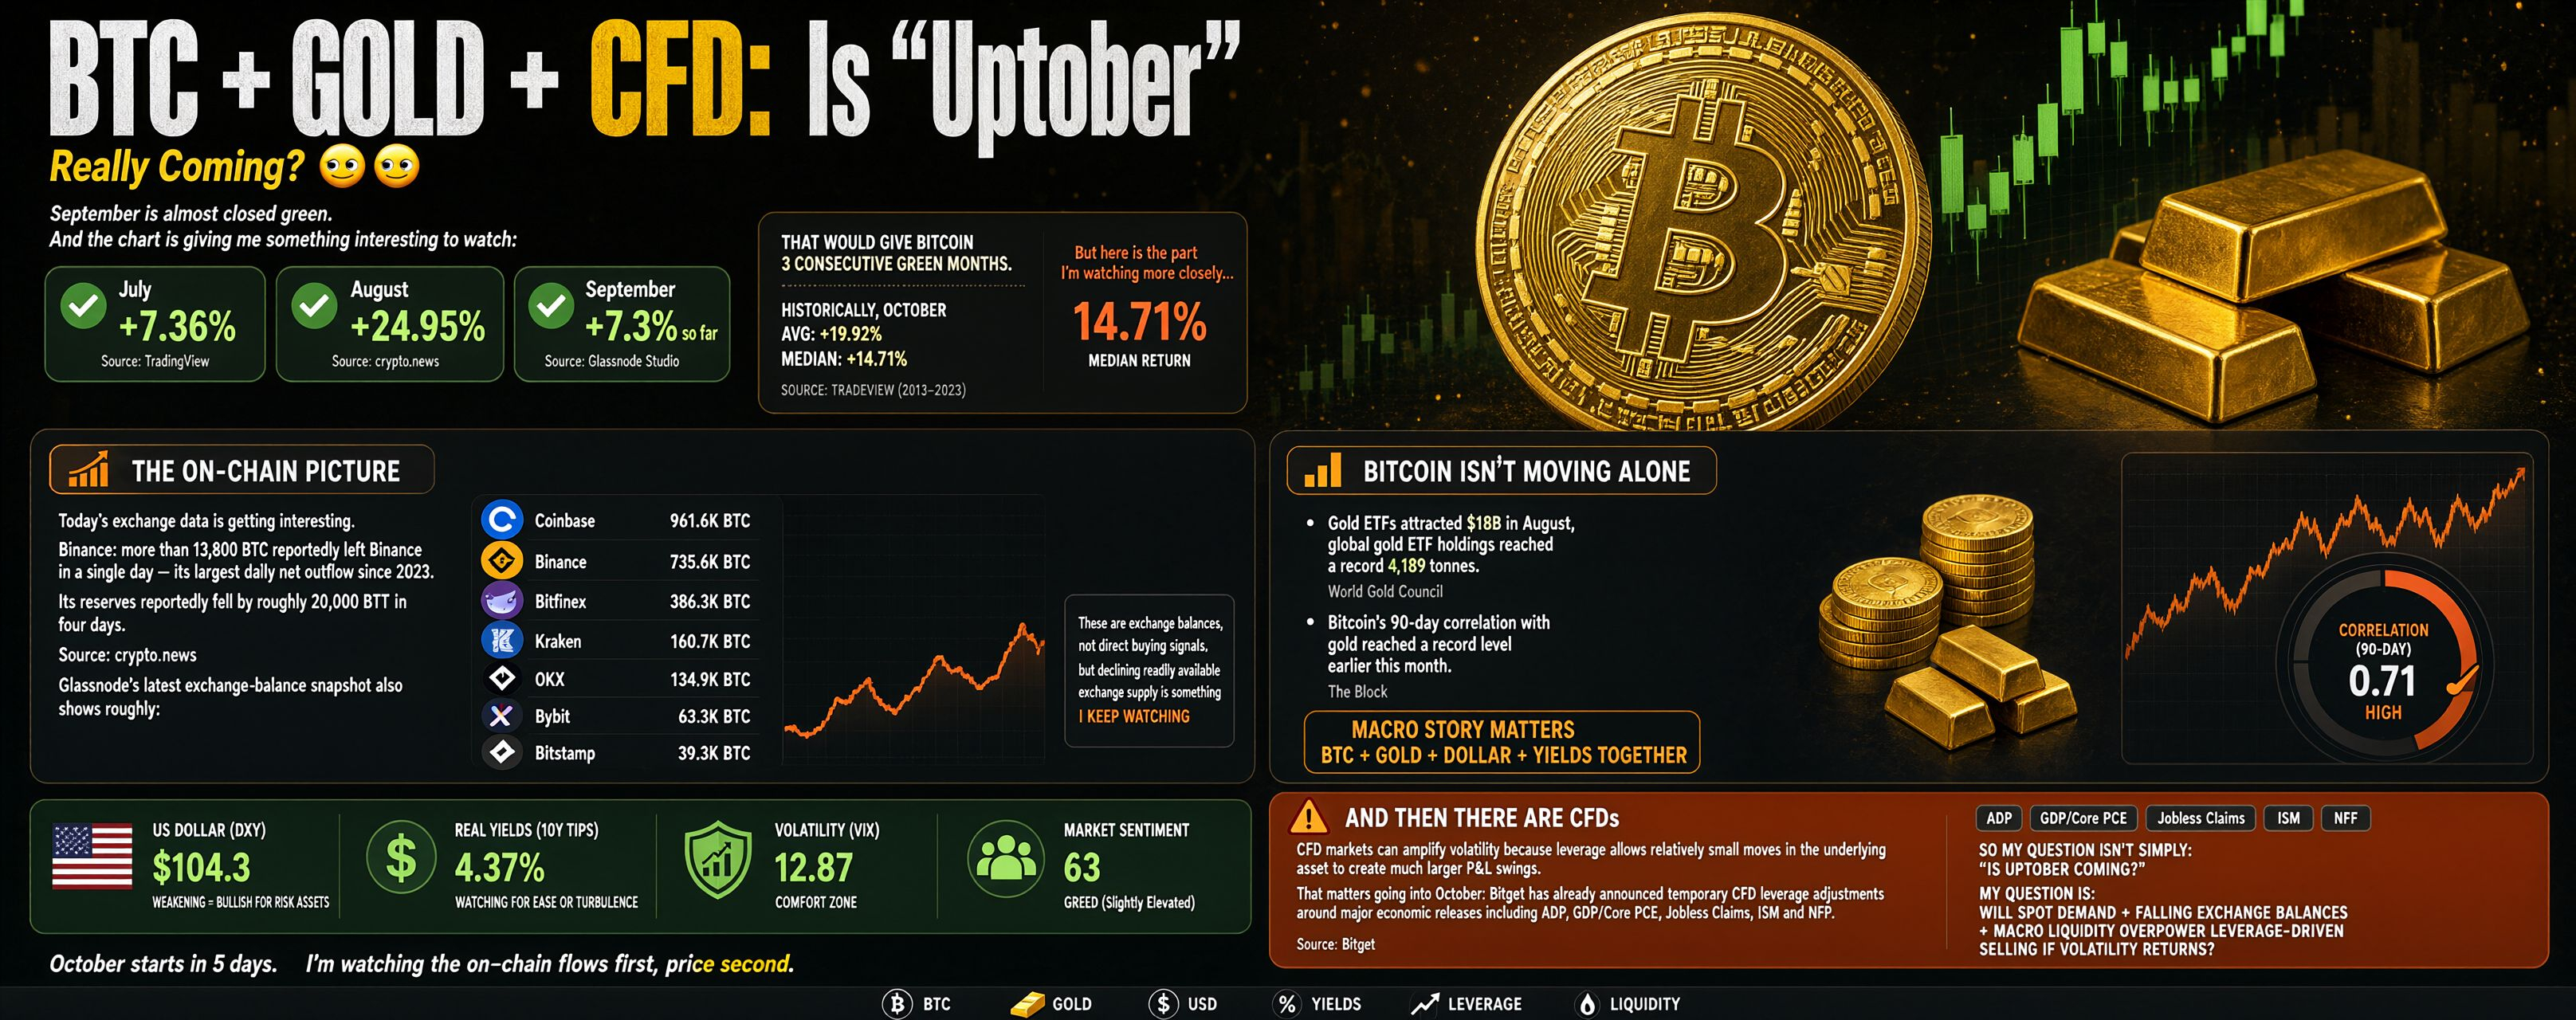
BTC + ORO + CFD: ¿“Uptober” Realmente se Acerca?Septiembre está casi cerrado en verde.
Y la gráfica me está dando algo interesante para observar:
🟢 Julio: +7.36%
🟢 Agosto: +24.95%
🟢 Septiembre: +7.3% hasta ahora
Eso daría a Bitcoin 3 meses verdes consecutivos.
Pero aquí está la parte a la que le presto más atención…
Históricamente, la gráfica muestra que octubre promedia +19.92% con una mediana de +14.71%. Suena alcista, pero la estacionalidad no es una garantía.
TradingView
El panorama on-chain
Los datos de hoy de los intercambios están volviéndose interesantes.
Binance: supuestamente salieron de Binance más de 13,800 BTC en un solo día, su mayor salida neta diaria desde 2023. Según los informes, sus reservas cayeron aproximadamente 20,000 BTC en cuatro días.
BTC + ORO + CFD: ¿“Uptober” Realmente se Acerca?
Septiembre está casi cerrado en verde.
Y la gráfica me está dando algo interesante para observar:
🟢 Julio: +7.36%
🟢 Agosto: +24.95%
🟢 Septiembre: +7.3% hasta ahora
Eso daría a Bitcoin 3 meses verdes consecutivos.
Pero aquí está la parte a la que le presto más atención…
Históricamente, la gráfica muestra que octubre promedia +19.92% con una mediana de +14.71%. Suena alcista, pero la estacionalidad no es una garantía.
TradingView
El panorama on-chain
Los datos de hoy de los intercambios están volviéndose interesantes.
Binance: supuestamente salieron de Binance más de 13,800 BTC en un solo día, su mayor salida neta diaria desde 2023. Según los informes, sus reservas cayeron aproximadamente 20,000 BTC en cuatro días.
Y la gráfica me está dando algo interesante para observar:
🟢 Julio: +7.36%
🟢 Agosto: +24.95%
🟢 Septiembre: +7.3% hasta ahora
Eso daría a Bitcoin 3 meses verdes consecutivos.
Pero aquí está la parte a la que le presto más atención…
Históricamente, la gráfica muestra que octubre promedia +19.92% con una mediana de +14.71%. Suena alcista, pero la estacionalidad no es una garantía.
TradingView
El panorama on-chain
Los datos de hoy de los intercambios están volviéndose interesantes.
Binance: supuestamente salieron de Binance más de 13,800 BTC en un solo día, su mayor salida neta diaria desde 2023. Según los informes, sus reservas cayeron aproximadamente 20,000 BTC en cuatro días.
1
190
#USGovernment
Los Bienes Duraderos de EE. UU. acaban de llegar mejor de lo esperado
Expectativas: -0.3% Real: 0.0% Anterior: +1.1%
A primera vista, esto parece alcista para los activos de riesgo.
¿Por qué?
El mercado estaba posicionado para una contracción en los nuevos pedidos de bienes duraderos. Sin embargo, la demanda se mantuvo plana, lo que significa que la economía de EE. UU. muestra una mayor resiliencia que lo que sugería el pronóstico principal.
Lo interesante está debajo del titular:
➡️ Bienes duraderos subyacentes ex-transporte: +0.3% ➡️ Pedidos de bienes de capital no relacionados con defensa ex-aviones: +1.6%
Esto importa porque estas medidas ofrecen una mejor lectura sobre la inversión empresarial y la demanda subyacente.
Para BTC y el cripto, la reacción puede ser positiva si estos datos respaldan un movimiento de dólar más débil / aversión al riesgo (risk-on).
Pero hay un “pero”:
Los datos económicos sólidos también pueden mantener a la Fed más cautelosa con los recortes de tasas. Por ello, los rendimientos del Tesoro y el dólar siguen siendo señales de confirmación importantes. Los comentarios recientes del mercado han destacado rendimientos elevados y expectativas de la Fed más hawkish como un impulsor clave entre activos.
Así que estoy vigilando:
DXY ↓ + rendimientos ↓ + volumen de BTC ↑ = confirmación alcista más fuerte
Sin esa confirmación, no perseguiría la primera vela verde.
Los datos superaron las expectativas. Ahora el mercado tiene que demostrar el movimiento.
$BTC
{future}(BTCUSDT)
$NEAR
{future}(NEARUSDT)
$ETC
{future}(ETCUSDT)
#USGovernment
Los Bienes Duraderos de EE. UU. acaban de llegar mejor de lo esperado
Expectativas: -0.3% Real: 0.0% Anterior: +1.1%
A primera vista, esto parece alcista para los activos de riesgo.
¿Por qué?
El mercado estaba posicionado para una contracción en los nuevos pedidos de bienes duraderos. Sin embargo, la demanda se mantuvo plana, lo que significa que la economía de EE. UU. muestra una mayor resiliencia que lo que sugería el pronóstico principal.
Lo interesante está debajo del titular:
➡️ Bienes duraderos subyacentes ex-transporte: +0.3% ➡️ Pedidos de bienes de capital no relacionados con defensa ex-aviones: +1.6%
Esto importa porque estas medidas ofrecen una mejor lectura sobre la inversión empresarial y la demanda subyacente.
Para BTC y el cripto, la reacción puede ser positiva si estos datos respaldan un movimiento de dólar más débil / aversión al riesgo (risk-on).
Pero hay un “pero”:
Los datos económicos sólidos también pueden mantener a la Fed más cautelosa con los recortes de tasas. Por ello, los rendimientos del Tesoro y el dólar siguen siendo señales de confirmación importantes. Los comentarios recientes del mercado han destacado rendimientos elevados y expectativas de la Fed más hawkish como un impulsor clave entre activos.
Así que estoy vigilando:
DXY ↓ + rendimientos ↓ + volumen de BTC ↑ = confirmación alcista más fuerte
Sin esa confirmación, no perseguiría la primera vela verde.
Los datos superaron las expectativas. Ahora el mercado tiene que demostrar el movimiento.
$BTC
$NEAR
$ETC
Los Bienes Duraderos de EE. UU. acaban de llegar mejor de lo esperado
Expectativas: -0.3% Real: 0.0% Anterior: +1.1%
A primera vista, esto parece alcista para los activos de riesgo.
¿Por qué?
El mercado estaba posicionado para una contracción en los nuevos pedidos de bienes duraderos. Sin embargo, la demanda se mantuvo plana, lo que significa que la economía de EE. UU. muestra una mayor resiliencia que lo que sugería el pronóstico principal.
Lo interesante está debajo del titular:
➡️ Bienes duraderos subyacentes ex-transporte: +0.3% ➡️ Pedidos de bienes de capital no relacionados con defensa ex-aviones: +1.6%
Esto importa porque estas medidas ofrecen una mejor lectura sobre la inversión empresarial y la demanda subyacente.
Para BTC y el cripto, la reacción puede ser positiva si estos datos respaldan un movimiento de dólar más débil / aversión al riesgo (risk-on).
Pero hay un “pero”:
Los datos económicos sólidos también pueden mantener a la Fed más cautelosa con los recortes de tasas. Por ello, los rendimientos del Tesoro y el dólar siguen siendo señales de confirmación importantes. Los comentarios recientes del mercado han destacado rendimientos elevados y expectativas de la Fed más hawkish como un impulsor clave entre activos.
Así que estoy vigilando:
DXY ↓ + rendimientos ↓ + volumen de BTC ↑ = confirmación alcista más fuerte
Sin esa confirmación, no perseguiría la primera vela verde.
Los datos superaron las expectativas. Ahora el mercado tiene que demostrar el movimiento.
$BTC
$NEAR
$ETC

182
#NEAR
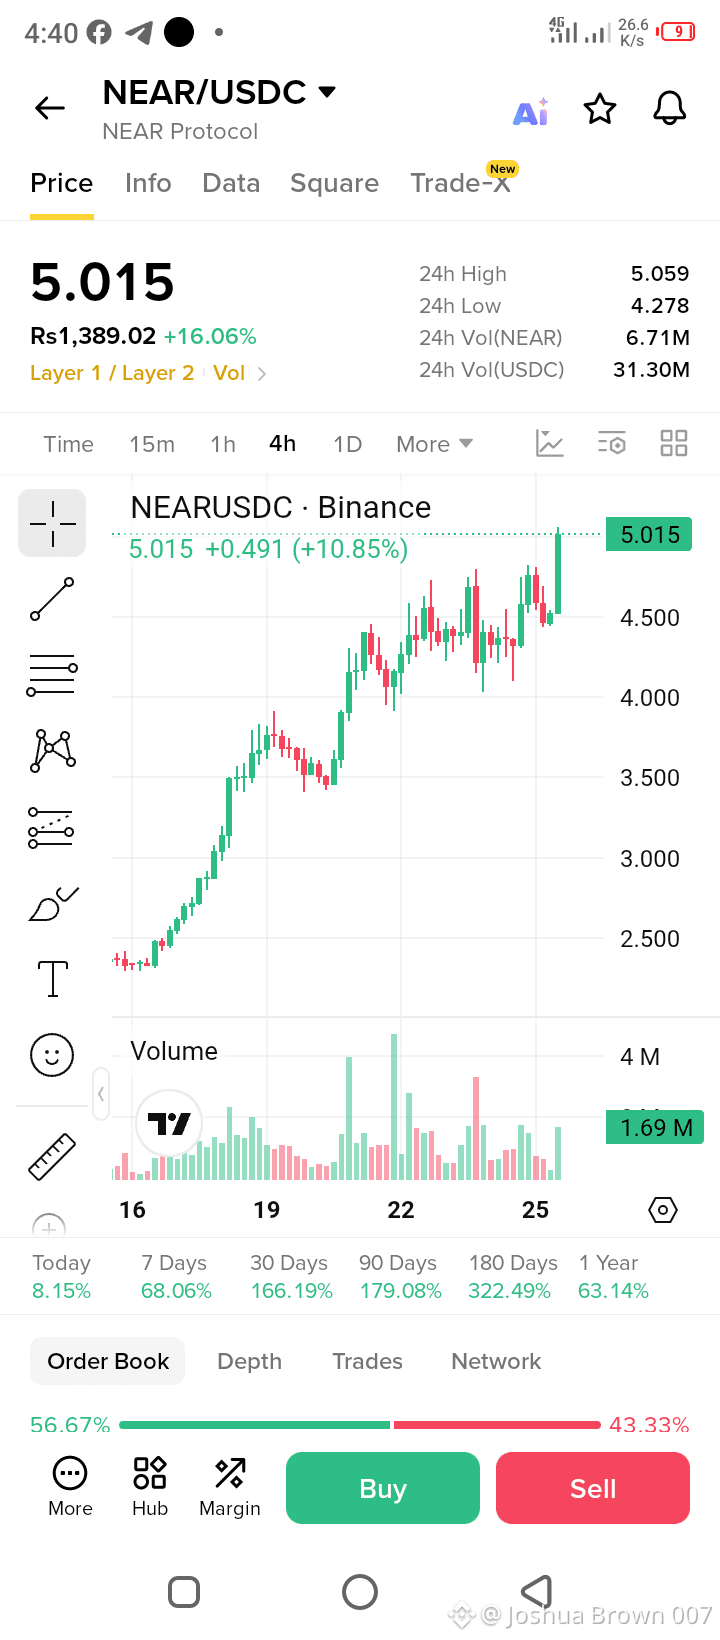
$NEAR USDC está en una poderosa tendencia alcista macro, habiendo subido +68% esta semana. Los indicadores están extendidos en el marco temporal micro, y el precio está consolidando por debajo del máximo 5.059.
Entrada Límite Larga 4.800 - 4.900
SL 4.650
TP 5.059
TP 5.500
Condiciones de invalidación:
El cierre de la vela de 4H por debajo de 4.500 invalida completamente la tesis alcista macro.
{future}(NEARUSDT)
$AVAX
{future}(AVAXUSDT)
#NEAR
$NEAR USDC está en una poderosa tendencia alcista macro, habiendo subido +68% esta semana. Los indicadores están extendidos en el marco temporal micro, y el precio está consolidando por debajo del máximo 5.059.
Entrada Límite Larga 4.800 - 4.900
SL 4.650
TP 5.059
TP 5.500
Condiciones de invalidación:
El cierre de la vela de 4H por debajo de 4.500 invalida completamente la tesis alcista macro.
$AVAX
$NEAR USDC está en una poderosa tendencia alcista macro, habiendo subido +68% esta semana. Los indicadores están extendidos en el marco temporal micro, y el precio está consolidando por debajo del máximo 5.059.
Entrada Límite Larga 4.800 - 4.900
SL 4.650
TP 5.059
TP 5.500
Condiciones de invalidación:
El cierre de la vela de 4H por debajo de 4.500 invalida completamente la tesis alcista macro.
$AVAX
200
#TradeNTell
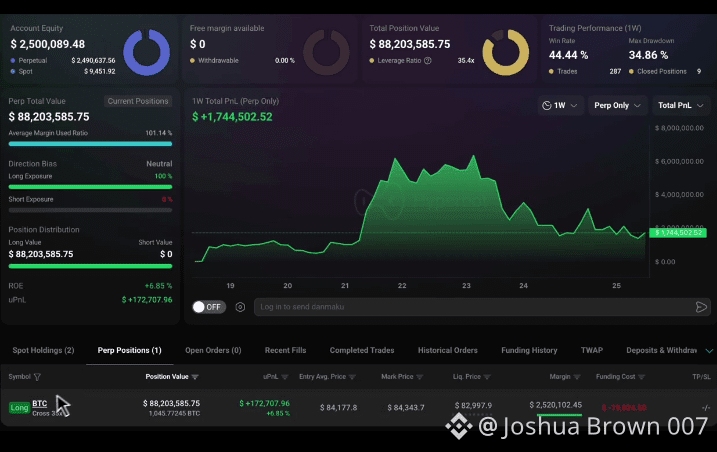
$2,5 MILLONES EN RIESGO ANTE LA CERCANÍA DE UNA POSICIÓN LARGA MASIVA DE BITCOIN A LA LIQUIDACIÓN
Un trader de criptomonedas de alto riesgo en la plataforma de trading descentralizada Hyperliquid se enfrenta a una eliminación total. La enorme posición larga apalancada en Bitcoin (BTC) por valor de 88.203.585,75 dólares del trader está peligrosamente cerca de su punto de ruptura.
Si el mercado cae apenas un poco más y activa una liquidación forzada, el trader sufrirá una pérdida inmediata de 2.500.089,48 dólares, destruyendo por completo el capital total de su cuenta.
Los Números Detrás de la Operación de Alto Riesgo
Tamaño Total de la Posición: 1.048,77 BTC (valuados en 88.203.585,75 dólares)
Ratio de Apalancamiento: 35,4x
Margen Depositado: 2.520.102,45 dólares
Precio Promedio de Entrada: 84.177,8 dólares por BTC
Precio Marcado Actual: 84.343,7 dólares por BTC
Precio de Liquidación: 82.997,9 dólares por BTC
Funcionando con Vapores: 0 dólares de Margen Libre Disponible
El panel del trader muestra una ganancia no realizada activa (uPnL) de +172.707,96 dólares (+6,85%). A pesar de este destello temporal en verde, opera con 0 dólares de margen libre disponible.
Dado que el apalancamiento está estirado hasta un volátil 35,4x, el colchón es increíblemente delgado. La distancia entre el precio actual del mercado (84.343,7) y el precio de liquidación (82.997,9) es de menos del 1,6%. Si el precio de Bitcoin cae por debajo de la marca de 82.997,9 dólares, el protocolo incautará y liquidará automáticamente la posición para proteger la liquidez de los fondos del sistema. Este movimiento volatilizará al instante el “nido” de 2,5 millones de dólares del trader, convirtiendo una racha semanal altamente rentable en una pérdida catastrófica.
$BTC
{future}(BTCUSDT)
$ETH
{future}(ETHUSDT)
#Whale.Alert #BinanceWillListHyperliquid(HYPE) #OndoFinanceSoughtSaleAfterFoundersDeath
#TradeNTell
$2,5 MILLONES EN RIESGO ANTE LA CERCANÍA DE UNA POSICIÓN LARGA MASIVA DE BITCOIN A LA LIQUIDACIÓN
Un trader de criptomonedas de alto riesgo en la plataforma de trading descentralizada Hyperliquid se enfrenta a una eliminación total. La enorme posición larga apalancada en Bitcoin (BTC) por valor de 88.203.585,75 dólares del trader está peligrosamente cerca de su punto de ruptura.
Si el mercado cae apenas un poco más y activa una liquidación forzada, el trader sufrirá una pérdida inmediata de 2.500.089,48 dólares, destruyendo por completo el capital total de su cuenta.
Los Números Detrás de la Operación de Alto Riesgo
Tamaño Total de la Posición: 1.048,77 BTC (valuados en 88.203.585,75 dólares)
Ratio de Apalancamiento: 35,4x
Margen Depositado: 2.520.102,45 dólares
Precio Promedio de Entrada: 84.177,8 dólares por BTC
Precio Marcado Actual: 84.343,7 dólares por BTC
Precio de Liquidación: 82.997,9 dólares por BTC
Funcionando con Vapores: 0 dólares de Margen Libre Disponible
El panel del trader muestra una ganancia no realizada activa (uPnL) de +172.707,96 dólares (+6,85%). A pesar de este destello temporal en verde, opera con 0 dólares de margen libre disponible.
Dado que el apalancamiento está estirado hasta un volátil 35,4x, el colchón es increíblemente delgado. La distancia entre el precio actual del mercado (84.343,7) y el precio de liquidación (82.997,9) es de menos del 1,6%. Si el precio de Bitcoin cae por debajo de la marca de 82.997,9 dólares, el protocolo incautará y liquidará automáticamente la posición para proteger la liquidez de los fondos del sistema. Este movimiento volatilizará al instante el “nido” de 2,5 millones de dólares del trader, convirtiendo una racha semanal altamente rentable en una pérdida catastrófica.
$BTC
$ETH
#Whale.Alert #BinanceWillListHyperliquid(HYPE) #OndoFinanceSoughtSaleAfterFoundersDeath
$2,5 MILLONES EN RIESGO ANTE LA CERCANÍA DE UNA POSICIÓN LARGA MASIVA DE BITCOIN A LA LIQUIDACIÓN
Un trader de criptomonedas de alto riesgo en la plataforma de trading descentralizada Hyperliquid se enfrenta a una eliminación total. La enorme posición larga apalancada en Bitcoin (BTC) por valor de 88.203.585,75 dólares del trader está peligrosamente cerca de su punto de ruptura.
Si el mercado cae apenas un poco más y activa una liquidación forzada, el trader sufrirá una pérdida inmediata de 2.500.089,48 dólares, destruyendo por completo el capital total de su cuenta.
Los Números Detrás de la Operación de Alto Riesgo
Tamaño Total de la Posición: 1.048,77 BTC (valuados en 88.203.585,75 dólares)
Ratio de Apalancamiento: 35,4x
Margen Depositado: 2.520.102,45 dólares
Precio Promedio de Entrada: 84.177,8 dólares por BTC
Precio Marcado Actual: 84.343,7 dólares por BTC
Precio de Liquidación: 82.997,9 dólares por BTC
Funcionando con Vapores: 0 dólares de Margen Libre Disponible
El panel del trader muestra una ganancia no realizada activa (uPnL) de +172.707,96 dólares (+6,85%). A pesar de este destello temporal en verde, opera con 0 dólares de margen libre disponible.
Dado que el apalancamiento está estirado hasta un volátil 35,4x, el colchón es increíblemente delgado. La distancia entre el precio actual del mercado (84.343,7) y el precio de liquidación (82.997,9) es de menos del 1,6%. Si el precio de Bitcoin cae por debajo de la marca de 82.997,9 dólares, el protocolo incautará y liquidará automáticamente la posición para proteger la liquidez de los fondos del sistema. Este movimiento volatilizará al instante el “nido” de 2,5 millones de dólares del trader, convirtiendo una racha semanal altamente rentable en una pérdida catastrófica.
$BTC
$ETH
#Whale.Alert #BinanceWillListHyperliquid(HYPE) #OndoFinanceSoughtSaleAfterFoundersDeath
93
Estoy mirando un número antes de hacer mi próxima jugada con BTC:
🇺🇸 Solicitudes de subsidio por desempleo en EE. UU.
El mercado estaba mirando alrededor de 201K, después de los sorprendentemente bajos 196K de la semana pasada.
Pero esto es lo que me importa:
🔹 Por debajo de 198K → Mercado laboral sólido
→ Menos presión para una política monetaria más laxa de la Fed
→ Podría apoyar al USD/rendimientos
→ Los activos de riesgo podrían enfrentar presión
🔹 Alrededor de 202K → Cerca de las expectativas
→ Reacción inmediata probablemente limitada
→ BTC podría volver a niveles técnicos
🔹 Por encima de 210K → Enfriamiento del mercado laboral más claro
→ Más atención sobre la política futura de la Fed
→ Podría apoyar a los activos sensibles a las tasas, incluido el cripto
El panorama general es interesante.
Reuters informó que la lectura reciente de 196K podría haberse distorsionado por la volatilidad estacional del feriado de Labor Day, mientras que el mercado laboral subyacente se mantuvo relativamente estable.
Y otra advertencia importante: las solicitudes de desempleo miden principalmente despidos, no contrataciones. Así que un número bajo por sí solo no prueba que todo el mercado laboral se esté fortaleciendo.
Para BTC, no estoy operando solo con el titular.
Voy a vigilar:
Solicitudes → DXY → Rendimientos de Treasuries → Expectativas de la Fed → Liquidez de BTC
Esa reacción en cadena importa más que un solo dato económico.
Sin largos ciegos.
Sin cortos ciegos.
Deja que los datos golpeen primero y luego mira cómo reacciona el precio.
#USGovernment
{future}(BTCUSDT)
{future}(BNBUSDT)
{future}(XRPUSDT)
Estoy mirando un número antes de hacer mi próxima jugada con BTC:
🇺🇸 Solicitudes de subsidio por desempleo en EE. UU.
El mercado estaba mirando alrededor de 201K, después de los sorprendentemente bajos 196K de la semana pasada.
Pero esto es lo que me importa:
🔹 Por debajo de 198K → Mercado laboral sólido
→ Menos presión para una política monetaria más laxa de la Fed
→ Podría apoyar al USD/rendimientos
→ Los activos de riesgo podrían enfrentar presión
🔹 Alrededor de 202K → Cerca de las expectativas
→ Reacción inmediata probablemente limitada
→ BTC podría volver a niveles técnicos
🔹 Por encima de 210K → Enfriamiento del mercado laboral más claro
→ Más atención sobre la política futura de la Fed
→ Podría apoyar a los activos sensibles a las tasas, incluido el cripto
El panorama general es interesante.
Reuters informó que la lectura reciente de 196K podría haberse distorsionado por la volatilidad estacional del feriado de Labor Day, mientras que el mercado laboral subyacente se mantuvo relativamente estable.
Y otra advertencia importante: las solicitudes de desempleo miden principalmente despidos, no contrataciones. Así que un número bajo por sí solo no prueba que todo el mercado laboral se esté fortaleciendo.
Para BTC, no estoy operando solo con el titular.
Voy a vigilar:
Solicitudes → DXY → Rendimientos de Treasuries → Expectativas de la Fed → Liquidez de BTC
Esa reacción en cadena importa más que un solo dato económico.
Sin largos ciegos.
Sin cortos ciegos.
Deja que los datos golpeen primero y luego mira cómo reacciona el precio.
#USGovernment
🇺🇸 Solicitudes de subsidio por desempleo en EE. UU.
El mercado estaba mirando alrededor de 201K, después de los sorprendentemente bajos 196K de la semana pasada.
Pero esto es lo que me importa:
🔹 Por debajo de 198K → Mercado laboral sólido
→ Menos presión para una política monetaria más laxa de la Fed
→ Podría apoyar al USD/rendimientos
→ Los activos de riesgo podrían enfrentar presión
🔹 Alrededor de 202K → Cerca de las expectativas
→ Reacción inmediata probablemente limitada
→ BTC podría volver a niveles técnicos
🔹 Por encima de 210K → Enfriamiento del mercado laboral más claro
→ Más atención sobre la política futura de la Fed
→ Podría apoyar a los activos sensibles a las tasas, incluido el cripto
El panorama general es interesante.
Reuters informó que la lectura reciente de 196K podría haberse distorsionado por la volatilidad estacional del feriado de Labor Day, mientras que el mercado laboral subyacente se mantuvo relativamente estable.
Y otra advertencia importante: las solicitudes de desempleo miden principalmente despidos, no contrataciones. Así que un número bajo por sí solo no prueba que todo el mercado laboral se esté fortaleciendo.
Para BTC, no estoy operando solo con el titular.
Voy a vigilar:
Solicitudes → DXY → Rendimientos de Treasuries → Expectativas de la Fed → Liquidez de BTC
Esa reacción en cadena importa más que un solo dato económico.
Sin largos ciegos.
Sin cortos ciegos.
Deja que los datos golpeen primero y luego mira cómo reacciona el precio.
#USGovernment
124
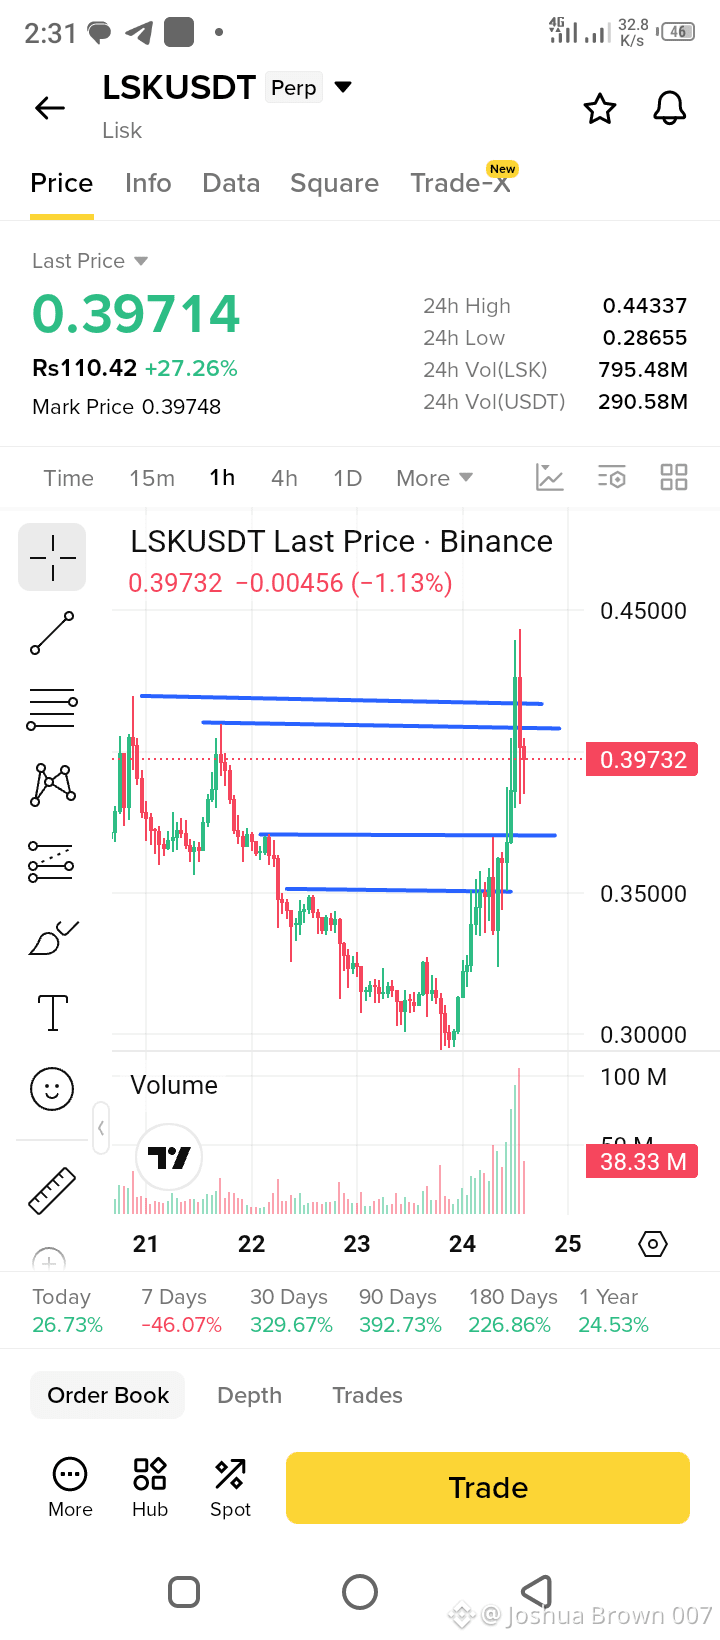
Operaciones en 30 d. de $LSK 10.7K USDT
#Trade Short scalp $LSK
Entrada 0.3930 - 0.4000
SL 0.4150
TP 0.3700 FVG 1H
TP 0.3500 Zona de demanda importante
Condiciones de invalidación:
El cierre de una vela en 1H por encima de 0.4200 invalida completamente la tesis micro bajista.
$LSK
{future}(LSKUSDT)
#Trade Short scalp $LSK
Entrada 0.3930 - 0.4000
SL 0.4150
TP 0.3700 FVG 1H
TP 0.3500 Zona de demanda importante
Condiciones de invalidación:
El cierre de una vela en 1H por encima de 0.4200 invalida completamente la tesis micro bajista.
$LSK
Entrada 0.3930 - 0.4000
SL 0.4150
TP 0.3700 FVG 1H
TP 0.3500 Zona de demanda importante
Condiciones de invalidación:
El cierre de una vela en 1H por encima de 0.4200 invalida completamente la tesis micro bajista.
$LSK
203
·
--
Alcista
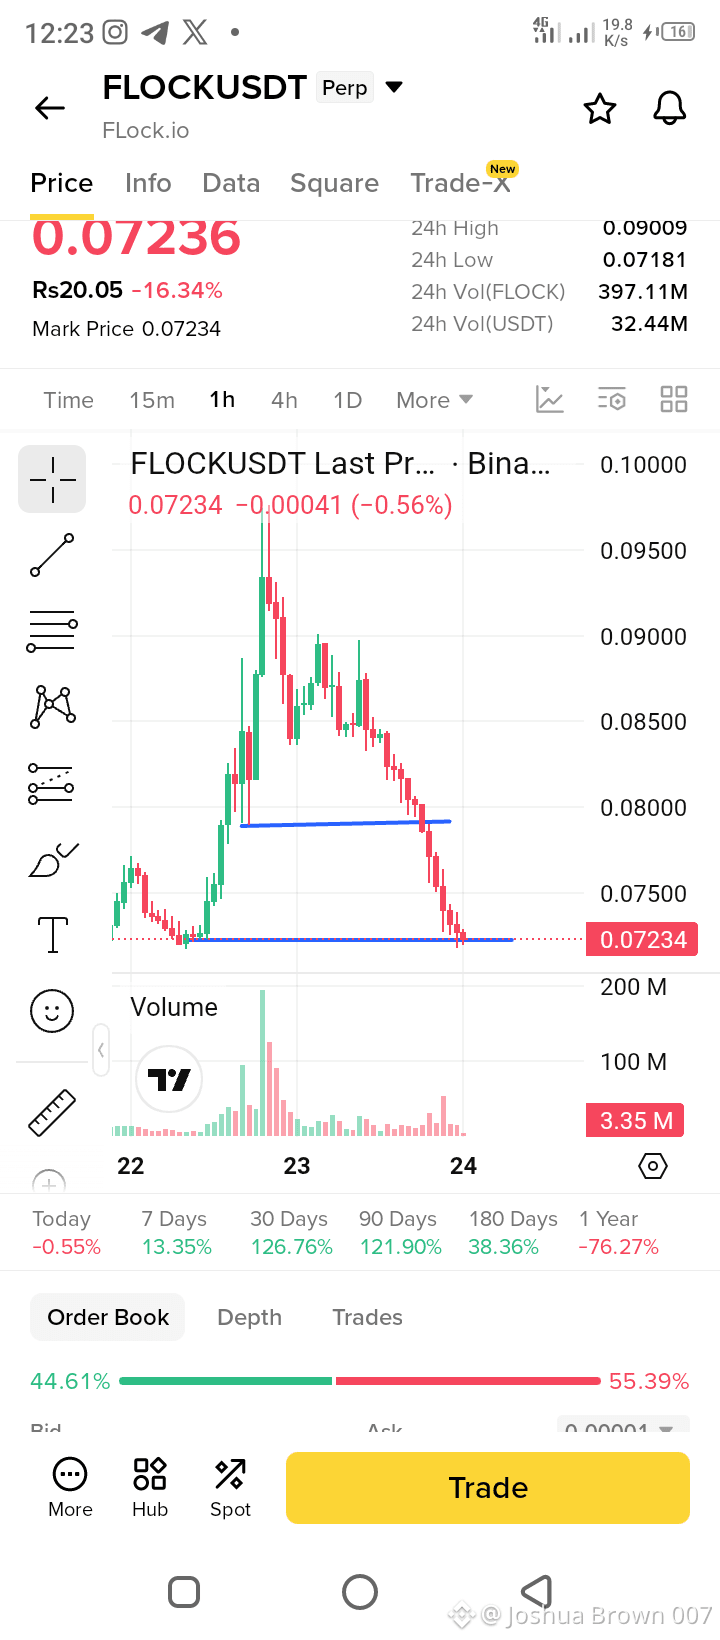
Operaciones en 30 d. de $FLOCK 7K USDT
#Trade $FLOCK LONG Configuración
Límite de entrada 0.0715 - 0.0725
SL 0.0690
TP 0.07482
TP 0.08050
Condiciones de invalidación:
Cierre de una vela de 1H por debajo de 0.0690 invalida la tesis del rebote inmediato.
Pico repentino en el volumen de ventas que rompe el soporte de 0.0650.
Si el precio rompe por debajo de 0.0690 con alto volumen, entrar en corto en el retest de 0.0710, apuntando a 0.0650. SL en 0.0730.
$TAKE $CAP
{future}(FLOCKUSDT)
{future}(TAKEUSDT)
{future}(CAPUSDT)
#Trade $FLOCK LONG Configuración
Límite de entrada 0.0715 - 0.0725
SL 0.0690
TP 0.07482
TP 0.08050
Condiciones de invalidación:
Cierre de una vela de 1H por debajo de 0.0690 invalida la tesis del rebote inmediato.
Pico repentino en el volumen de ventas que rompe el soporte de 0.0650.
Si el precio rompe por debajo de 0.0690 con alto volumen, entrar en corto en el retest de 0.0710, apuntando a 0.0650. SL en 0.0730.
$TAKE $CAP
Límite de entrada 0.0715 - 0.0725
SL 0.0690
TP 0.07482
TP 0.08050
Condiciones de invalidación:
Cierre de una vela de 1H por debajo de 0.0690 invalida la tesis del rebote inmediato.
Pico repentino en el volumen de ventas que rompe el soporte de 0.0650.
Si el precio rompe por debajo de 0.0690 con alto volumen, entrar en corto en el retest de 0.0710, apuntando a 0.0650. SL en 0.0730.
$TAKE $CAP
566
Artículo
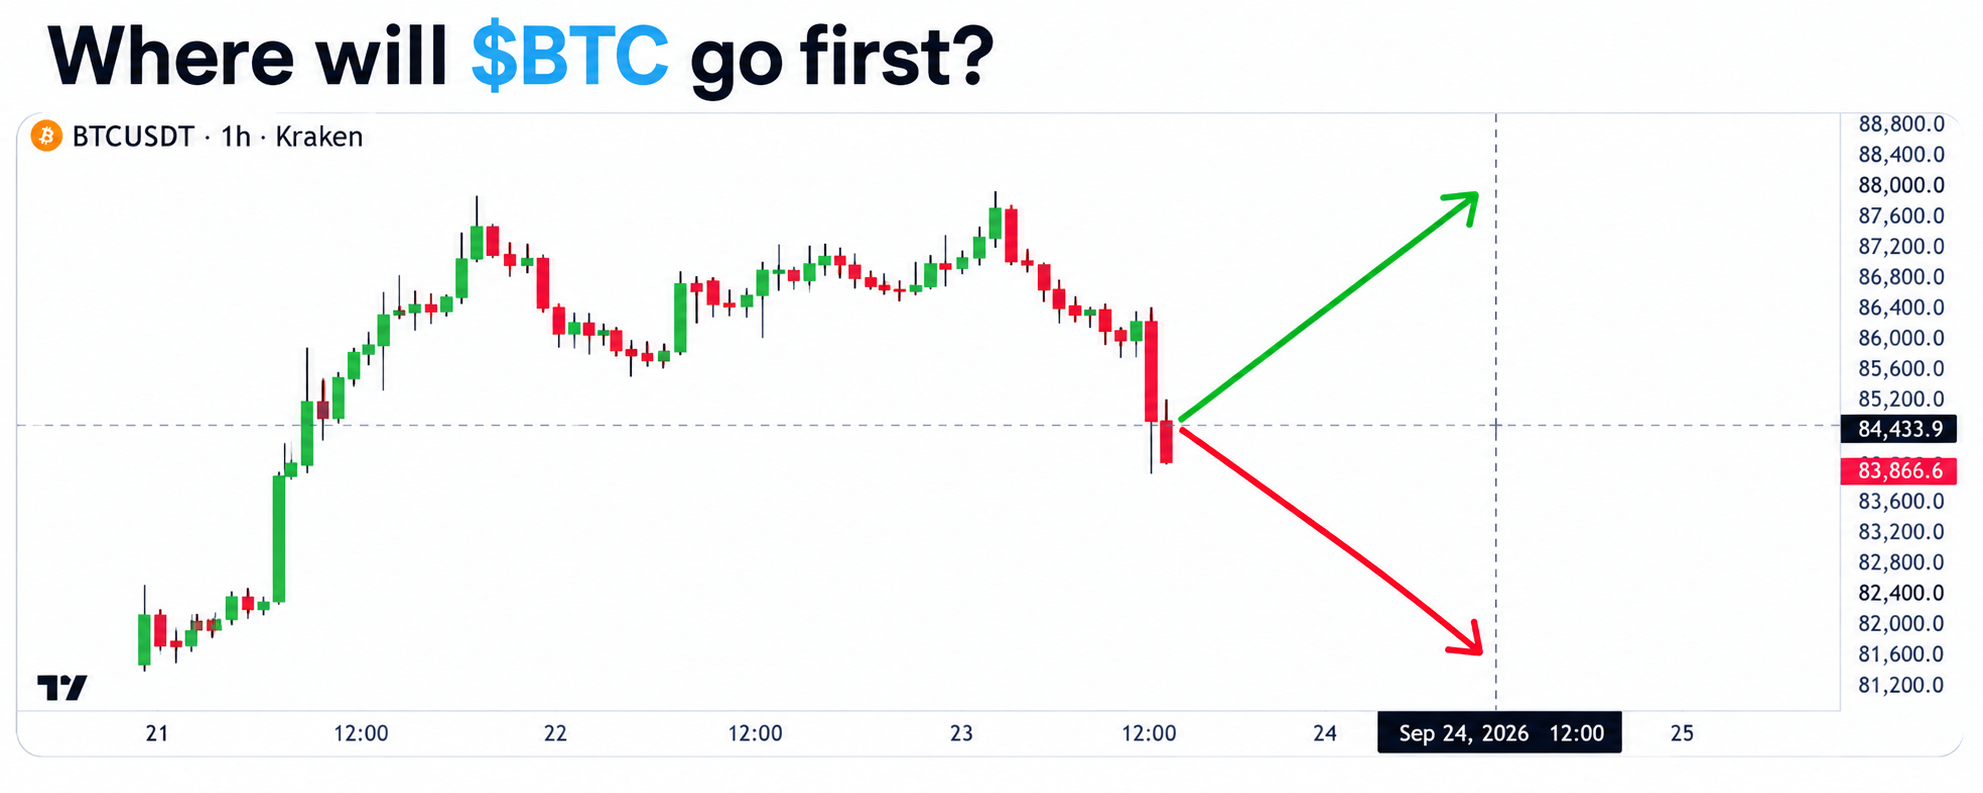
¿A dónde irá $BTC primero, arriba o abajo?Sigo mirando este gráfico y hay una pregunta que destaca:
¿Bitcoin tomará primero la liquidez por encima, o barrerá el lado a la baja antes del siguiente movimiento?
El gráfico muestra la zona clave de decisión alrededor de $84.4K, con aproximadamente $87.6K al alza y $81.6K a la baja.
Pero hay una actualización importante: BTC ya ha entrado hoy en la zona de $87K, así que este gráfico debe tratarse como una instantánea de la configuración anterior, no de la estructura en vivo actual. El panel más reciente de CryptoQuant tenía a BTC alrededor de $87.36K y su Indicador Bull/Bear había pasado a positivo en +0.27.
¿A dónde irá $BTC primero, arriba o abajo?
Sigo mirando este gráfico y hay una pregunta que destaca:
¿Bitcoin tomará primero la liquidez por encima, o barrerá el lado a la baja antes del siguiente movimiento?
El gráfico muestra la zona clave de decisión alrededor de $84.4K, con aproximadamente $87.6K al alza y $81.6K a la baja.
Pero hay una actualización importante: BTC ya ha entrado hoy en la zona de $87K, así que este gráfico debe tratarse como una instantánea de la configuración anterior, no de la estructura en vivo actual. El panel más reciente de CryptoQuant tenía a BTC alrededor de $87.36K y su Indicador Bull/Bear había pasado a positivo en +0.27.
¿Bitcoin tomará primero la liquidez por encima, o barrerá el lado a la baja antes del siguiente movimiento?
El gráfico muestra la zona clave de decisión alrededor de $84.4K, con aproximadamente $87.6K al alza y $81.6K a la baja.
Pero hay una actualización importante: BTC ya ha entrado hoy en la zona de $87K, así que este gráfico debe tratarse como una instantánea de la configuración anterior, no de la estructura en vivo actual. El panel más reciente de CryptoQuant tenía a BTC alrededor de $87.36K y su Indicador Bull/Bear había pasado a positivo en +0.27.
1
8
9k
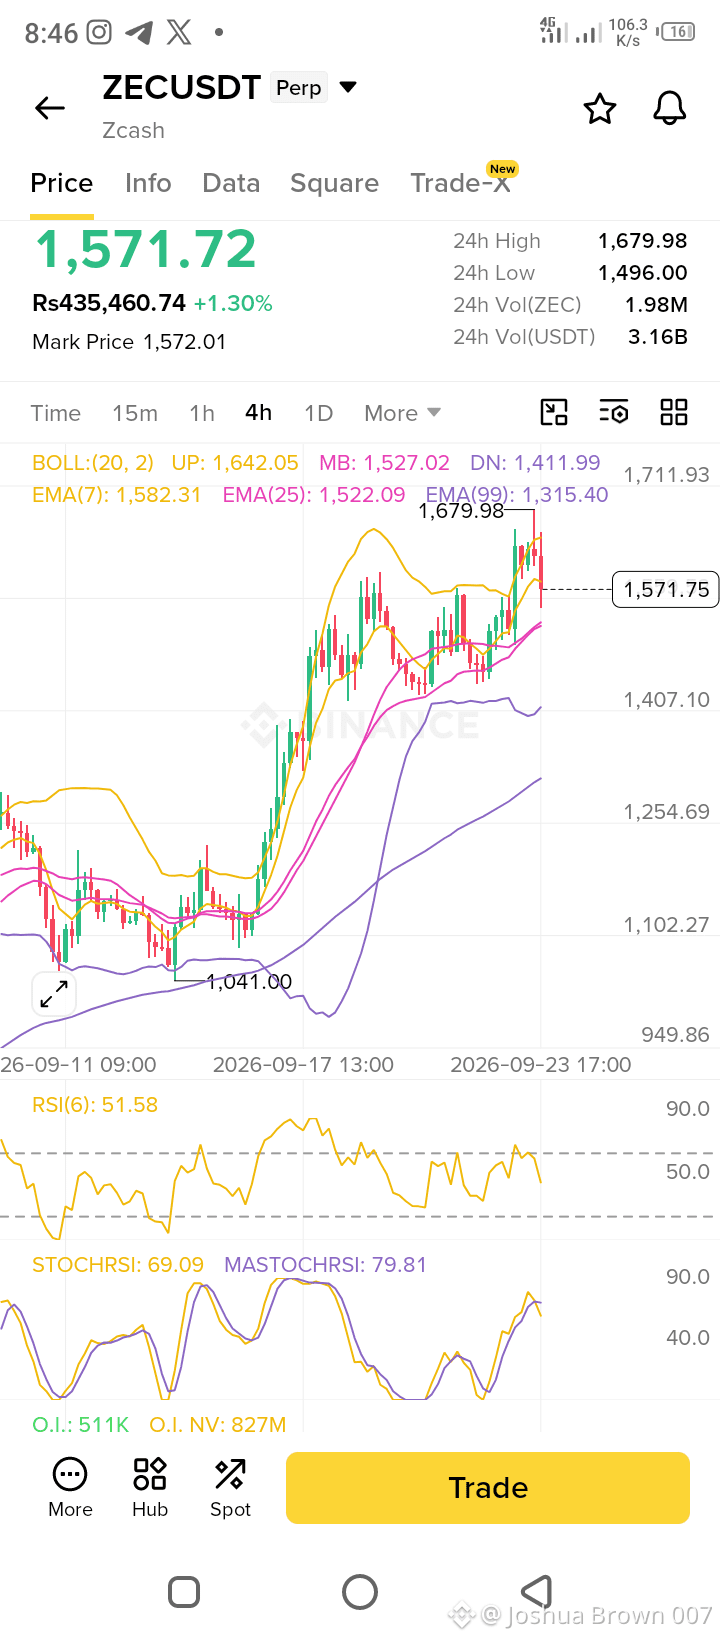
#zec
ESPERA EL RETROCESO Y ENTRA LARGO.
$ZEC USDT está en una potente tendencia alcista, pero actualmente está atravesando una corrección necesaria a corto plazo. Los indicadores se han enfriado significativamente y el precio está probando la EMA(25). No te metas por FOMO en el precio actual (1,571).
Entrada Largo 1,520 - 1,540
SL 1,480
TP 1,645
TP 1,780
Tiempo estimado 08 hrs - 1 Días
Condiciones de invalidación:
Si el cierre de la vela de 4H queda por debajo de 1,315 (EMA 99) invalida completamente la tesis macro alcista.
{future}(ZECUSDT)
$TAO
{future}(TAOUSDT)
$ZEN
{future}(ZENUSDT)
#zec
ESPERA EL RETROCESO Y ENTRA LARGO.
$ZEC USDT está en una potente tendencia alcista, pero actualmente está atravesando una corrección necesaria a corto plazo. Los indicadores se han enfriado significativamente y el precio está probando la EMA(25). No te metas por FOMO en el precio actual (1,571).
Entrada Largo 1,520 - 1,540
SL 1,480
TP 1,645
TP 1,780
Tiempo estimado 08 hrs - 1 Días
Condiciones de invalidación:
Si el cierre de la vela de 4H queda por debajo de 1,315 (EMA 99) invalida completamente la tesis macro alcista.
$TAO
$ZEN
ESPERA EL RETROCESO Y ENTRA LARGO.
$ZEC USDT está en una potente tendencia alcista, pero actualmente está atravesando una corrección necesaria a corto plazo. Los indicadores se han enfriado significativamente y el precio está probando la EMA(25). No te metas por FOMO en el precio actual (1,571).
Entrada Largo 1,520 - 1,540
SL 1,480
TP 1,645
TP 1,780
Tiempo estimado 08 hrs - 1 Días
Condiciones de invalidación:
Si el cierre de la vela de 4H queda por debajo de 1,315 (EMA 99) invalida completamente la tesis macro alcista.
$TAO
$ZEN
437
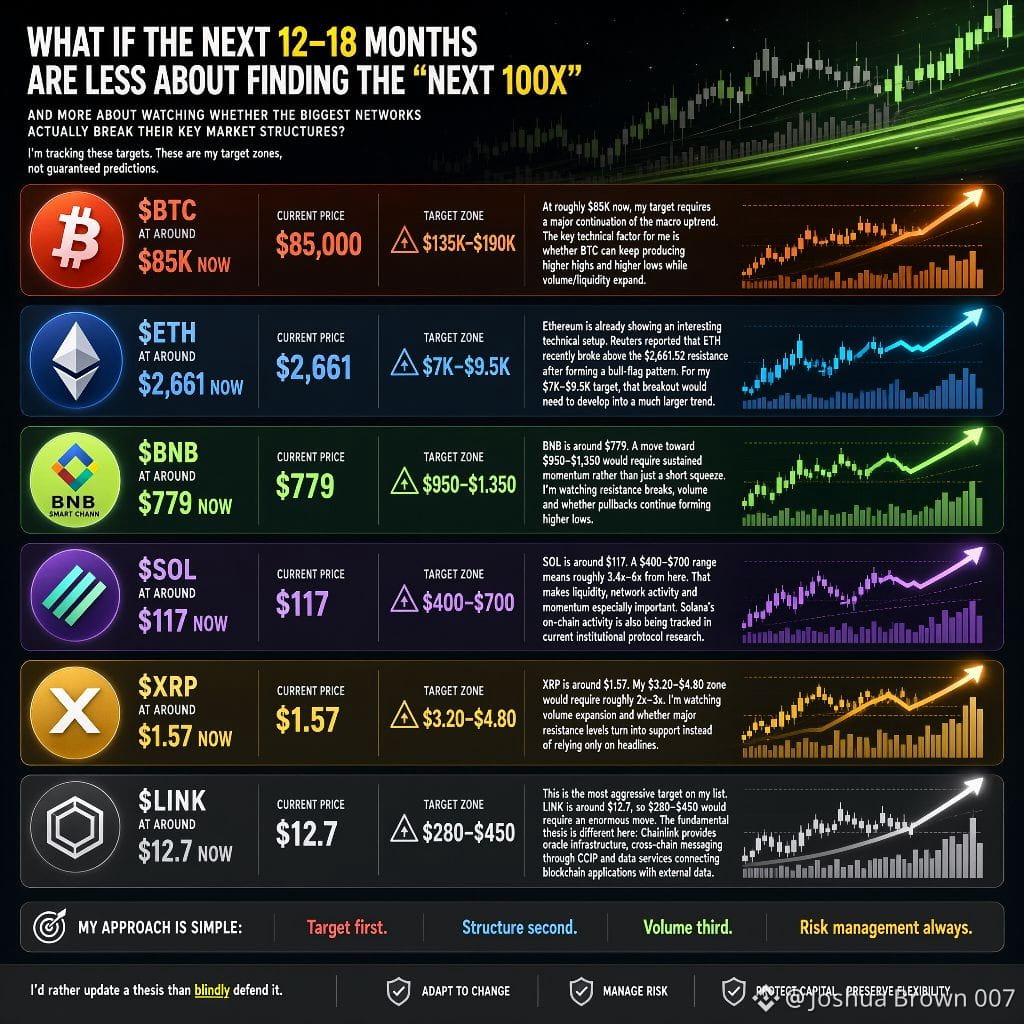
¿Y si los próximos 12–18 meses tratan menos de encontrar el “próximo 100x” y más de observar si las redes más grandes realmente rompen sus estructuras clave de mercado?
Estoy siguiendo estos objetivos:
$BTC → $135K–$190K
$ETH → $7K–$9.5K
$BNB → $950–$1,350
$SOL → $400–$700
$XRP → $3.20–$4.80
$LINK → $280–$450
Estos son mis rangos objetivo, no predicciones garantizadas.
🔹 $BTC
Con aproximadamente $85K ahora, mi objetivo requiere una continuación importante de la tendencia macro. El factor técnico clave para mí es si el BTC puede seguir generando máximos y mínimos más altos mientras el volumen/liquidez se expanden.
🔹 $ETH
Ethereum ya está mostrando un patrón técnico interesante. Reuters informó que ETH recientemente rompió por encima de la resistencia de $2,661.52 después de formar un patrón de banderín alcista.
Para mi objetivo de $7K–$9.5K, esa ruptura tendría que convertirse en una tendencia mucho más grande.
🔹 $BNB
BNB está alrededor de $779. Un movimiento hacia $950–$1,350 requeriría impulso sostenido, no solo un short squeeze. Estoy observando rupturas de resistencias, el volumen y si los retrocesos siguen formando mínimos más altos.
🔹 $SOL
SOL está alrededor de $117. Un rango de $400–$700 significa aproximadamente 3.4x–6x desde aquí.
Eso hace que la liquidez, la actividad de la red y el impulso sean especialmente importantes. También se está siguiendo la actividad on-chain de Solana en la investigación institucional de protocolos actual.
🔹 $XRP
XRP está alrededor de $1.57. Mi rango de $3.20–$4.80 requeriría aproximadamente 2x–3x. Estoy vigilando la expansión del volumen y si los niveles de resistencia importantes se convierten en soporte en lugar de depender solo de titulares.
Mi enfoque es simple:
Primero el objetivo.
Segundo la estructura.
Tercero el volumen.
Siempre la gestión del riesgo.
Si cambia la estructura del mercado, mis objetivos también pueden cambiar.
Preferiría actualizar una tesis antes que defenderla ciegamente.
{spot}(BTCUSDT)
{spot}(ETHUSDT)
{spot}(BNBUSDT)
¿Y si los próximos 12–18 meses tratan menos de encontrar el “próximo 100x” y más de observar si las redes más grandes realmente rompen sus estructuras clave de mercado?
Estoy siguiendo estos objetivos:
$BTC → $135K–$190K
$ETH → $7K–$9.5K
$BNB → $950–$1,350
$SOL → $400–$700
$XRP → $3.20–$4.80
$LINK → $280–$450
Estos son mis rangos objetivo, no predicciones garantizadas.
🔹 $BTC
Con aproximadamente $85K ahora, mi objetivo requiere una continuación importante de la tendencia macro. El factor técnico clave para mí es si el BTC puede seguir generando máximos y mínimos más altos mientras el volumen/liquidez se expanden.
🔹 $ETH
Ethereum ya está mostrando un patrón técnico interesante. Reuters informó que ETH recientemente rompió por encima de la resistencia de $2,661.52 después de formar un patrón de banderín alcista.
Para mi objetivo de $7K–$9.5K, esa ruptura tendría que convertirse en una tendencia mucho más grande.
🔹 $BNB
BNB está alrededor de $779. Un movimiento hacia $950–$1,350 requeriría impulso sostenido, no solo un short squeeze. Estoy observando rupturas de resistencias, el volumen y si los retrocesos siguen formando mínimos más altos.
🔹 $SOL
SOL está alrededor de $117. Un rango de $400–$700 significa aproximadamente 3.4x–6x desde aquí.
Eso hace que la liquidez, la actividad de la red y el impulso sean especialmente importantes. También se está siguiendo la actividad on-chain de Solana en la investigación institucional de protocolos actual.
🔹 $XRP
XRP está alrededor de $1.57. Mi rango de $3.20–$4.80 requeriría aproximadamente 2x–3x. Estoy vigilando la expansión del volumen y si los niveles de resistencia importantes se convierten en soporte en lugar de depender solo de titulares.
Mi enfoque es simple:
Primero el objetivo.
Segundo la estructura.
Tercero el volumen.
Siempre la gestión del riesgo.
Si cambia la estructura del mercado, mis objetivos también pueden cambiar.
Preferiría actualizar una tesis antes que defenderla ciegamente.
Estoy siguiendo estos objetivos:
$BTC → $135K–$190K
$ETH → $7K–$9.5K
$BNB → $950–$1,350
$SOL → $400–$700
$XRP → $3.20–$4.80
$LINK → $280–$450
Estos son mis rangos objetivo, no predicciones garantizadas.
🔹 $BTC
Con aproximadamente $85K ahora, mi objetivo requiere una continuación importante de la tendencia macro. El factor técnico clave para mí es si el BTC puede seguir generando máximos y mínimos más altos mientras el volumen/liquidez se expanden.
🔹 $ETH
Ethereum ya está mostrando un patrón técnico interesante. Reuters informó que ETH recientemente rompió por encima de la resistencia de $2,661.52 después de formar un patrón de banderín alcista.
Para mi objetivo de $7K–$9.5K, esa ruptura tendría que convertirse en una tendencia mucho más grande.
🔹 $BNB
BNB está alrededor de $779. Un movimiento hacia $950–$1,350 requeriría impulso sostenido, no solo un short squeeze. Estoy observando rupturas de resistencias, el volumen y si los retrocesos siguen formando mínimos más altos.
🔹 $SOL
SOL está alrededor de $117. Un rango de $400–$700 significa aproximadamente 3.4x–6x desde aquí.
Eso hace que la liquidez, la actividad de la red y el impulso sean especialmente importantes. También se está siguiendo la actividad on-chain de Solana en la investigación institucional de protocolos actual.
🔹 $XRP
XRP está alrededor de $1.57. Mi rango de $3.20–$4.80 requeriría aproximadamente 2x–3x. Estoy vigilando la expansión del volumen y si los niveles de resistencia importantes se convierten en soporte en lugar de depender solo de titulares.
Mi enfoque es simple:
Primero el objetivo.
Segundo la estructura.
Tercero el volumen.
Siempre la gestión del riesgo.
Si cambia la estructura del mercado, mis objetivos también pueden cambiar.
Preferiría actualizar una tesis antes que defenderla ciegamente.
201
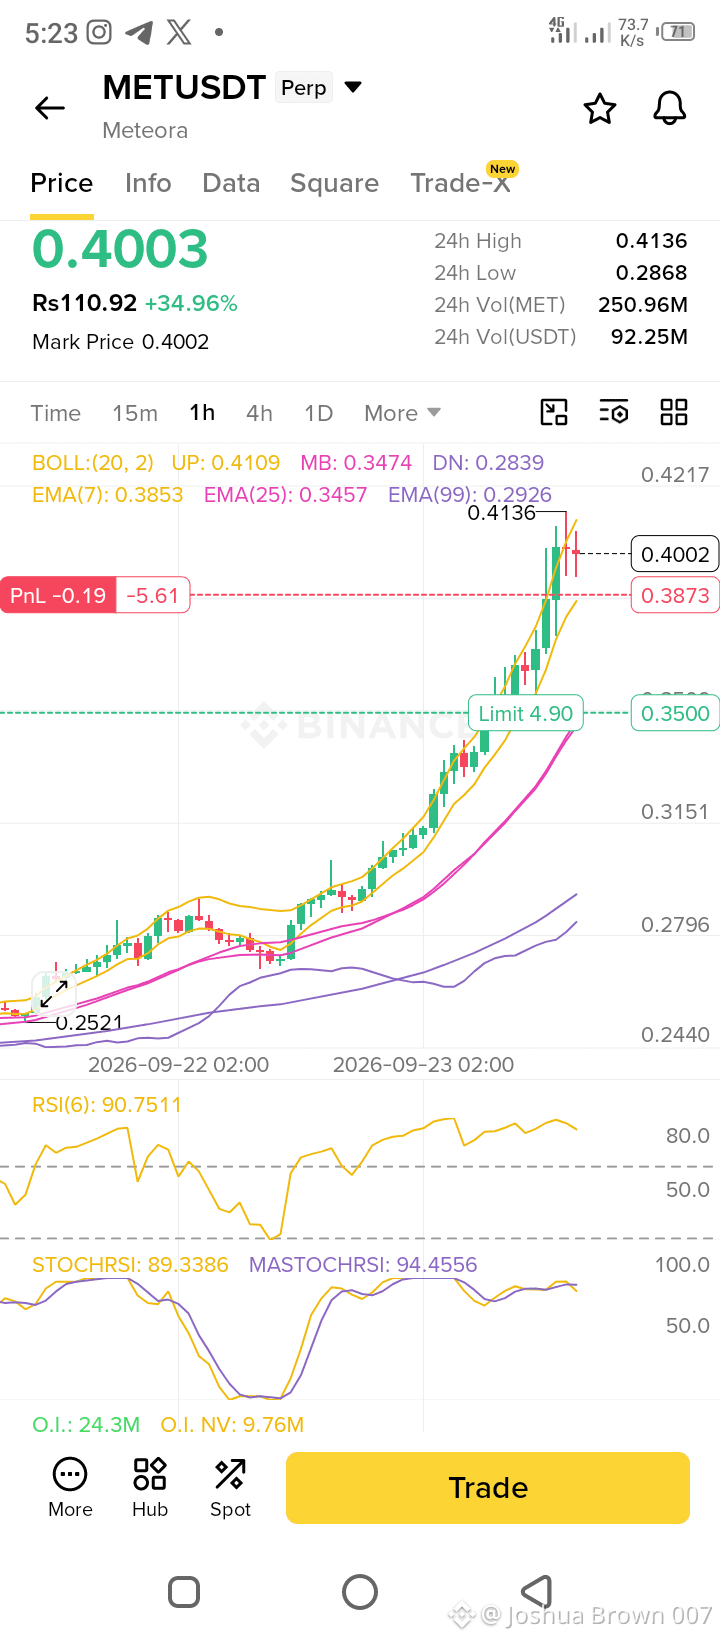
$MET Short Sell
Entrada0.4000 - 0.4050
SL 0.4150
TP 0.3860 y 0.3490
precaución:
Si el precio recupera 0.4136 con alto volumen y rompe 0.4217, entra en largo con objetivo en 0.450. SL en 0.400.
{future}(METUSDT)
$MET Short Sell
Entrada0.4000 - 0.4050
SL 0.4150
TP 0.3860 y 0.3490
precaución:
Si el precio recupera 0.4136 con alto volumen y rompe 0.4217, entra en largo con objetivo en 0.450. SL en 0.400.
Entrada0.4000 - 0.4050
SL 0.4150
TP 0.3860 y 0.3490
precaución:
Si el precio recupera 0.4136 con alto volumen y rompe 0.4217, entra en largo con objetivo en 0.450. SL en 0.400.
155
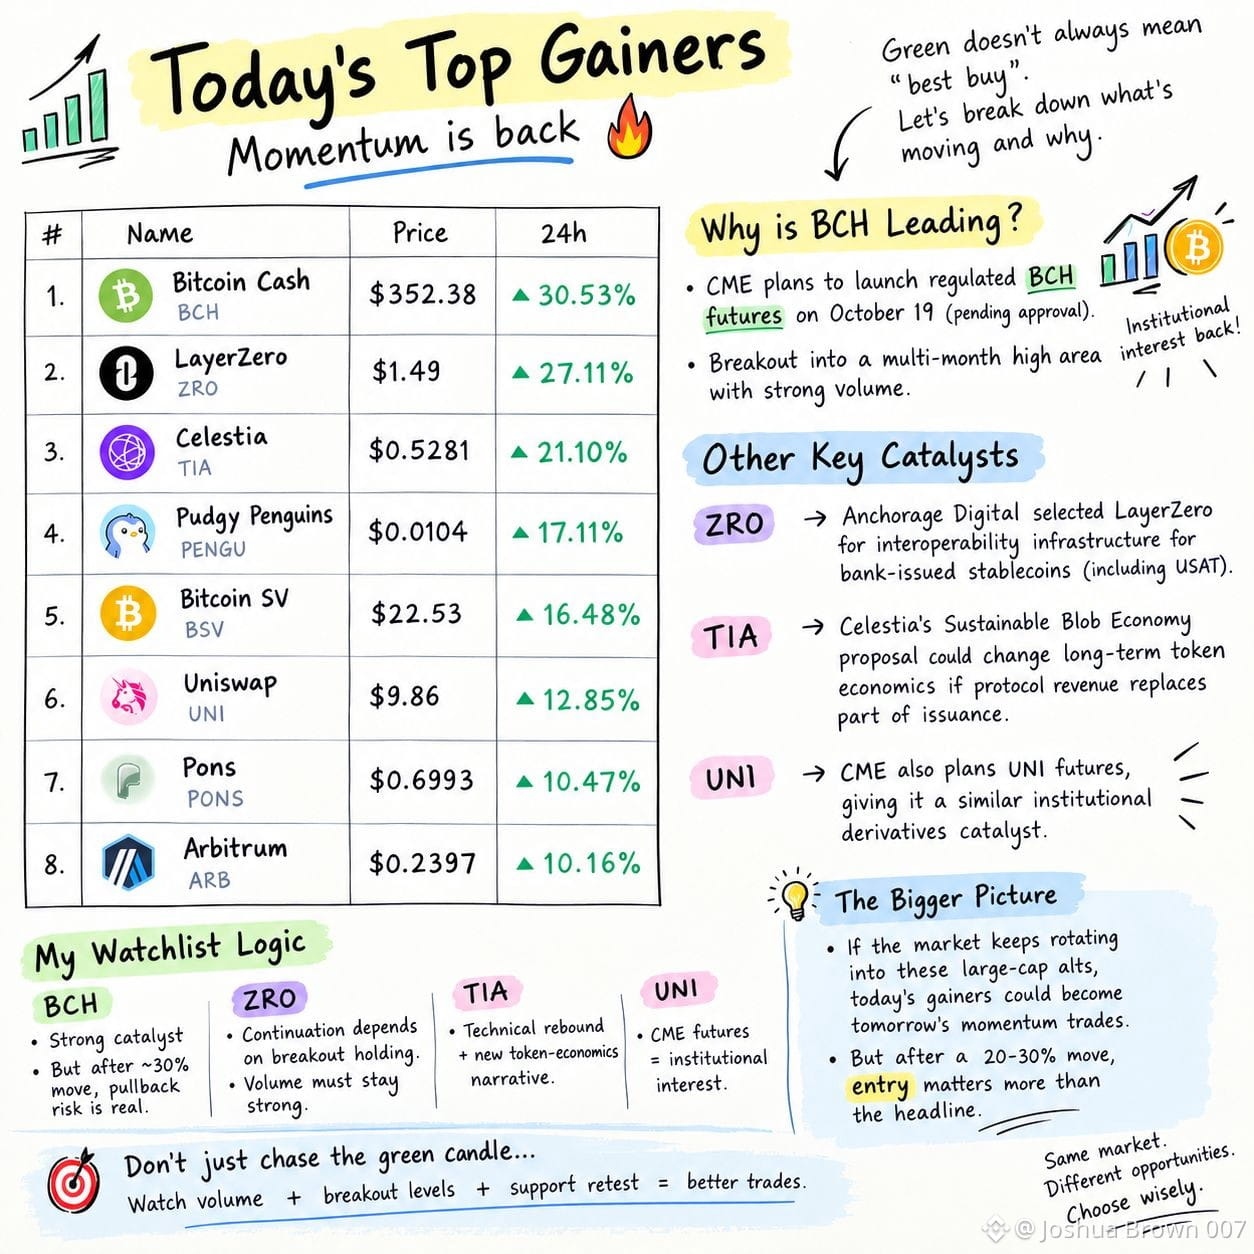
¡Vuelven los principales ganadores con impulso! 🔥
El ranking de hoy es interesante porque esto no es solo una pequeña bomba de cap.
$BCH +30.53%
$ZRO +27.11%
$TIA +21.10%
$PENGU +17.11%
$BSV +16.48%
$UNI +12.85%
$PONS +10.47%
$ARB +10.16%
La noticia más grande es BCH. El movimiento está relacionado con los planes del CME para futuros de BCH regulados, programados para el 19 de octubre, a la espera de la aprobación regulatoria. BCH también se ha abierto paso en una zona de máximos de varios meses con un volumen alto.
Pero aquí está la parte importante 👇
Una moneda que ya subió 30% no significa automáticamente que sea la que tiene más recorrido alcista restante.
ZRO tiene otro catalizador fundamental interesante: Anchorage Digital seleccionó LayerZero para la infraestructura de interoperabilidad de stablecoins emitidas por bancos, incluyendo el USAT de Tether.
TIA también merece atención porque la nueva propuesta de Celestia para una Economía Sostenible de Blobs podría cambiar la economía a largo plazo del token si, en el futuro, los ingresos del protocolo llegan a reemplazar parte de la emisión.
Mi lógica de lista de seguimiento
BCH: el catalizador actual más fuerte, pero después de un movimiento diario de ~30%, el riesgo de retroceso importa.
ZRO: la continuación depende de si el breakout de hoy se mantiene y el volumen sigue siendo fuerte.
TIA: combinación interesante de rebote técnico + narrativa de nueva economía de tokens.
UNI: el CME también planea futuros de UNI, dándole un catalizador similar de derivados institucionales.
Así que, en lugar de perseguir a ciegas la vela verde más grande, estoy vigilando el volumen + el nivel del breakout + el re-test de soporte.
Si el mercado sigue rotando hacia estos Alts de gran capitalización, los ganadores de hoy podrían convertirse en las operaciones de impulso de mañana, pero después de un movimiento del 20–30%, la entrada importa más que el titular.
{future}(BCHUSDT)
{future}(ZROUSDT)
{future}(TIAUSDT)
¡Vuelven los principales ganadores con impulso! 🔥
El ranking de hoy es interesante porque esto no es solo una pequeña bomba de cap.
$BCH +30.53%
$ZRO +27.11%
$TIA +21.10%
$PENGU +17.11%
$BSV +16.48%
$UNI +12.85%
$PONS +10.47%
$ARB +10.16%
La noticia más grande es BCH. El movimiento está relacionado con los planes del CME para futuros de BCH regulados, programados para el 19 de octubre, a la espera de la aprobación regulatoria. BCH también se ha abierto paso en una zona de máximos de varios meses con un volumen alto.
Pero aquí está la parte importante 👇
Una moneda que ya subió 30% no significa automáticamente que sea la que tiene más recorrido alcista restante.
ZRO tiene otro catalizador fundamental interesante: Anchorage Digital seleccionó LayerZero para la infraestructura de interoperabilidad de stablecoins emitidas por bancos, incluyendo el USAT de Tether.
TIA también merece atención porque la nueva propuesta de Celestia para una Economía Sostenible de Blobs podría cambiar la economía a largo plazo del token si, en el futuro, los ingresos del protocolo llegan a reemplazar parte de la emisión.
Mi lógica de lista de seguimiento
BCH: el catalizador actual más fuerte, pero después de un movimiento diario de ~30%, el riesgo de retroceso importa.
ZRO: la continuación depende de si el breakout de hoy se mantiene y el volumen sigue siendo fuerte.
TIA: combinación interesante de rebote técnico + narrativa de nueva economía de tokens.
UNI: el CME también planea futuros de UNI, dándole un catalizador similar de derivados institucionales.
Así que, en lugar de perseguir a ciegas la vela verde más grande, estoy vigilando el volumen + el nivel del breakout + el re-test de soporte.
Si el mercado sigue rotando hacia estos Alts de gran capitalización, los ganadores de hoy podrían convertirse en las operaciones de impulso de mañana, pero después de un movimiento del 20–30%, la entrada importa más que el titular.
El ranking de hoy es interesante porque esto no es solo una pequeña bomba de cap.
$BCH +30.53%
$ZRO +27.11%
$TIA +21.10%
$PENGU +17.11%
$BSV +16.48%
$UNI +12.85%
$PONS +10.47%
$ARB +10.16%
La noticia más grande es BCH. El movimiento está relacionado con los planes del CME para futuros de BCH regulados, programados para el 19 de octubre, a la espera de la aprobación regulatoria. BCH también se ha abierto paso en una zona de máximos de varios meses con un volumen alto.
Pero aquí está la parte importante 👇
Una moneda que ya subió 30% no significa automáticamente que sea la que tiene más recorrido alcista restante.
ZRO tiene otro catalizador fundamental interesante: Anchorage Digital seleccionó LayerZero para la infraestructura de interoperabilidad de stablecoins emitidas por bancos, incluyendo el USAT de Tether.
TIA también merece atención porque la nueva propuesta de Celestia para una Economía Sostenible de Blobs podría cambiar la economía a largo plazo del token si, en el futuro, los ingresos del protocolo llegan a reemplazar parte de la emisión.
Mi lógica de lista de seguimiento
BCH: el catalizador actual más fuerte, pero después de un movimiento diario de ~30%, el riesgo de retroceso importa.
ZRO: la continuación depende de si el breakout de hoy se mantiene y el volumen sigue siendo fuerte.
TIA: combinación interesante de rebote técnico + narrativa de nueva economía de tokens.
UNI: el CME también planea futuros de UNI, dándole un catalizador similar de derivados institucionales.
Así que, en lugar de perseguir a ciegas la vela verde más grande, estoy vigilando el volumen + el nivel del breakout + el re-test de soporte.
Si el mercado sigue rotando hacia estos Alts de gran capitalización, los ganadores de hoy podrían convertirse en las operaciones de impulso de mañana, pero después de un movimiento del 20–30%, la entrada importa más que el titular.
1
315
#AIStocksWhatNext
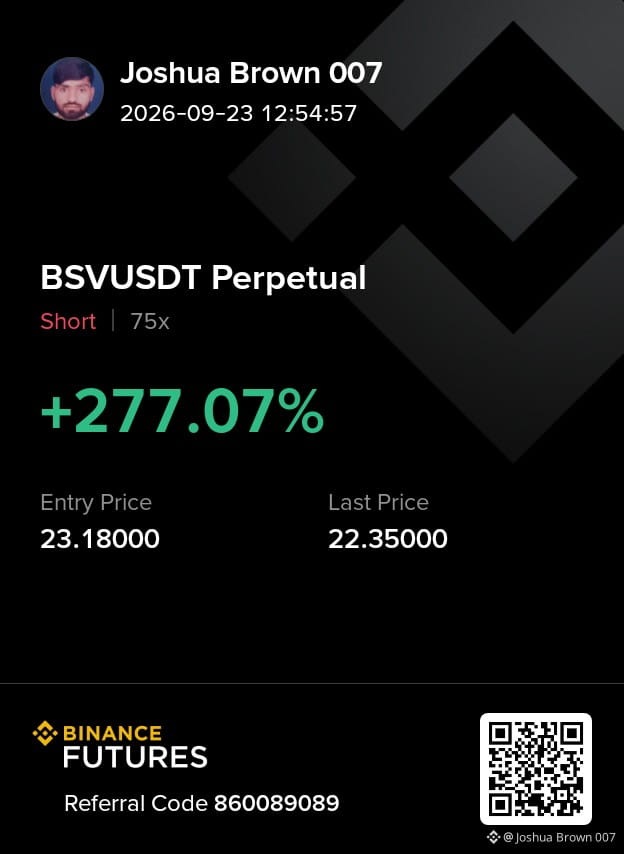
Necesidad de comercio calcular el mercado + pasión y esperar el resultado😎
{future}(BSVUSDT)
[https://www.binance.info/en/futures/ref/860089089](https://www.binance.info/en/futures/ref/860089089)
#AIStocksWhatNext
Necesidad de comercio calcular el mercado + pasión y esperar el resultado😎
https://www.binance.info/en/futures/ref/860089089
Necesidad de comercio calcular el mercado + pasión y esperar el resultado😎
https://www.binance.info/en/futures/ref/860089089
130
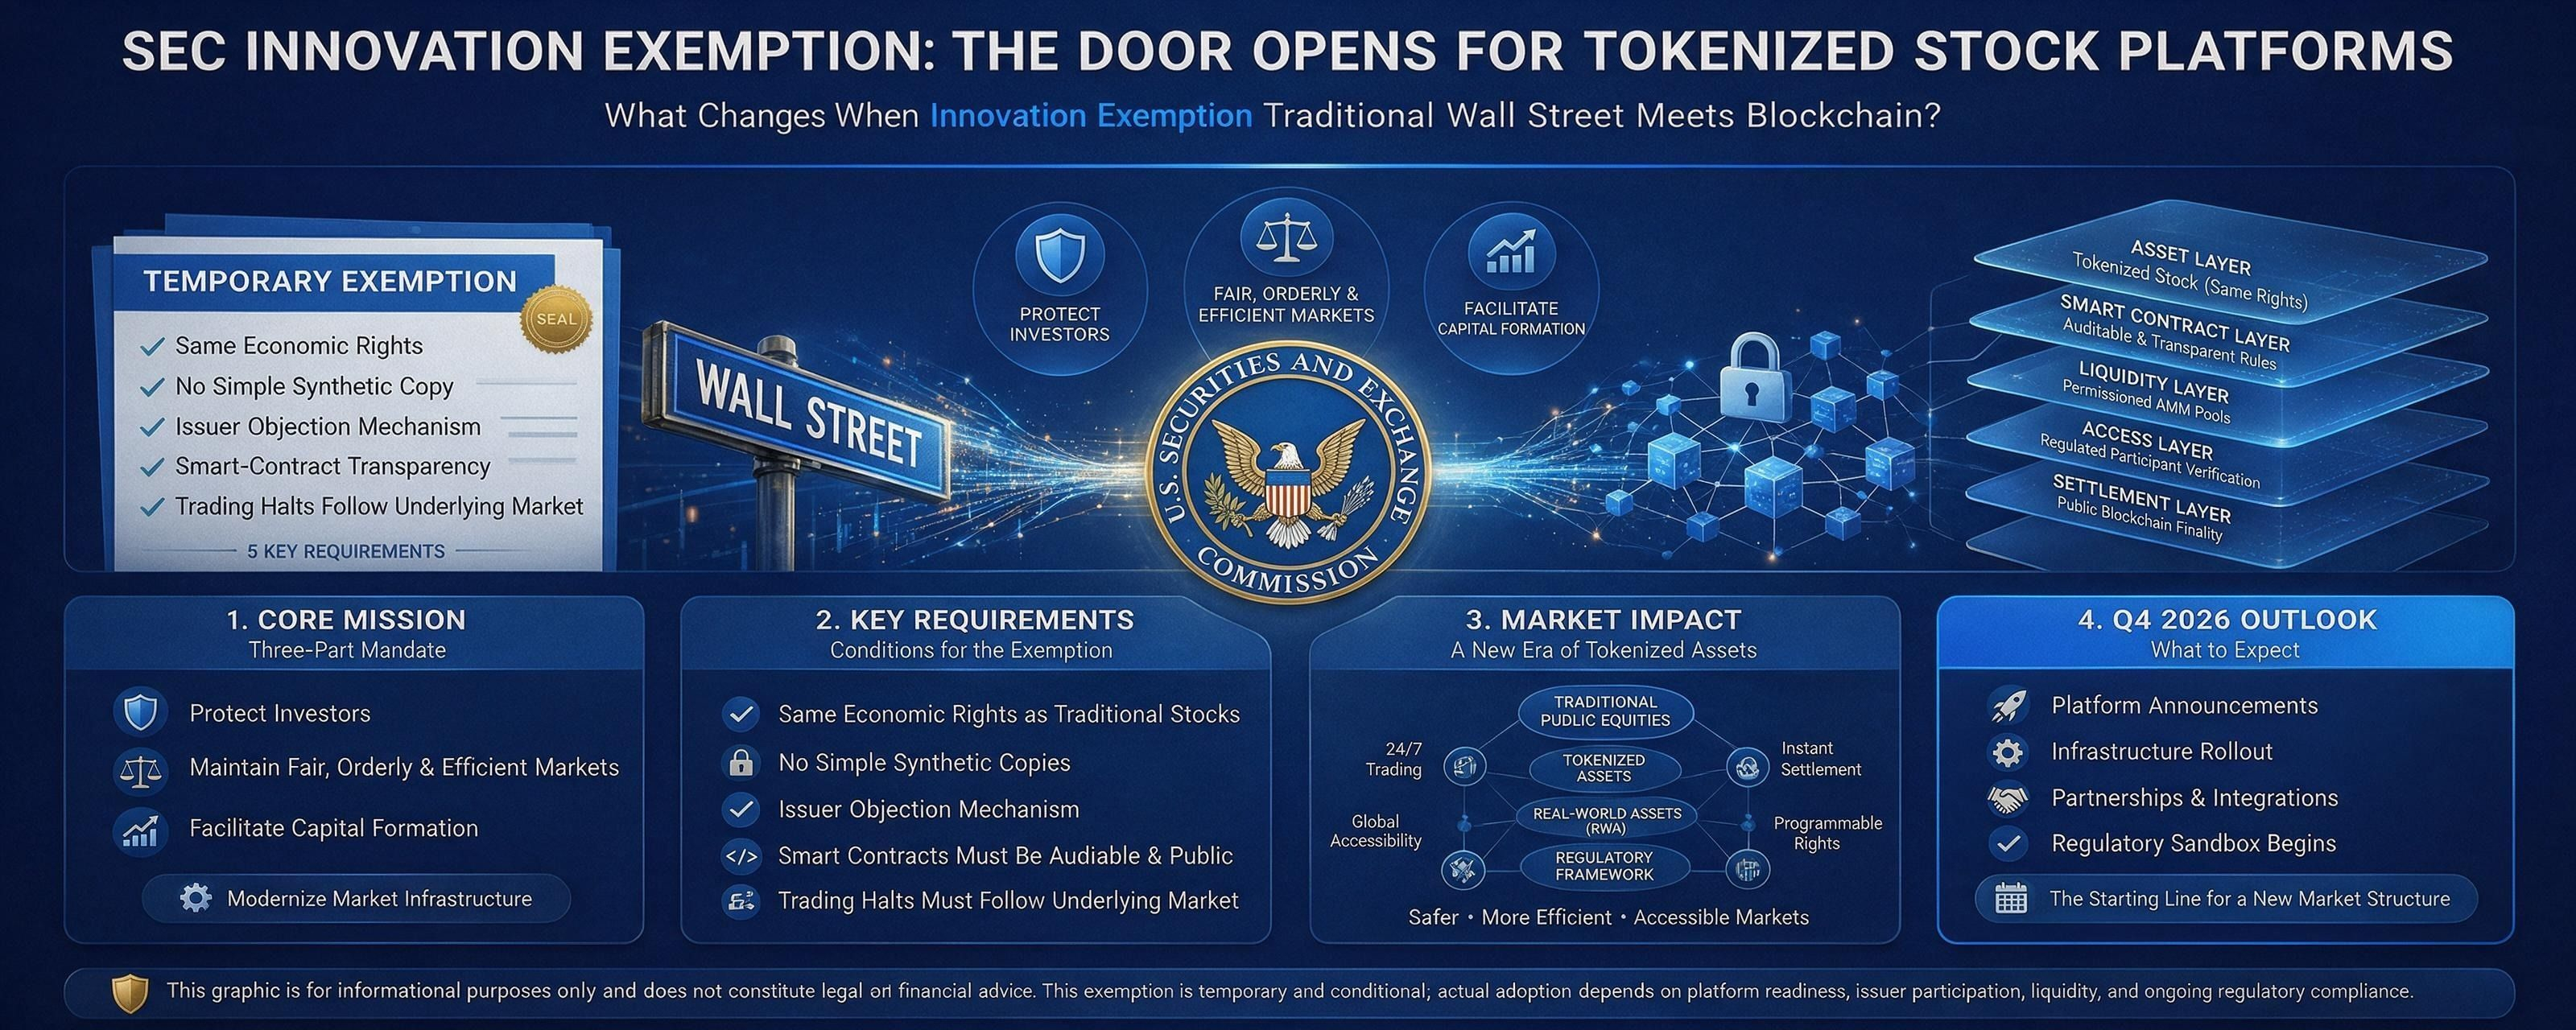
Artículo
La Exención de Innovación de la SEC Podría Abrir la Puerta a Plataformas de Acciones Tokenizadas en el Q4Algo importante está cambiando entre la banca tradicional de Wall Street y la blockchain.
El 17 de septiembre de 2026, la Comisión de Bolsa y Valores de Estados Unidos (SEC) introdujo su Exención Temporal de Innovación, creando una vía regulatoria para que ciertas plataformas negocien acciones tokenizadas de EE. UU. en entornos basados en blockchain. El desarrollo podría permitir que las plataformas interesadas en acciones tokenizadas anuncien planes ya en el Q4 de 2026.
Pero antes de analizar el impacto en las criptomonedas, es importante entender qué hace realmente la SEC.
La Exención de Innovación de la SEC Podría Abrir la Puerta a Plataformas de Acciones Tokenizadas en el Q4
Algo importante está cambiando entre la banca tradicional de Wall Street y la blockchain.
El 17 de septiembre de 2026, la Comisión de Bolsa y Valores de Estados Unidos (SEC) introdujo su Exención Temporal de Innovación, creando una vía regulatoria para que ciertas plataformas negocien acciones tokenizadas de EE. UU. en entornos basados en blockchain. El desarrollo podría permitir que las plataformas interesadas en acciones tokenizadas anuncien planes ya en el Q4 de 2026.
Pero antes de analizar el impacto en las criptomonedas, es importante entender qué hace realmente la SEC.
El 17 de septiembre de 2026, la Comisión de Bolsa y Valores de Estados Unidos (SEC) introdujo su Exención Temporal de Innovación, creando una vía regulatoria para que ciertas plataformas negocien acciones tokenizadas de EE. UU. en entornos basados en blockchain. El desarrollo podría permitir que las plataformas interesadas en acciones tokenizadas anuncien planes ya en el Q4 de 2026.
Pero antes de analizar el impacto en las criptomonedas, es importante entender qué hace realmente la SEC.
1
178
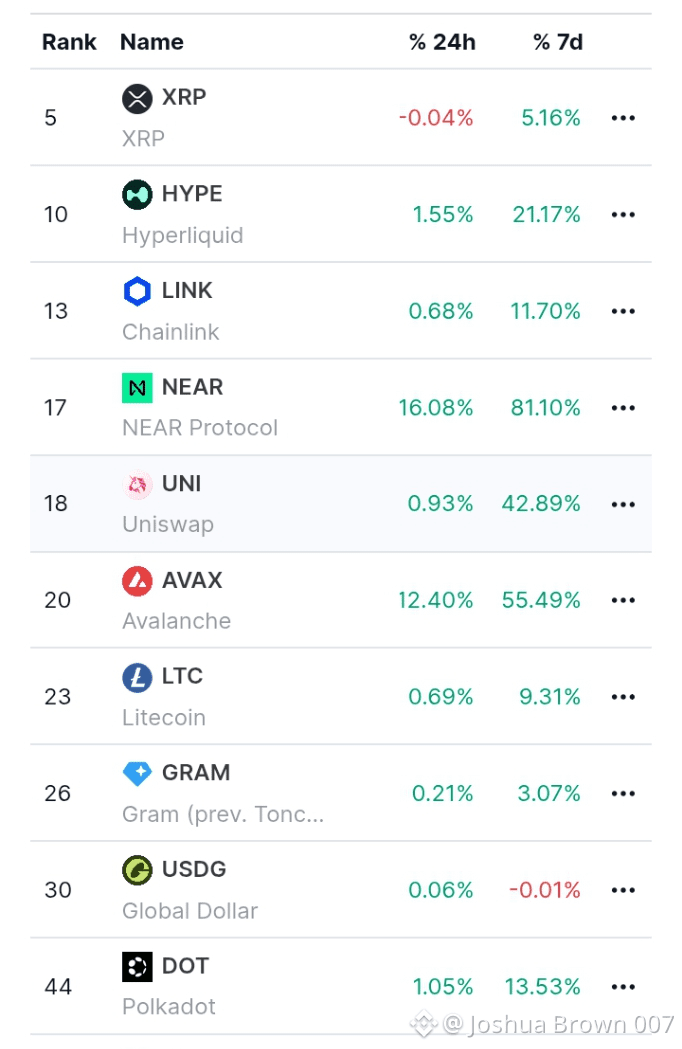
Top 10 activos por volumen Resumen del mercado de criptomonedas | 20 de septiembre de 2026.
La rotación se está poniendo interesante
Los datos del 20 de septiembre muestran un fuerte impulso de 7 días en varios grandes altcoins.
🔹 $NEAR: +81.10% en 7D el mayor movimiento de este grupo
🔹 $AVAX: +55.49%
🔹 $UNI: +42.89%
🔹 $HYPE: +21.17%
🔹 $DOT: +13.53%
🔹 $LINK: +11.70%
🔹 $LTC: +9.31%
🔹 $XRP: +5.16%
La parte interesante es el volumen.
$XRP negoció $2.69B, $NEAR $2.05B, $AVAX $1.48B y $HYPE $854M en 24 h.
Esto no es solo un movimiento de precio: el capital y el volumen están rotando entre distintos sectores.
Pero después de ganancias semanales tan marcadas, la volatilidad puede expandirse rápidamente.
Estoy observando si el volumen continúa confirmando el movimiento o si empieza a perder fuerza.
No persigo las velas. Observo el flujo.
Top 10 activos por volumen Resumen del mercado de criptomonedas | 20 de septiembre de 2026.
La rotación se está poniendo interesante
Los datos del 20 de septiembre muestran un fuerte impulso de 7 días en varios grandes altcoins.
🔹 $NEAR: +81.10% en 7D el mayor movimiento de este grupo
🔹 $AVAX: +55.49%
🔹 $UNI: +42.89%
🔹 $HYPE: +21.17%
🔹 $DOT: +13.53%
🔹 $LINK: +11.70%
🔹 $LTC: +9.31%
🔹 $XRP: +5.16%
La parte interesante es el volumen.
$XRP negoció $2.69B, $NEAR $2.05B, $AVAX $1.48B y $HYPE $854M en 24 h.
Esto no es solo un movimiento de precio: el capital y el volumen están rotando entre distintos sectores.
Pero después de ganancias semanales tan marcadas, la volatilidad puede expandirse rápidamente.
Estoy observando si el volumen continúa confirmando el movimiento o si empieza a perder fuerza.
No persigo las velas. Observo el flujo.
La rotación se está poniendo interesante
Los datos del 20 de septiembre muestran un fuerte impulso de 7 días en varios grandes altcoins.
🔹 $NEAR: +81.10% en 7D el mayor movimiento de este grupo
🔹 $AVAX: +55.49%
🔹 $UNI: +42.89%
🔹 $HYPE: +21.17%
🔹 $DOT: +13.53%
🔹 $LINK: +11.70%
🔹 $LTC: +9.31%
🔹 $XRP: +5.16%
La parte interesante es el volumen.
$XRP negoció $2.69B, $NEAR $2.05B, $AVAX $1.48B y $HYPE $854M en 24 h.
Esto no es solo un movimiento de precio: el capital y el volumen están rotando entre distintos sectores.
Pero después de ganancias semanales tan marcadas, la volatilidad puede expandirse rápidamente.
Estoy observando si el volumen continúa confirmando el movimiento o si empieza a perder fuerza.
No persigo las velas. Observo el flujo.
1
386
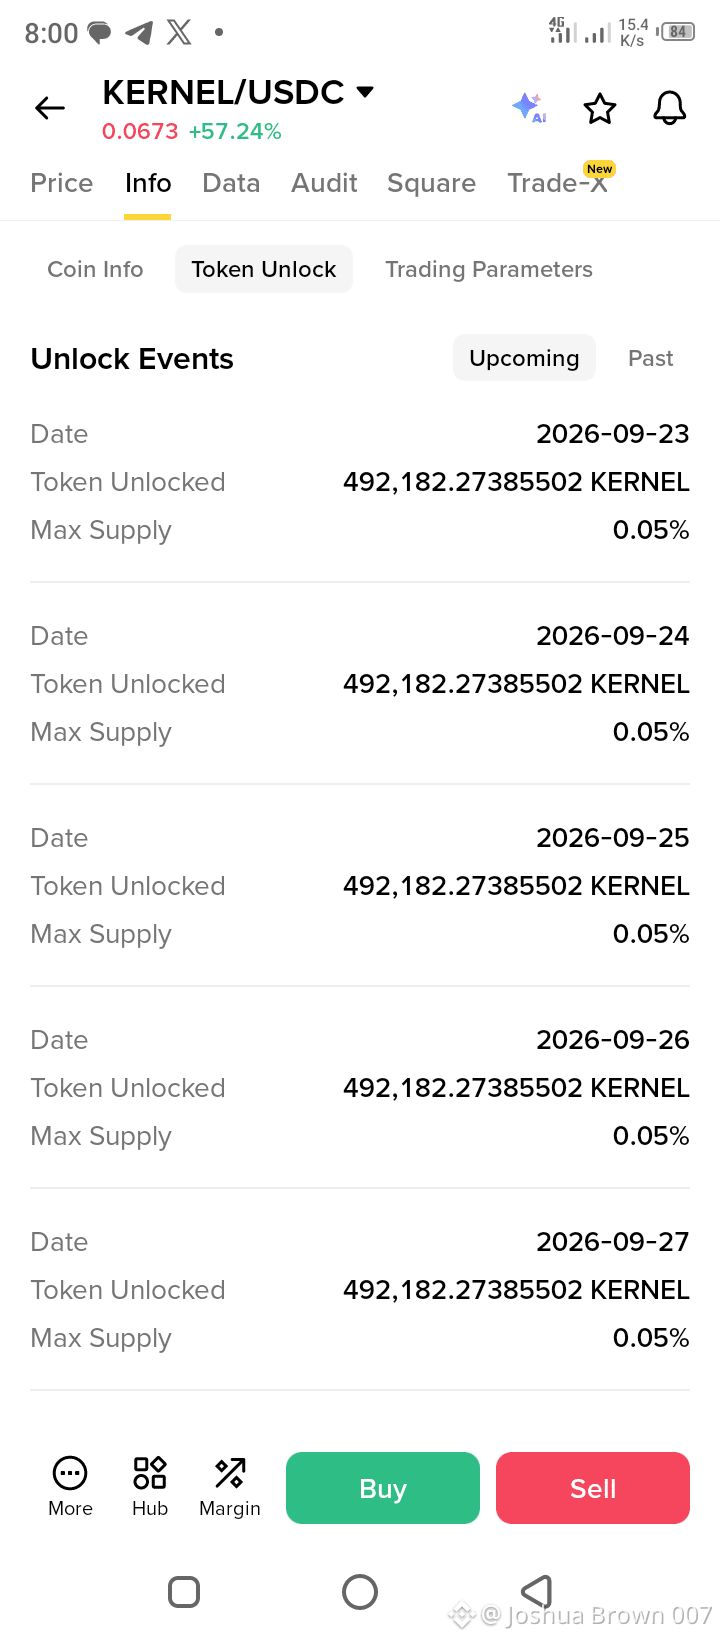
$KERNEL sube con fuerza, pero mañana comienza una prueba de suministro.
KERNEL está alrededor de 0,0673 dólares, ya +57% en la pantalla que estoy viendo.
Pero a partir del 23 de sept., el calendario de desbloqueo del token muestra:
492,182 KERNEL cada día = 0,05% del suministro máximo
23 de sept. → 24 → 25 → 26 → 27…
Este mismo ritmo continúa, eso es ~1% del suministro máximo en los próximos 20 días.
Con un precio de 0,0673 dólares, cada desbloqueo diario equivale a aproximadamente 33K dólares en tokens.
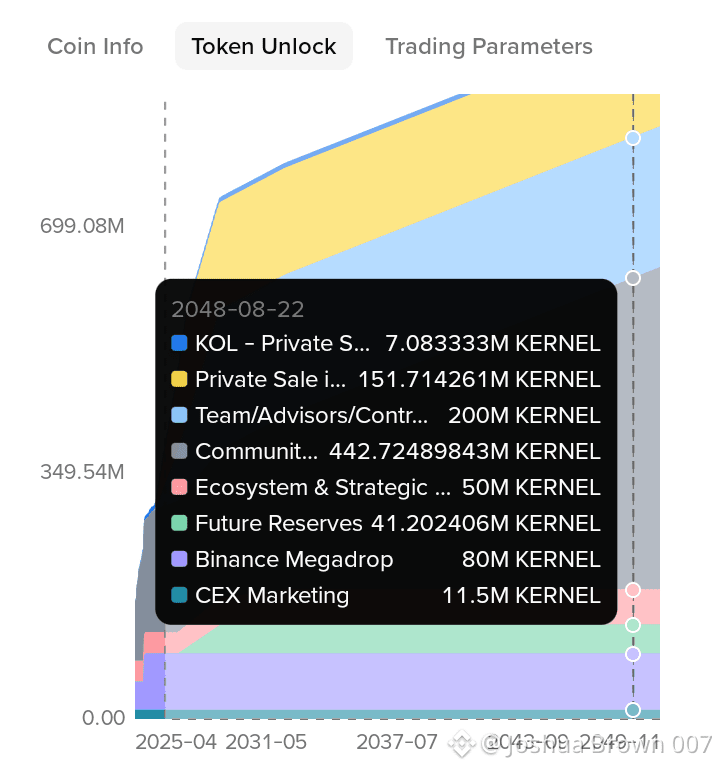
Eso suena pequeño, pero el suministro en circulación de KERNEL es solo alrededor del 28,8% del suministro máximo de 1B, así que incluso una liberación diaria relativamente pequeña aumenta la oferta disponible.
Tokenomist +1
La parte interesante:
El precio está subiendo +57%, mientras entra un nuevo suministro a diario.
Eso crea dos fuerzas:
🟢 Un volumen fuerte puede absorber los nuevos tokens
🔴 Una demanda débil puede convertir los desbloqueos en presión vendedora
Y KERNEL históricamente ha mostrado una volatilidad notable alrededor de eventos de desbloqueo más grandes; los desbloqueos anteriores fueron seguidos por caídas en varios períodos, aunque eso no significa que necesariamente deba repetirse el mismo patrón.
Así que mañana estaré observando:
Precio + Volumen + entradas a CEX + desbloqueos diarios
El impulso es una historia.
La oferta que entra al mercado es la historia que estoy observando a continuación.
#DAO #ARB🔥🔥🔥 #NEARRisesNearly80%InAWeek
{future}(KERNELUSDT)
{future}(ARBUSDT)
{future}(NEARUSDT)
$KERNEL sube con fuerza, pero mañana comienza una prueba de suministro.
KERNEL está alrededor de 0,0673 dólares, ya +57% en la pantalla que estoy viendo.
Pero a partir del 23 de sept., el calendario de desbloqueo del token muestra:
492,182 KERNEL cada día = 0,05% del suministro máximo
23 de sept. → 24 → 25 → 26 → 27…
Este mismo ritmo continúa, eso es ~1% del suministro máximo en los próximos 20 días.
Con un precio de 0,0673 dólares, cada desbloqueo diario equivale a aproximadamente 33K dólares en tokens.
Eso suena pequeño, pero el suministro en circulación de KERNEL es solo alrededor del 28,8% del suministro máximo de 1B, así que incluso una liberación diaria relativamente pequeña aumenta la oferta disponible.
Tokenomist +1
La parte interesante:
El precio está subiendo +57%, mientras entra un nuevo suministro a diario.
Eso crea dos fuerzas:
🟢 Un volumen fuerte puede absorber los nuevos tokens
🔴 Una demanda débil puede convertir los desbloqueos en presión vendedora
Y KERNEL históricamente ha mostrado una volatilidad notable alrededor de eventos de desbloqueo más grandes; los desbloqueos anteriores fueron seguidos por caídas en varios períodos, aunque eso no significa que necesariamente deba repetirse el mismo patrón.
Así que mañana estaré observando:
Precio + Volumen + entradas a CEX + desbloqueos diarios
El impulso es una historia.
La oferta que entra al mercado es la historia que estoy observando a continuación.
#DAO #ARB🔥🔥🔥 #NEARRisesNearly80%InAWeek
KERNEL está alrededor de 0,0673 dólares, ya +57% en la pantalla que estoy viendo.
Pero a partir del 23 de sept., el calendario de desbloqueo del token muestra:
492,182 KERNEL cada día = 0,05% del suministro máximo
23 de sept. → 24 → 25 → 26 → 27…
Este mismo ritmo continúa, eso es ~1% del suministro máximo en los próximos 20 días.
Con un precio de 0,0673 dólares, cada desbloqueo diario equivale a aproximadamente 33K dólares en tokens.
Eso suena pequeño, pero el suministro en circulación de KERNEL es solo alrededor del 28,8% del suministro máximo de 1B, así que incluso una liberación diaria relativamente pequeña aumenta la oferta disponible.
Tokenomist +1
La parte interesante:
El precio está subiendo +57%, mientras entra un nuevo suministro a diario.
Eso crea dos fuerzas:
🟢 Un volumen fuerte puede absorber los nuevos tokens
🔴 Una demanda débil puede convertir los desbloqueos en presión vendedora
Y KERNEL históricamente ha mostrado una volatilidad notable alrededor de eventos de desbloqueo más grandes; los desbloqueos anteriores fueron seguidos por caídas en varios períodos, aunque eso no significa que necesariamente deba repetirse el mismo patrón.
Así que mañana estaré observando:
Precio + Volumen + entradas a CEX + desbloqueos diarios
El impulso es una historia.
La oferta que entra al mercado es la historia que estoy observando a continuación.
#DAO #ARB🔥🔥🔥 #NEARRisesNearly80%InAWeek
1
1
450
#Binance
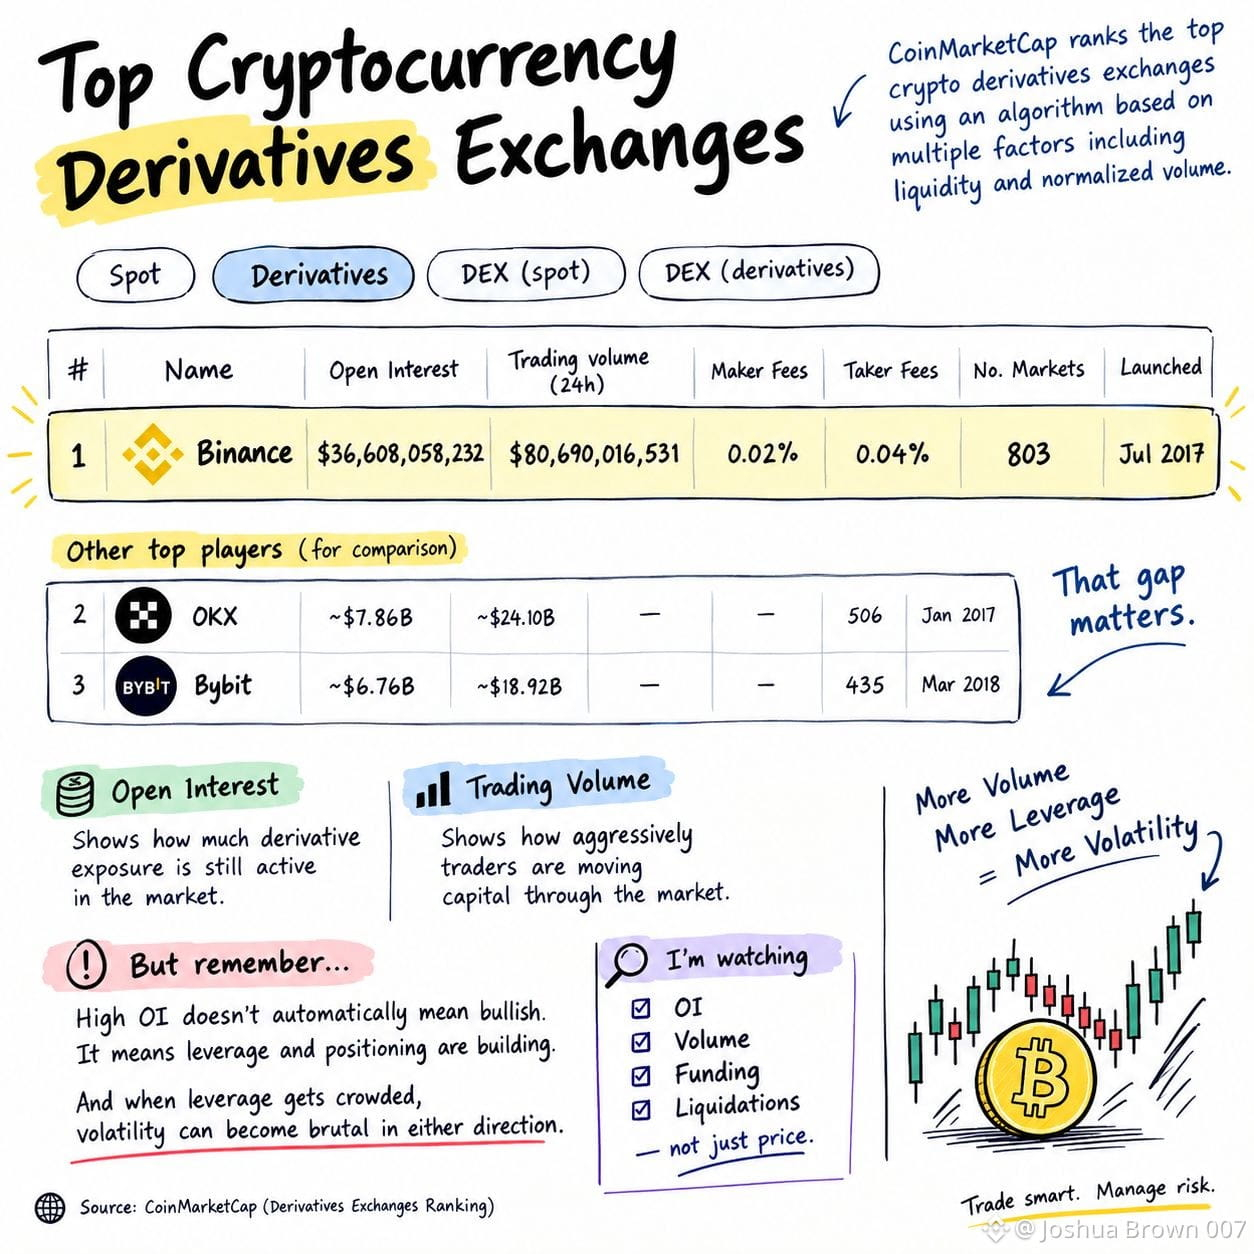
Revisé los últimos datos de derivados de CoinMarketCap y hay un número que destaca de inmediato:
El exchange de la ecósistema de $BNB, Binance, sigue dominando los derivados.
Binance • $35.09B Interés Abierto • $51.10B volumen de derivados en 24H • 803 mercados • 0.02% comisión maker • 0.04% comisión taker
Como comparación, OKX tiene ~ $7.86B de OI y Bybit ~ $6.76B.
Esa brecha importa.
El Interés Abierto muestra cuánta exposición a derivados sigue activa, mientras que el volumen muestra con qué agresividad los traders están moviendo capital a través del mercado.
Pero recuerda: un alto OI no significa automáticamente que sea alcista.
Significa que el apalancamiento y las posiciones están aumentando.
Y cuando el apalancamiento se llena, la volatilidad puede volverse brutal en cualquier dirección.
Estoy observando OI + volumen + financiación + liquidaciones en conjunto, no solo el precio.
{spot}(BNBUSDT)
$PHA
{future}(PHAUSDT)
$SUI
{future}(SUIUSDT)
#Binance
Revisé los últimos datos de derivados de CoinMarketCap y hay un número que destaca de inmediato:
El exchange de la ecósistema de $BNB, Binance, sigue dominando los derivados.
Binance • $35.09B Interés Abierto • $51.10B volumen de derivados en 24H • 803 mercados • 0.02% comisión maker • 0.04% comisión taker
Como comparación, OKX tiene ~ $7.86B de OI y Bybit ~ $6.76B.
Esa brecha importa.
El Interés Abierto muestra cuánta exposición a derivados sigue activa, mientras que el volumen muestra con qué agresividad los traders están moviendo capital a través del mercado.
Pero recuerda: un alto OI no significa automáticamente que sea alcista.
Significa que el apalancamiento y las posiciones están aumentando.
Y cuando el apalancamiento se llena, la volatilidad puede volverse brutal en cualquier dirección.
Estoy observando OI + volumen + financiación + liquidaciones en conjunto, no solo el precio.
$PHA
$SUI
Revisé los últimos datos de derivados de CoinMarketCap y hay un número que destaca de inmediato:
El exchange de la ecósistema de $BNB, Binance, sigue dominando los derivados.
Binance • $35.09B Interés Abierto • $51.10B volumen de derivados en 24H • 803 mercados • 0.02% comisión maker • 0.04% comisión taker
Como comparación, OKX tiene ~ $7.86B de OI y Bybit ~ $6.76B.
Esa brecha importa.
El Interés Abierto muestra cuánta exposición a derivados sigue activa, mientras que el volumen muestra con qué agresividad los traders están moviendo capital a través del mercado.
Pero recuerda: un alto OI no significa automáticamente que sea alcista.
Significa que el apalancamiento y las posiciones están aumentando.
Y cuando el apalancamiento se llena, la volatilidad puede volverse brutal en cualquier dirección.
Estoy observando OI + volumen + financiación + liquidaciones en conjunto, no solo el precio.
$PHA
$SUI
1
206
#BTC☀
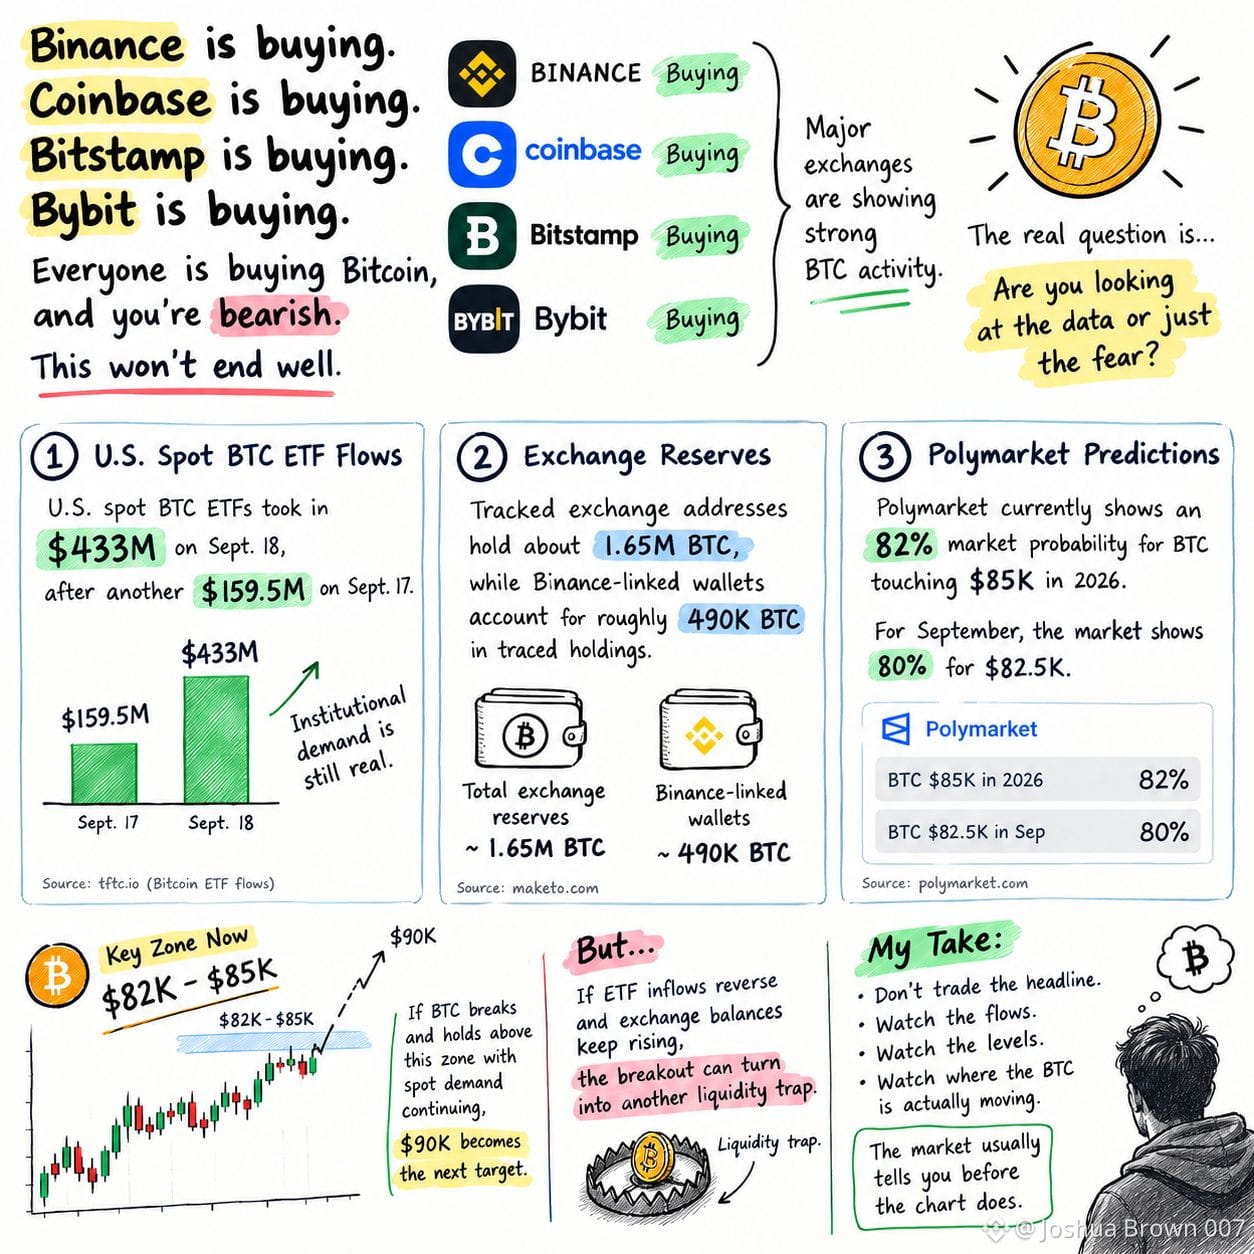
¿Estás esperando una caída de 64K dólares para Bitcoin? Veamos una vista de la compra institucional y la demanda.
Lo interesante no es solo la narrativa; los datos están empezando a mostrar una división entre la liquidez en los exchanges y la demanda institucional.
Datos recientes muestran que los ETF spot de BTC en EE. UU. recibieron 433M de dólares el 18 de sept., después de otros 159.5M de dólares el 17 de sept.
TFTC +1
Al mismo tiempo, las direcciones de exchange monitoreadas sostienen cerca de 1.65M BTC, mientras que las billeteras vinculadas a Binance registran aproximadamente 490K BTC en tenencias rastreadas.
Y Polymarket actualmente muestra una probabilidad de mercado del 82% para que el BTC toque 85K dólares en 2026, mientras que el mercado de septiembre marca 80% para 82.5K.
Mi opinión:
82K–85K es la zona clave ahora.
Si el BTC se rompe y se mantiene por encima, con la demanda spot continuando, 90K se convierte en el siguiente objetivo psicológico.
Pero si las entradas de los ETF se invierten y los saldos en exchanges siguen subiendo, la ruptura puede convertirse en otra trampa de liquidez.
No operes el titular.
Observa los flujos. Observa los niveles. Mira dónde se está moviendo realmente el BTC.
El mercado suele decírtelo antes de que lo haga el gráfico.$BTC
{spot}(BTCUSDT)
#BTC☀
¿Estás esperando una caída de 64K dólares para Bitcoin? Veamos una vista de la compra institucional y la demanda.
Lo interesante no es solo la narrativa; los datos están empezando a mostrar una división entre la liquidez en los exchanges y la demanda institucional.
Datos recientes muestran que los ETF spot de BTC en EE. UU. recibieron 433M de dólares el 18 de sept., después de otros 159.5M de dólares el 17 de sept.
TFTC +1
Al mismo tiempo, las direcciones de exchange monitoreadas sostienen cerca de 1.65M BTC, mientras que las billeteras vinculadas a Binance registran aproximadamente 490K BTC en tenencias rastreadas.
Y Polymarket actualmente muestra una probabilidad de mercado del 82% para que el BTC toque 85K dólares en 2026, mientras que el mercado de septiembre marca 80% para 82.5K.
Mi opinión:
82K–85K es la zona clave ahora.
Si el BTC se rompe y se mantiene por encima, con la demanda spot continuando, 90K se convierte en el siguiente objetivo psicológico.
Pero si las entradas de los ETF se invierten y los saldos en exchanges siguen subiendo, la ruptura puede convertirse en otra trampa de liquidez.
No operes el titular.
Observa los flujos. Observa los niveles. Mira dónde se está moviendo realmente el BTC.
El mercado suele decírtelo antes de que lo haga el gráfico.$BTC
¿Estás esperando una caída de 64K dólares para Bitcoin? Veamos una vista de la compra institucional y la demanda.
Lo interesante no es solo la narrativa; los datos están empezando a mostrar una división entre la liquidez en los exchanges y la demanda institucional.
Datos recientes muestran que los ETF spot de BTC en EE. UU. recibieron 433M de dólares el 18 de sept., después de otros 159.5M de dólares el 17 de sept.
TFTC +1
Al mismo tiempo, las direcciones de exchange monitoreadas sostienen cerca de 1.65M BTC, mientras que las billeteras vinculadas a Binance registran aproximadamente 490K BTC en tenencias rastreadas.
Y Polymarket actualmente muestra una probabilidad de mercado del 82% para que el BTC toque 85K dólares en 2026, mientras que el mercado de septiembre marca 80% para 82.5K.
Mi opinión:
82K–85K es la zona clave ahora.
Si el BTC se rompe y se mantiene por encima, con la demanda spot continuando, 90K se convierte en el siguiente objetivo psicológico.
Pero si las entradas de los ETF se invierten y los saldos en exchanges siguen subiendo, la ruptura puede convertirse en otra trampa de liquidez.
No operes el titular.
Observa los flujos. Observa los niveles. Mira dónde se está moviendo realmente el BTC.
El mercado suele decírtelo antes de que lo haga el gráfico.$BTC
1
69
$TRUMP ALERTA EN CADENA
El equipo de Trump Meme acaba de mover otros 8.73M $TRUMP (~$17.99M) a la custodia de BitGo.
Esto eleva el total de 2 semanas a ~31M TRUMP, con un valor de ~$70.64M.
Pero aquí está la parte importante:
⚠️ La custodia en BitGo ≠ venta confirmada.
Así que estoy vigilando el próximo movimiento de la billetera, no asumiendo un desplome.
📉 Impacto en el precio si se vende:
Una gran cantidad de oferta vinculada a un equipo que entre a la liquidez del mercado podría aumentar la presión vendedora y debilitar el soporte. Si después aparecen depósitos en exchanges, el riesgo de un movimiento más brusco aumenta.
📊 Niveles técnicos a vigilar:
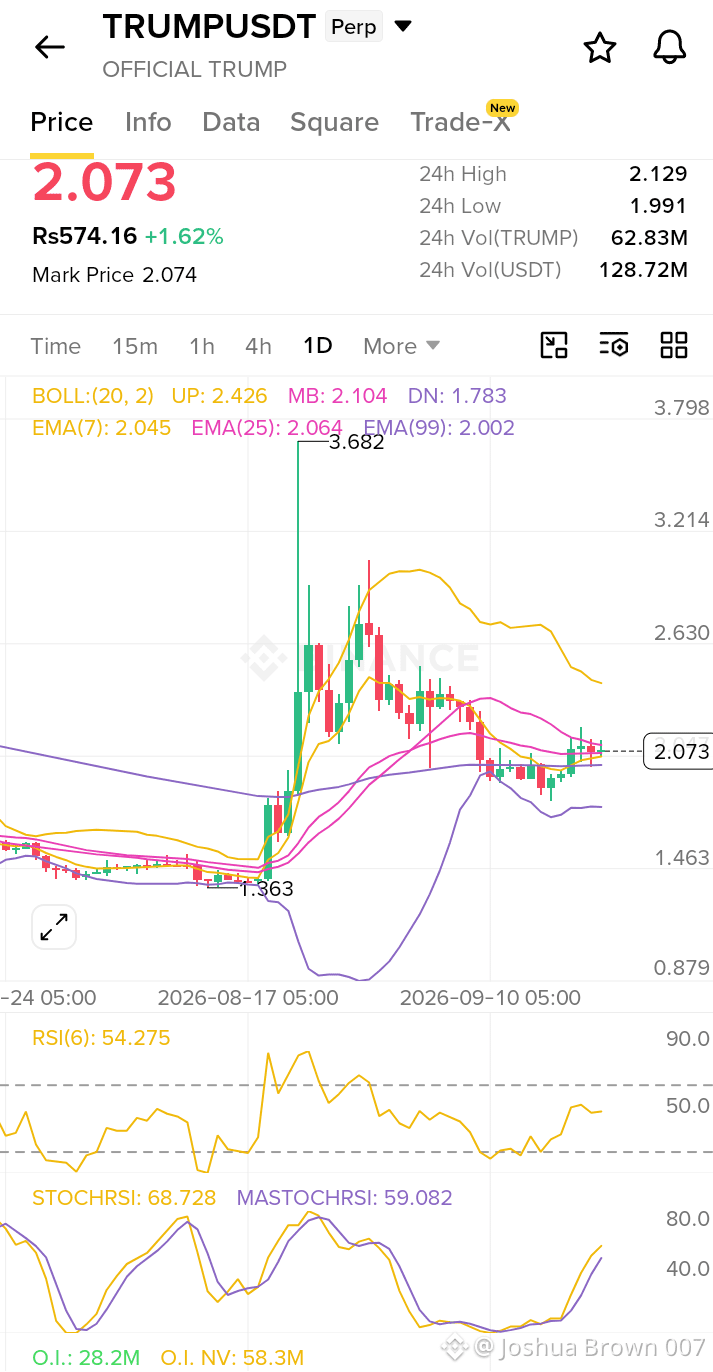
El reporte actual sitúa $TRUMP alrededor de $2.05, con resistencia cerca de $2.14 y soporte alrededor de $1.96. El precio también está cerca de la zona de la EMA 50/200, lo que la convierte en un área importante para la confirmación.
Mi enfoque: No vender en pánico. No comprar ciegamente la caída.
Vigila: → BitGo → transferencias a exchanges
→ Volumen spot
→ Soporte $1.96
→ Ruptura $2.14
→ Salidas/entradas de la billetera
Si $1.96 se rompe con volumen fuerte, la presión a la baja puede acelerarse.
Si $2.14 se recupera con volumen spot fuerte, el mercado podría absorber la oferta.
Primero flujo on-chain. Segundo confirmación del precio.
{future}(TRUMPUSDT)
{future}(MELANIAUSDT)
{future}(WLFIUSDT)
#TrumpCrypto #XRPExchangeReservesHitSevenYearLow #trumpcoin
$TRUMP ALERTA EN CADENA
El equipo de Trump Meme acaba de mover otros 8.73M $TRUMP (~$17.99M) a la custodia de BitGo.
Esto eleva el total de 2 semanas a ~31M TRUMP, con un valor de ~$70.64M.
Pero aquí está la parte importante:
⚠️ La custodia en BitGo ≠ venta confirmada.
Así que estoy vigilando el próximo movimiento de la billetera, no asumiendo un desplome.
📉 Impacto en el precio si se vende:
Una gran cantidad de oferta vinculada a un equipo que entre a la liquidez del mercado podría aumentar la presión vendedora y debilitar el soporte. Si después aparecen depósitos en exchanges, el riesgo de un movimiento más brusco aumenta.
📊 Niveles técnicos a vigilar:
El reporte actual sitúa $TRUMP alrededor de $2.05, con resistencia cerca de $2.14 y soporte alrededor de $1.96. El precio también está cerca de la zona de la EMA 50/200, lo que la convierte en un área importante para la confirmación.
Mi enfoque: No vender en pánico. No comprar ciegamente la caída.
Vigila: → BitGo → transferencias a exchanges
→ Volumen spot
→ Soporte $1.96
→ Ruptura $2.14
→ Salidas/entradas de la billetera
Si $1.96 se rompe con volumen fuerte, la presión a la baja puede acelerarse.
Si $2.14 se recupera con volumen spot fuerte, el mercado podría absorber la oferta.
Primero flujo on-chain. Segundo confirmación del precio.
#TrumpCrypto #XRPExchangeReservesHitSevenYearLow #trumpcoin
El equipo de Trump Meme acaba de mover otros 8.73M $TRUMP (~$17.99M) a la custodia de BitGo.
Esto eleva el total de 2 semanas a ~31M TRUMP, con un valor de ~$70.64M.
Pero aquí está la parte importante:
⚠️ La custodia en BitGo ≠ venta confirmada.
Así que estoy vigilando el próximo movimiento de la billetera, no asumiendo un desplome.
📉 Impacto en el precio si se vende:
Una gran cantidad de oferta vinculada a un equipo que entre a la liquidez del mercado podría aumentar la presión vendedora y debilitar el soporte. Si después aparecen depósitos en exchanges, el riesgo de un movimiento más brusco aumenta.
📊 Niveles técnicos a vigilar:
El reporte actual sitúa $TRUMP alrededor de $2.05, con resistencia cerca de $2.14 y soporte alrededor de $1.96. El precio también está cerca de la zona de la EMA 50/200, lo que la convierte en un área importante para la confirmación.
Mi enfoque: No vender en pánico. No comprar ciegamente la caída.
Vigila: → BitGo → transferencias a exchanges
→ Volumen spot
→ Soporte $1.96
→ Ruptura $2.14
→ Salidas/entradas de la billetera
Si $1.96 se rompe con volumen fuerte, la presión a la baja puede acelerarse.
Si $2.14 se recupera con volumen spot fuerte, el mercado podría absorber la oferta.
Primero flujo on-chain. Segundo confirmación del precio.
#TrumpCrypto #XRPExchangeReservesHitSevenYearLow #trumpcoin

1
698
Inicia sesión para explorar más contenidos
Únete a usuarios de criptomonedas de todo el mundo en Binance Square
⚡️ Obtén la información más reciente y útil sobre criptomonedas.
💬 Confía en el mayor exchange de criptomonedas del mundo.
👍 Descubre opiniones reales de creadores verificados.
Correo electrónico/número de teléfono
Temas en tendencia
GoldFallsTo$4144
1,621 visualizaciones
55 participa(n) en el debate
#GoldFallsTo$4144 🚨 EL ORO ACABA DE RECIBIR UN GOLPE FUERTE. ¡$4,144 ES EL NIVEL A VIGILAR! 🥇📉
Los precios del oro cayeron ahora y cotizan cerca de $4,144 por onza, mientras los operadores replantean la ruta de la Reserva Federal sobre las tasas de interés.
¿Qué está empujando al oro a la baja? Esto es lo que está pasando:
🔴 Aumentan las apuestas a subidas de la Fed → Cuando las tasas de interés suben, mantener oro se vuelve más caro porque no paga ningún interés. Eso hace que los bonos o las cuentas de ahorro parezcan mejores en comparación.
🛢️ Los precios del petróleo están subiendo → Un petróleo más alto implica riesgos de inflación. Eso empuja a los bancos a mantener las tasas más altas por más tiempo, lo que perjudica al oro.
💵 Rendimientos y fortaleza del dólar → Cuando suben los rendimientos de los bonos—en especial los Treasuries de EE. UU.—y el dólar se fortalece, los inversores a menudo se mueven del oro hacia activos que generan rendimientos.
Así que el gran debate ahora es: ¿es una corrección de corto plazo después del enorme rally del oro en 2026… o es el inicio de una reversión de tendencia más profunda?
👀 Los traders necesitan vigilar dos niveles:
- $4,200. Una posible zona de soporte
- $4,144. Un nivel crítico donde la acción del precio podría cambiar en cualquier dirección
¿El oro rebotará desde aquí? ¿Veremos más presión a la baja en el futuro?
#GOLD #Khan62 #trading #Investing
$PAXG · $BTC · $XAG
Khan 62
·0 «Me gusta»
·199 visualizaciones
QNTFallsOver40%FromMorningHigh
13,750 visualizaciones
432 participa(n) en el debate
KospiFalls2.7%SamsungSKHynixDropOver5%
1,812 visualizaciones
154 participa(n) en el debate