
Crypto Man Mab 1
258 Publicaciones

Crypto Man Mab 1
Denunciar
Bloquear usuario
Top Coin Market Cap KOL - Content Writer - Trader - Investors - DM for Collab tg : @MAB350
0 Siguiendo
2 Seguidores
2 Me gusta
Publicaciones
Ver traducción
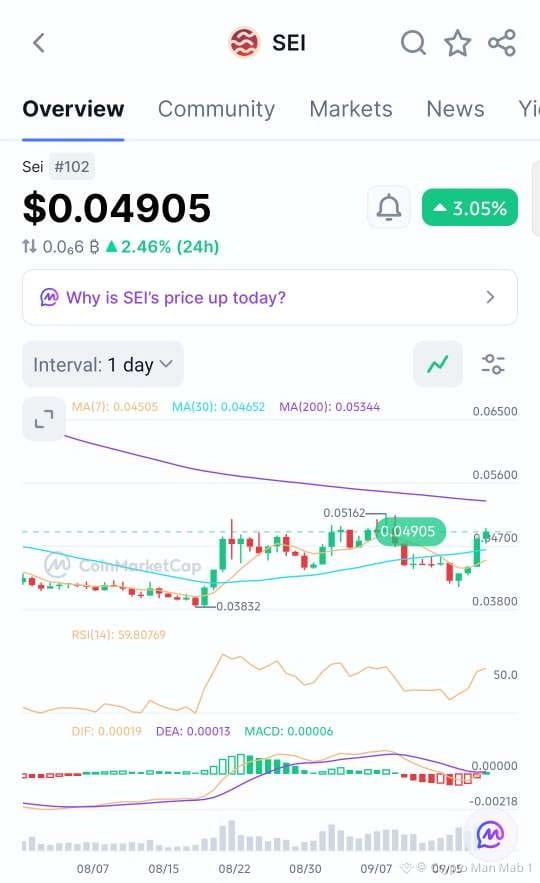
$SEI is showing signs of a recovery on the daily chart after bouncing from the $0.0383 area.
Price is now around $0.049 and has reclaimed the 30-day MA at $0.0465. The 7-day MA is also below price at $0.0450, which supports the short-term bullish structure.
RSI is around 60, so momentum is improving without being extremely overbought. MACD has also turned positive, with DIF above DEA, suggesting buyers are starting to regain control.
The main level I’m watching is $0.0516. If SEI breaks and holds above this resistance, the next important area is around $0.0534, which also lines up with the 200-day MA.
For a pullback, $0.0465–$0.0470 is the key zone to watch. Holding this area could keep the recovery structure intact.
Overall, SEI is showing improving momentum, but the $0.0516–$0.0534 zone is where the real breakout confirmation would come.
$SEI is showing signs of a recovery on the daily chart after bouncing from the $0.0383 area.
Price is now around $0.049 and has reclaimed the 30-day MA at $0.0465. The 7-day MA is also below price at $0.0450, which supports the short-term bullish structure.
RSI is around 60, so momentum is improving without being extremely overbought. MACD has also turned positive, with DIF above DEA, suggesting buyers are starting to regain control.
The main level I’m watching is $0.0516. If SEI breaks and holds above this resistance, the next important area is around $0.0534, which also lines up with the 200-day MA.
For a pullback, $0.0465–$0.0470 is the key zone to watch. Holding this area could keep the recovery structure intact.
Overall, SEI is showing improving momentum, but the $0.0516–$0.0534 zone is where the real breakout confirmation would come.
Price is now around $0.049 and has reclaimed the 30-day MA at $0.0465. The 7-day MA is also below price at $0.0450, which supports the short-term bullish structure.
RSI is around 60, so momentum is improving without being extremely overbought. MACD has also turned positive, with DIF above DEA, suggesting buyers are starting to regain control.
The main level I’m watching is $0.0516. If SEI breaks and holds above this resistance, the next important area is around $0.0534, which also lines up with the 200-day MA.
For a pullback, $0.0465–$0.0470 is the key zone to watch. Holding this area could keep the recovery structure intact.
Overall, SEI is showing improving momentum, but the $0.0516–$0.0534 zone is where the real breakout confirmation would come.
7
Ver traducción
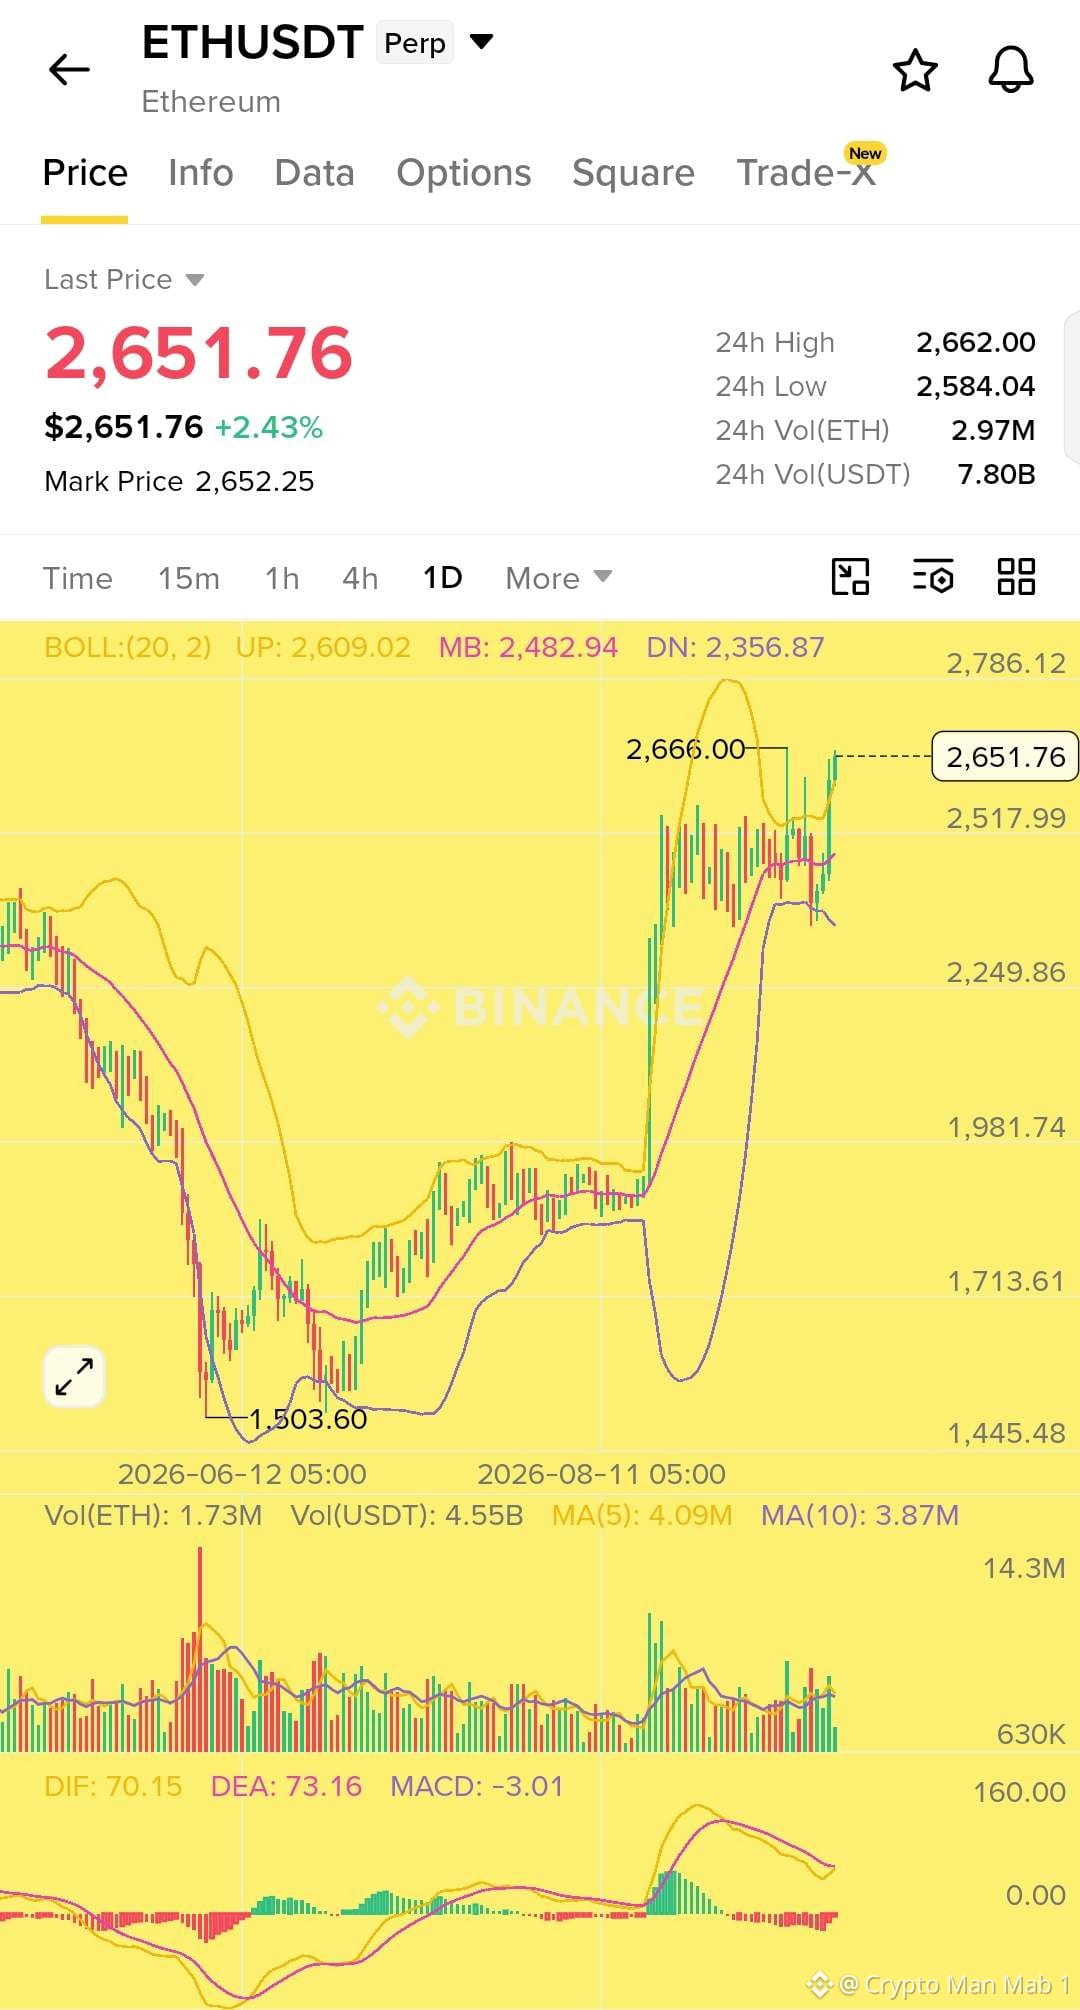
$ETH is still showing strong bullish momentum on the daily chart, but the current price is getting stretched after the recent move higher.
ETH is trading around $2,652 and recently pushed toward $2,666. The price is above the Bollinger midline at $2,483 and has broken above the upper Bollinger Band around $2,609, showing strong buying pressure.
However, MACD is starting to cool off, with DIF below DEA and the histogram turning negative. So I’d avoid chasing the move here and instead watch for a pullback toward the $2,600–$2,620 area.
If ETH holds that zone and buyers step back in, the next levels I’m watching are → $2,670 → $2,700 → $2,800 → $3,000.
The bigger picture remains bullish, but $2,666 is the immediate resistance to watch. A clean break and hold above it could open the door for another leg higher. 🚀
$ETH is still showing strong bullish momentum on the daily chart, but the current price is getting stretched after the recent move higher.
ETH is trading around $2,652 and recently pushed toward $2,666. The price is above the Bollinger midline at $2,483 and has broken above the upper Bollinger Band around $2,609, showing strong buying pressure.
However, MACD is starting to cool off, with DIF below DEA and the histogram turning negative. So I’d avoid chasing the move here and instead watch for a pullback toward the $2,600–$2,620 area.
If ETH holds that zone and buyers step back in, the next levels I’m watching are → $2,670 → $2,700 → $2,800 → $3,000.
The bigger picture remains bullish, but $2,666 is the immediate resistance to watch. A clean break and hold above it could open the door for another leg higher. 🚀
ETH is trading around $2,652 and recently pushed toward $2,666. The price is above the Bollinger midline at $2,483 and has broken above the upper Bollinger Band around $2,609, showing strong buying pressure.
However, MACD is starting to cool off, with DIF below DEA and the histogram turning negative. So I’d avoid chasing the move here and instead watch for a pullback toward the $2,600–$2,620 area.
If ETH holds that zone and buyers step back in, the next levels I’m watching are → $2,670 → $2,700 → $2,800 → $3,000.
The bigger picture remains bullish, but $2,666 is the immediate resistance to watch. A clean break and hold above it could open the door for another leg higher. 🚀
60
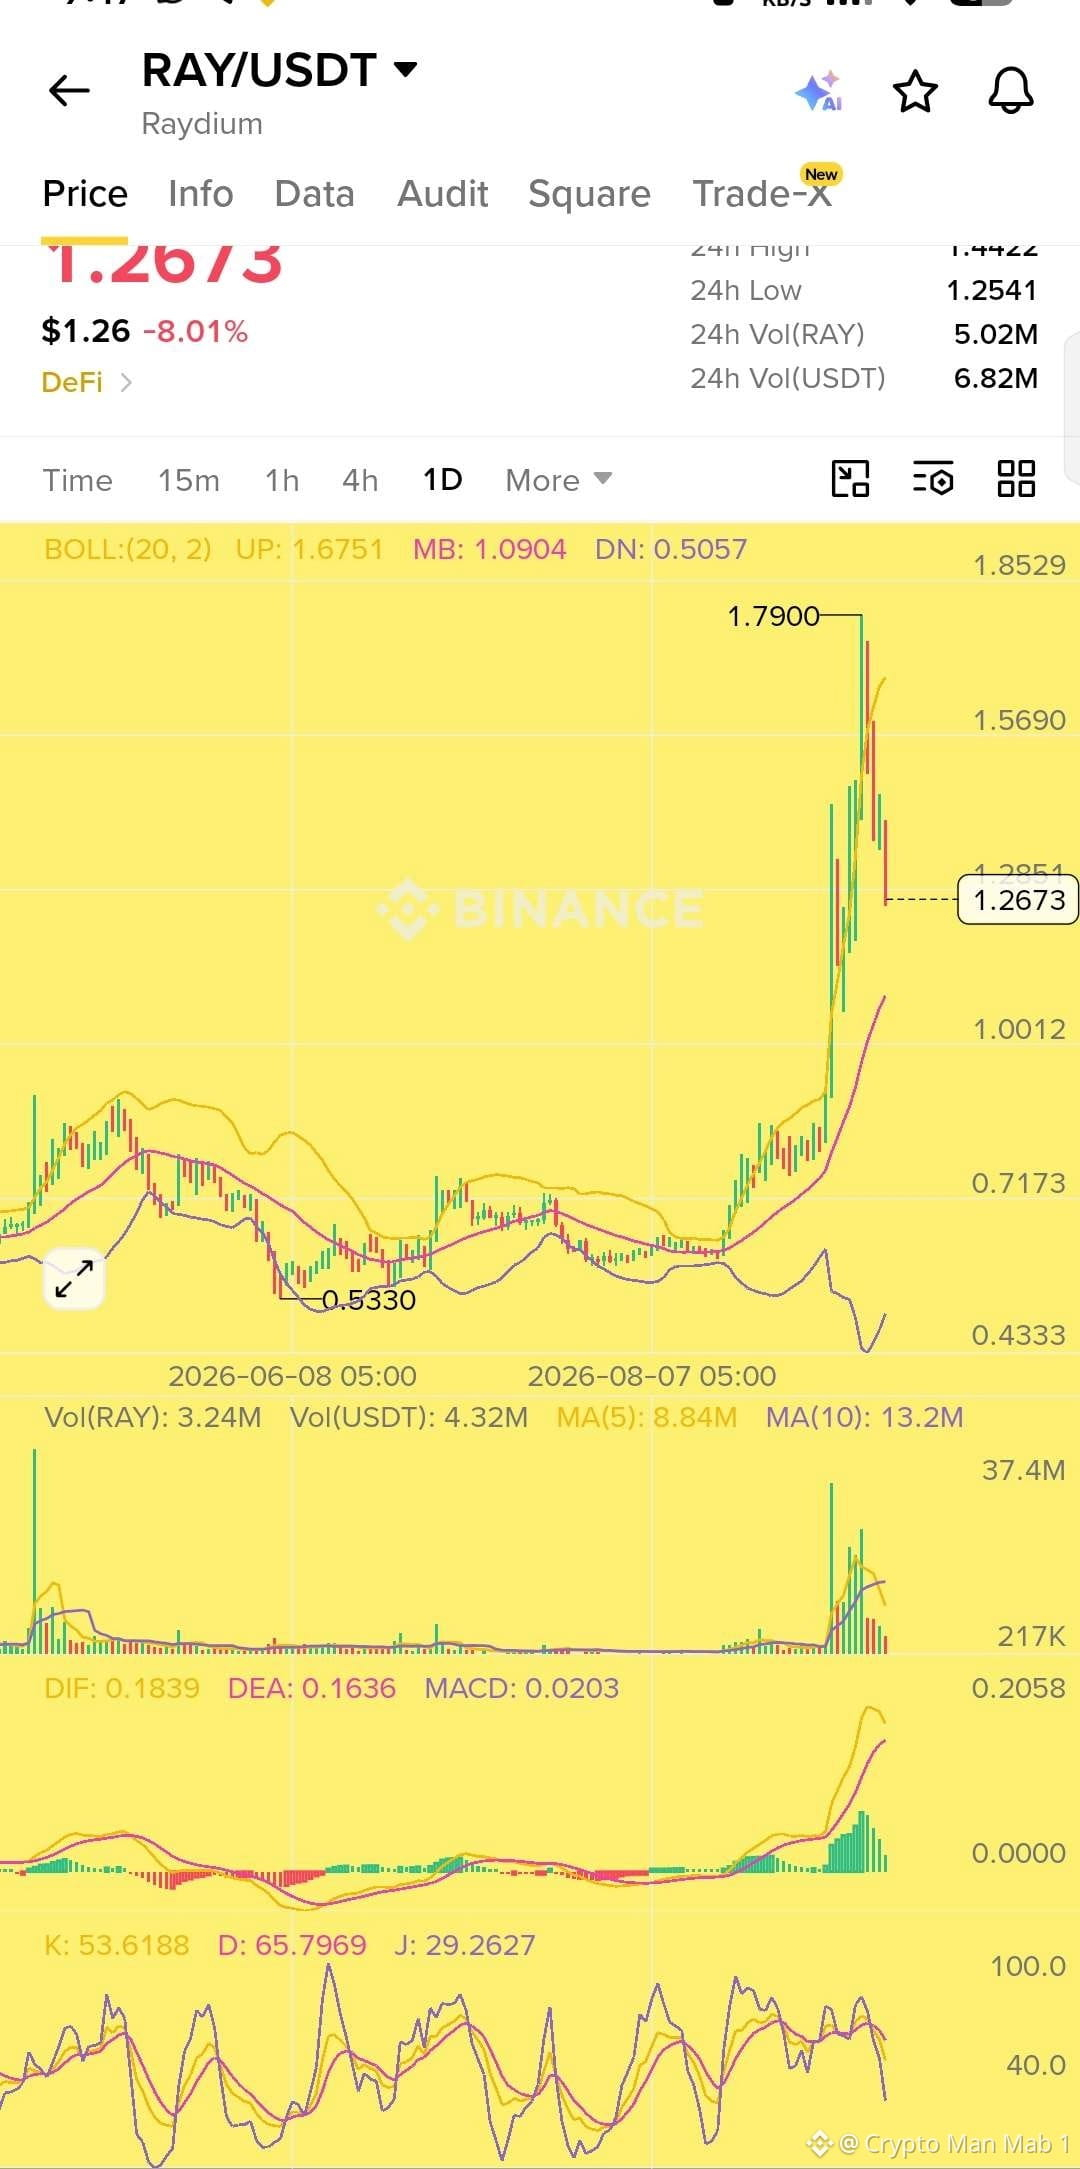
$RAY enfriándose después de una carrera salvaje. El precio se triplicó desde $0.53 hasta un máximo de $1.79 en pocas semanas; ahora está corrigiendo con fuerza hasta $1.2673, bajando 8% hoy después de que lo rechazaran en la parte alta.
Vela clásica de “blow off top” justo después del pico. Las Bandas de Bollinger muestran que el precio cae desde la banda superior hacia la banda media cerca de $1.09. El impulso del MACD se está debilitando y el KDJ ya cambió a bajista, así que la tendencia de corto plazo se ha invertido a la baja.
A gran escala sigue siendo alcista, ya que el precio está muy por encima de las medias móviles, pero esto parece un reseteo saludable después de un movimiento parabólico. Observando $1.09 como el siguiente nivel de soporte.
No es asesoramiento financiero, solo lectura del gráfico.
$RAY enfriándose después de una carrera salvaje. El precio se triplicó desde $0.53 hasta un máximo de $1.79 en pocas semanas; ahora está corrigiendo con fuerza hasta $1.2673, bajando 8% hoy después de que lo rechazaran en la parte alta.
Vela clásica de “blow off top” justo después del pico. Las Bandas de Bollinger muestran que el precio cae desde la banda superior hacia la banda media cerca de $1.09. El impulso del MACD se está debilitando y el KDJ ya cambió a bajista, así que la tendencia de corto plazo se ha invertido a la baja.
A gran escala sigue siendo alcista, ya que el precio está muy por encima de las medias móviles, pero esto parece un reseteo saludable después de un movimiento parabólico. Observando $1.09 como el siguiente nivel de soporte.
No es asesoramiento financiero, solo lectura del gráfico.
Vela clásica de “blow off top” justo después del pico. Las Bandas de Bollinger muestran que el precio cae desde la banda superior hacia la banda media cerca de $1.09. El impulso del MACD se está debilitando y el KDJ ya cambió a bajista, así que la tendencia de corto plazo se ha invertido a la baja.
A gran escala sigue siendo alcista, ya que el precio está muy por encima de las medias móviles, pero esto parece un reseteo saludable después de un movimiento parabólico. Observando $1.09 como el siguiente nivel de soporte.
No es asesoramiento financiero, solo lectura del gráfico.
58
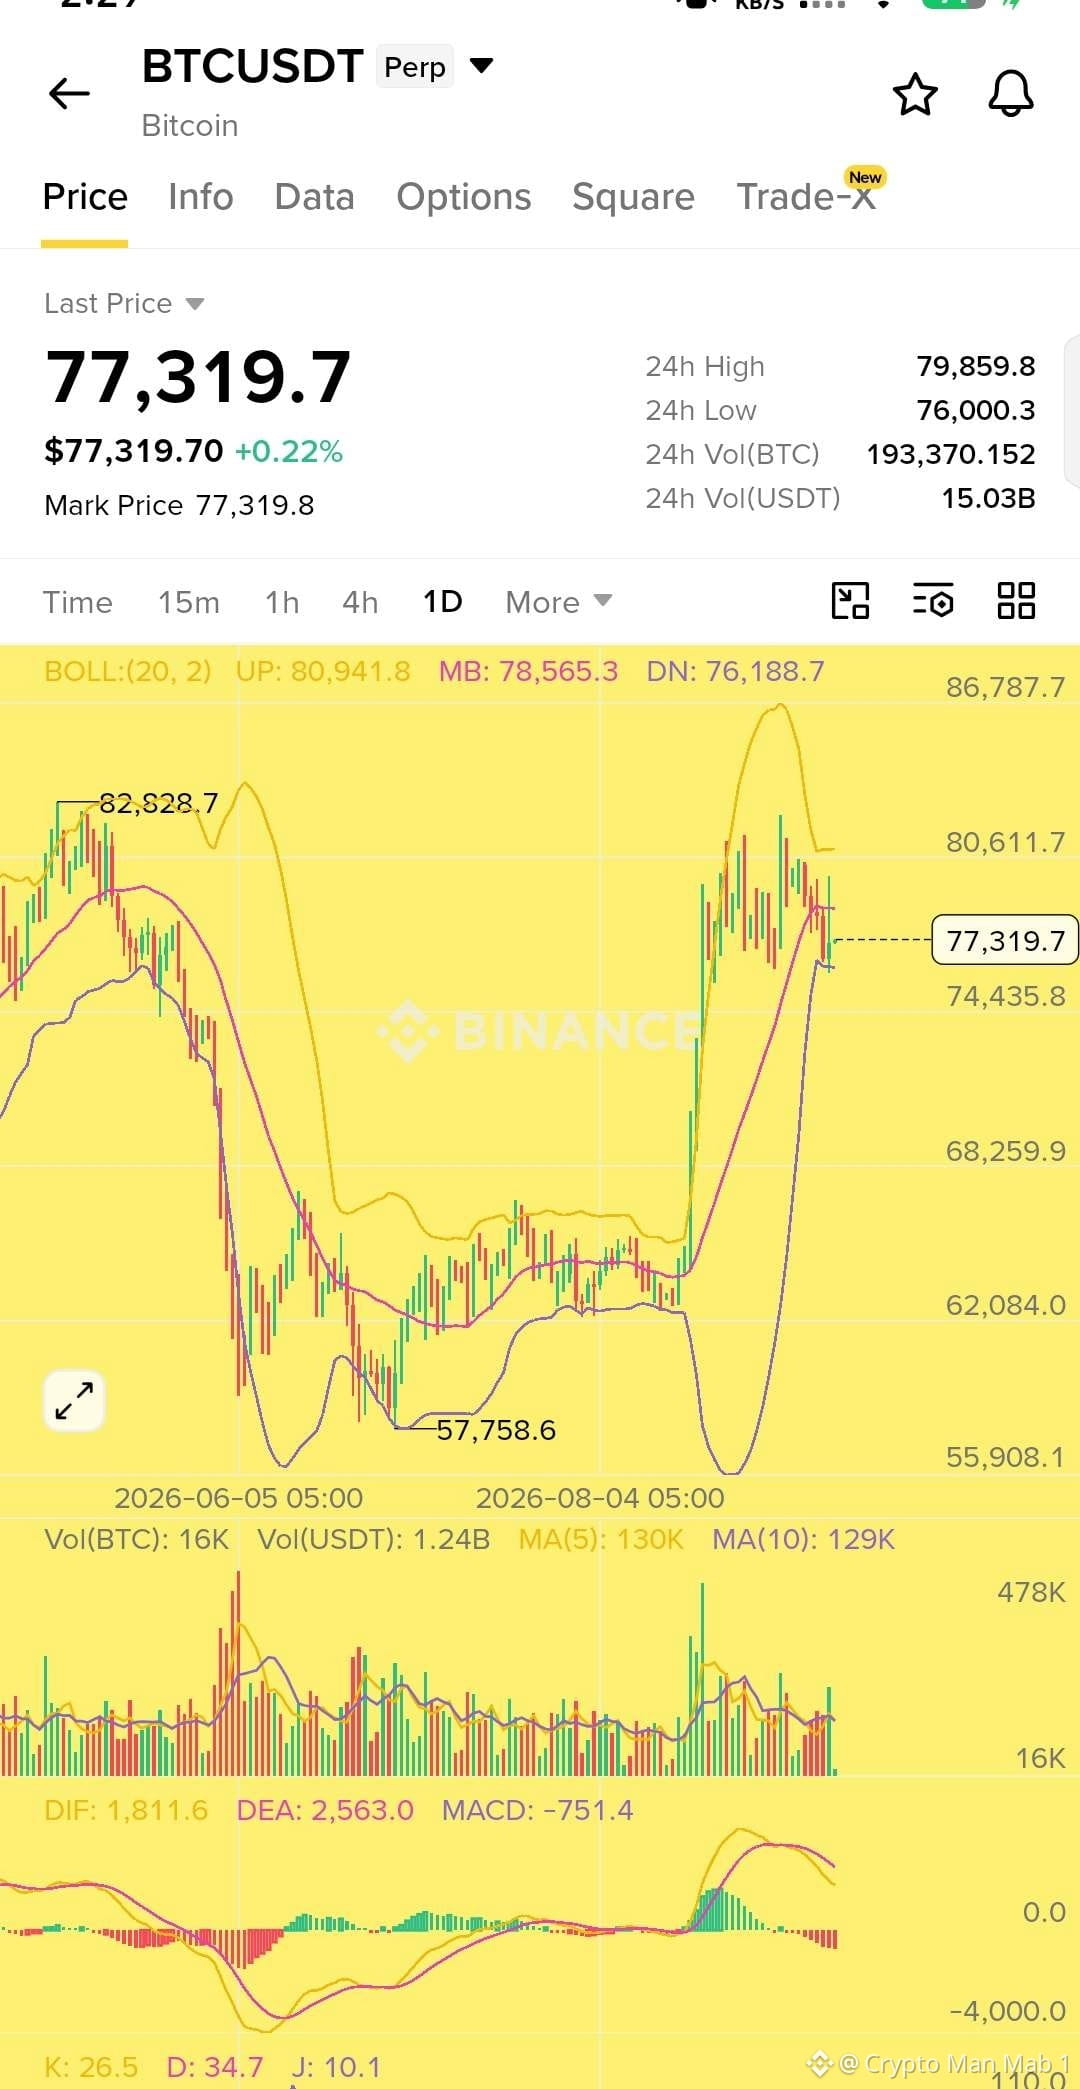
El gráfico diario de $BTC muestra una estructura bajista clara a corto plazo.
Actualmente, BTC cotiza alrededor de $77.3K y se encuentra por debajo de la banda media de Bollinger en $78.56K. El MACD se ha vuelto bajista, con el histograma por debajo de cero, mientras que el KDJ también muestra un impulso débil.
El nivel clave a vigilar es $78.5K. Si BTC no logra recuperar esta zona, podría producirse otro movimiento hacia $76K y potencialmente hacia $74.4K.
Para los alcistas, me gustaría ver un cierre diario fuerte por encima de $78.5K. Eso podría abrir la puerta hacia $80.6K y $81K.
#Análisis del precio de BTC#
Mi postura ahora mismo: cautelosa y bajista por debajo de $78.5K.
El gráfico diario de $BTC muestra una estructura bajista clara a corto plazo.
Actualmente, BTC cotiza alrededor de $77.3K y se encuentra por debajo de la banda media de Bollinger en $78.56K. El MACD se ha vuelto bajista, con el histograma por debajo de cero, mientras que el KDJ también muestra un impulso débil.
El nivel clave a vigilar es $78.5K. Si BTC no logra recuperar esta zona, podría producirse otro movimiento hacia $76K y potencialmente hacia $74.4K.
Para los alcistas, me gustaría ver un cierre diario fuerte por encima de $78.5K. Eso podría abrir la puerta hacia $80.6K y $81K.
#Análisis del precio de BTC#
Mi postura ahora mismo: cautelosa y bajista por debajo de $78.5K.
Actualmente, BTC cotiza alrededor de $77.3K y se encuentra por debajo de la banda media de Bollinger en $78.56K. El MACD se ha vuelto bajista, con el histograma por debajo de cero, mientras que el KDJ también muestra un impulso débil.
El nivel clave a vigilar es $78.5K. Si BTC no logra recuperar esta zona, podría producirse otro movimiento hacia $76K y potencialmente hacia $74.4K.
Para los alcistas, me gustaría ver un cierre diario fuerte por encima de $78.5K. Eso podría abrir la puerta hacia $80.6K y $81K.
#Análisis del precio de BTC#
Mi postura ahora mismo: cautelosa y bajista por debajo de $78.5K.
63
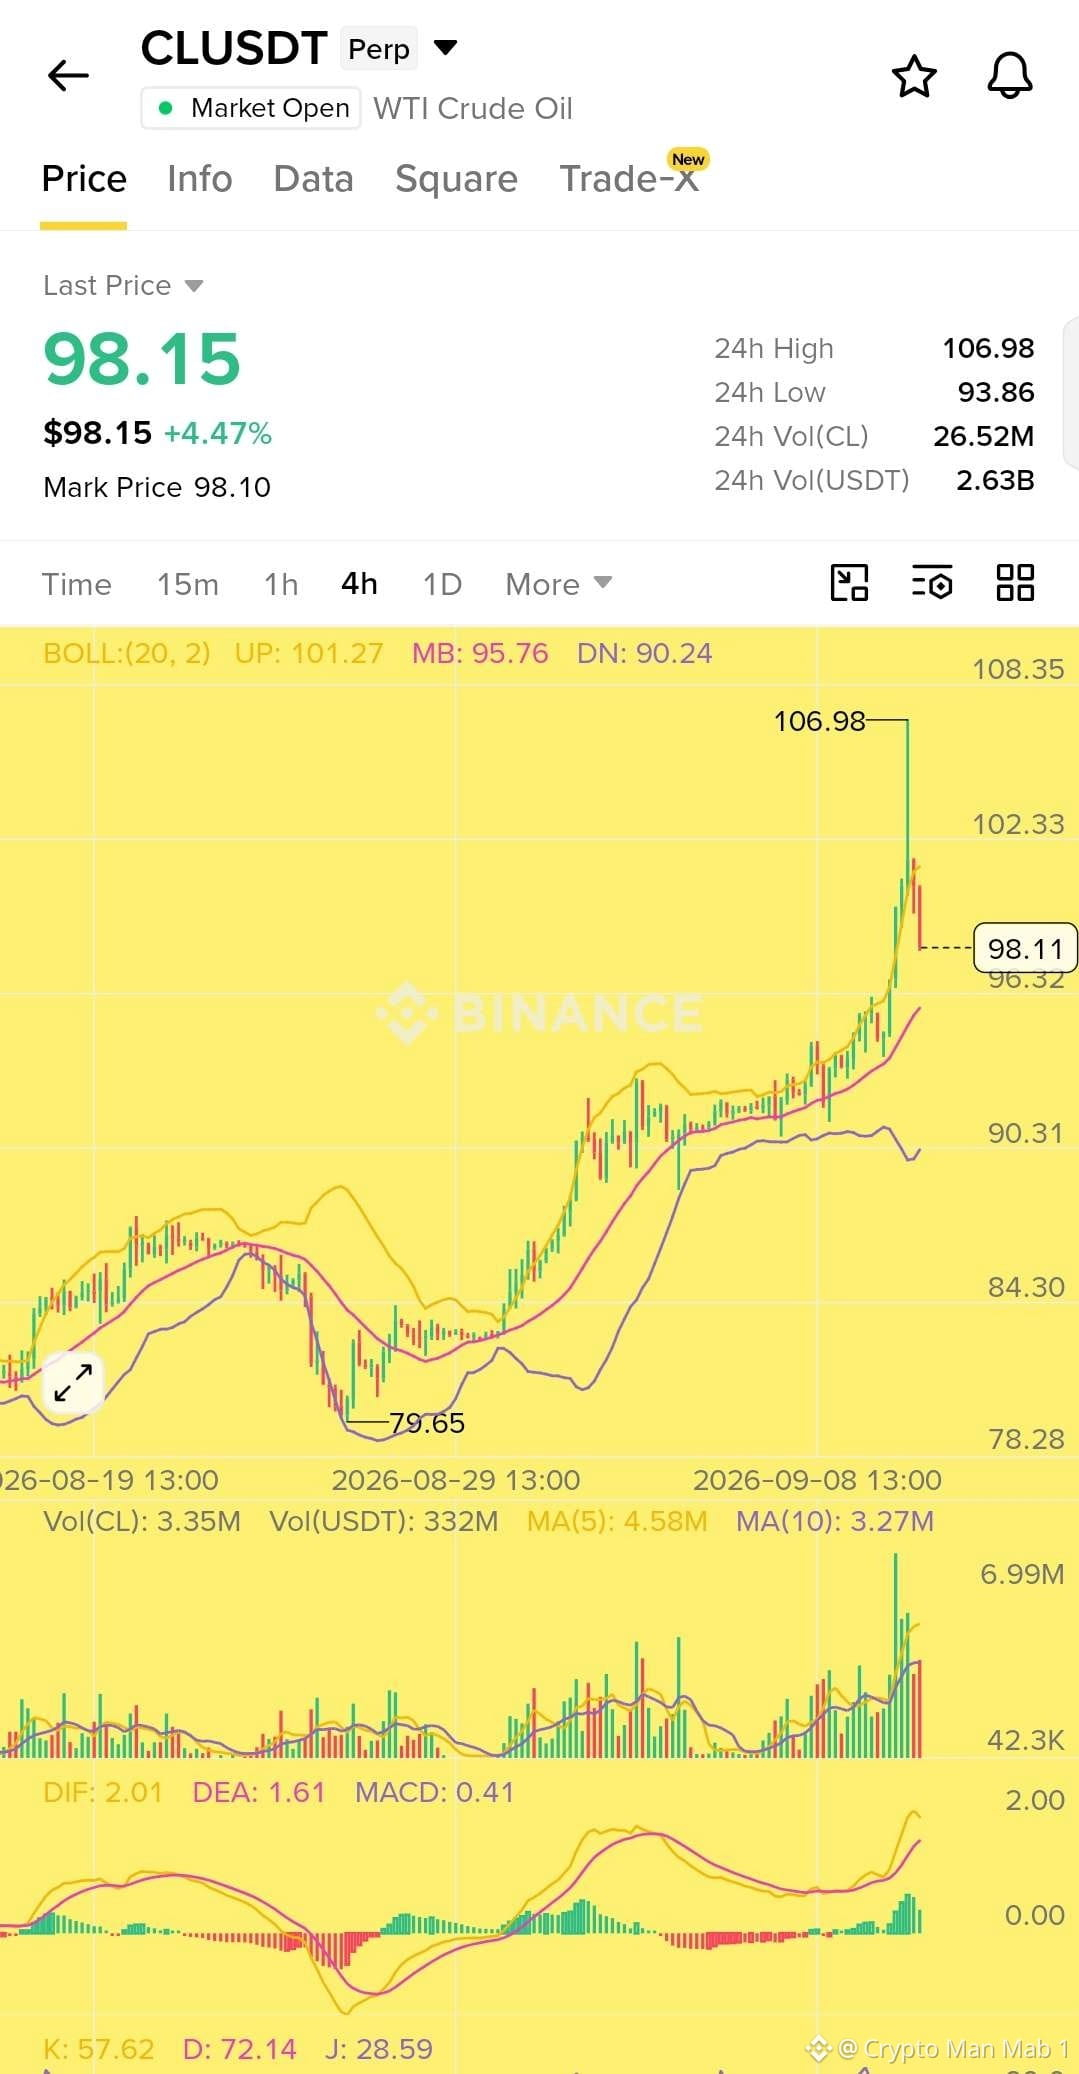
$CL muestra señales de agotamiento después del fuerte movimiento hacia el máximo de $106.98.
Ahora el precio está corrigiendo desde la banda de Bollinger superior mientras que el gráfico de 4H muestra un movimiento estirado y el impulso comienza a enfriarse. Estoy vigilando de cerca la zona de $100. Si el precio no logra recuperar y mantenerse por encima de $100, entonces podría volverse posible una corrección más profunda hacia $97 a $94.
Para un scalping, creo que el lado corto ofrece una mejor relación riesgo/beneficio aquí.
Scalp Short $CL
Entrada: $100 - $98
TP: $97 - $96 - $95 - $94
SL: $102
Confirmación clave: rechazo alrededor de $100 y debilidad continua por debajo de $98.
$CL muestra señales de agotamiento después del fuerte movimiento hacia el máximo de $106.98.
Ahora el precio está corrigiendo desde la banda de Bollinger superior mientras que el gráfico de 4H muestra un movimiento estirado y el impulso comienza a enfriarse. Estoy vigilando de cerca la zona de $100. Si el precio no logra recuperar y mantenerse por encima de $100, entonces podría volverse posible una corrección más profunda hacia $97 a $94.
Para un scalping, creo que el lado corto ofrece una mejor relación riesgo/beneficio aquí.
Scalp Short $CL
Entrada: $100 - $98
TP: $97 - $96 - $95 - $94
SL: $102
Confirmación clave: rechazo alrededor de $100 y debilidad continua por debajo de $98.
Ahora el precio está corrigiendo desde la banda de Bollinger superior mientras que el gráfico de 4H muestra un movimiento estirado y el impulso comienza a enfriarse. Estoy vigilando de cerca la zona de $100. Si el precio no logra recuperar y mantenerse por encima de $100, entonces podría volverse posible una corrección más profunda hacia $97 a $94.
Para un scalping, creo que el lado corto ofrece una mejor relación riesgo/beneficio aquí.
Scalp Short $CL
Entrada: $100 - $98
TP: $97 - $96 - $95 - $94
SL: $102
Confirmación clave: rechazo alrededor de $100 y debilidad continua por debajo de $98.
64
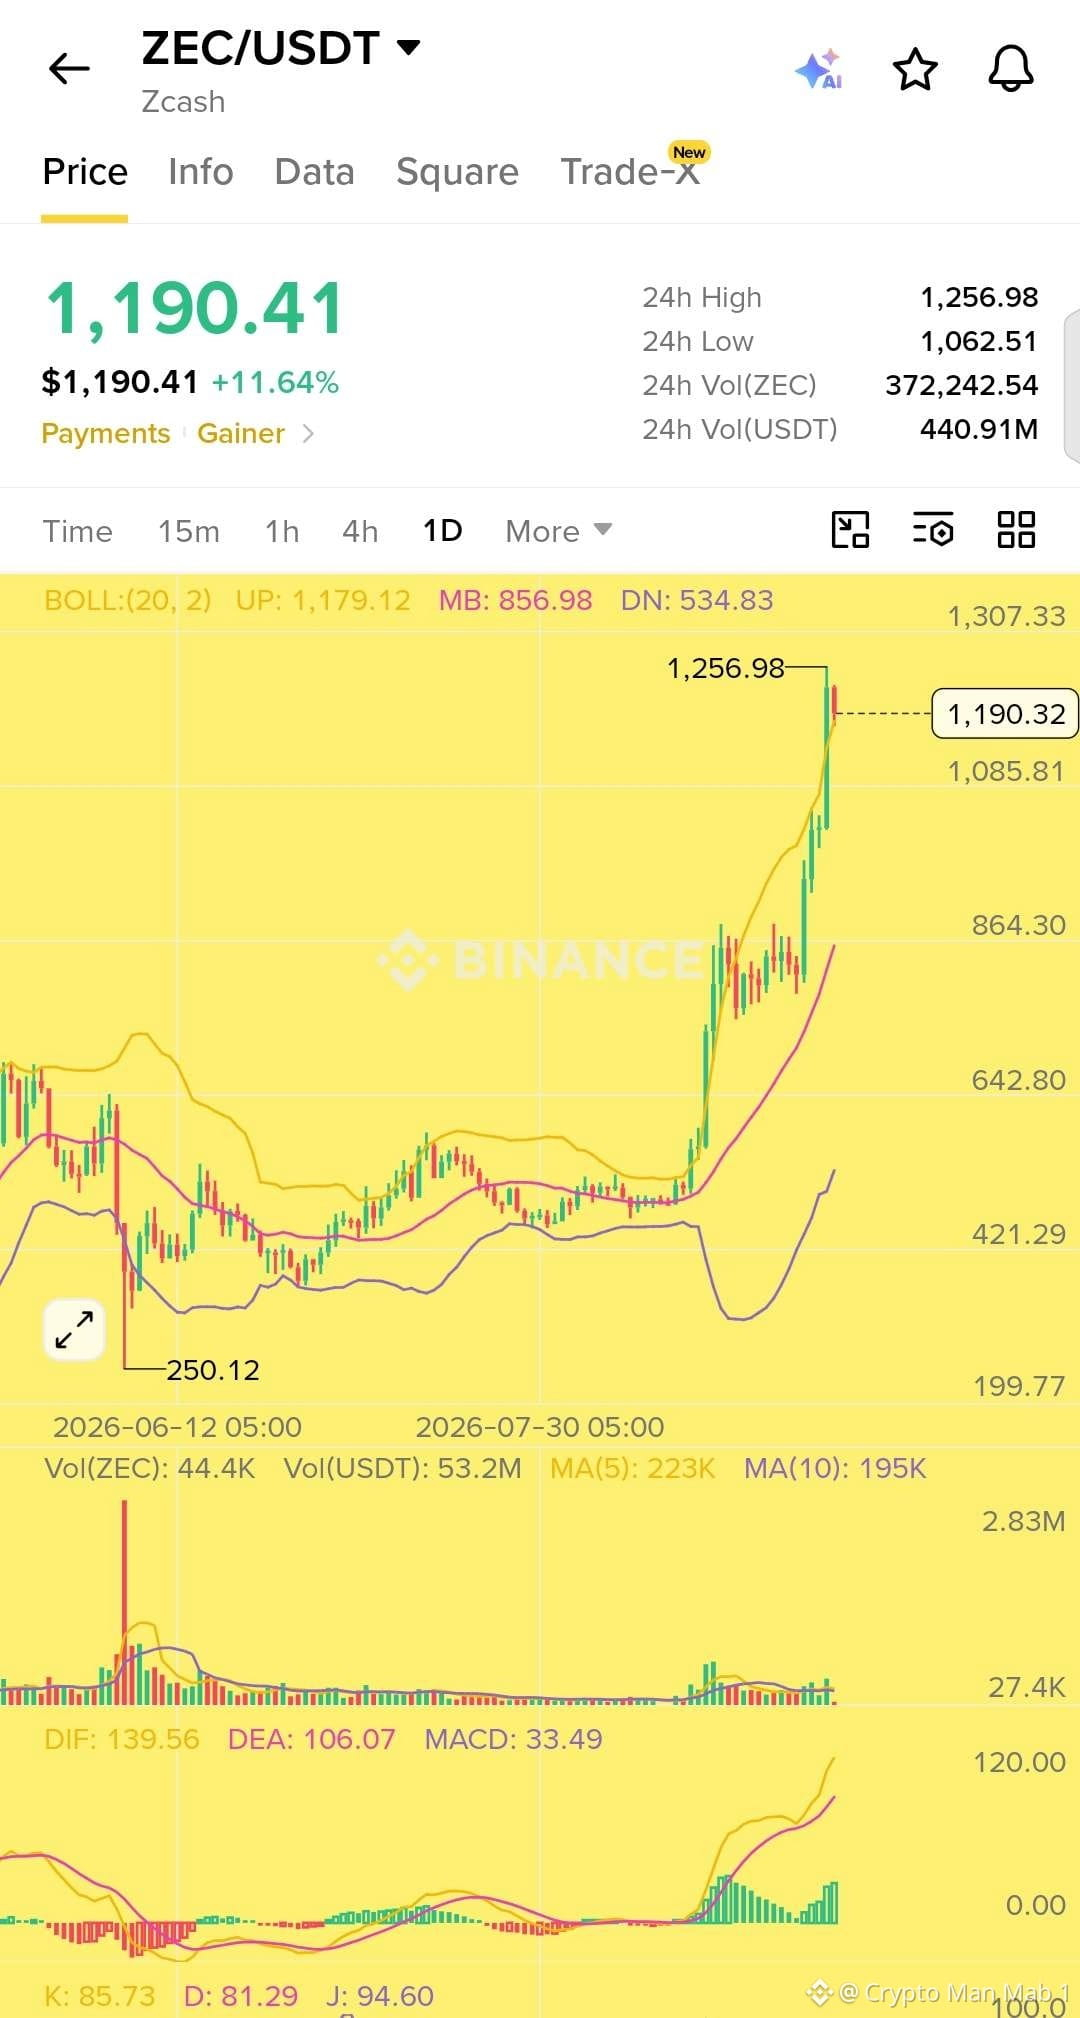
$ZEC acaba de romper por encima de $1,190 🚨👀
Zcash ahora cotiza alrededor de $1,195, impulsando su capitalización de mercado cerca de $19.5B.
¿Cuál fue el gran catalizador? Según se informa, Grayscale aumentó sus tenencias de ZEC en un 10.5%, marcando un cambio fuerte respecto a los flujos planos vistos después de su lanzamiento en agosto.
Esa compra ayudó a apretar a los cortos, desencadenando alrededor de $34.5M en liquidaciones y enviando a ZEC al top 10.
Pero hay otra cara de este movimiento.
El interés abierto en futuros ha subido hasta aproximadamente $2.57B, lo que significa que ahora hay una cantidad enorme de apalancamiento respaldando el repunte.
$ZEC acaba de romper por encima de $1,190 🚨👀
Zcash ahora cotiza alrededor de $1,195, impulsando su capitalización de mercado cerca de $19.5B.
¿Cuál fue el gran catalizador? Según se informa, Grayscale aumentó sus tenencias de ZEC en un 10.5%, marcando un cambio fuerte respecto a los flujos planos vistos después de su lanzamiento en agosto.
Esa compra ayudó a apretar a los cortos, desencadenando alrededor de $34.5M en liquidaciones y enviando a ZEC al top 10.
Pero hay otra cara de este movimiento.
El interés abierto en futuros ha subido hasta aproximadamente $2.57B, lo que significa que ahora hay una cantidad enorme de apalancamiento respaldando el repunte.
Zcash ahora cotiza alrededor de $1,195, impulsando su capitalización de mercado cerca de $19.5B.
¿Cuál fue el gran catalizador? Según se informa, Grayscale aumentó sus tenencias de ZEC en un 10.5%, marcando un cambio fuerte respecto a los flujos planos vistos después de su lanzamiento en agosto.
Esa compra ayudó a apretar a los cortos, desencadenando alrededor de $34.5M en liquidaciones y enviando a ZEC al top 10.
Pero hay otra cara de este movimiento.
El interés abierto en futuros ha subido hasta aproximadamente $2.57B, lo que significa que ahora hay una cantidad enorme de apalancamiento respaldando el repunte.
71
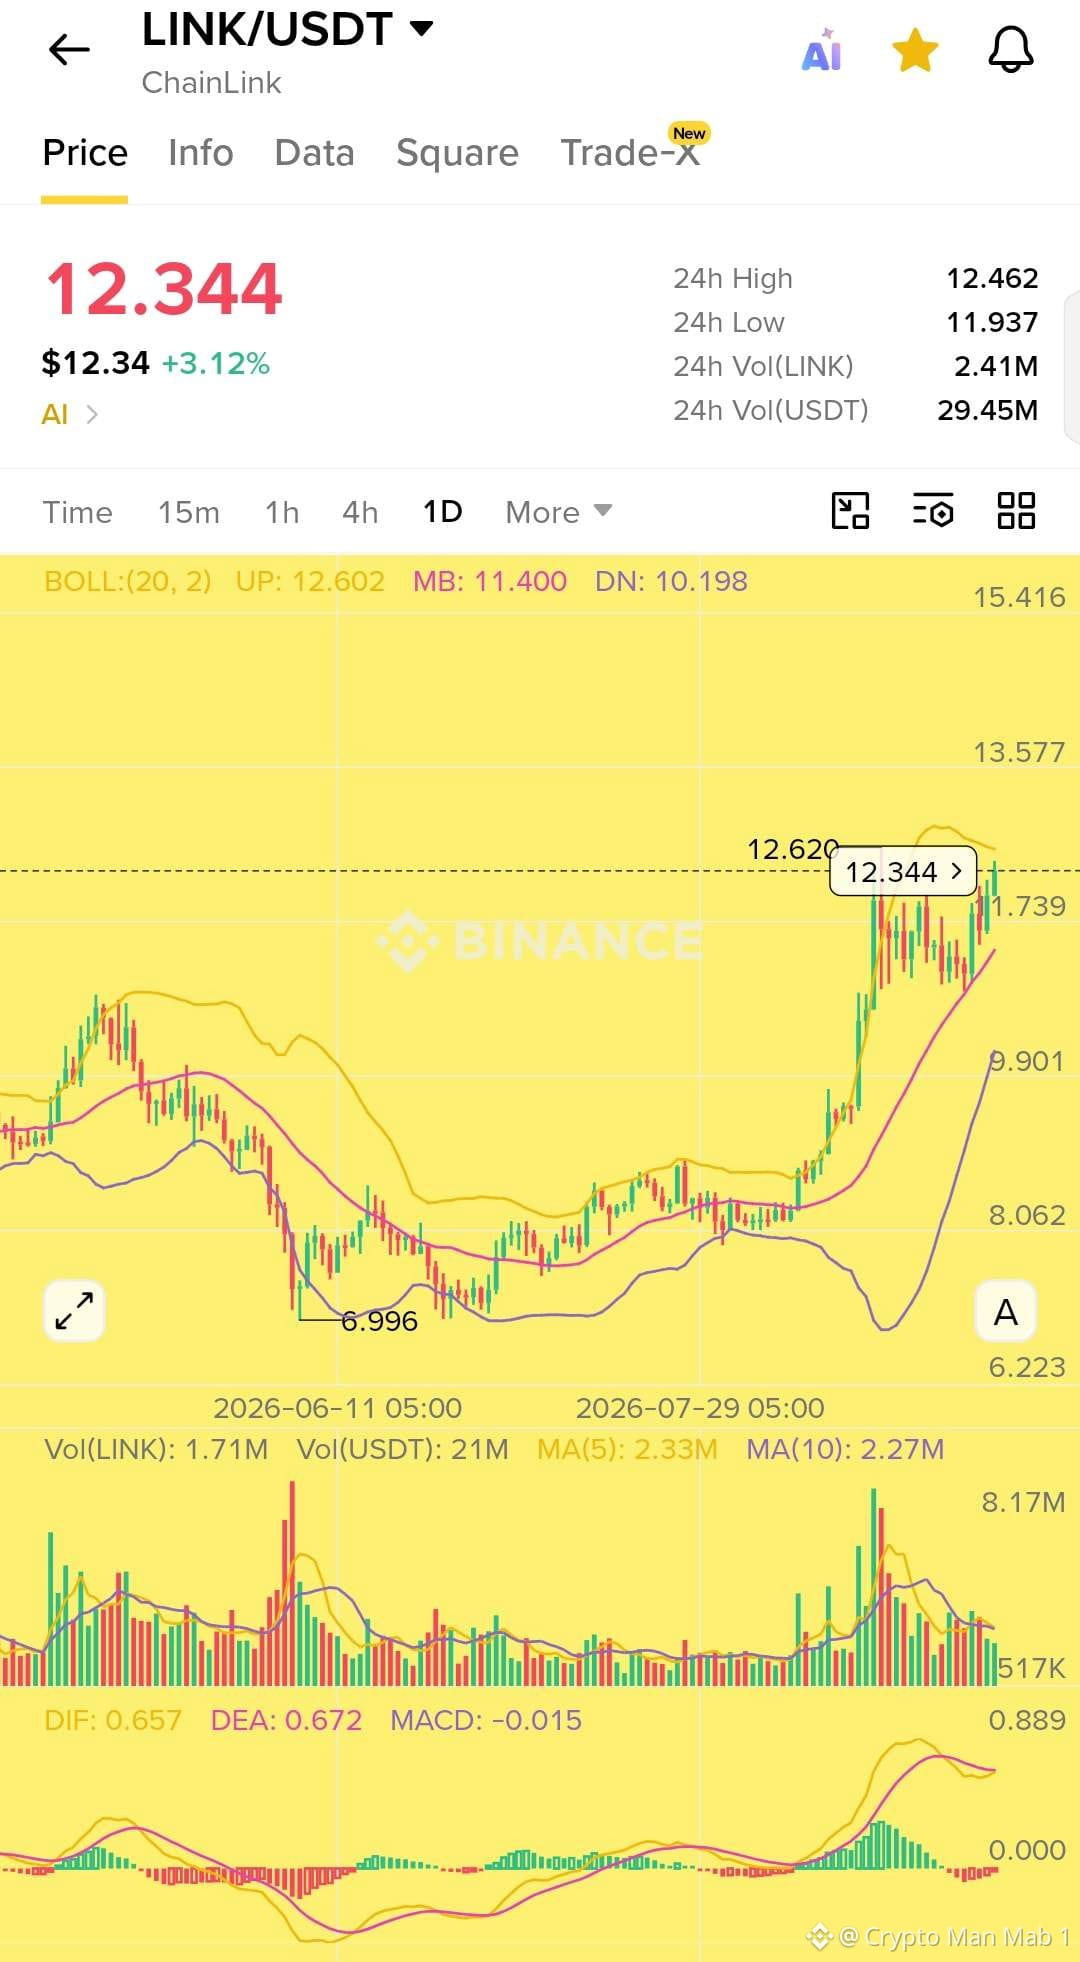
$LINK está fuerte en el gráfico diario 👀
Chainlink ha hecho un movimiento alcista sólido y ahora está consolidando alrededor de $12.3 después de romper con la franja inferior.
El precio aún se mantiene por encima de la banda media de Bollinger cerca de $11.40, lo que mantiene el panorama general en tendencia alcista. El nivel principal a vigilar ahora es $12.60. Una ruptura limpia por encima de esa zona con un volumen fuerte podría abrir la puerta hacia $13.50+.
Al mismo tiempo, el impulso del MACD se está enfriando ligeramente, así que yo evitaría perseguir el precio y esperaría confirmación.
📌 Niveles clave
Soporte: $11.40 → $10.20
Resistencia: $12.60 → $13.57 → $15.40
Si LINK convierte $12.60 en soporte, la próxima fase podría ponerse interesante.
#LINK #Chainlink #LINKUSDT #CryptoTrading #Altcoins
$LINK está fuerte en el gráfico diario 👀
Chainlink ha hecho un movimiento alcista sólido y ahora está consolidando alrededor de $12.3 después de romper con la franja inferior.
El precio aún se mantiene por encima de la banda media de Bollinger cerca de $11.40, lo que mantiene el panorama general en tendencia alcista. El nivel principal a vigilar ahora es $12.60. Una ruptura limpia por encima de esa zona con un volumen fuerte podría abrir la puerta hacia $13.50+.
Al mismo tiempo, el impulso del MACD se está enfriando ligeramente, así que yo evitaría perseguir el precio y esperaría confirmación.
📌 Niveles clave
Soporte: $11.40 → $10.20
Resistencia: $12.60 → $13.57 → $15.40
Si LINK convierte $12.60 en soporte, la próxima fase podría ponerse interesante.
#LINK #Chainlink #LINKUSDT #CryptoTrading #Altcoins
Chainlink ha hecho un movimiento alcista sólido y ahora está consolidando alrededor de $12.3 después de romper con la franja inferior.
El precio aún se mantiene por encima de la banda media de Bollinger cerca de $11.40, lo que mantiene el panorama general en tendencia alcista. El nivel principal a vigilar ahora es $12.60. Una ruptura limpia por encima de esa zona con un volumen fuerte podría abrir la puerta hacia $13.50+.
Al mismo tiempo, el impulso del MACD se está enfriando ligeramente, así que yo evitaría perseguir el precio y esperaría confirmación.
📌 Niveles clave
Soporte: $11.40 → $10.20
Resistencia: $12.60 → $13.57 → $15.40
Si LINK convierte $12.60 en soporte, la próxima fase podría ponerse interesante.
#LINK #Chainlink #LINKUSDT #CryptoTrading #Altcoins
66
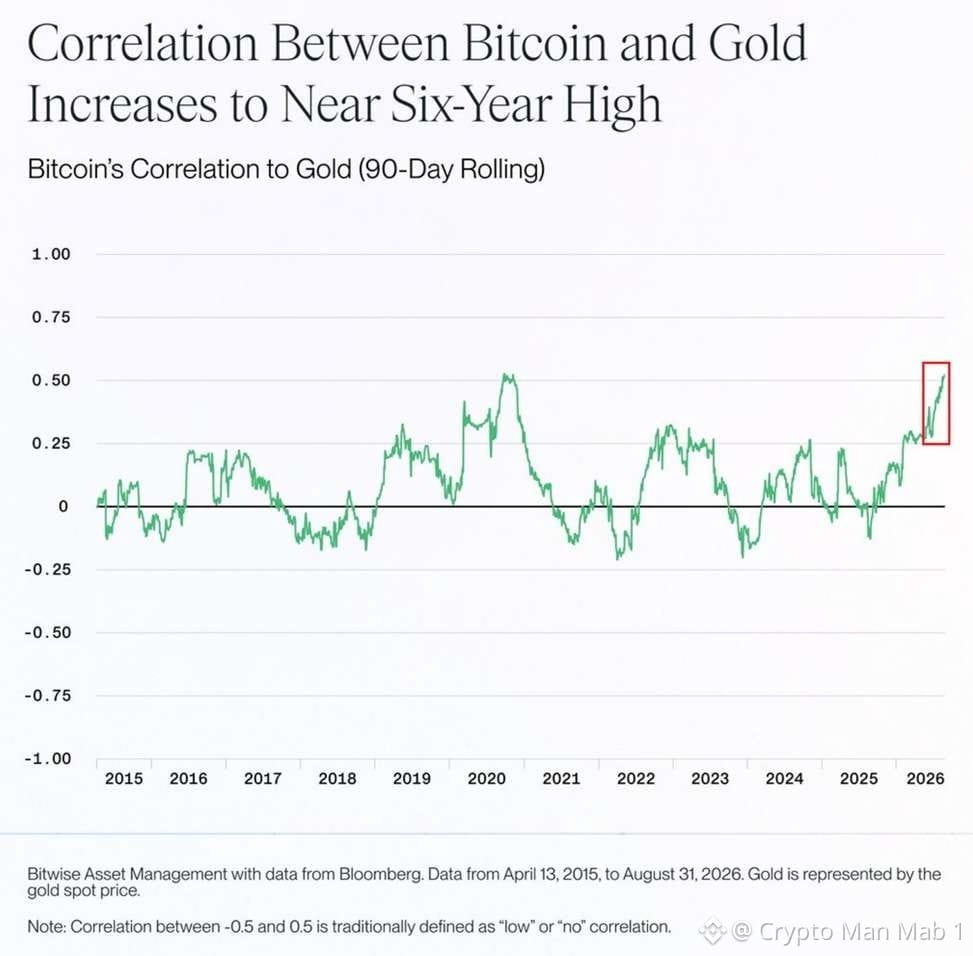
Bitcoin y el oro están empezando a moverse cada vez más de forma parecida.
La correlación de 90 días entre BTC y el oro ha subido hasta alrededor de +0.50, acercándose a los niveles récord que vimos durante la pandemia de 2020.
Lo que es aún más interesante es que esta correlación se ha más que duplicado desde el comienzo del año.
Para comparar, durante la recuperación del mercado bajista de 2022, la correlación solo llegó a alrededor de +0.30.
El movimiento más reciente se aceleró después de que el Tesoro de EE. UU. anunciara el 19 de agosto que, como mínimo, duplicaría sus recompras de deuda gubernamental de largo plazo, incrementándolas de $2 mil millones a $4 mil millones por operación.
Al mismo tiempo, la correlación de Bitcoin con el Nasdaq 100 ha caído hasta alrededor de 0.30, su nivel más bajo en un año.
#Análisis del precio de BTC#
$BTC
Bitcoin y el oro están empezando a moverse cada vez más de forma parecida.
La correlación de 90 días entre BTC y el oro ha subido hasta alrededor de +0.50, acercándose a los niveles récord que vimos durante la pandemia de 2020.
Lo que es aún más interesante es que esta correlación se ha más que duplicado desde el comienzo del año.
Para comparar, durante la recuperación del mercado bajista de 2022, la correlación solo llegó a alrededor de +0.30.
El movimiento más reciente se aceleró después de que el Tesoro de EE. UU. anunciara el 19 de agosto que, como mínimo, duplicaría sus recompras de deuda gubernamental de largo plazo, incrementándolas de $2 mil millones a $4 mil millones por operación.
Al mismo tiempo, la correlación de Bitcoin con el Nasdaq 100 ha caído hasta alrededor de 0.30, su nivel más bajo en un año.
#Análisis del precio de BTC#
$BTC
La correlación de 90 días entre BTC y el oro ha subido hasta alrededor de +0.50, acercándose a los niveles récord que vimos durante la pandemia de 2020.
Lo que es aún más interesante es que esta correlación se ha más que duplicado desde el comienzo del año.
Para comparar, durante la recuperación del mercado bajista de 2022, la correlación solo llegó a alrededor de +0.30.
El movimiento más reciente se aceleró después de que el Tesoro de EE. UU. anunciara el 19 de agosto que, como mínimo, duplicaría sus recompras de deuda gubernamental de largo plazo, incrementándolas de $2 mil millones a $4 mil millones por operación.
Al mismo tiempo, la correlación de Bitcoin con el Nasdaq 100 ha caído hasta alrededor de 0.30, su nivel más bajo en un año.
#Análisis del precio de BTC#
$BTC
66
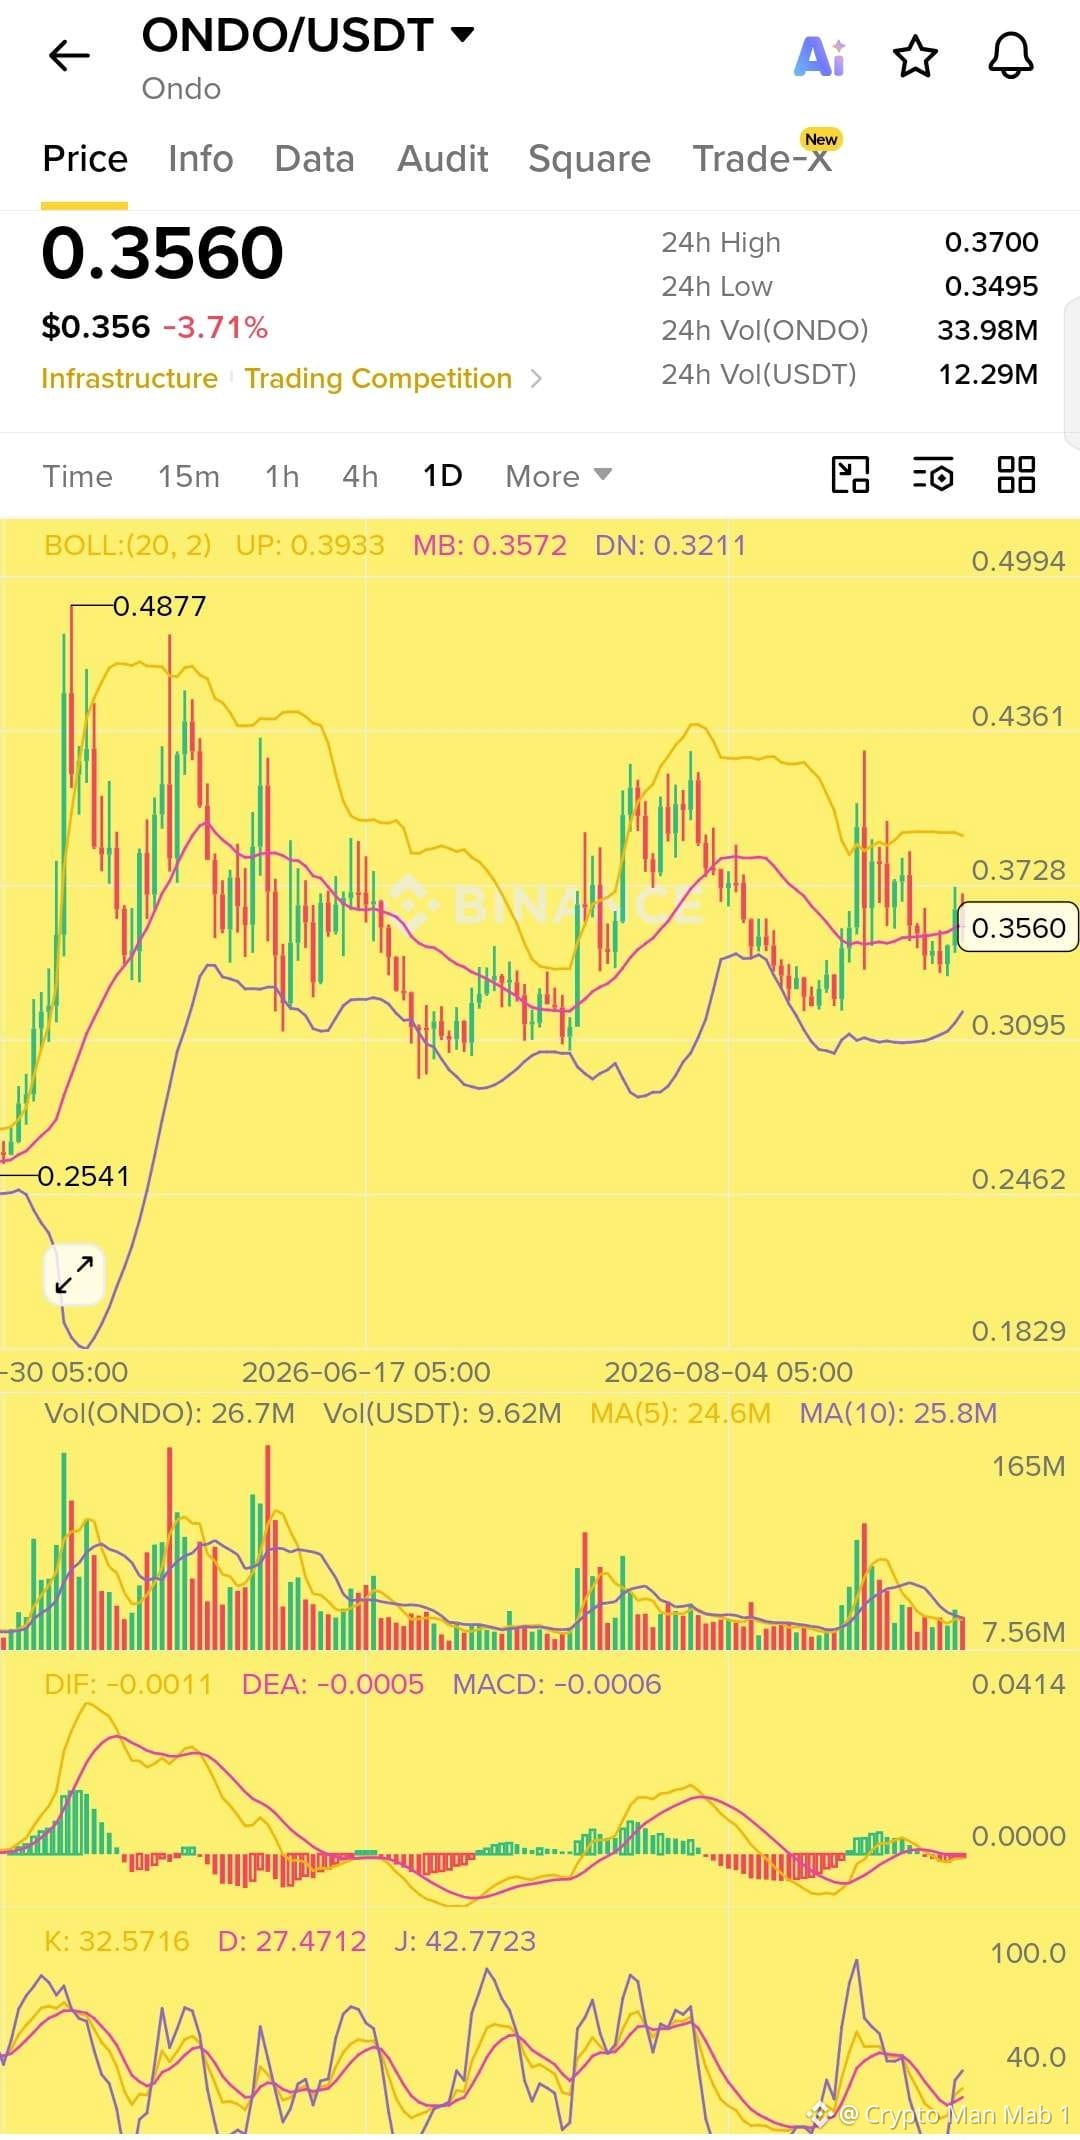
$ONDO está en un nivel interesante 👀
ONDO se está negociando alrededor de $0.356, muy cerca de la banda media de Bollinger en $0.357. El precio ha estado moviéndose de forma lateral durante un tiempo, pero los compradores aún están defendiendo la zona de $0.34–$0.35.
Si ONDO puede recuperar $0.37–$0.38 con buen volumen, los siguientes niveles que estoy observando están alrededor de $0.393 y potencialmente $0.43.
A la baja, perder $0.34 podría enviar el precio de vuelta hacia la zona de soporte de $0.32.
En general, estoy esperando una ruptura en lugar de perseguir el rango actual. 📈
Niveles clave:
🟢 Soporte: $0.34 → $0.32
🚀 Resistencia: $0.37 → $0.393 → $0.43
#ONDO #ONDOUSDT #Crypto #CryptoTrading #RWA
$ONDO está en un nivel interesante 👀
ONDO se está negociando alrededor de $0.356, muy cerca de la banda media de Bollinger en $0.357. El precio ha estado moviéndose de forma lateral durante un tiempo, pero los compradores aún están defendiendo la zona de $0.34–$0.35.
Si ONDO puede recuperar $0.37–$0.38 con buen volumen, los siguientes niveles que estoy observando están alrededor de $0.393 y potencialmente $0.43.
A la baja, perder $0.34 podría enviar el precio de vuelta hacia la zona de soporte de $0.32.
En general, estoy esperando una ruptura en lugar de perseguir el rango actual. 📈
Niveles clave:
🟢 Soporte: $0.34 → $0.32
🚀 Resistencia: $0.37 → $0.393 → $0.43
#ONDO #ONDOUSDT #Crypto #CryptoTrading #RWA
ONDO se está negociando alrededor de $0.356, muy cerca de la banda media de Bollinger en $0.357. El precio ha estado moviéndose de forma lateral durante un tiempo, pero los compradores aún están defendiendo la zona de $0.34–$0.35.
Si ONDO puede recuperar $0.37–$0.38 con buen volumen, los siguientes niveles que estoy observando están alrededor de $0.393 y potencialmente $0.43.
A la baja, perder $0.34 podría enviar el precio de vuelta hacia la zona de soporte de $0.32.
En general, estoy esperando una ruptura en lugar de perseguir el rango actual. 📈
Niveles clave:
🟢 Soporte: $0.34 → $0.32
🚀 Resistencia: $0.37 → $0.393 → $0.43
#ONDO #ONDOUSDT #Crypto #CryptoTrading #RWA
88
Los ETF de Ethereum están manteniendo el impulso. 🔥
Los ETF de ETH ya han registrado 11 sesiones consecutivas de entradas, mientras que los fondos de XRP y Solana han alcanzado 10 días positivos seguidos cada uno.
Ese nivel de consistencia es difícil de ignorar.
Esto demuestra que el interés institucional se está expandiendo más allá de Bitcoin, con un capital que fluye cada vez más hacia importantes altcoins.
Si esta tendencia continúa, la siguiente fase del mercado podría ponerse muy interesante. 👀📈
La liquidez cripto se está moviendo, y el mercado de altcoins empieza a notarlo.
$SOL $ETH $BTC
Los ETF de Ethereum están manteniendo el impulso. 🔥
Los ETF de ETH ya han registrado 11 sesiones consecutivas de entradas, mientras que los fondos de XRP y Solana han alcanzado 10 días positivos seguidos cada uno.
Ese nivel de consistencia es difícil de ignorar.
Esto demuestra que el interés institucional se está expandiendo más allá de Bitcoin, con un capital que fluye cada vez más hacia importantes altcoins.
Si esta tendencia continúa, la siguiente fase del mercado podría ponerse muy interesante. 👀📈
La liquidez cripto se está moviendo, y el mercado de altcoins empieza a notarlo.
$SOL $ETH $BTC
Los ETF de ETH ya han registrado 11 sesiones consecutivas de entradas, mientras que los fondos de XRP y Solana han alcanzado 10 días positivos seguidos cada uno.
Ese nivel de consistencia es difícil de ignorar.
Esto demuestra que el interés institucional se está expandiendo más allá de Bitcoin, con un capital que fluye cada vez más hacia importantes altcoins.
Si esta tendencia continúa, la siguiente fase del mercado podría ponerse muy interesante. 👀📈
La liquidez cripto se está moviendo, y el mercado de altcoins empieza a notarlo.
$SOL $ETH $BTC
65
🎂 ¡Feliz cumpleaños @BNBChain 🟡
Hace 6 años, BNB Smart Chain se lanzó con una misión sencilla: hacer que Web3 sea más rápido, más barato y accesible para los próximos mil millones de usuarios.
Mira en lo que se ha convertido hoy 👇
🚀 5.000+ proyectos construyendo en todo el ecosistema
👥 611M+ direcciones BSC únicas
⚡ 31M de transacciones diarias alcanzaron un máximo histórico
💰 $14B+ de TVL máximo
🏦 $1.8B+ en activos del mundo real tokenizados
💵 $14B de capitalización del mercado de stablecoins en su punto máximo
🔥 95% de reducción en ataques maliciosos de MEV
⛽ Las comisiones de gas se redujeron a tan bajo como $0.001
🌐 BNB Chain se ha expandido más allá de BSC con opBNB y BNB Greenfield, construyendo una infraestructura más amplia para DeFi, IA, gaming, pagos, RWAs y más.
Y la red sigue evolucionando.
Hoy, BNB Chain está procesando millones de usuarios activos diarios mientras impulsa la finalización más rápida, comisiones más bajas y una mayor escalabilidad.
Desde el verano de DeFi hasta stablecoins, RWAs, IA y la próxima generación de aplicaciones de Web3, BNB Chain ha desempeñado un papel enorme al llevar el cripto a millones de usuarios.
6 años después.
Los próximos mil millones de usuarios todavía están esperando.
¡Feliz cumpleaños, BNB Chain! 🟡
#BNBChain #BNB #BNBDay #Web3 #Crypto
$BNB
🎂 ¡Feliz cumpleaños @BNBChain 🟡
Hace 6 años, BNB Smart Chain se lanzó con una misión sencilla: hacer que Web3 sea más rápido, más barato y accesible para los próximos mil millones de usuarios.
Mira en lo que se ha convertido hoy 👇
🚀 5.000+ proyectos construyendo en todo el ecosistema
👥 611M+ direcciones BSC únicas
⚡ 31M de transacciones diarias alcanzaron un máximo histórico
💰 $14B+ de TVL máximo
🏦 $1.8B+ en activos del mundo real tokenizados
💵 $14B de capitalización del mercado de stablecoins en su punto máximo
🔥 95% de reducción en ataques maliciosos de MEV
⛽ Las comisiones de gas se redujeron a tan bajo como $0.001
🌐 BNB Chain se ha expandido más allá de BSC con opBNB y BNB Greenfield, construyendo una infraestructura más amplia para DeFi, IA, gaming, pagos, RWAs y más.
Y la red sigue evolucionando.
Hoy, BNB Chain está procesando millones de usuarios activos diarios mientras impulsa la finalización más rápida, comisiones más bajas y una mayor escalabilidad.
Desde el verano de DeFi hasta stablecoins, RWAs, IA y la próxima generación de aplicaciones de Web3, BNB Chain ha desempeñado un papel enorme al llevar el cripto a millones de usuarios.
6 años después.
Los próximos mil millones de usuarios todavía están esperando.
¡Feliz cumpleaños, BNB Chain! 🟡
#BNBChain #BNB #BNBDay #Web3 #Crypto
$BNB
Hace 6 años, BNB Smart Chain se lanzó con una misión sencilla: hacer que Web3 sea más rápido, más barato y accesible para los próximos mil millones de usuarios.
Mira en lo que se ha convertido hoy 👇
🚀 5.000+ proyectos construyendo en todo el ecosistema
👥 611M+ direcciones BSC únicas
⚡ 31M de transacciones diarias alcanzaron un máximo histórico
💰 $14B+ de TVL máximo
🏦 $1.8B+ en activos del mundo real tokenizados
💵 $14B de capitalización del mercado de stablecoins en su punto máximo
🔥 95% de reducción en ataques maliciosos de MEV
⛽ Las comisiones de gas se redujeron a tan bajo como $0.001
🌐 BNB Chain se ha expandido más allá de BSC con opBNB y BNB Greenfield, construyendo una infraestructura más amplia para DeFi, IA, gaming, pagos, RWAs y más.
Y la red sigue evolucionando.
Hoy, BNB Chain está procesando millones de usuarios activos diarios mientras impulsa la finalización más rápida, comisiones más bajas y una mayor escalabilidad.
Desde el verano de DeFi hasta stablecoins, RWAs, IA y la próxima generación de aplicaciones de Web3, BNB Chain ha desempeñado un papel enorme al llevar el cripto a millones de usuarios.
6 años después.
Los próximos mil millones de usuarios todavía están esperando.
¡Feliz cumpleaños, BNB Chain! 🟡
#BNBChain #BNB #BNBDay #Web3 #Crypto
$BNB

81
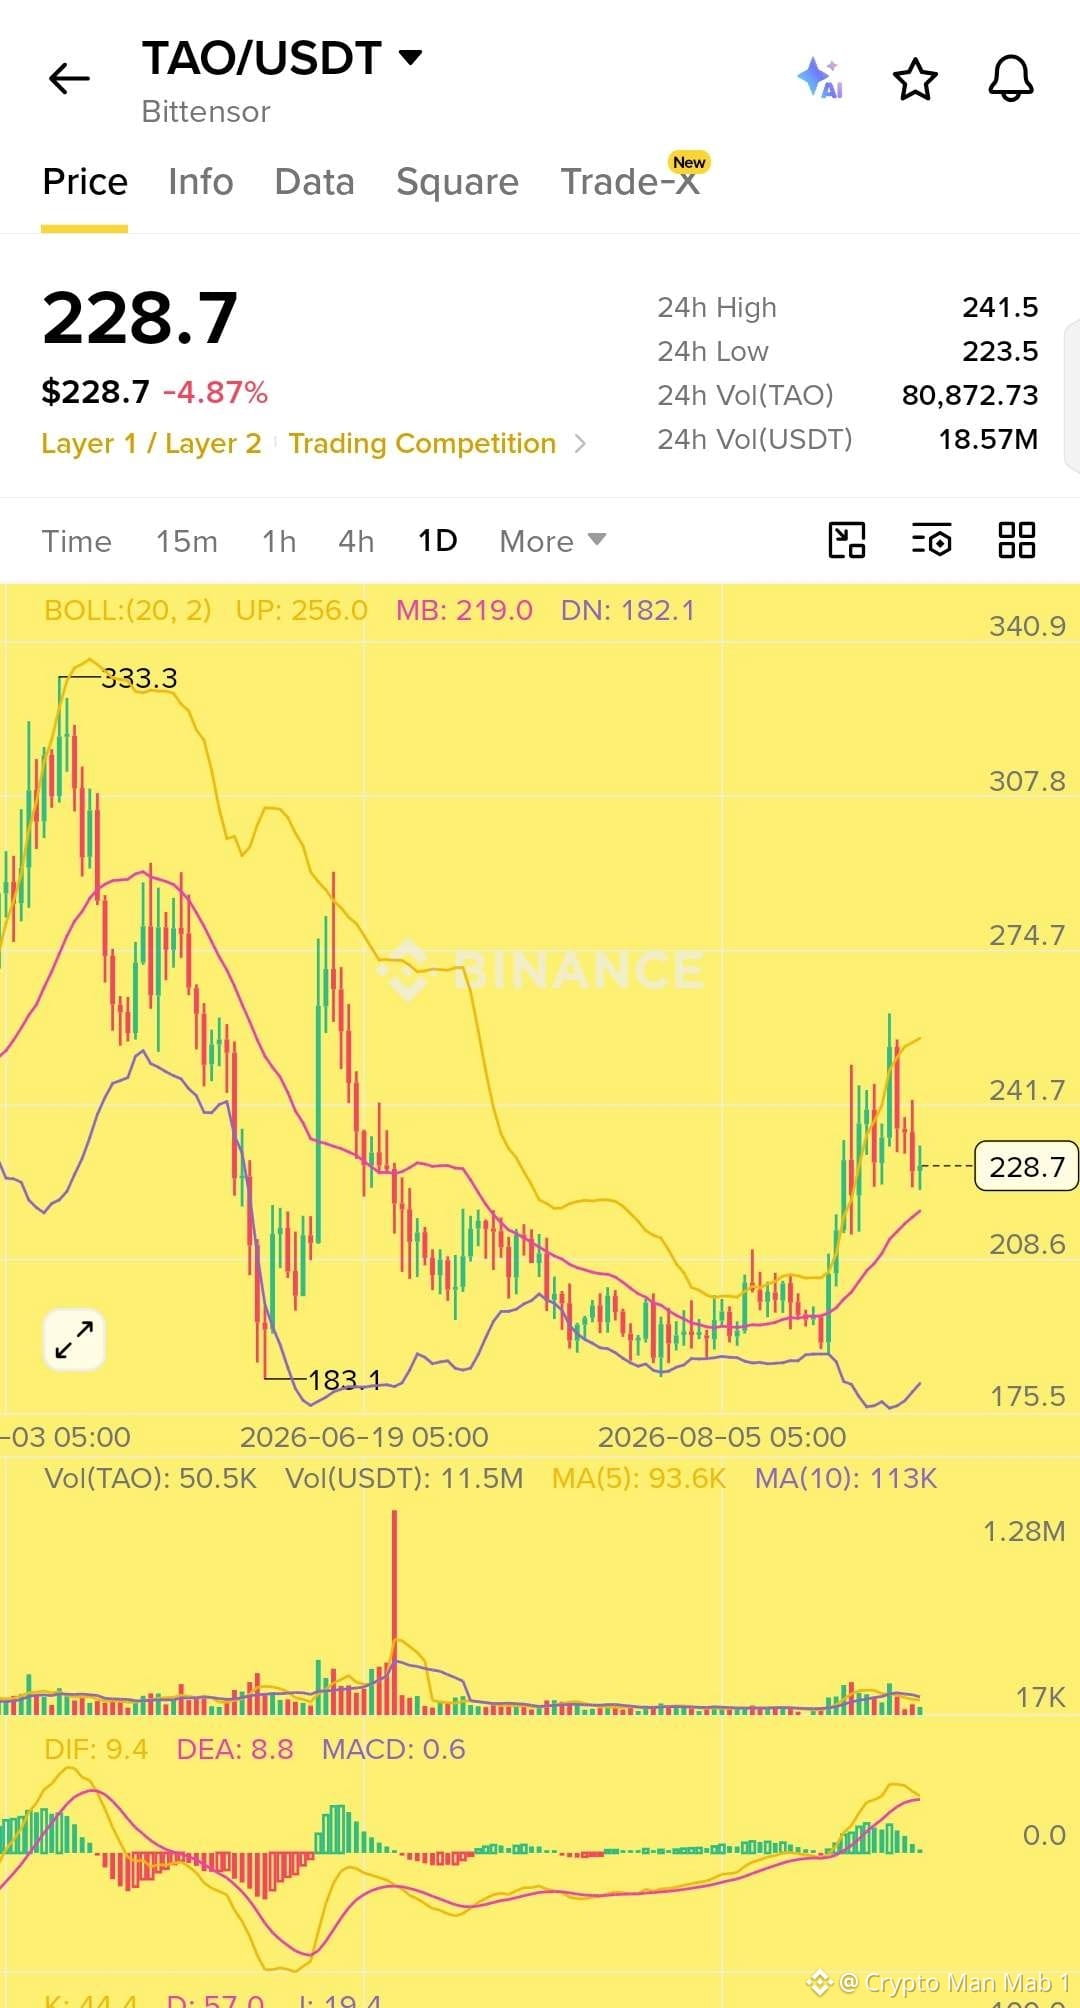
$TAO está resultando interesante después del reciente rompimiento 👀
El precio superó $240, pero ahora se está enfriando alrededor de $228. Lo importante es que la estructura general todavía se ve más fuerte que durante el descenso anterior.
La banda media diaria de Bollinger está alrededor de $219, mientras que el MACD sigue en territorio positivo. El volumen también aumentó durante el rompimiento, mostrando que hubo un interés real de compra detrás del movimiento.
Ahora mismo, TAO parece estar tomándose un respiro después del rally. Si los compradores vuelven a entrar y el precio logra recuperar la zona de $240, podría ser una señal importante de que el impulso alcista está regresando.
Por ahora, yo vigilaría cómo se comporta el precio alrededor de la región de $220 a $225 en lugar de perseguir el movimiento. 📈
$TAO está resultando interesante después del reciente rompimiento 👀
El precio superó $240, pero ahora se está enfriando alrededor de $228. Lo importante es que la estructura general todavía se ve más fuerte que durante el descenso anterior.
La banda media diaria de Bollinger está alrededor de $219, mientras que el MACD sigue en territorio positivo. El volumen también aumentó durante el rompimiento, mostrando que hubo un interés real de compra detrás del movimiento.
Ahora mismo, TAO parece estar tomándose un respiro después del rally. Si los compradores vuelven a entrar y el precio logra recuperar la zona de $240, podría ser una señal importante de que el impulso alcista está regresando.
Por ahora, yo vigilaría cómo se comporta el precio alrededor de la región de $220 a $225 en lugar de perseguir el movimiento. 📈
El precio superó $240, pero ahora se está enfriando alrededor de $228. Lo importante es que la estructura general todavía se ve más fuerte que durante el descenso anterior.
La banda media diaria de Bollinger está alrededor de $219, mientras que el MACD sigue en territorio positivo. El volumen también aumentó durante el rompimiento, mostrando que hubo un interés real de compra detrás del movimiento.
Ahora mismo, TAO parece estar tomándose un respiro después del rally. Si los compradores vuelven a entrar y el precio logra recuperar la zona de $240, podría ser una señal importante de que el impulso alcista está regresando.
Por ahora, yo vigilaría cómo se comporta el precio alrededor de la región de $220 a $225 en lugar de perseguir el movimiento. 📈
71
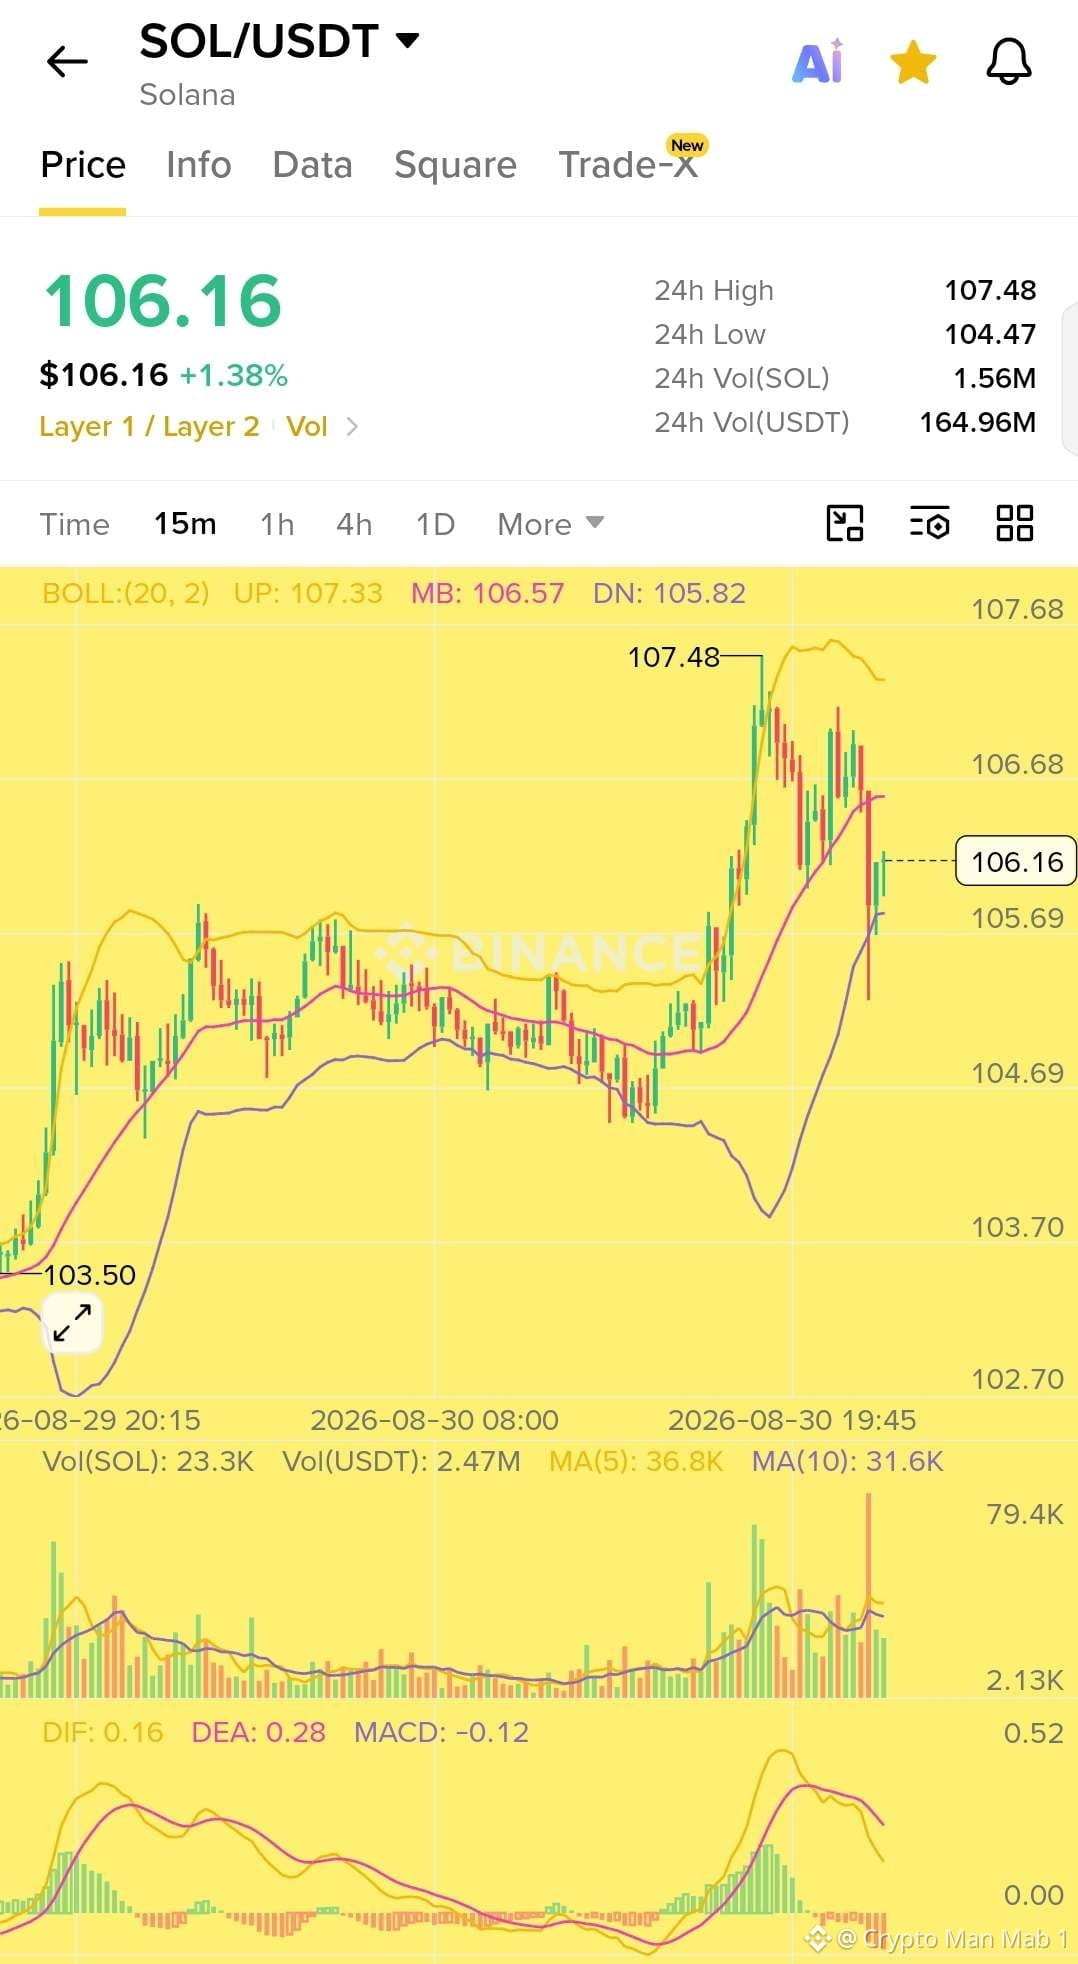
$SOLSolana la votación de gobernanza mejora la velocidad de las transacciones en un 25%
Una reciente votación de gobernanza en cadena en la red Solana ha dado como resultado un aumento del 25% en la velocidad de las transacciones, lo que marca una mejora notable en la eficiencia de la red.
La actualización se aprobó mediante el proceso de gobernanza en cadena de Solana, lo que refleja la capacidad de la red para implementar cambios a nivel de protocolo a través del consenso de la comunidad.
$SOLSolana la votación de gobernanza mejora la velocidad de las transacciones en un 25%
Una reciente votación de gobernanza en cadena en la red Solana ha dado como resultado un aumento del 25% en la velocidad de las transacciones, lo que marca una mejora notable en la eficiencia de la red.
La actualización se aprobó mediante el proceso de gobernanza en cadena de Solana, lo que refleja la capacidad de la red para implementar cambios a nivel de protocolo a través del consenso de la comunidad.
Una reciente votación de gobernanza en cadena en la red Solana ha dado como resultado un aumento del 25% en la velocidad de las transacciones, lo que marca una mejora notable en la eficiencia de la red.
La actualización se aprobó mediante el proceso de gobernanza en cadena de Solana, lo que refleja la capacidad de la red para implementar cambios a nivel de protocolo a través del consenso de la comunidad.
72
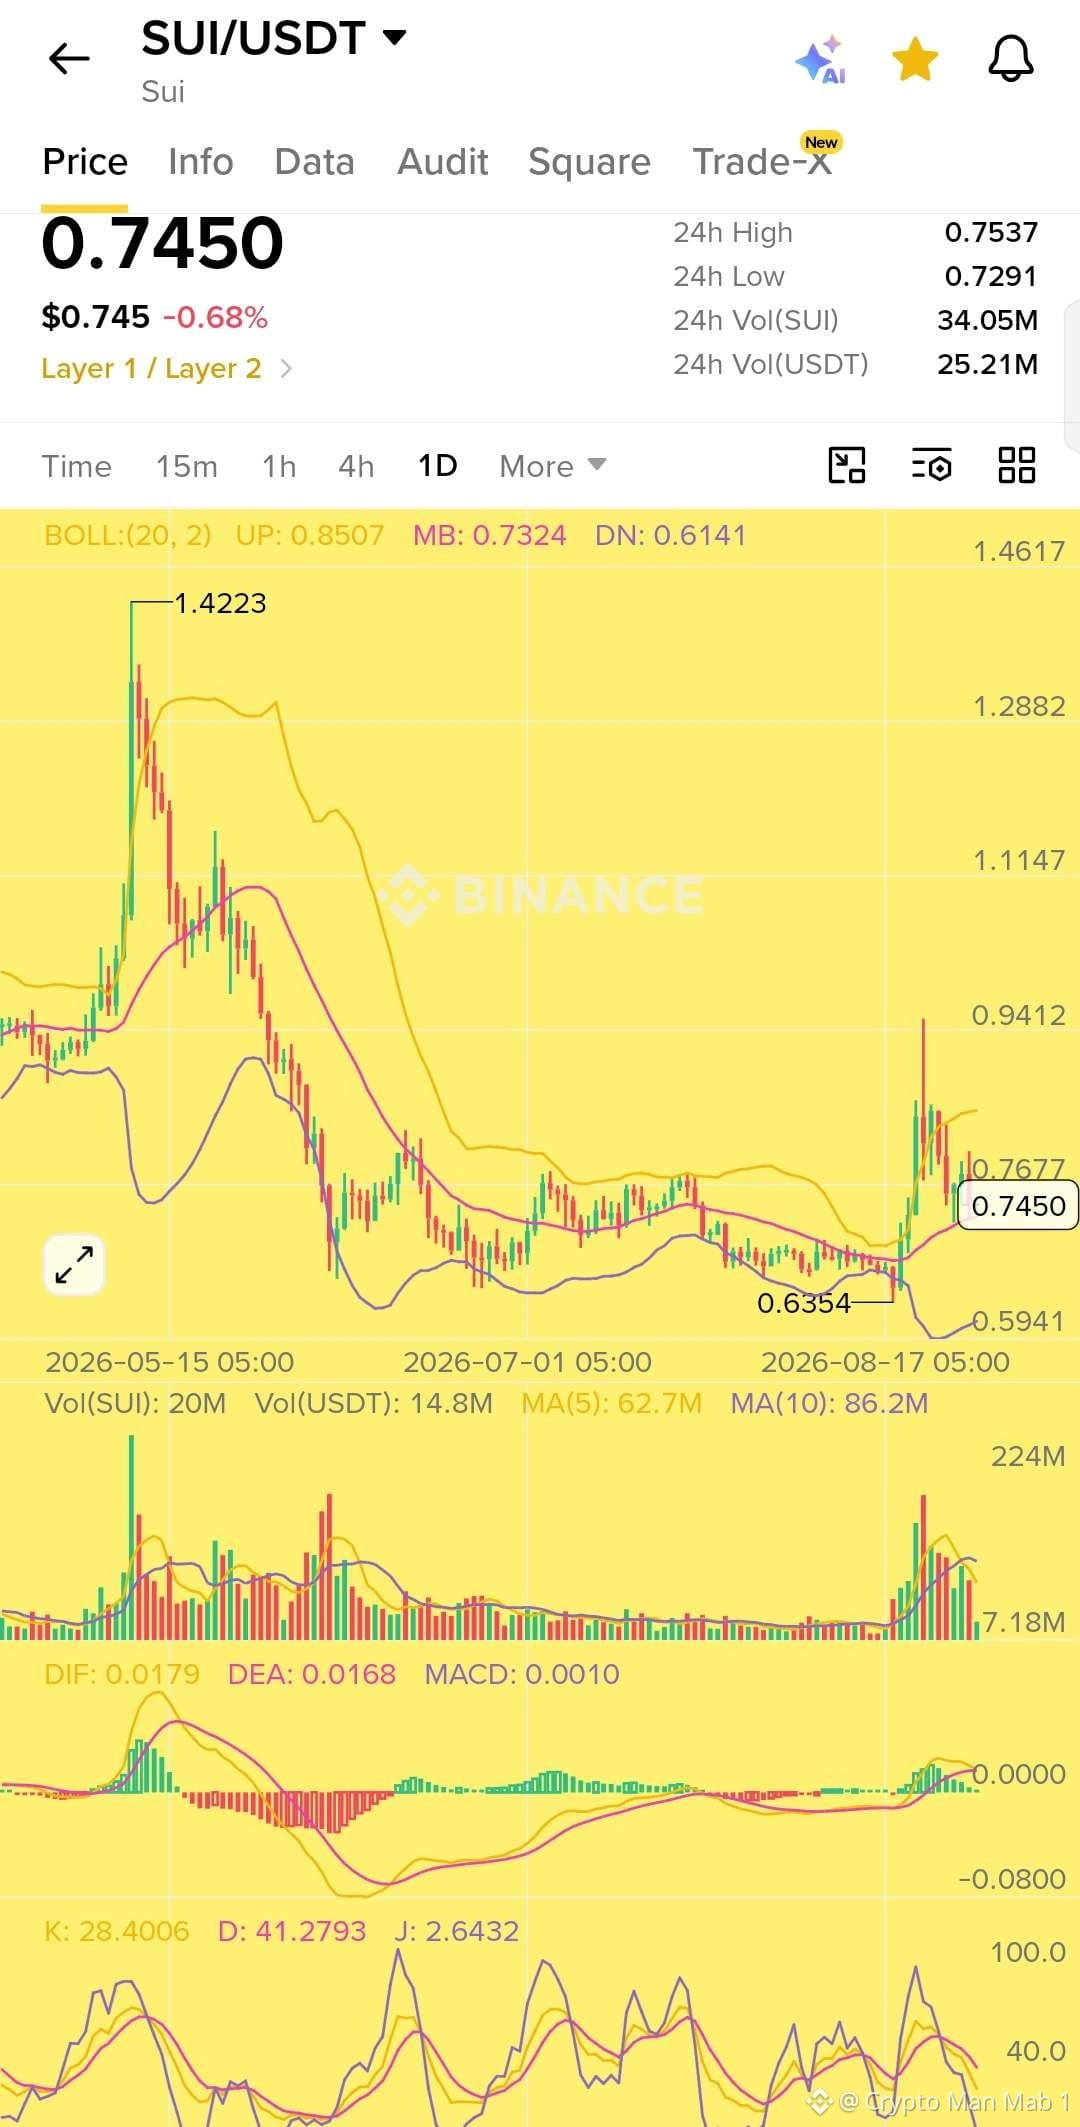
$SUI está empezando a ponerse interesante aquí 👀
El precio se mantiene alrededor de $0.745 y ha logrado seguir por encima de la banda media de Bollinger cerca de $0.732. El MACD también muestra impulso positivo, mientras que el volumen ha aumentado después del movimiento reciente.
El nivel clave a vigilar ahora es $0.767. Un cierre diario fuerte por encima de esta zona podría abrir el camino hacia $0.80, luego $0.85 y potencialmente $0.94.
Para mí, $0.72 a $0.75 es una zona interesante para vigilar un setup largo.
Entrada: $0.72 a $0.75
Confirmación: Ruptura y cierre por encima de $0.767
TP: $0.80 $0.85 $0.94
SL: $0.70
Si $0.70 se rompe con una fuerte presión vendedora, me mantendría alejado de las compras (long) porque $0.635 podría volver a entrar en juego.
Vigilando $SUI de cerca desde aquí. 📈
$SUI está empezando a ponerse interesante aquí 👀
El precio se mantiene alrededor de $0.745 y ha logrado seguir por encima de la banda media de Bollinger cerca de $0.732. El MACD también muestra impulso positivo, mientras que el volumen ha aumentado después del movimiento reciente.
El nivel clave a vigilar ahora es $0.767. Un cierre diario fuerte por encima de esta zona podría abrir el camino hacia $0.80, luego $0.85 y potencialmente $0.94.
Para mí, $0.72 a $0.75 es una zona interesante para vigilar un setup largo.
Entrada: $0.72 a $0.75
Confirmación: Ruptura y cierre por encima de $0.767
TP: $0.80 $0.85 $0.94
SL: $0.70
Si $0.70 se rompe con una fuerte presión vendedora, me mantendría alejado de las compras (long) porque $0.635 podría volver a entrar en juego.
Vigilando $SUI de cerca desde aquí. 📈
El precio se mantiene alrededor de $0.745 y ha logrado seguir por encima de la banda media de Bollinger cerca de $0.732. El MACD también muestra impulso positivo, mientras que el volumen ha aumentado después del movimiento reciente.
El nivel clave a vigilar ahora es $0.767. Un cierre diario fuerte por encima de esta zona podría abrir el camino hacia $0.80, luego $0.85 y potencialmente $0.94.
Para mí, $0.72 a $0.75 es una zona interesante para vigilar un setup largo.
Entrada: $0.72 a $0.75
Confirmación: Ruptura y cierre por encima de $0.767
TP: $0.80 $0.85 $0.94
SL: $0.70
Si $0.70 se rompe con una fuerte presión vendedora, me mantendría alejado de las compras (long) porque $0.635 podría volver a entrar en juego.
Vigilando $SUI de cerca desde aquí. 📈
76
$BTC 🟠 Bitcoin Completa Su Primera Transacción Cuánticamente Segura
Según se informa, Bitcoin ha completado su primera transacción asegurada con QSB o Quantum Safe Bitcoin.
El nuevo enfoque está diseñado para proteger a Bitcoin frente al algoritmo de Shor, que teóricamente podría permitir que computadoras cuánticas poderosas rompan la criptografía de curva elíptica en la que Bitcoin se basa actualmente.
Lo que hace interesante a QSB es que funciona dentro de las reglas heredadas existentes de Bitcoin. No se requirió un hard fork ni un cambio de consenso para ejecutar la transacción.
A medida que la computación cuántica siga avanzando, esto podría convertirse en un paso importante para hacer que Bitcoin sea más resistente frente a futuras amenazas criptográficas.
La computación cuántica quizá aún esté a años de representar una amenaza real, pero prepararse para ello hoy podría ser uno de los desafíos más importantes para la seguridad a largo plazo de Bitcoin. 🟠
$BTC 🟠 Bitcoin Completa Su Primera Transacción Cuánticamente Segura
Según se informa, Bitcoin ha completado su primera transacción asegurada con QSB o Quantum Safe Bitcoin.
El nuevo enfoque está diseñado para proteger a Bitcoin frente al algoritmo de Shor, que teóricamente podría permitir que computadoras cuánticas poderosas rompan la criptografía de curva elíptica en la que Bitcoin se basa actualmente.
Lo que hace interesante a QSB es que funciona dentro de las reglas heredadas existentes de Bitcoin. No se requirió un hard fork ni un cambio de consenso para ejecutar la transacción.
A medida que la computación cuántica siga avanzando, esto podría convertirse en un paso importante para hacer que Bitcoin sea más resistente frente a futuras amenazas criptográficas.
La computación cuántica quizá aún esté a años de representar una amenaza real, pero prepararse para ello hoy podría ser uno de los desafíos más importantes para la seguridad a largo plazo de Bitcoin. 🟠
Según se informa, Bitcoin ha completado su primera transacción asegurada con QSB o Quantum Safe Bitcoin.
El nuevo enfoque está diseñado para proteger a Bitcoin frente al algoritmo de Shor, que teóricamente podría permitir que computadoras cuánticas poderosas rompan la criptografía de curva elíptica en la que Bitcoin se basa actualmente.
Lo que hace interesante a QSB es que funciona dentro de las reglas heredadas existentes de Bitcoin. No se requirió un hard fork ni un cambio de consenso para ejecutar la transacción.
A medida que la computación cuántica siga avanzando, esto podría convertirse en un paso importante para hacer que Bitcoin sea más resistente frente a futuras amenazas criptográficas.
La computación cuántica quizá aún esté a años de representar una amenaza real, pero prepararse para ello hoy podría ser uno de los desafíos más importantes para la seguridad a largo plazo de Bitcoin. 🟠

68
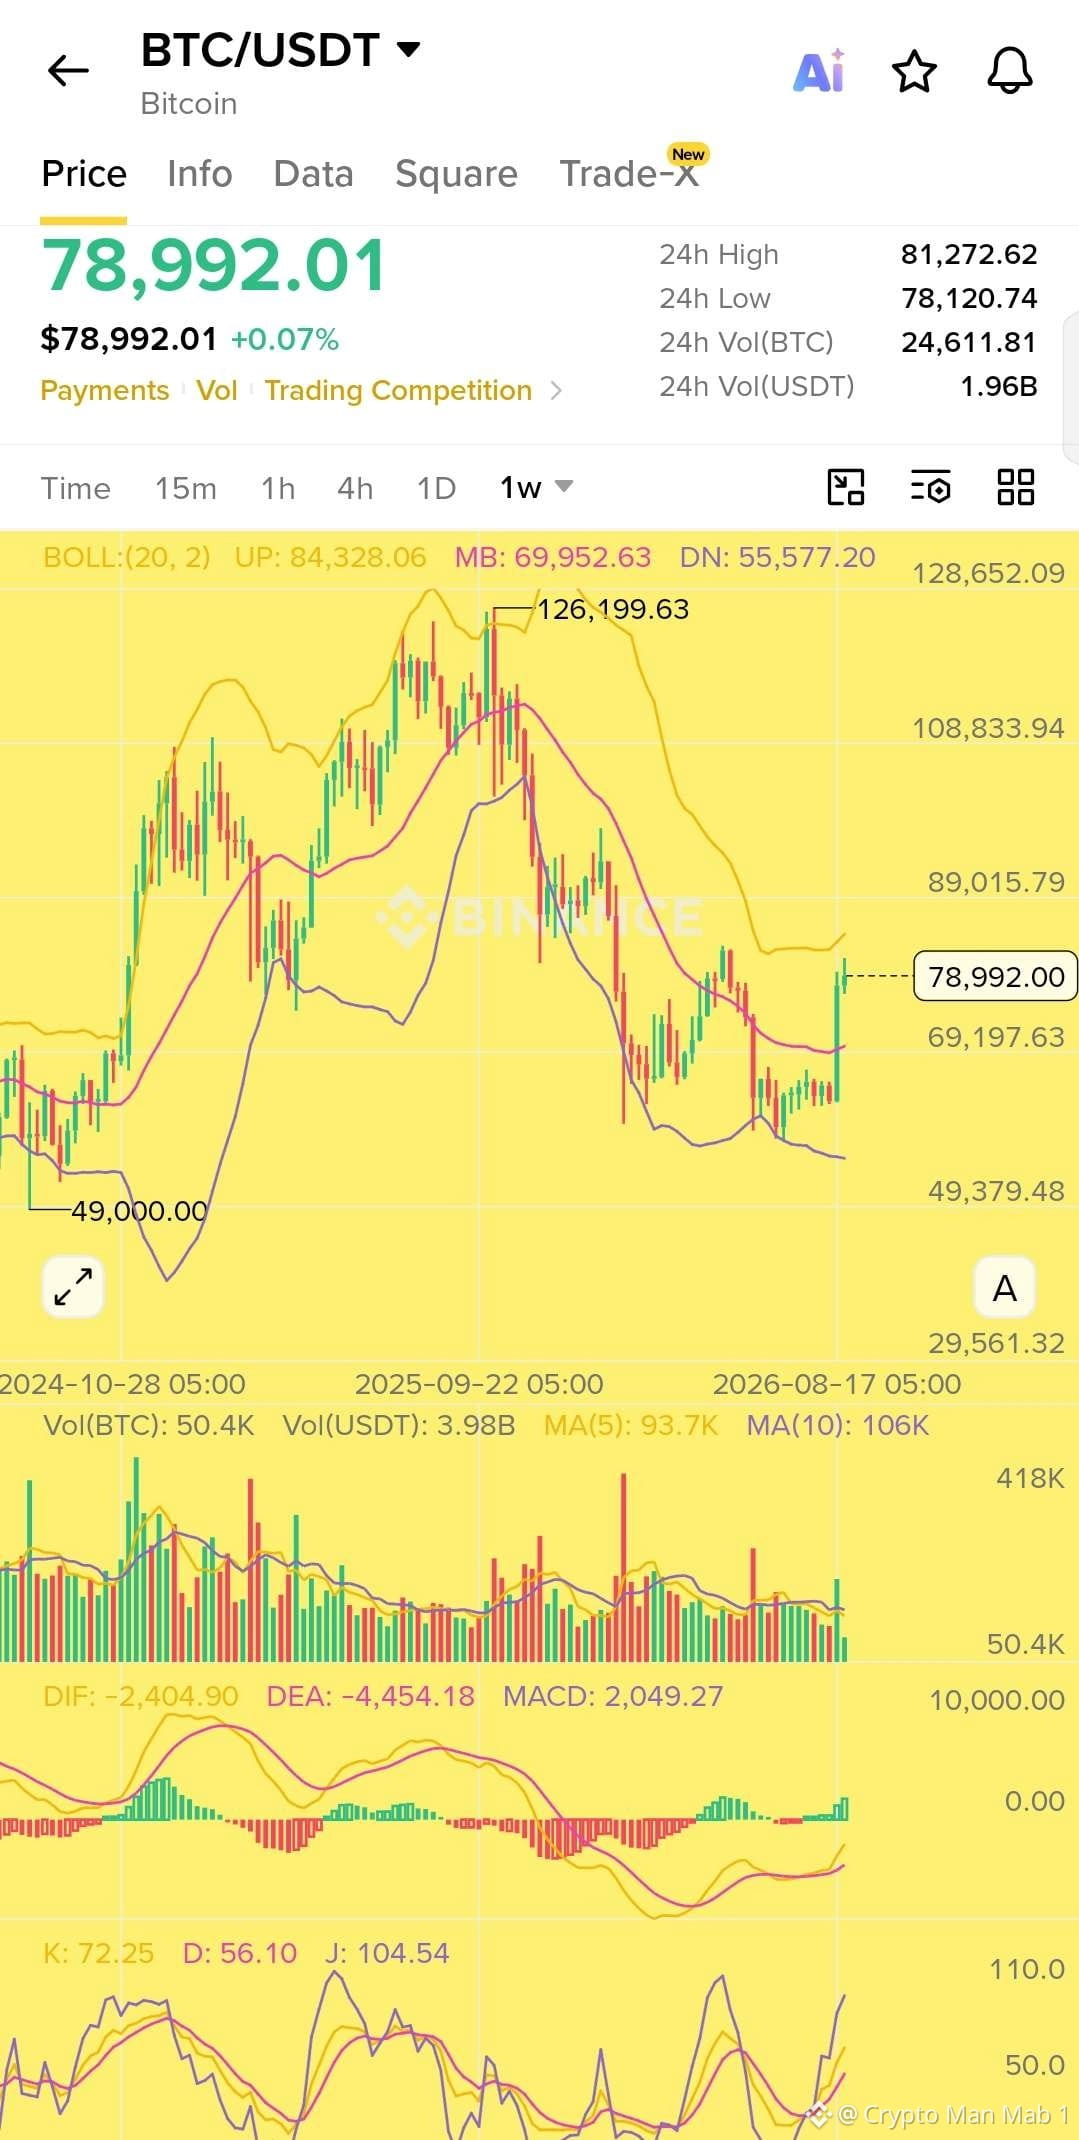
$BTC vuelve a empezar a verse interesante otra vez 👀
En el gráfico semanal, Bitcoin ha logrado volver a situarse por encima de la zona de $78K después de recuperarse con fuerza desde la zona de $55K.
El nivel importante ahora es de $81K a $84K. Ahí es donde espero que los vendedores pongan a prueba la fuerza de este movimiento.
Si BTC rompe y cierra la semana por encima de $84.3K, entonces la siguiente gran zona a vigilar está alrededor de $89K.
El impulso también está mejorando. El MACD se ha vuelto positivo y la estructura semanal luce mucho más fuerte que hace unas semanas.
Pero no iría tras el impulso sin más.
Si BTC es rechazado entre $81K y $84K, entonces no me sorprendería una corrección hacia $75K o incluso $70K.
Para mí, el nivel clave sigue siendo $70K.
Por encima de ese nivel, todavía soy alcista.
Ahora BTC necesita demostrar que esta recuperación es más que un simple rebote. 👀
$BTC vuelve a empezar a verse interesante otra vez 👀
En el gráfico semanal, Bitcoin ha logrado volver a situarse por encima de la zona de $78K después de recuperarse con fuerza desde la zona de $55K.
El nivel importante ahora es de $81K a $84K. Ahí es donde espero que los vendedores pongan a prueba la fuerza de este movimiento.
Si BTC rompe y cierra la semana por encima de $84.3K, entonces la siguiente gran zona a vigilar está alrededor de $89K.
El impulso también está mejorando. El MACD se ha vuelto positivo y la estructura semanal luce mucho más fuerte que hace unas semanas.
Pero no iría tras el impulso sin más.
Si BTC es rechazado entre $81K y $84K, entonces no me sorprendería una corrección hacia $75K o incluso $70K.
Para mí, el nivel clave sigue siendo $70K.
Por encima de ese nivel, todavía soy alcista.
Ahora BTC necesita demostrar que esta recuperación es más que un simple rebote. 👀
En el gráfico semanal, Bitcoin ha logrado volver a situarse por encima de la zona de $78K después de recuperarse con fuerza desde la zona de $55K.
El nivel importante ahora es de $81K a $84K. Ahí es donde espero que los vendedores pongan a prueba la fuerza de este movimiento.
Si BTC rompe y cierra la semana por encima de $84.3K, entonces la siguiente gran zona a vigilar está alrededor de $89K.
El impulso también está mejorando. El MACD se ha vuelto positivo y la estructura semanal luce mucho más fuerte que hace unas semanas.
Pero no iría tras el impulso sin más.
Si BTC es rechazado entre $81K y $84K, entonces no me sorprendería una corrección hacia $75K o incluso $70K.
Para mí, el nivel clave sigue siendo $70K.
Por encima de ese nivel, todavía soy alcista.
Ahora BTC necesita demostrar que esta recuperación es más que un simple rebote. 👀
93
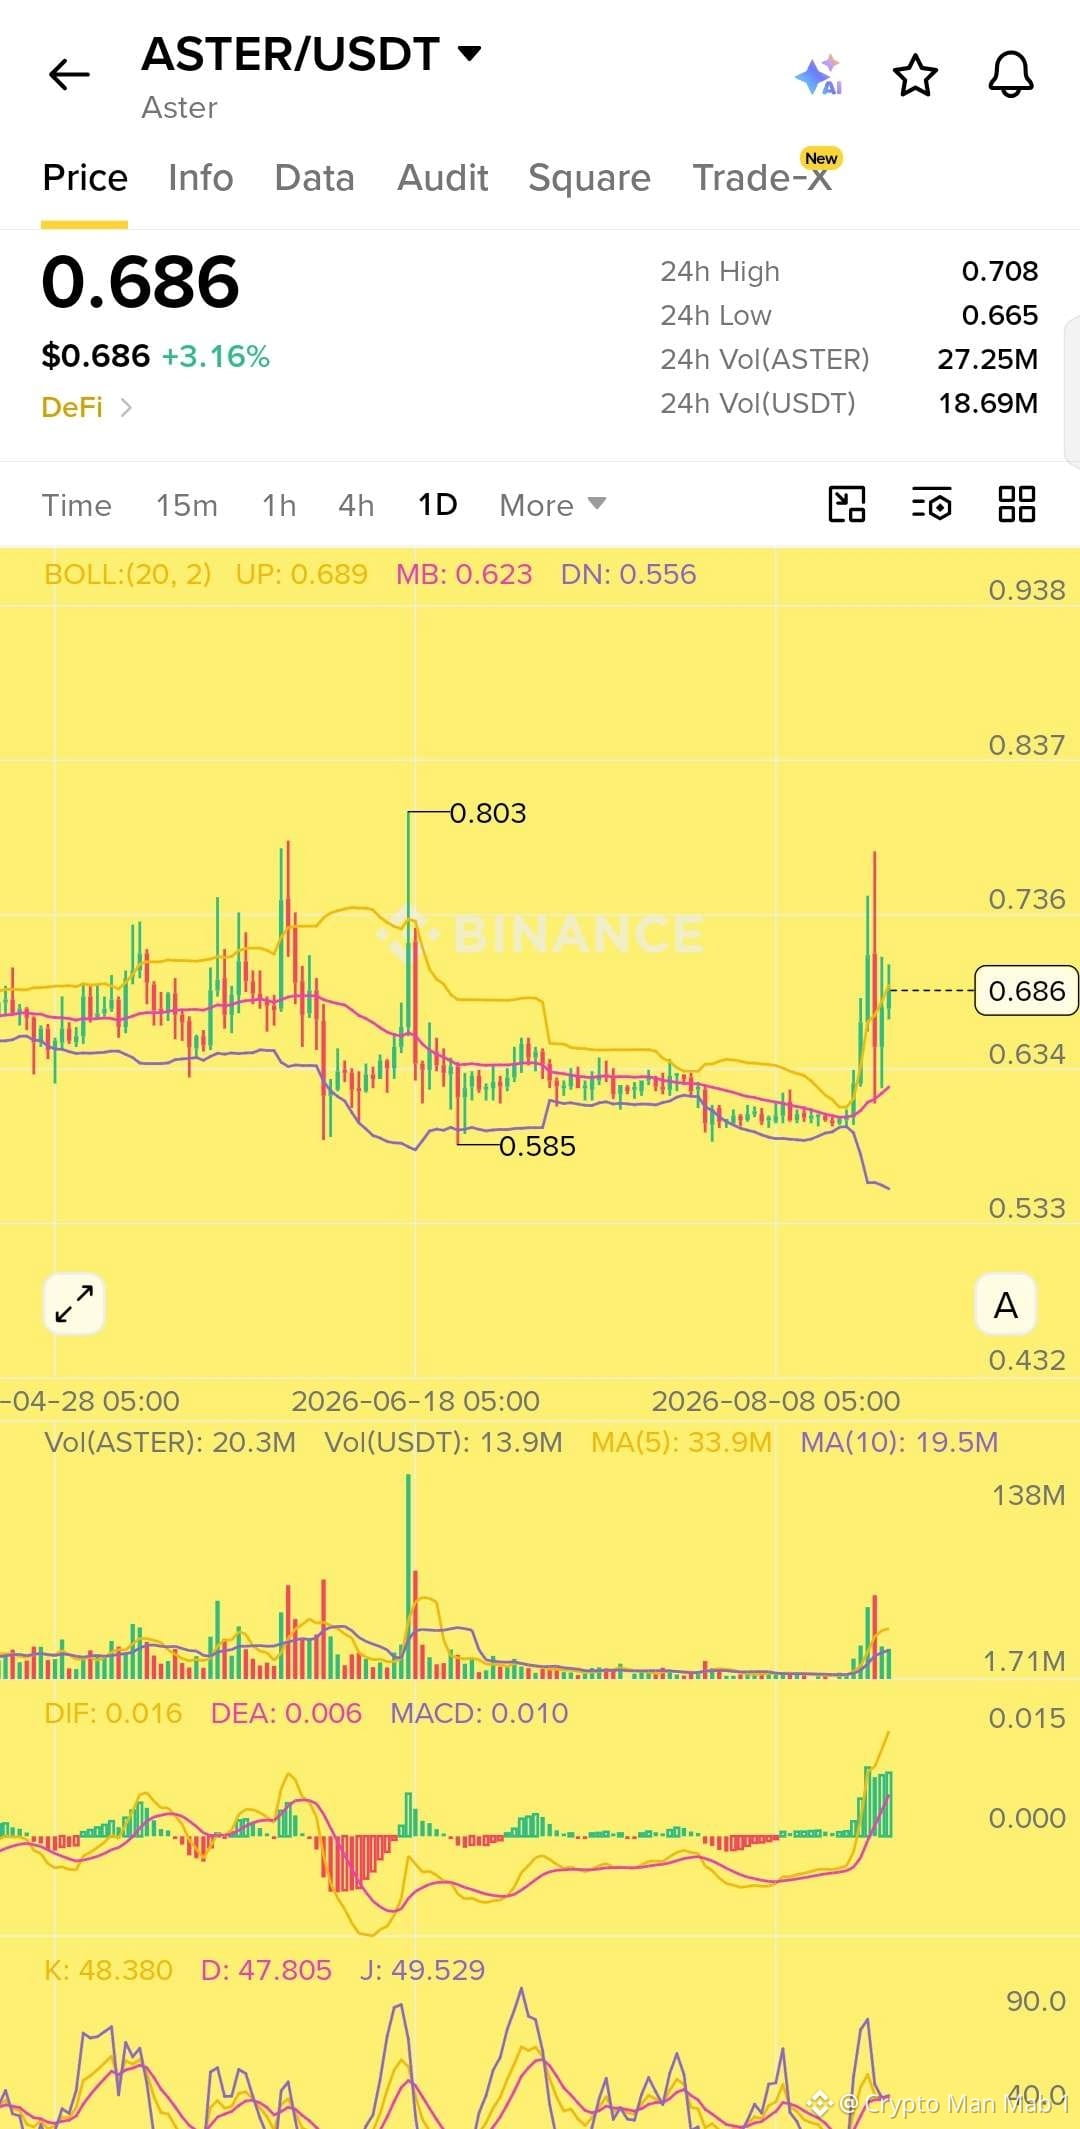
$ASTER y World LibertyFi están abriendo grandes recompensas para mercados de USD1 👀
Aster ha lanzado la Fase 1 de su campaña de RWA de USD1, que se ejecutará hasta el 31 de diciembre de 2026.
La campaña incluye:
125M en recompensas $WLFI basadas en el interés abierto elegible
6.25M en recompensas $USD1 basadas en el volumen de operaciones elegible
Y lo interesante es que puedes calificar para ambos pools de recompensas, porque el interés abierto y el volumen de operaciones se calculan por separado.
Aster también está otorgando a las posiciones elegibles de RWA denominadas en USD1 un impulso de 2x en el interés abierto.
Para obtener el impulso completo en el Modo de Activo Único necesitas usar solo USD1 como garantía.
En el Modo de Múltiples Activos, USD1 debe representar más del 50% de tu garantía promedio.
Esto podría hacer que los mercados de RWA de USD1 sean muy interesantes para traders que buscan maximizar recompensas mientras operan.
Mantén un ojo en este 👀
$ASTER y World LibertyFi están abriendo grandes recompensas para mercados de USD1 👀
Aster ha lanzado la Fase 1 de su campaña de RWA de USD1, que se ejecutará hasta el 31 de diciembre de 2026.
La campaña incluye:
125M en recompensas $WLFI basadas en el interés abierto elegible
6.25M en recompensas $USD1 basadas en el volumen de operaciones elegible
Y lo interesante es que puedes calificar para ambos pools de recompensas, porque el interés abierto y el volumen de operaciones se calculan por separado.
Aster también está otorgando a las posiciones elegibles de RWA denominadas en USD1 un impulso de 2x en el interés abierto.
Para obtener el impulso completo en el Modo de Activo Único necesitas usar solo USD1 como garantía.
En el Modo de Múltiples Activos, USD1 debe representar más del 50% de tu garantía promedio.
Esto podría hacer que los mercados de RWA de USD1 sean muy interesantes para traders que buscan maximizar recompensas mientras operan.
Mantén un ojo en este 👀
Aster ha lanzado la Fase 1 de su campaña de RWA de USD1, que se ejecutará hasta el 31 de diciembre de 2026.
La campaña incluye:
125M en recompensas $WLFI basadas en el interés abierto elegible
6.25M en recompensas $USD1 basadas en el volumen de operaciones elegible
Y lo interesante es que puedes calificar para ambos pools de recompensas, porque el interés abierto y el volumen de operaciones se calculan por separado.
Aster también está otorgando a las posiciones elegibles de RWA denominadas en USD1 un impulso de 2x en el interés abierto.
Para obtener el impulso completo en el Modo de Activo Único necesitas usar solo USD1 como garantía.
En el Modo de Múltiples Activos, USD1 debe representar más del 50% de tu garantía promedio.
Esto podría hacer que los mercados de RWA de USD1 sean muy interesantes para traders que buscan maximizar recompensas mientras operan.
Mantén un ojo en este 👀
70
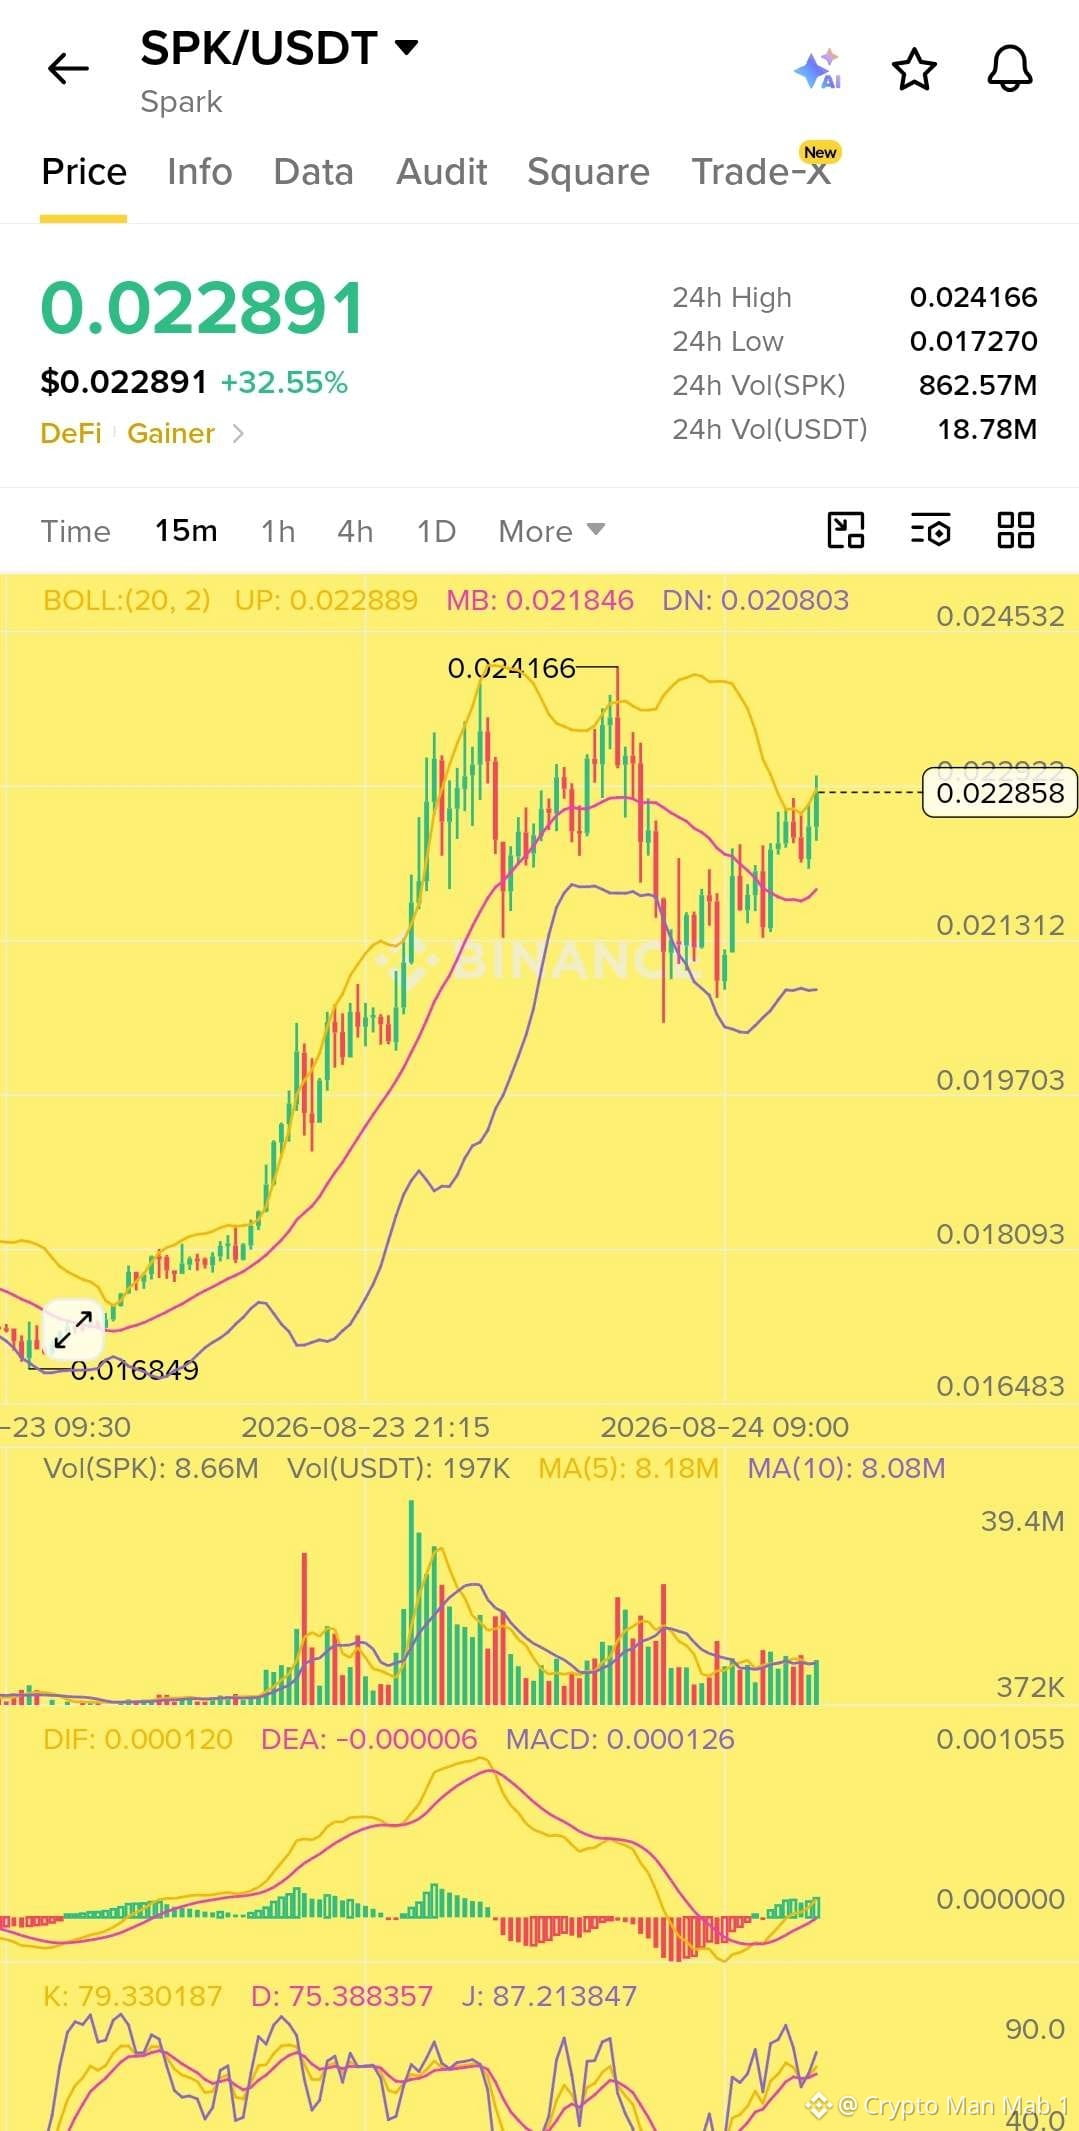
$SPK muestra un fuerte impulso alcista en el gráfico de 15M 📈
El precio está actualmente alrededor de $0.02289 después de un movimiento alcista contundente. El MACD está virando a alcista y el precio se mantiene por encima de la banda media de Bollinger, lo que mantiene positiva la estructura a corto plazo.
La zona clave a vigilar es $0.0230-$0.0232. Una ruptura limpia con volumen fuerte podría abrir el camino hacia $0.0238 y luego hacia el máximo de 24H alrededor de $0.02416.
Sin embargo, el KDJ ya está en zona de sobrecompra, así que perseguir el precio actual es arriesgado. Un retroceso hacia $0.0220-$0.0223 podría ofrecer una mejor entrada larga si el soporte se mantiene.
Soporte: $0.0220-$0.0223
Resistencia: $0.0230-$0.0232
Siguiente objetivo: $0.0238-$0.02416
Alcista mientras se mantenga por encima del soporte, pero ojo con una posible resistencia cerca de la zona de resistencia. DYOR.
$SPK muestra un fuerte impulso alcista en el gráfico de 15M 📈
El precio está actualmente alrededor de $0.02289 después de un movimiento alcista contundente. El MACD está virando a alcista y el precio se mantiene por encima de la banda media de Bollinger, lo que mantiene positiva la estructura a corto plazo.
La zona clave a vigilar es $0.0230-$0.0232. Una ruptura limpia con volumen fuerte podría abrir el camino hacia $0.0238 y luego hacia el máximo de 24H alrededor de $0.02416.
Sin embargo, el KDJ ya está en zona de sobrecompra, así que perseguir el precio actual es arriesgado. Un retroceso hacia $0.0220-$0.0223 podría ofrecer una mejor entrada larga si el soporte se mantiene.
Soporte: $0.0220-$0.0223
Resistencia: $0.0230-$0.0232
Siguiente objetivo: $0.0238-$0.02416
Alcista mientras se mantenga por encima del soporte, pero ojo con una posible resistencia cerca de la zona de resistencia. DYOR.
El precio está actualmente alrededor de $0.02289 después de un movimiento alcista contundente. El MACD está virando a alcista y el precio se mantiene por encima de la banda media de Bollinger, lo que mantiene positiva la estructura a corto plazo.
La zona clave a vigilar es $0.0230-$0.0232. Una ruptura limpia con volumen fuerte podría abrir el camino hacia $0.0238 y luego hacia el máximo de 24H alrededor de $0.02416.
Sin embargo, el KDJ ya está en zona de sobrecompra, así que perseguir el precio actual es arriesgado. Un retroceso hacia $0.0220-$0.0223 podría ofrecer una mejor entrada larga si el soporte se mantiene.
Soporte: $0.0220-$0.0223
Resistencia: $0.0230-$0.0232
Siguiente objetivo: $0.0238-$0.02416
Alcista mientras se mantenga por encima del soporte, pero ojo con una posible resistencia cerca de la zona de resistencia. DYOR.
75
Zcash ha alcanzado oficialmente su precio más alto en 8 años.
$ZEC subió un 47% hasta los $865, un nivel que no veía desde enero de 2018, según CoinDesk.
En junio, el token se desplomó hasta $250 después de que una IA descubriera una vulnerabilidad crítica de falsificación que había estado activa durante cuatro años. Desde ese mínimo, $ZEC ha repuntado 3.4x.
El repunte tomó más velocidad después de que Grayscale presentara una solicitud para convertir su Fideicomiso de Zcash en lo que sería el primer ETF spot de ZEC en EE. UU., según The Block.
Incluso con este impulso, $ZEC todavía está aproximadamente un 73% por debajo de su máximo histórico de $3,191.
Zcash ha alcanzado oficialmente su precio más alto en 8 años.
$ZEC subió un 47% hasta los $865, un nivel que no veía desde enero de 2018, según CoinDesk.
En junio, el token se desplomó hasta $250 después de que una IA descubriera una vulnerabilidad crítica de falsificación que había estado activa durante cuatro años. Desde ese mínimo, $ZEC ha repuntado 3.4x.
El repunte tomó más velocidad después de que Grayscale presentara una solicitud para convertir su Fideicomiso de Zcash en lo que sería el primer ETF spot de ZEC en EE. UU., según The Block.
Incluso con este impulso, $ZEC todavía está aproximadamente un 73% por debajo de su máximo histórico de $3,191.
$ZEC subió un 47% hasta los $865, un nivel que no veía desde enero de 2018, según CoinDesk.
En junio, el token se desplomó hasta $250 después de que una IA descubriera una vulnerabilidad crítica de falsificación que había estado activa durante cuatro años. Desde ese mínimo, $ZEC ha repuntado 3.4x.
El repunte tomó más velocidad después de que Grayscale presentara una solicitud para convertir su Fideicomiso de Zcash en lo que sería el primer ETF spot de ZEC en EE. UU., según The Block.
Incluso con este impulso, $ZEC todavía está aproximadamente un 73% por debajo de su máximo histórico de $3,191.
54
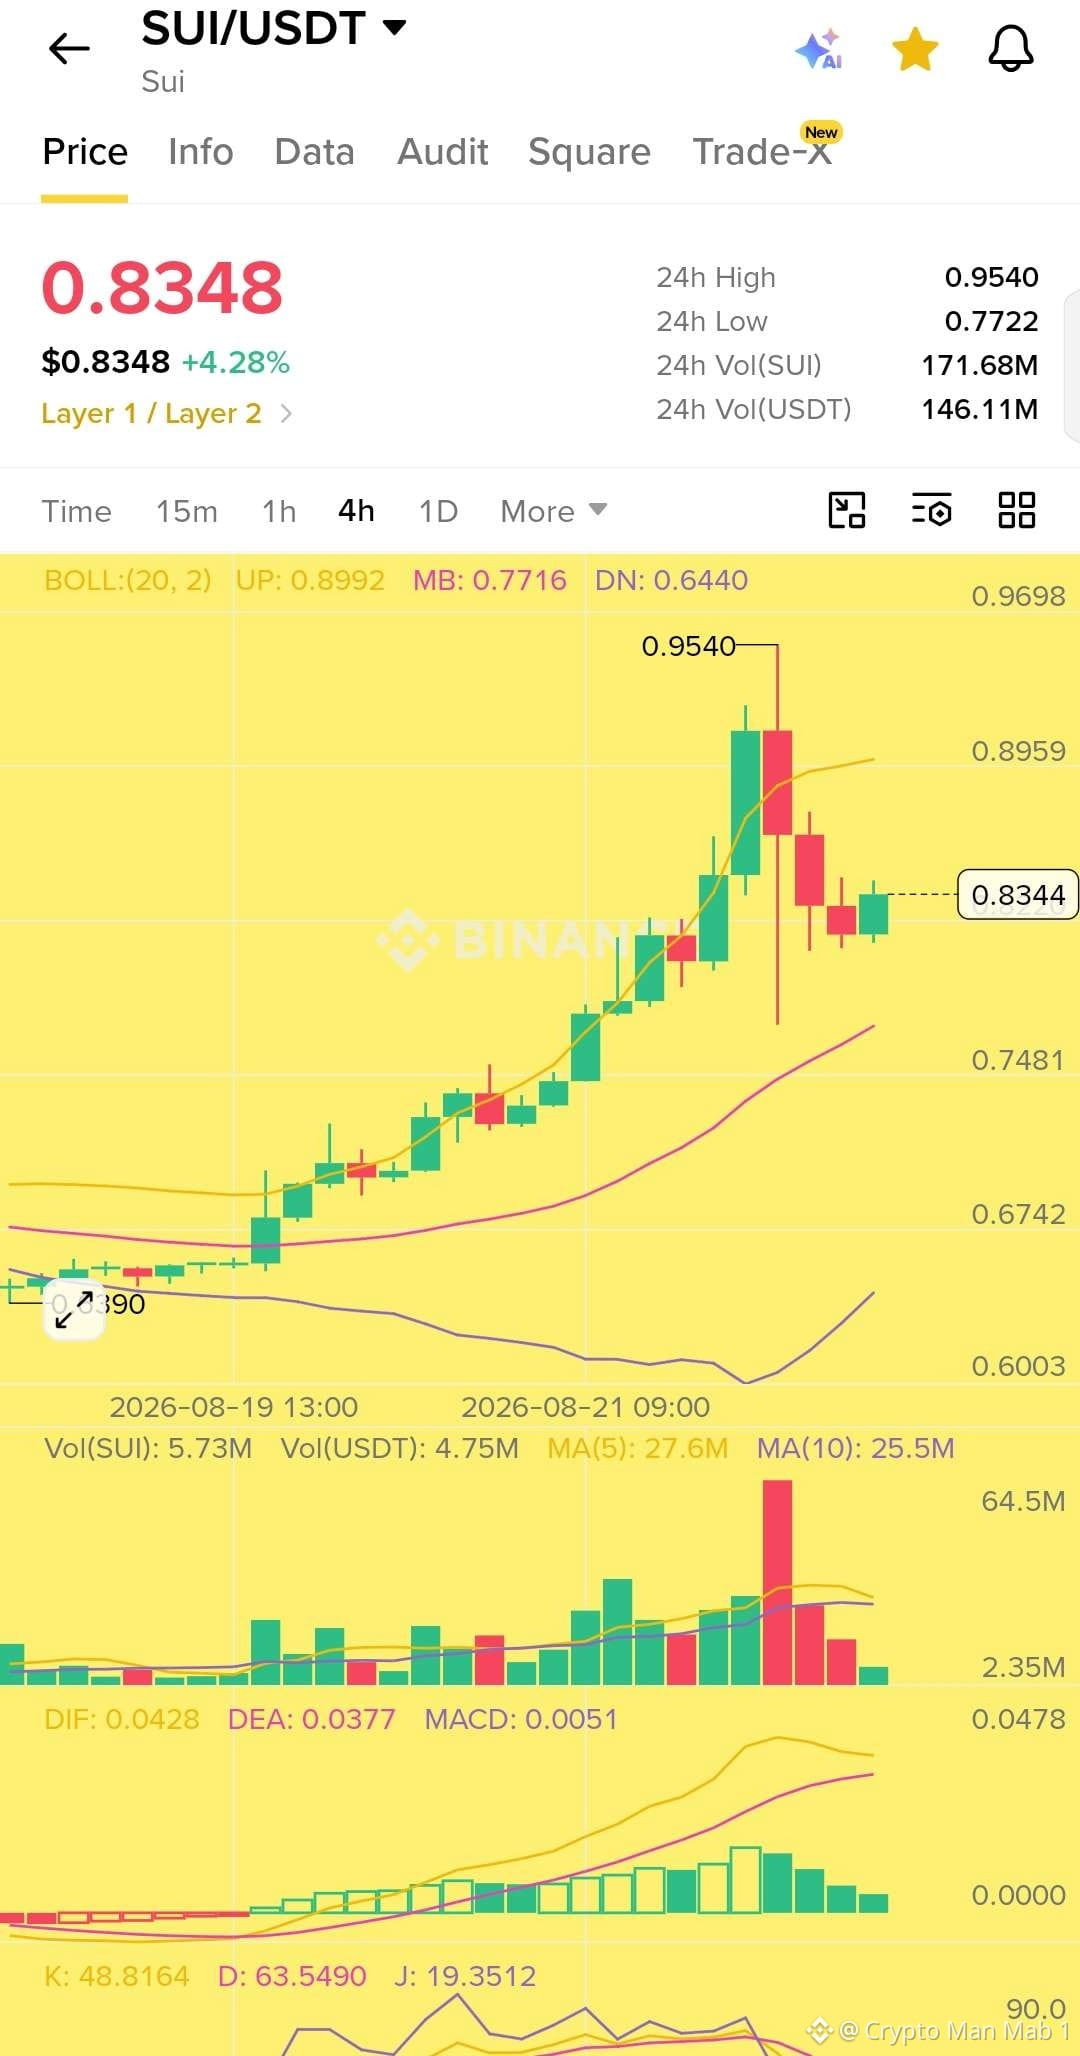
$SUI ahora mismo sentado en $0.8348, +4.28% en el día. Honesta y salvajes estos últimos días: esto pasó de estar alrededor de $0.60 hasta $0.954, y luego se enfrió.
Esa vela superior vino con un pico de volumen masivo (la barra más grande de todo el gráfico), lo que normalmente significa que la gente empezó a tomar ganancias con fuerza. Desde entonces ha estado retrocediendo; ahora ronda la zona de $0.77 a $0.83.
Aun así, técnicamente sigue en una tendencia alcista. El MACD se mantiene positivo, el precio está por encima de las medias móviles clave, pero el impulso a corto plazo (KDJ) empieza a debilitarse un poco. Así que esto se siente más como una pausa que como una reversión completa, pero vale la pena vigilarlo si puede mantenerse por encima del soporte de $0.77 a $0.80.
No es asesoramiento financiero, solo seguimiento del gráfico. HAZ TU PROPIA INVESTIGACIÓN 🙏
$SUI ahora mismo sentado en $0.8348, +4.28% en el día. Honesta y salvajes estos últimos días: esto pasó de estar alrededor de $0.60 hasta $0.954, y luego se enfrió.
Esa vela superior vino con un pico de volumen masivo (la barra más grande de todo el gráfico), lo que normalmente significa que la gente empezó a tomar ganancias con fuerza. Desde entonces ha estado retrocediendo; ahora ronda la zona de $0.77 a $0.83.
Aun así, técnicamente sigue en una tendencia alcista. El MACD se mantiene positivo, el precio está por encima de las medias móviles clave, pero el impulso a corto plazo (KDJ) empieza a debilitarse un poco. Así que esto se siente más como una pausa que como una reversión completa, pero vale la pena vigilarlo si puede mantenerse por encima del soporte de $0.77 a $0.80.
No es asesoramiento financiero, solo seguimiento del gráfico. HAZ TU PROPIA INVESTIGACIÓN 🙏
Esa vela superior vino con un pico de volumen masivo (la barra más grande de todo el gráfico), lo que normalmente significa que la gente empezó a tomar ganancias con fuerza. Desde entonces ha estado retrocediendo; ahora ronda la zona de $0.77 a $0.83.
Aun así, técnicamente sigue en una tendencia alcista. El MACD se mantiene positivo, el precio está por encima de las medias móviles clave, pero el impulso a corto plazo (KDJ) empieza a debilitarse un poco. Así que esto se siente más como una pausa que como una reversión completa, pero vale la pena vigilarlo si puede mantenerse por encima del soporte de $0.77 a $0.80.
No es asesoramiento financiero, solo seguimiento del gráfico. HAZ TU PROPIA INVESTIGACIÓN 🙏
63
Inicia sesión para explorar más contenidos
Únete a usuarios de criptomonedas de todo el mundo en Binance Square
⚡️ Obtén la información más reciente y útil sobre criptomonedas.
💬 Confía en el mayor exchange de criptomonedas del mundo.
👍 Descubre opiniones reales de creadores verificados.
Correo electrónico/número de teléfono
Temas en tendencia
BOJRaisesRatesTo31YearHigh
28,692 visualizaciones
702 participa(n) en el debate
Bitcoin Recupera el Protagonismo mientras la Presión Macroeconómica No Logra Romper la Demanda de Cripto
Fatima_Tariq
·10 «Me gusta»
·5.4k visualizaciones
BuffettStepsDownAsBerkshireChairman
9,031 visualizaciones
284 participa(n) en el debate
XRPExchangeReservesHitSevenYearLow
13,189 visualizaciones
301 participa(n) en el debate