
KCM 1
134 Publicaciones

KCM 1
Denunciar
Bloquear usuario
0 Siguiendo
6 Seguidores
18 Me gusta
Publicaciones
·
--
Ver traducción
While the consensus watches for a local bounce, this wave correction layout on $BTC points toward a deeper structural pull down to complete the corrective pattern.
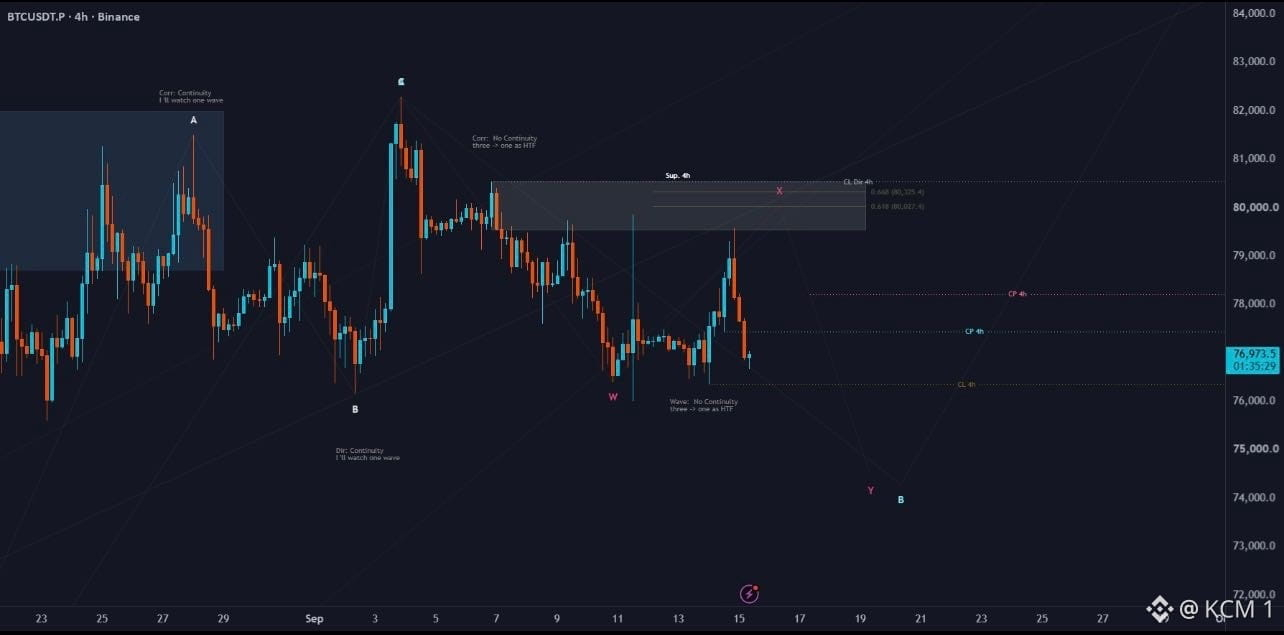
After rejecting from the 4-hour supply zone near $80,000 , price has broken lower-timeframe support, trading down around $76,973 . The price structure marks a wave correction sequence (W-X-Y), where the failed retest at overhead supply confirms bear control for the next leg down.
Holding below the 4-hour supply ceiling near $80,000 keeps the corrective thesis intact, targeting lower wave completion around $74,000 . A solid recovery and daily close above $80,200 invalidates the corrective wave setup, reopening upside momentum.
Don't buy into incomplete corrective waves—wait for structural demand to confirm the final pivot point.
#BTC #Bitcoin #CryptoAnalysis #TechnicalAnalysis
While the consensus watches for a local bounce, this wave correction layout on $BTC points toward a deeper structural pull down to complete the corrective pattern.
After rejecting from the 4-hour supply zone near $80,000 , price has broken lower-timeframe support, trading down around $76,973 . The price structure marks a wave correction sequence (W-X-Y), where the failed retest at overhead supply confirms bear control for the next leg down.
Holding below the 4-hour supply ceiling near $80,000 keeps the corrective thesis intact, targeting lower wave completion around $74,000 . A solid recovery and daily close above $80,200 invalidates the corrective wave setup, reopening upside momentum.
Don't buy into incomplete corrective waves—wait for structural demand to confirm the final pivot point.
#BTC #Bitcoin #CryptoAnalysis #TechnicalAnalysis
After rejecting from the 4-hour supply zone near $80,000 , price has broken lower-timeframe support, trading down around $76,973 . The price structure marks a wave correction sequence (W-X-Y), where the failed retest at overhead supply confirms bear control for the next leg down.
Holding below the 4-hour supply ceiling near $80,000 keeps the corrective thesis intact, targeting lower wave completion around $74,000 . A solid recovery and daily close above $80,200 invalidates the corrective wave setup, reopening upside momentum.
Don't buy into incomplete corrective waves—wait for structural demand to confirm the final pivot point.
#BTC #Bitcoin #CryptoAnalysis #TechnicalAnalysis
69
·
--
Ver traducción
Everyone is watching this tight consolidation on $AVAX , but missing the RSI breakout setting up a major channel reversal.
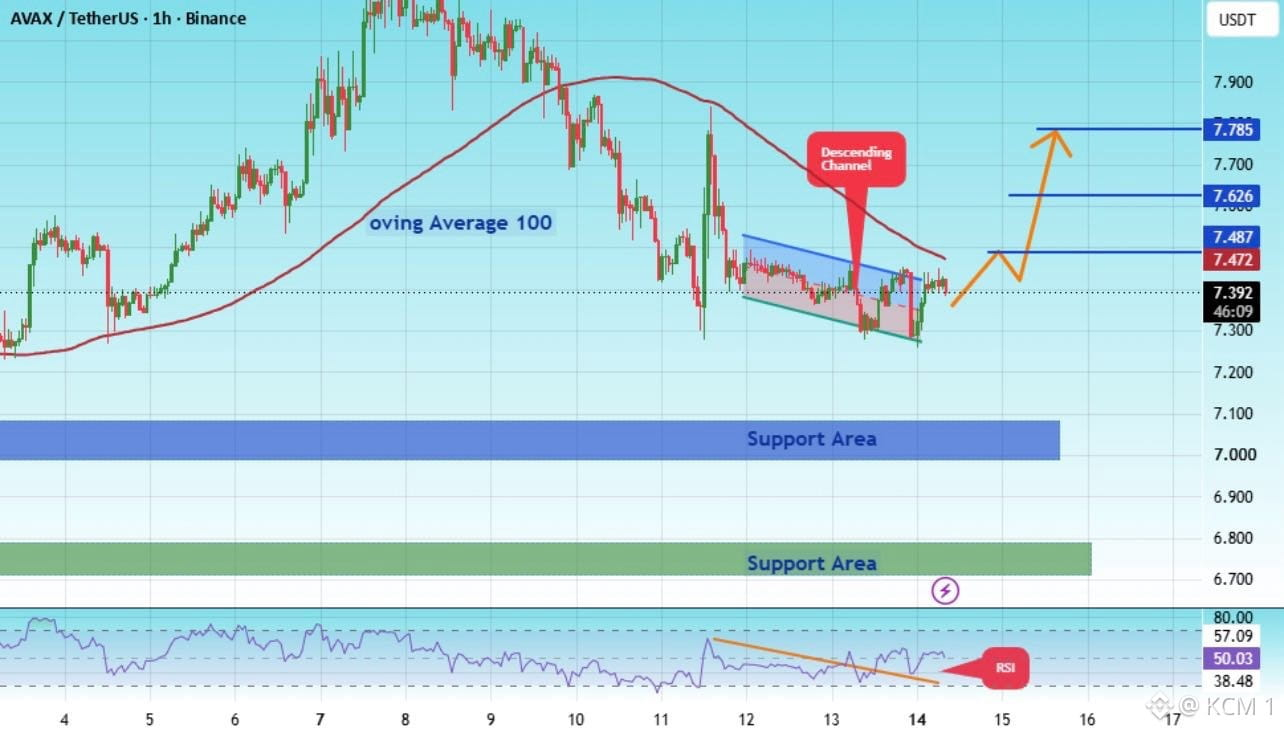
After pulling back beneath the 100-period moving average on the 1-hour chart, price has been coiling inside a tight descending channel above $7.300 . Simultaneously, the RSI has broken out of its downward trendline, signaling an influx of bullish momentum before price makes its move.
A clear breakout above $7.472 confirms the pattern reversal, clearing the path toward sequential upside targets at $7.626 and $7.785 . Holding above key support zones around $7.050 and $6.750 keeps the bullish continuation setup fully intact.
Don't wait for price expansion—momentum indicators lead the breakout before price confirms it.
#AVAX #Avalanche #CryptoAnalysis #TechnicalAnalysis
Everyone is watching this tight consolidation on $AVAX , but missing the RSI breakout setting up a major channel reversal.
After pulling back beneath the 100-period moving average on the 1-hour chart, price has been coiling inside a tight descending channel above $7.300 . Simultaneously, the RSI has broken out of its downward trendline, signaling an influx of bullish momentum before price makes its move.
A clear breakout above $7.472 confirms the pattern reversal, clearing the path toward sequential upside targets at $7.626 and $7.785 . Holding above key support zones around $7.050 and $6.750 keeps the bullish continuation setup fully intact.
Don't wait for price expansion—momentum indicators lead the breakout before price confirms it.
#AVAX #Avalanche #CryptoAnalysis #TechnicalAnalysis
After pulling back beneath the 100-period moving average on the 1-hour chart, price has been coiling inside a tight descending channel above $7.300 . Simultaneously, the RSI has broken out of its downward trendline, signaling an influx of bullish momentum before price makes its move.
A clear breakout above $7.472 confirms the pattern reversal, clearing the path toward sequential upside targets at $7.626 and $7.785 . Holding above key support zones around $7.050 and $6.750 keeps the bullish continuation setup fully intact.
Don't wait for price expansion—momentum indicators lead the breakout before price confirms it.
#AVAX #Avalanche #CryptoAnalysis #TechnicalAnalysis
70
·
--
Ver traducción
While breakout buyers chase higher levels, this short trade setup on $BTC is positioning for a clean sweep of lower liquidity.
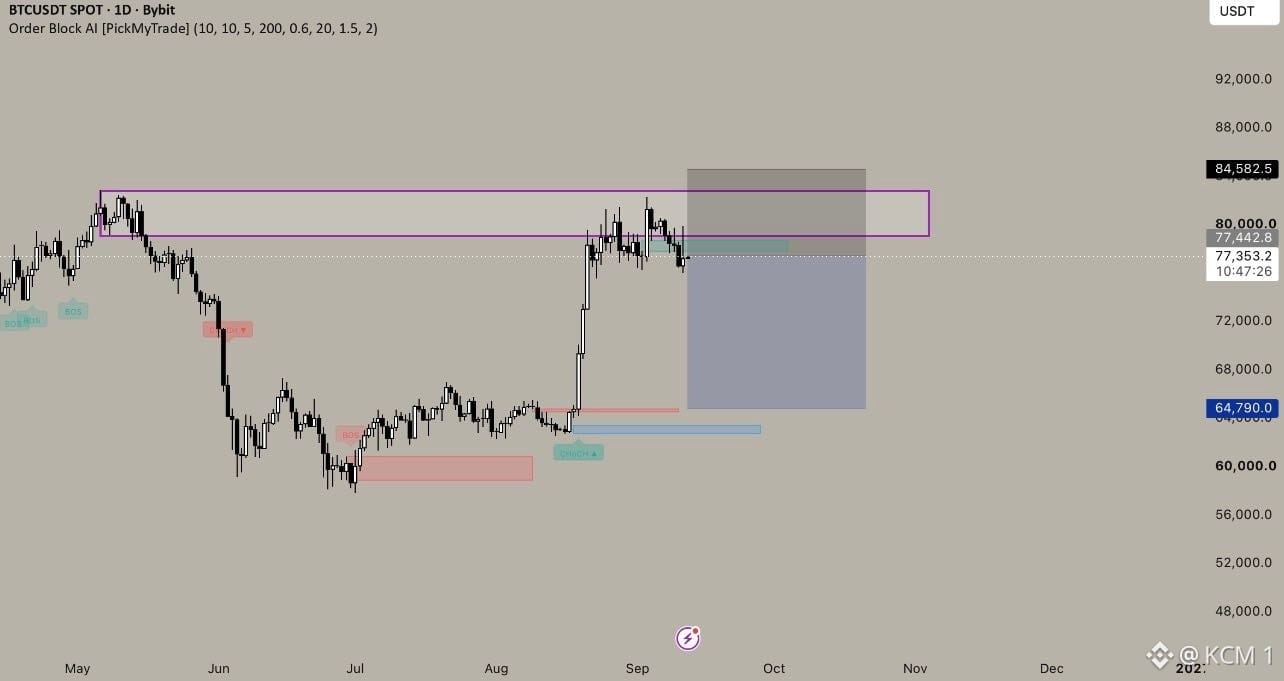
After retesting the primary daily order block near $80,000 , price rejected strongly off the supply zone around $84,582 . The current reaction shows distribution at resistance, keeping the short-bias thesis valid for a retracement back toward the major demand block.
Holding below the invalidation level at $84,582 keeps the short trade active, targeting a full liquidity sweep down to $64,790 . A breakout and daily close above $84,582 invalidates the setup and reopens macro bullish expansion.
Don't buy into overhead order blocks let resistance confirm the rejection before trading the pullback.
#BTC #Bitcoin #CryptoAnalysis #TechnicalAnalysis
While breakout buyers chase higher levels, this short trade setup on $BTC is positioning for a clean sweep of lower liquidity.
After retesting the primary daily order block near $80,000 , price rejected strongly off the supply zone around $84,582 . The current reaction shows distribution at resistance, keeping the short-bias thesis valid for a retracement back toward the major demand block.
Holding below the invalidation level at $84,582 keeps the short trade active, targeting a full liquidity sweep down to $64,790 . A breakout and daily close above $84,582 invalidates the setup and reopens macro bullish expansion.
Don't buy into overhead order blocks let resistance confirm the rejection before trading the pullback.
#BTC #Bitcoin #CryptoAnalysis #TechnicalAnalysis
After retesting the primary daily order block near $80,000 , price rejected strongly off the supply zone around $84,582 . The current reaction shows distribution at resistance, keeping the short-bias thesis valid for a retracement back toward the major demand block.
Holding below the invalidation level at $84,582 keeps the short trade active, targeting a full liquidity sweep down to $64,790 . A breakout and daily close above $84,582 invalidates the setup and reopens macro bullish expansion.
Don't buy into overhead order blocks let resistance confirm the rejection before trading the pullback.
#BTC #Bitcoin #CryptoAnalysis #TechnicalAnalysis
51
·
--
Todo el mundo está mirando este rebote de relieve agudo, pero se pasa por alto la prueba del rechazo del doble techo y el exceso de resistencia cerca de $79,800.
Después de romper desde la cuña ascendente y caer hasta $77,800, el precio realizó un retroceso rápido directamente hacia una resistencia clave. El rechazo en la línea horizontal punteada indica que los vendedores están activos, preparando posibles objetivos de caída en $77,800 y el área de objetivo secundario alrededor de $77,000.
Una ruptura por debajo de $78,828 confirma la continuación bajista hacia las zonas objetivo inferiores. Sin embargo, un impulso fuerte por encima de $79,800 invalida la tesis de corto y reabre el momentum alcista hacia $80,200.
No compres el rebote con anticipación: espera a que la estructura del mercado confirme el rechazo antes de operar el movimiento.
#BTC #Bitcoin #CryptoAnalysis #TechnicalAnalysis
Todo el mundo está mirando este rebote de relieve agudo, pero se pasa por alto la prueba del rechazo del doble techo y el exceso de resistencia cerca de $79,800.
Después de romper desde la cuña ascendente y caer hasta $77,800, el precio realizó un retroceso rápido directamente hacia una resistencia clave. El rechazo en la línea horizontal punteada indica que los vendedores están activos, preparando posibles objetivos de caída en $77,800 y el área de objetivo secundario alrededor de $77,000.
Una ruptura por debajo de $78,828 confirma la continuación bajista hacia las zonas objetivo inferiores. Sin embargo, un impulso fuerte por encima de $79,800 invalida la tesis de corto y reabre el momentum alcista hacia $80,200.
No compres el rebote con anticipación: espera a que la estructura del mercado confirme el rechazo antes de operar el movimiento.
#BTC #Bitcoin #CryptoAnalysis #TechnicalAnalysis
Después de romper desde la cuña ascendente y caer hasta $77,800, el precio realizó un retroceso rápido directamente hacia una resistencia clave. El rechazo en la línea horizontal punteada indica que los vendedores están activos, preparando posibles objetivos de caída en $77,800 y el área de objetivo secundario alrededor de $77,000.
Una ruptura por debajo de $78,828 confirma la continuación bajista hacia las zonas objetivo inferiores. Sin embargo, un impulso fuerte por encima de $79,800 invalida la tesis de corto y reabre el momentum alcista hacia $80,200.
No compres el rebote con anticipación: espera a que la estructura del mercado confirme el rechazo antes de operar el movimiento.
#BTC #Bitcoin #CryptoAnalysis #TechnicalAnalysis

63
·
--
Todo el mundo está viendo este retroceso semanal en $SOL , pero se está perdiendo la ruptura de la línea de tendencia de varios meses que confirma un gran giro macro.
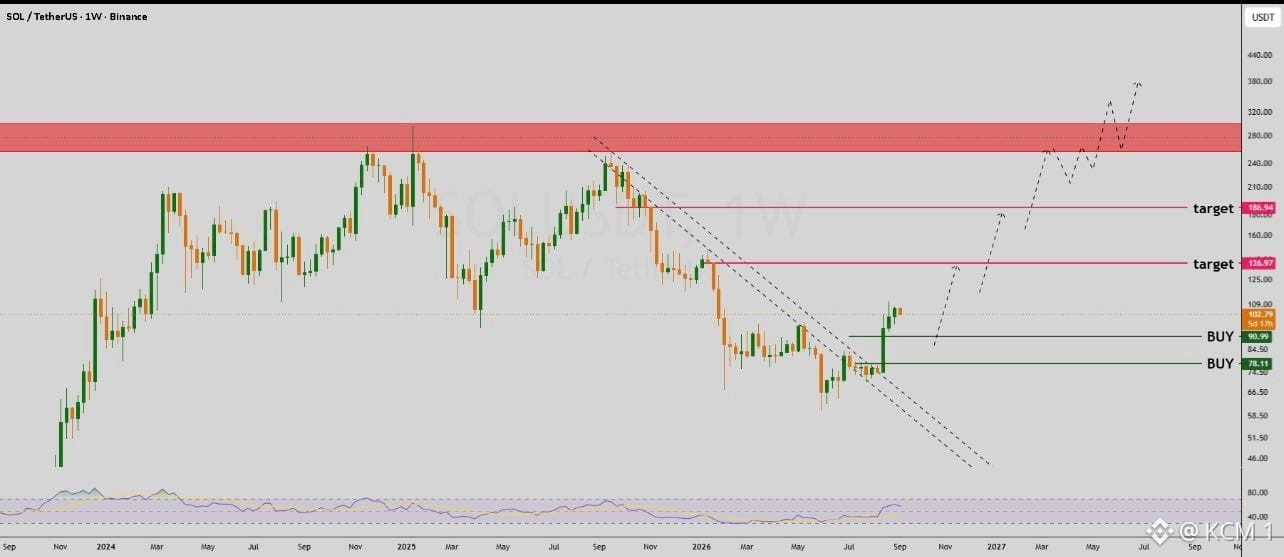
Después de romper el canal paralelo descendente, el precio ha recuperado un soporte estructural clave por encima de la zona de compra de $90.99. Esta fuerte expansión alcista en el marco semanal señala un cambio de carácter a largo plazo, eliminando meses de consolidación con máximos más bajos.
Mantenerse por encima de los niveles de acumulación de $90.99 y $78.11 valida el escenario alcista macro, desbloqueando objetivos alcistas secuenciales en $138.97 y $186.94 . Sostener este impulso allana el camino para un avance de múltiples etapas hacia el techo de resistencia principal por encima de $260.00 .
No ignores las rupturas de líneas de tendencia semanales: los cambios en la estructura macro establecen los movimientos macro más grandes.
#SOL #Solana #CryptoAnalysis #TechnicalAnalysis
Todo el mundo está viendo este retroceso semanal en $SOL , pero se está perdiendo la ruptura de la línea de tendencia de varios meses que confirma un gran giro macro.
Después de romper el canal paralelo descendente, el precio ha recuperado un soporte estructural clave por encima de la zona de compra de $90.99. Esta fuerte expansión alcista en el marco semanal señala un cambio de carácter a largo plazo, eliminando meses de consolidación con máximos más bajos.
Mantenerse por encima de los niveles de acumulación de $90.99 y $78.11 valida el escenario alcista macro, desbloqueando objetivos alcistas secuenciales en $138.97 y $186.94 . Sostener este impulso allana el camino para un avance de múltiples etapas hacia el techo de resistencia principal por encima de $260.00 .
No ignores las rupturas de líneas de tendencia semanales: los cambios en la estructura macro establecen los movimientos macro más grandes.
#SOL #Solana #CryptoAnalysis #TechnicalAnalysis
Después de romper el canal paralelo descendente, el precio ha recuperado un soporte estructural clave por encima de la zona de compra de $90.99. Esta fuerte expansión alcista en el marco semanal señala un cambio de carácter a largo plazo, eliminando meses de consolidación con máximos más bajos.
Mantenerse por encima de los niveles de acumulación de $90.99 y $78.11 valida el escenario alcista macro, desbloqueando objetivos alcistas secuenciales en $138.97 y $186.94 . Sostener este impulso allana el camino para un avance de múltiples etapas hacia el techo de resistencia principal por encima de $260.00 .
No ignores las rupturas de líneas de tendencia semanales: los cambios en la estructura macro establecen los movimientos macro más grandes.
#SOL #Solana #CryptoAnalysis #TechnicalAnalysis
65
·
--
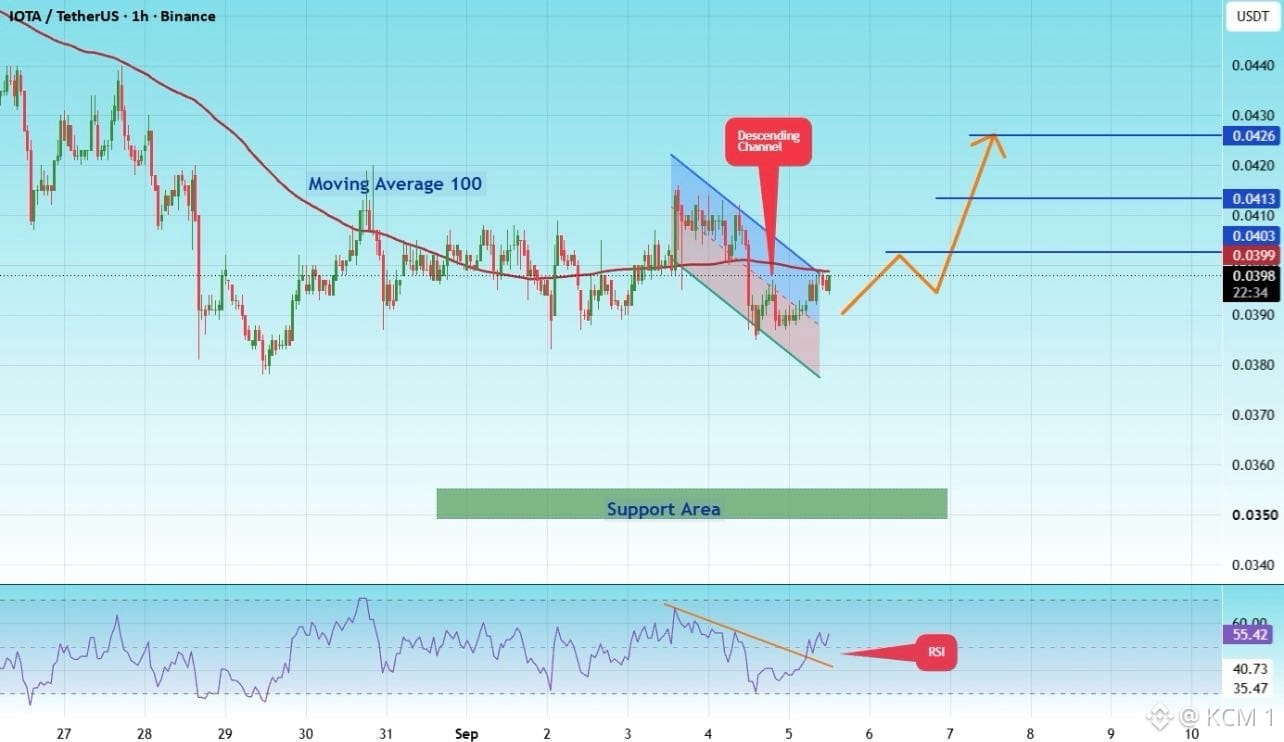
Todo el mundo está observando este estrecho canal descendente en $IOTA , pero se está perdiendo la divergencia alcista que se está formando en el RSI.
Después de consolidarse alrededor de la media móvil de 100 períodos en el gráfico de 1 hora, el precio está probando el límite superior de su pendiente descendente local. Mientras tanto, el RSI ha salido de su línea de tendencia bajista, señalando que el impulso comprador se está acumulando por debajo de la superficie antes de que el precio reaccione.
Una ruptura limpia por encima de $0.0399 confirma la configuración de reversión, despejando el camino hacia objetivos de resistencia intermedios en $0.0403 , $0.0413 y $0.0426 . Mantenerse por encima del área de soporte local cerca de $0.0350 mantiene la tesis alcista completamente intacta.
No esperes a la expansión total de la vela: observa cómo el impulso guía la salida del precio de los patrones locales de consolidación.
#IOTA #CryptoAnalysis #TechnicalAnalysis #Trading
Todo el mundo está observando este estrecho canal descendente en $IOTA , pero se está perdiendo la divergencia alcista que se está formando en el RSI.
Después de consolidarse alrededor de la media móvil de 100 períodos en el gráfico de 1 hora, el precio está probando el límite superior de su pendiente descendente local. Mientras tanto, el RSI ha salido de su línea de tendencia bajista, señalando que el impulso comprador se está acumulando por debajo de la superficie antes de que el precio reaccione.
Una ruptura limpia por encima de $0.0399 confirma la configuración de reversión, despejando el camino hacia objetivos de resistencia intermedios en $0.0403 , $0.0413 y $0.0426 . Mantenerse por encima del área de soporte local cerca de $0.0350 mantiene la tesis alcista completamente intacta.
No esperes a la expansión total de la vela: observa cómo el impulso guía la salida del precio de los patrones locales de consolidación.
#IOTA #CryptoAnalysis #TechnicalAnalysis #Trading
Después de consolidarse alrededor de la media móvil de 100 períodos en el gráfico de 1 hora, el precio está probando el límite superior de su pendiente descendente local. Mientras tanto, el RSI ha salido de su línea de tendencia bajista, señalando que el impulso comprador se está acumulando por debajo de la superficie antes de que el precio reaccione.
Una ruptura limpia por encima de $0.0399 confirma la configuración de reversión, despejando el camino hacia objetivos de resistencia intermedios en $0.0403 , $0.0413 y $0.0426 . Mantenerse por encima del área de soporte local cerca de $0.0350 mantiene la tesis alcista completamente intacta.
No esperes a la expansión total de la vela: observa cómo el impulso guía la salida del precio de los patrones locales de consolidación.
#IOTA #CryptoAnalysis #TechnicalAnalysis #Trading
56
·
--
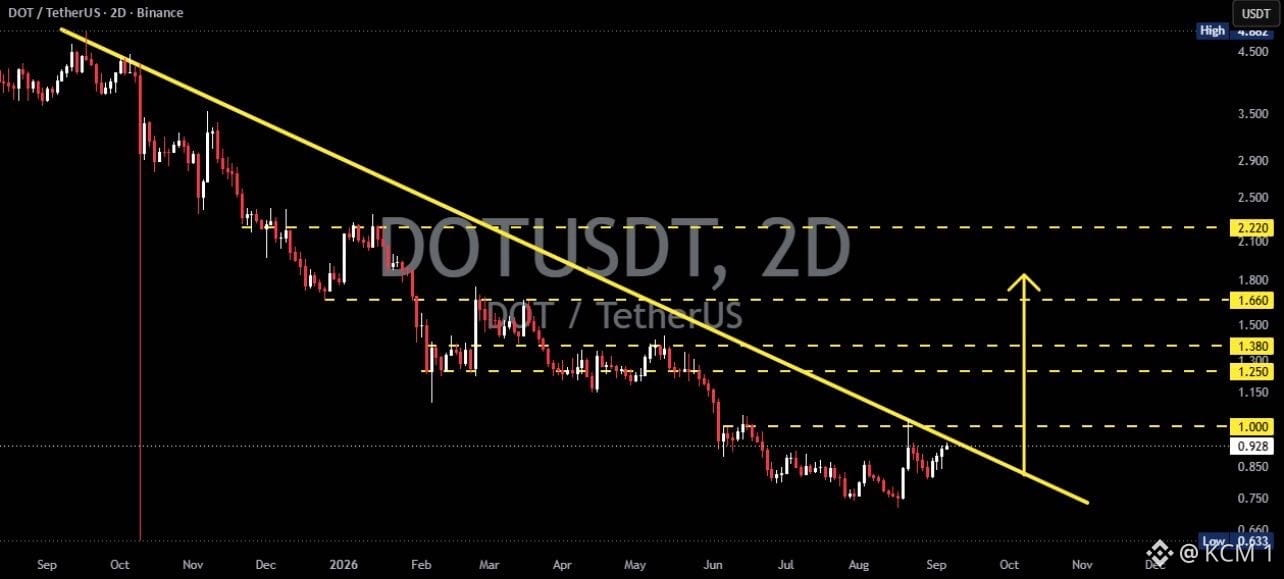
Todo el mundo está observando esta caída de varios meses de $DOT, pero se está perdiendo el posible rompimiento de la línea de tendencia que se está formando en resistencia local.
Después de meses de máximos descendentes, contenidos bajo una empinada línea diagonal de tendencia amarilla, el precio está poniendo a prueba la resistencia cerca de $0.928, junto a la base macro. Un rompimiento limpio por encima de este techo diagonal señala un cambio de carácter estructural, trasladando el impulso de una distribución prolongada hacia una acumulación temprana.
Superar $1.000 confirma el rompimiento de la línea de tendencia y abre objetivos alcistas secuenciales en $1.250, $1.380 y $1.660. Sin embargo, si no logra romper la resistencia diagonal, $DOT queda vulnerable a volver a probar el soporte, cerca de $0.750.
No operes la línea: espera a que la estructura del mercado confirme el rompimiento por encima de una resistencia importante.
#DOT #Polkadot #CryptoAnalysis #TechnicalAnalysis
Todo el mundo está observando esta caída de varios meses de $DOT, pero se está perdiendo el posible rompimiento de la línea de tendencia que se está formando en resistencia local.
Después de meses de máximos descendentes, contenidos bajo una empinada línea diagonal de tendencia amarilla, el precio está poniendo a prueba la resistencia cerca de $0.928, junto a la base macro. Un rompimiento limpio por encima de este techo diagonal señala un cambio de carácter estructural, trasladando el impulso de una distribución prolongada hacia una acumulación temprana.
Superar $1.000 confirma el rompimiento de la línea de tendencia y abre objetivos alcistas secuenciales en $1.250, $1.380 y $1.660. Sin embargo, si no logra romper la resistencia diagonal, $DOT queda vulnerable a volver a probar el soporte, cerca de $0.750.
No operes la línea: espera a que la estructura del mercado confirme el rompimiento por encima de una resistencia importante.
#DOT #Polkadot #CryptoAnalysis #TechnicalAnalysis
Después de meses de máximos descendentes, contenidos bajo una empinada línea diagonal de tendencia amarilla, el precio está poniendo a prueba la resistencia cerca de $0.928, junto a la base macro. Un rompimiento limpio por encima de este techo diagonal señala un cambio de carácter estructural, trasladando el impulso de una distribución prolongada hacia una acumulación temprana.
Superar $1.000 confirma el rompimiento de la línea de tendencia y abre objetivos alcistas secuenciales en $1.250, $1.380 y $1.660. Sin embargo, si no logra romper la resistencia diagonal, $DOT queda vulnerable a volver a probar el soporte, cerca de $0.750.
No operes la línea: espera a que la estructura del mercado confirme el rompimiento por encima de una resistencia importante.
#DOT #Polkadot #CryptoAnalysis #TechnicalAnalysis
75
·
--
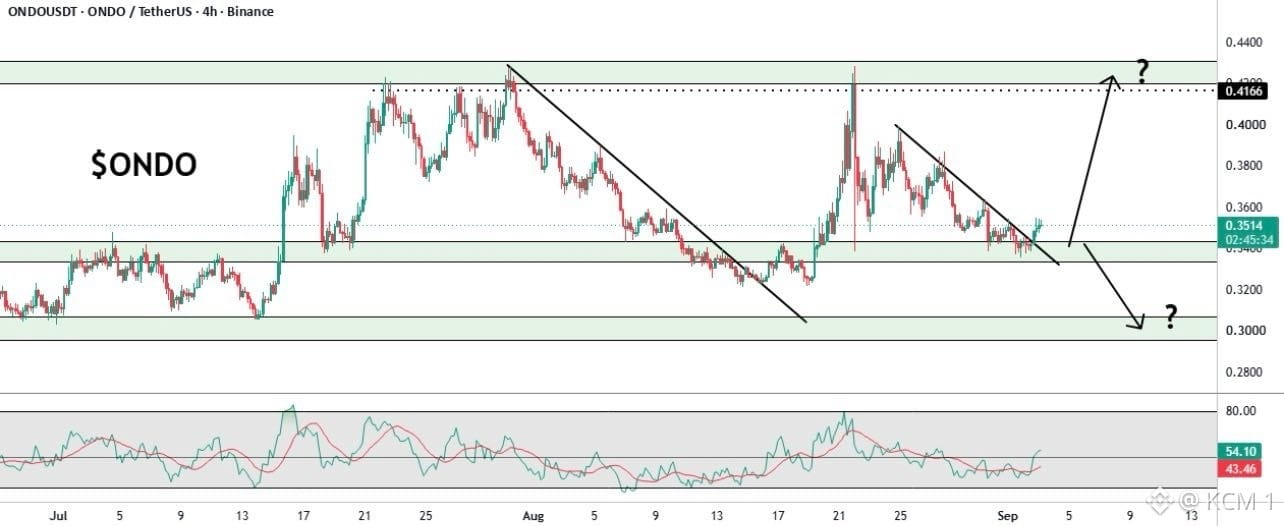
Mientras el mercado debate la dirección en el soporte local, este nodo de decisión sobre $ONDO establece un claro disparador de expansión binaria.
Tras romper la tendencia descendente local, el precio está volviendo a probar el soporte dinámico cerca de $0.3400 dentro de un bloque clave de demanda horizontal. El RSI, al subir nuevamente por encima de 50, indica un impulso alcista subyacente que intenta recuperar el control de la estructura del marco temporal inferior.
Una sólida retención por encima de $0.3400 abre una vía directa para un impulso alcista hacia la resistencia superior en $0.4166 . Sin embargo, si no se defiende el soporte, existe el riesgo de un rompimiento con retesteo hacia una demanda macro inferior cerca de $0.3000 .
No predigas el resultado con anticipación: deja que el retesteo en el soporte confirme la dirección de la expansión.
#ONDO #OndoFinance #CryptoAnalysis #TechnicalAnalysis
Mientras el mercado debate la dirección en el soporte local, este nodo de decisión sobre $ONDO establece un claro disparador de expansión binaria.
Tras romper la tendencia descendente local, el precio está volviendo a probar el soporte dinámico cerca de $0.3400 dentro de un bloque clave de demanda horizontal. El RSI, al subir nuevamente por encima de 50, indica un impulso alcista subyacente que intenta recuperar el control de la estructura del marco temporal inferior.
Una sólida retención por encima de $0.3400 abre una vía directa para un impulso alcista hacia la resistencia superior en $0.4166 . Sin embargo, si no se defiende el soporte, existe el riesgo de un rompimiento con retesteo hacia una demanda macro inferior cerca de $0.3000 .
No predigas el resultado con anticipación: deja que el retesteo en el soporte confirme la dirección de la expansión.
#ONDO #OndoFinance #CryptoAnalysis #TechnicalAnalysis
Tras romper la tendencia descendente local, el precio está volviendo a probar el soporte dinámico cerca de $0.3400 dentro de un bloque clave de demanda horizontal. El RSI, al subir nuevamente por encima de 50, indica un impulso alcista subyacente que intenta recuperar el control de la estructura del marco temporal inferior.
Una sólida retención por encima de $0.3400 abre una vía directa para un impulso alcista hacia la resistencia superior en $0.4166 . Sin embargo, si no se defiende el soporte, existe el riesgo de un rompimiento con retesteo hacia una demanda macro inferior cerca de $0.3000 .
No predigas el resultado con anticipación: deja que el retesteo en el soporte confirme la dirección de la expansión.
#ONDO #OndoFinance #CryptoAnalysis #TechnicalAnalysis
76
·
--
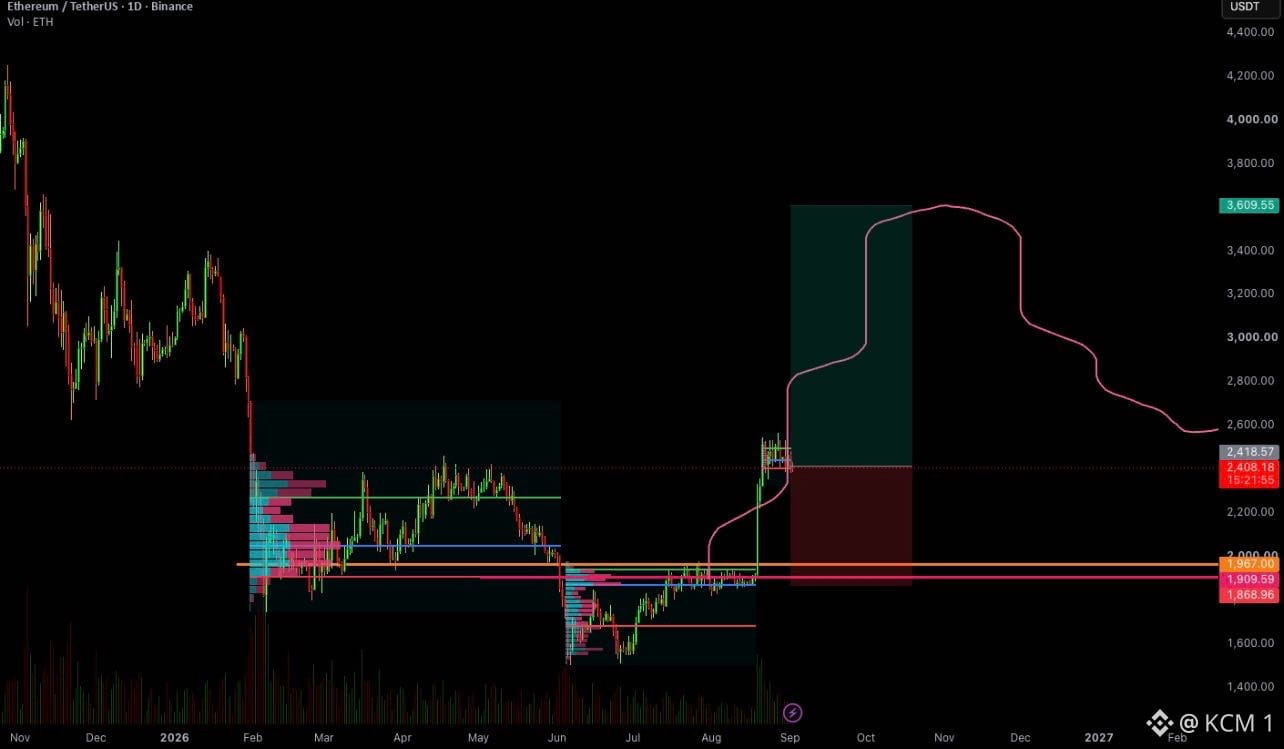
Aunque el consenso prevé una trayectoria directa hacia arriba, esta proyección sobre $ETH traza una hoja de ruta macro de alta convicción que abarca la próxima fase del ciclo.
Después de recuperar el nodo clave de consolidación en $2,400, la acción del precio está estableciendo un mínimo más alto por encima del soporte del perfil de volumen principal. La curva proyectada modela un impulso de expansión agresivo hacia $3,600 , seguido de una fase prolongada de corrección macro hasta principios de 2027.
Mantenerse por encima del nivel primario de invalidación cerca de $1,900 conserva intacta la ruta de expansión alcista a largo plazo. Recuperar la oferta por encima abre la puerta a un potencial alcista significativo antes de que el mercado alcance el pico de su ciclo.
Enfócate en la estructura macro por encima del ruido diario: el marco de la tendencia más amplia es el que guía los movimientos reales.
#ETH #Ethereum #CryptoAnalysis #TechnicalAnalysis
Aunque el consenso prevé una trayectoria directa hacia arriba, esta proyección sobre $ETH traza una hoja de ruta macro de alta convicción que abarca la próxima fase del ciclo.
Después de recuperar el nodo clave de consolidación en $2,400, la acción del precio está estableciendo un mínimo más alto por encima del soporte del perfil de volumen principal. La curva proyectada modela un impulso de expansión agresivo hacia $3,600 , seguido de una fase prolongada de corrección macro hasta principios de 2027.
Mantenerse por encima del nivel primario de invalidación cerca de $1,900 conserva intacta la ruta de expansión alcista a largo plazo. Recuperar la oferta por encima abre la puerta a un potencial alcista significativo antes de que el mercado alcance el pico de su ciclo.
Enfócate en la estructura macro por encima del ruido diario: el marco de la tendencia más amplia es el que guía los movimientos reales.
#ETH #Ethereum #CryptoAnalysis #TechnicalAnalysis
Después de recuperar el nodo clave de consolidación en $2,400, la acción del precio está estableciendo un mínimo más alto por encima del soporte del perfil de volumen principal. La curva proyectada modela un impulso de expansión agresivo hacia $3,600 , seguido de una fase prolongada de corrección macro hasta principios de 2027.
Mantenerse por encima del nivel primario de invalidación cerca de $1,900 conserva intacta la ruta de expansión alcista a largo plazo. Recuperar la oferta por encima abre la puerta a un potencial alcista significativo antes de que el mercado alcance el pico de su ciclo.
Enfócate en la estructura macro por encima del ruido diario: el marco de la tendencia más amplia es el que guía los movimientos reales.
#ETH #Ethereum #CryptoAnalysis #TechnicalAnalysis
70
·
--
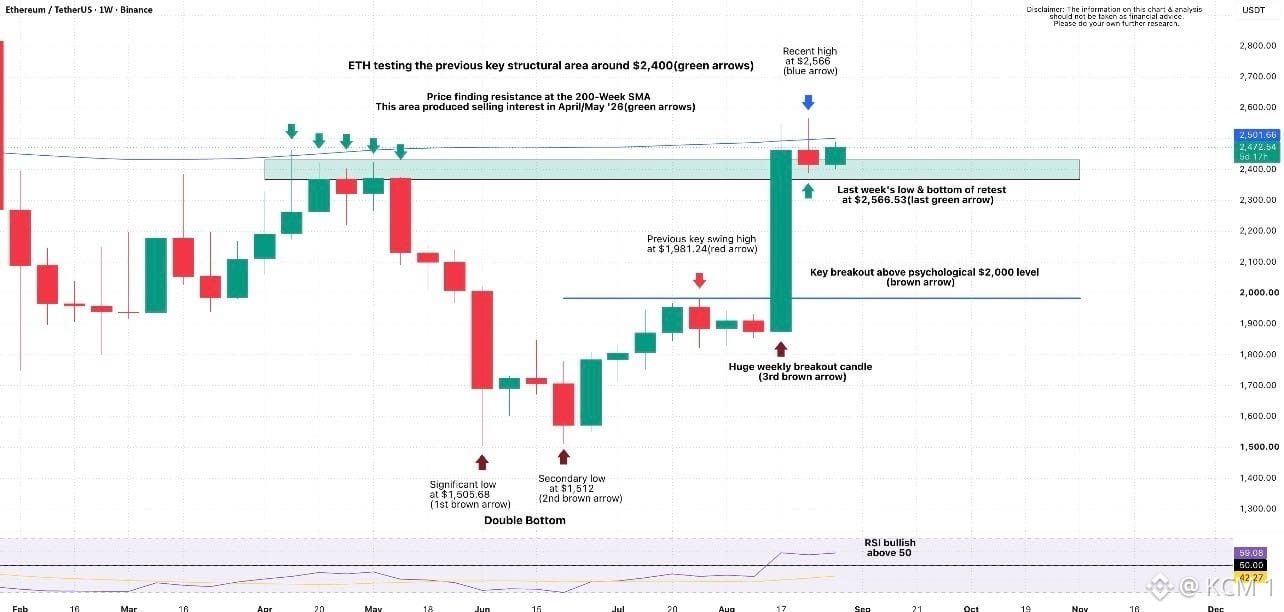
Todo el mundo está viendo esta repetición semanal de la prueba en $ETH, pero se está perdiendo la base macro del doble suelo que impulsa la ruptura.
Después de construir una base sólida de doble suelo cerca de $1,505 y superar por explosión el nivel psicológico de $2,000, el precio se ha expandido directamente hacia la zona clave de resistencia estructural alrededor de $2,400. La enorme vela semanal verde de ruptura confirma una fuerte demanda institucional que vuelve a entrar en el mercado.
Mantenerse por encima del antiguo techo horizontal cerca de $2,400 convierte la oferta histórica en nuevo soporte estructural. Con el RSI semanal manteniéndose alcista por encima de 50, una revalidación exitosa de esta zona abre el camino para expandirse más allá del máximo reciente en $2,566.
No dejes que las pequeñas revalidaciones te sacudan: mira cómo antiguas zonas de resistencia se transforman en un sólido soporte alcista.
#ETH #Ethereum #CryptoAnalysis #TechnicalAnalysis
Todo el mundo está viendo esta repetición semanal de la prueba en $ETH, pero se está perdiendo la base macro del doble suelo que impulsa la ruptura.
Después de construir una base sólida de doble suelo cerca de $1,505 y superar por explosión el nivel psicológico de $2,000, el precio se ha expandido directamente hacia la zona clave de resistencia estructural alrededor de $2,400. La enorme vela semanal verde de ruptura confirma una fuerte demanda institucional que vuelve a entrar en el mercado.
Mantenerse por encima del antiguo techo horizontal cerca de $2,400 convierte la oferta histórica en nuevo soporte estructural. Con el RSI semanal manteniéndose alcista por encima de 50, una revalidación exitosa de esta zona abre el camino para expandirse más allá del máximo reciente en $2,566.
No dejes que las pequeñas revalidaciones te sacudan: mira cómo antiguas zonas de resistencia se transforman en un sólido soporte alcista.
#ETH #Ethereum #CryptoAnalysis #TechnicalAnalysis
Después de construir una base sólida de doble suelo cerca de $1,505 y superar por explosión el nivel psicológico de $2,000, el precio se ha expandido directamente hacia la zona clave de resistencia estructural alrededor de $2,400. La enorme vela semanal verde de ruptura confirma una fuerte demanda institucional que vuelve a entrar en el mercado.
Mantenerse por encima del antiguo techo horizontal cerca de $2,400 convierte la oferta histórica en nuevo soporte estructural. Con el RSI semanal manteniéndose alcista por encima de 50, una revalidación exitosa de esta zona abre el camino para expandirse más allá del máximo reciente en $2,566.
No dejes que las pequeñas revalidaciones te sacudan: mira cómo antiguas zonas de resistencia se transforman en un sólido soporte alcista.
#ETH #Ethereum #CryptoAnalysis #TechnicalAnalysis
97
·
--
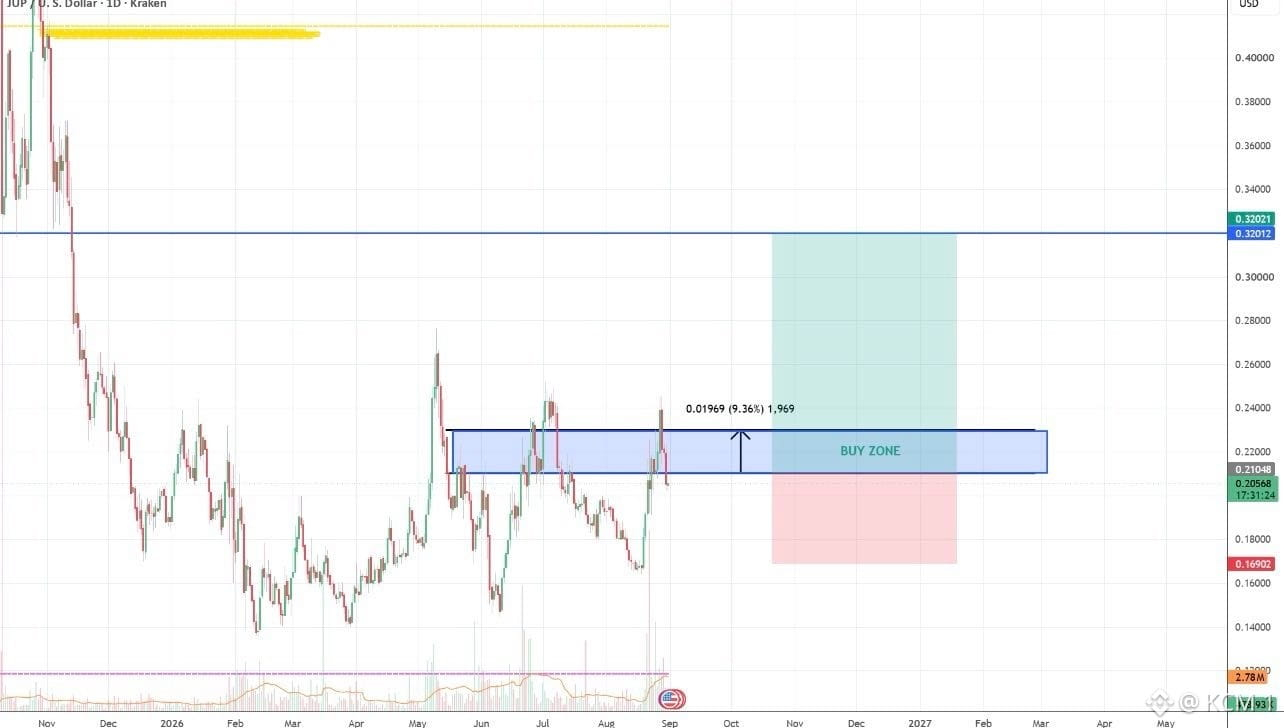
Todo el mundo está observando esta consolidación en $JUP, pero se está perdiendo el bloque de demanda clave que está preparando una configuración de largo de alta probabilidad.
Después de encontrar un mínimo macro alrededor de $0.1400 y formar una estructura de mayor mínimo, el precio está probando el soporte primario de acumulación dentro de la zona de compra de $0.2100 a $0.2300. Los rebotes repetidos dentro de este rango horizontal indican que los compradores están defendiendo de manera constante la base contra las caídas de marcos de tiempo menores.
Mantenerse por encima del límite inferior cerca de $0.2050 valida la configuración de la operación, abriendo el camino para una expansión alcista hacia el objetivo de resistencia superior en $0.3200. Mantener un stop loss cerca de $0.1690 protege contra cualquier barrida de un posible quiebre macro.
Los compradores pacientes acumulan dentro de zonas de demanda clave antes de que se dispare la fase de expansión.
#JUP #Jupiter #CryptoAnalysis #TechnicalAnalysis
Todo el mundo está observando esta consolidación en $JUP, pero se está perdiendo el bloque de demanda clave que está preparando una configuración de largo de alta probabilidad.
Después de encontrar un mínimo macro alrededor de $0.1400 y formar una estructura de mayor mínimo, el precio está probando el soporte primario de acumulación dentro de la zona de compra de $0.2100 a $0.2300. Los rebotes repetidos dentro de este rango horizontal indican que los compradores están defendiendo de manera constante la base contra las caídas de marcos de tiempo menores.
Mantenerse por encima del límite inferior cerca de $0.2050 valida la configuración de la operación, abriendo el camino para una expansión alcista hacia el objetivo de resistencia superior en $0.3200. Mantener un stop loss cerca de $0.1690 protege contra cualquier barrida de un posible quiebre macro.
Los compradores pacientes acumulan dentro de zonas de demanda clave antes de que se dispare la fase de expansión.
#JUP #Jupiter #CryptoAnalysis #TechnicalAnalysis
Después de encontrar un mínimo macro alrededor de $0.1400 y formar una estructura de mayor mínimo, el precio está probando el soporte primario de acumulación dentro de la zona de compra de $0.2100 a $0.2300. Los rebotes repetidos dentro de este rango horizontal indican que los compradores están defendiendo de manera constante la base contra las caídas de marcos de tiempo menores.
Mantenerse por encima del límite inferior cerca de $0.2050 valida la configuración de la operación, abriendo el camino para una expansión alcista hacia el objetivo de resistencia superior en $0.3200. Mantener un stop loss cerca de $0.1690 protege contra cualquier barrida de un posible quiebre macro.
Los compradores pacientes acumulan dentro de zonas de demanda clave antes de que se dispare la fase de expansión.
#JUP #Jupiter #CryptoAnalysis #TechnicalAnalysis
80
·
--
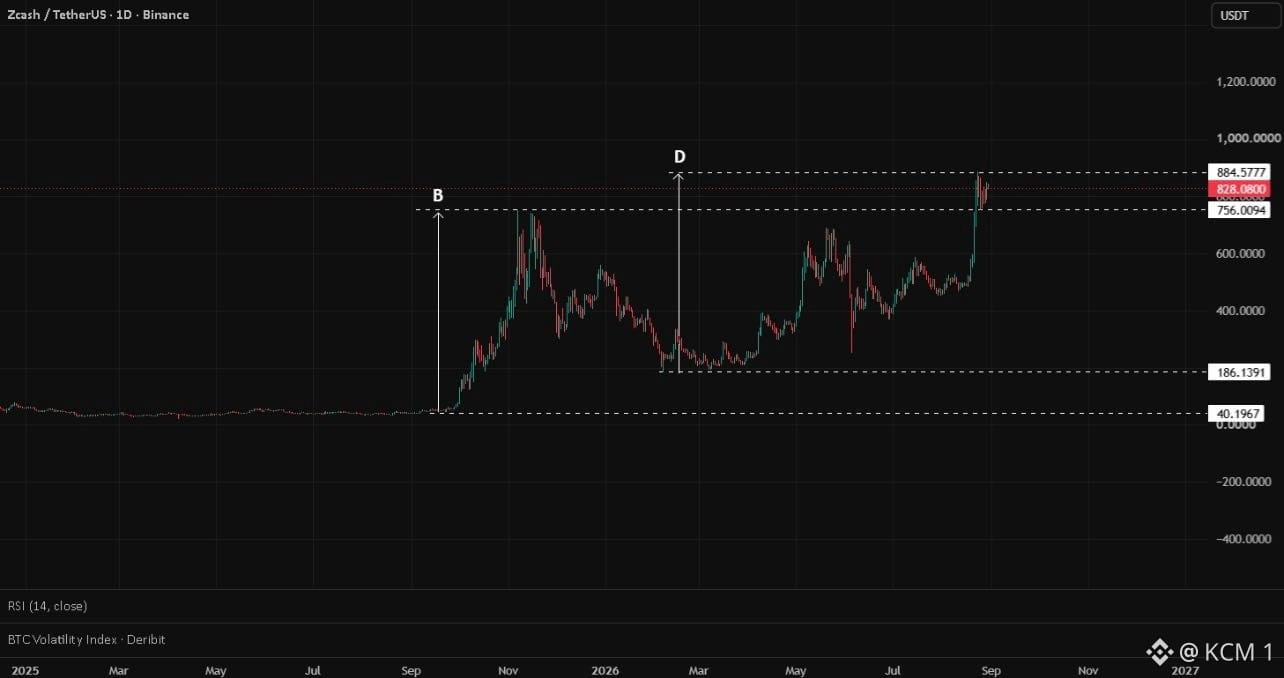
Todo el mundo está viendo esta enorme ruptura en $ZEC, pero se está perdiendo la medida histórica del movimiento proyectado hacia una gran oferta.
Después de completar una gran acumulación en base y romper por encima de máximos previos del rango cerca de $756.00, el precio se ha expandido agresivamente hacia arriba hasta $884.57. El impulso vertical replica ciclos anteriores de alta inercia, llevando el precio directamente a niveles clave de resistencia macro.
Un retroceso temporal hacia el nivel de ruptura cerca de $756.00 confirmaría esa antigua resistencia como un soporte sólido. Mantenerse por encima de este umbral clave conserva la estructura alcista y abre el camino para un empuje de continuación hacia $1,000.00.
No persigas la expansión vertical: observa cómo la estructura del mercado se construye por encima de las zonas principales de ruptura.
#ZEC #Zcash #CryptoAnalysis #TechnicalAnalysis
Todo el mundo está viendo esta enorme ruptura en $ZEC, pero se está perdiendo la medida histórica del movimiento proyectado hacia una gran oferta.
Después de completar una gran acumulación en base y romper por encima de máximos previos del rango cerca de $756.00, el precio se ha expandido agresivamente hacia arriba hasta $884.57. El impulso vertical replica ciclos anteriores de alta inercia, llevando el precio directamente a niveles clave de resistencia macro.
Un retroceso temporal hacia el nivel de ruptura cerca de $756.00 confirmaría esa antigua resistencia como un soporte sólido. Mantenerse por encima de este umbral clave conserva la estructura alcista y abre el camino para un empuje de continuación hacia $1,000.00.
No persigas la expansión vertical: observa cómo la estructura del mercado se construye por encima de las zonas principales de ruptura.
#ZEC #Zcash #CryptoAnalysis #TechnicalAnalysis
Después de completar una gran acumulación en base y romper por encima de máximos previos del rango cerca de $756.00, el precio se ha expandido agresivamente hacia arriba hasta $884.57. El impulso vertical replica ciclos anteriores de alta inercia, llevando el precio directamente a niveles clave de resistencia macro.
Un retroceso temporal hacia el nivel de ruptura cerca de $756.00 confirmaría esa antigua resistencia como un soporte sólido. Mantenerse por encima de este umbral clave conserva la estructura alcista y abre el camino para un empuje de continuación hacia $1,000.00.
No persigas la expansión vertical: observa cómo la estructura del mercado se construye por encima de las zonas principales de ruptura.
#ZEC #Zcash #CryptoAnalysis #TechnicalAnalysis
81
·
--
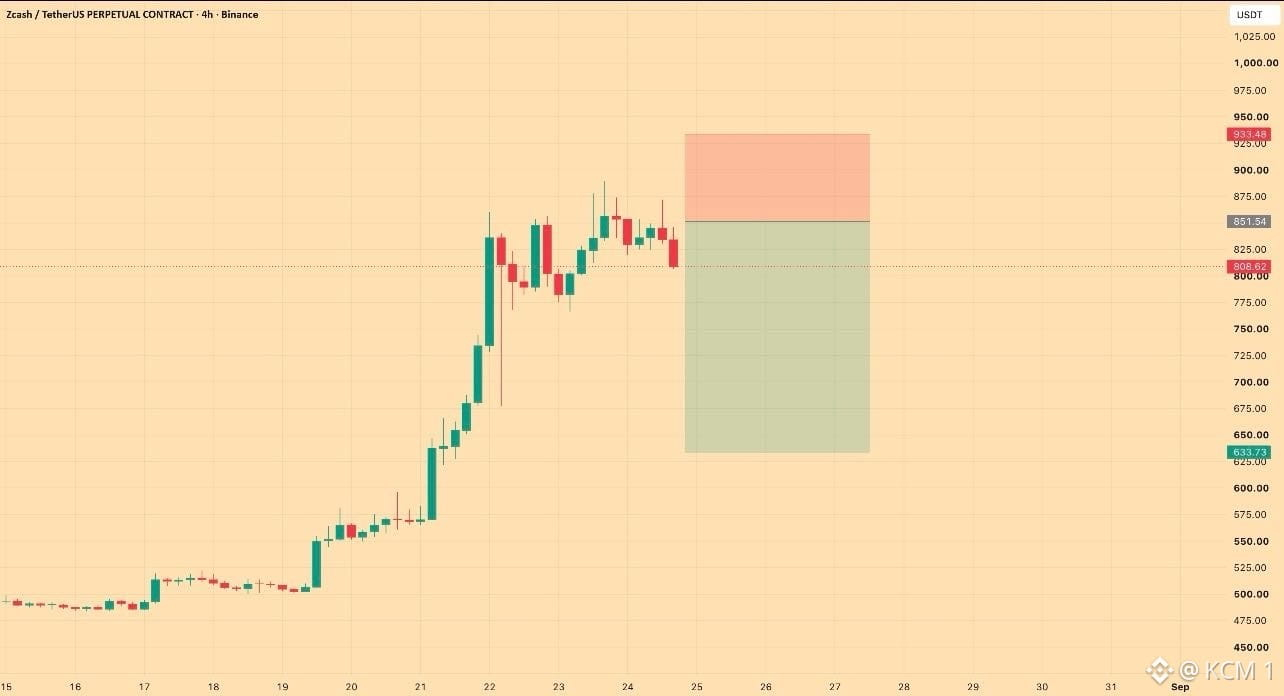
Todo el mundo está observando esta rallya sobreextendida en $ZEC, pero se está perdiendo la fase de distribución que se está preparando en máximos locales.
Después de una explosiva subida vertical desde $500 hasta $880, el impulso se ha estancado en un patrón de consolidación estrecha de máximos descendentes en el gráfico de 4 horas. La incapacidad de marcar nuevos máximos después de un impulso tan masivo señala que la fuerza compradora se está debilitando rápidamente.
Si no se logra recuperar el nivel de $851, la tesis de posiciones cortas se mantiene vigente, apuntando a un movimiento de reversión hacia la media que lleve el precio hacia $633 para cubrir el vacío de liquidez inferior. Asegurar un stop loss alrededor de $933 protege contra posibles picos finales de short squeeze.
Los impulsos verticales atraen a compradores tardíos por FOMO justo antes de que la estructura del mercado cambie hacia una corrección.
#ZEC #Zcash #CryptoAnalysis #TechnicalAnalysis
Todo el mundo está observando esta rallya sobreextendida en $ZEC, pero se está perdiendo la fase de distribución que se está preparando en máximos locales.
Después de una explosiva subida vertical desde $500 hasta $880, el impulso se ha estancado en un patrón de consolidación estrecha de máximos descendentes en el gráfico de 4 horas. La incapacidad de marcar nuevos máximos después de un impulso tan masivo señala que la fuerza compradora se está debilitando rápidamente.
Si no se logra recuperar el nivel de $851, la tesis de posiciones cortas se mantiene vigente, apuntando a un movimiento de reversión hacia la media que lleve el precio hacia $633 para cubrir el vacío de liquidez inferior. Asegurar un stop loss alrededor de $933 protege contra posibles picos finales de short squeeze.
Los impulsos verticales atraen a compradores tardíos por FOMO justo antes de que la estructura del mercado cambie hacia una corrección.
#ZEC #Zcash #CryptoAnalysis #TechnicalAnalysis
Después de una explosiva subida vertical desde $500 hasta $880, el impulso se ha estancado en un patrón de consolidación estrecha de máximos descendentes en el gráfico de 4 horas. La incapacidad de marcar nuevos máximos después de un impulso tan masivo señala que la fuerza compradora se está debilitando rápidamente.
Si no se logra recuperar el nivel de $851, la tesis de posiciones cortas se mantiene vigente, apuntando a un movimiento de reversión hacia la media que lleve el precio hacia $633 para cubrir el vacío de liquidez inferior. Asegurar un stop loss alrededor de $933 protege contra posibles picos finales de short squeeze.
Los impulsos verticales atraen a compradores tardíos por FOMO justo antes de que la estructura del mercado cambie hacia una corrección.
#ZEC #Zcash #CryptoAnalysis #TechnicalAnalysis
80
·
--
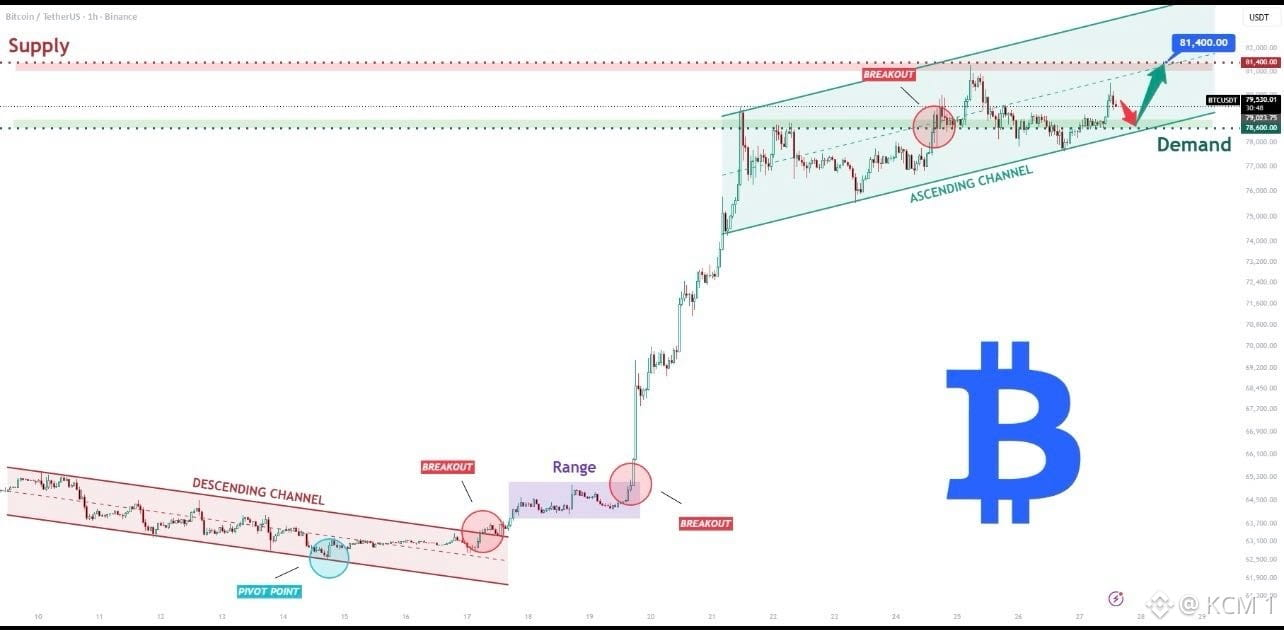
Todo el mundo está observando esta estrecha consolidación dentro del canal ascendente en $BTC , pero se está perdiendo la configuración de continuación de la tendencia que se forma a partir del soporte por demanda.
Después de romper la parte inferior del canal descendente y consolidarse dentro del rango intermedio alrededor de $65,000 , el precio se expandió de forma agresiva hacia la zona de $79,500. La acción actual del precio está respetando la demanda del canal inferior cerca de $78,600, manteniéndose firmemente por encima del soporte dinámico clave.
Un rebote exitoso desde la línea de demanda del canal establece el siguiente tramo al alza, apuntando a una re-test limpia de la oferta por encima cerca de $81,400. Mantener esta estructura de canal conserva intacto el impulso alcista más amplio.
No entren en pánico ante retrocesos locales; es un punto donde el soporte del marco temporal inferior coincide con la continuación del canal.
#BTC #Bitcoin #CryptoAnalysis #TechnicalAnalysis
Todo el mundo está observando esta estrecha consolidación dentro del canal ascendente en $BTC , pero se está perdiendo la configuración de continuación de la tendencia que se forma a partir del soporte por demanda.
Después de romper la parte inferior del canal descendente y consolidarse dentro del rango intermedio alrededor de $65,000 , el precio se expandió de forma agresiva hacia la zona de $79,500. La acción actual del precio está respetando la demanda del canal inferior cerca de $78,600, manteniéndose firmemente por encima del soporte dinámico clave.
Un rebote exitoso desde la línea de demanda del canal establece el siguiente tramo al alza, apuntando a una re-test limpia de la oferta por encima cerca de $81,400. Mantener esta estructura de canal conserva intacto el impulso alcista más amplio.
No entren en pánico ante retrocesos locales; es un punto donde el soporte del marco temporal inferior coincide con la continuación del canal.
#BTC #Bitcoin #CryptoAnalysis #TechnicalAnalysis
Después de romper la parte inferior del canal descendente y consolidarse dentro del rango intermedio alrededor de $65,000 , el precio se expandió de forma agresiva hacia la zona de $79,500. La acción actual del precio está respetando la demanda del canal inferior cerca de $78,600, manteniéndose firmemente por encima del soporte dinámico clave.
Un rebote exitoso desde la línea de demanda del canal establece el siguiente tramo al alza, apuntando a una re-test limpia de la oferta por encima cerca de $81,400. Mantener esta estructura de canal conserva intacto el impulso alcista más amplio.
No entren en pánico ante retrocesos locales; es un punto donde el soporte del marco temporal inferior coincide con la continuación del canal.
#BTC #Bitcoin #CryptoAnalysis #TechnicalAnalysis
79
·
--
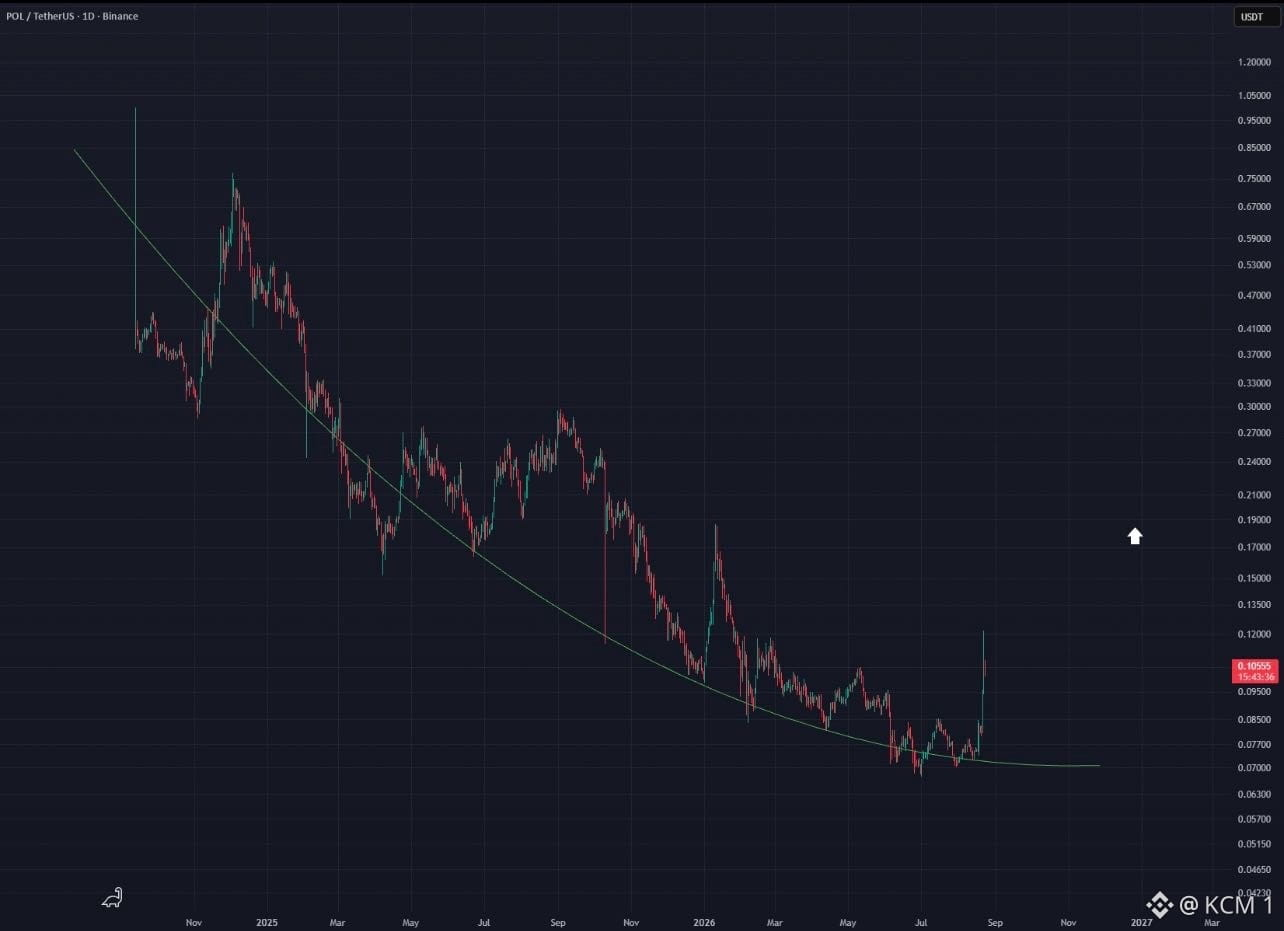
Todo el mundo está observando este repentino impulso en $POL, pero se está perdiendo la base curva de varios años que acaba de activar una gran ruptura estructural.
Después de una larga tendencia bajista tras una curva redondeada parabólica, el precio por fin ha recuperado un soporte clave cerca de $0.0750 y explotó hacia arriba hasta $0.1100. Esta agresiva vela de expansión verde indica que los compradores están absorbiendo una oferta significativa de corto plazo en la parte inferior del rango macro.
Si bien en marcos temporales más bajos puede haber un retroceso a corto plazo después de un empuje vertical tan brusco, mantener por encima del nivel de ruptura de la curva confirma el cambio de tendencia. Mantener esta estructura sienta las bases para una reversión de tendencia prolongada hacia objetivos de mayor resistencia.
No ignores las curvas de acumulación de varios meses: cuando se rompen, el impulso cambia rápido.
#POL #Polygon #CryptoAnalysis #TechnicalAnalysis
Todo el mundo está observando este repentino impulso en $POL, pero se está perdiendo la base curva de varios años que acaba de activar una gran ruptura estructural.
Después de una larga tendencia bajista tras una curva redondeada parabólica, el precio por fin ha recuperado un soporte clave cerca de $0.0750 y explotó hacia arriba hasta $0.1100. Esta agresiva vela de expansión verde indica que los compradores están absorbiendo una oferta significativa de corto plazo en la parte inferior del rango macro.
Si bien en marcos temporales más bajos puede haber un retroceso a corto plazo después de un empuje vertical tan brusco, mantener por encima del nivel de ruptura de la curva confirma el cambio de tendencia. Mantener esta estructura sienta las bases para una reversión de tendencia prolongada hacia objetivos de mayor resistencia.
No ignores las curvas de acumulación de varios meses: cuando se rompen, el impulso cambia rápido.
#POL #Polygon #CryptoAnalysis #TechnicalAnalysis
Después de una larga tendencia bajista tras una curva redondeada parabólica, el precio por fin ha recuperado un soporte clave cerca de $0.0750 y explotó hacia arriba hasta $0.1100. Esta agresiva vela de expansión verde indica que los compradores están absorbiendo una oferta significativa de corto plazo en la parte inferior del rango macro.
Si bien en marcos temporales más bajos puede haber un retroceso a corto plazo después de un empuje vertical tan brusco, mantener por encima del nivel de ruptura de la curva confirma el cambio de tendencia. Mantener esta estructura sienta las bases para una reversión de tendencia prolongada hacia objetivos de mayor resistencia.
No ignores las curvas de acumulación de varios meses: cuando se rompen, el impulso cambia rápido.
#POL #Polygon #CryptoAnalysis #TechnicalAnalysis
65
·
--
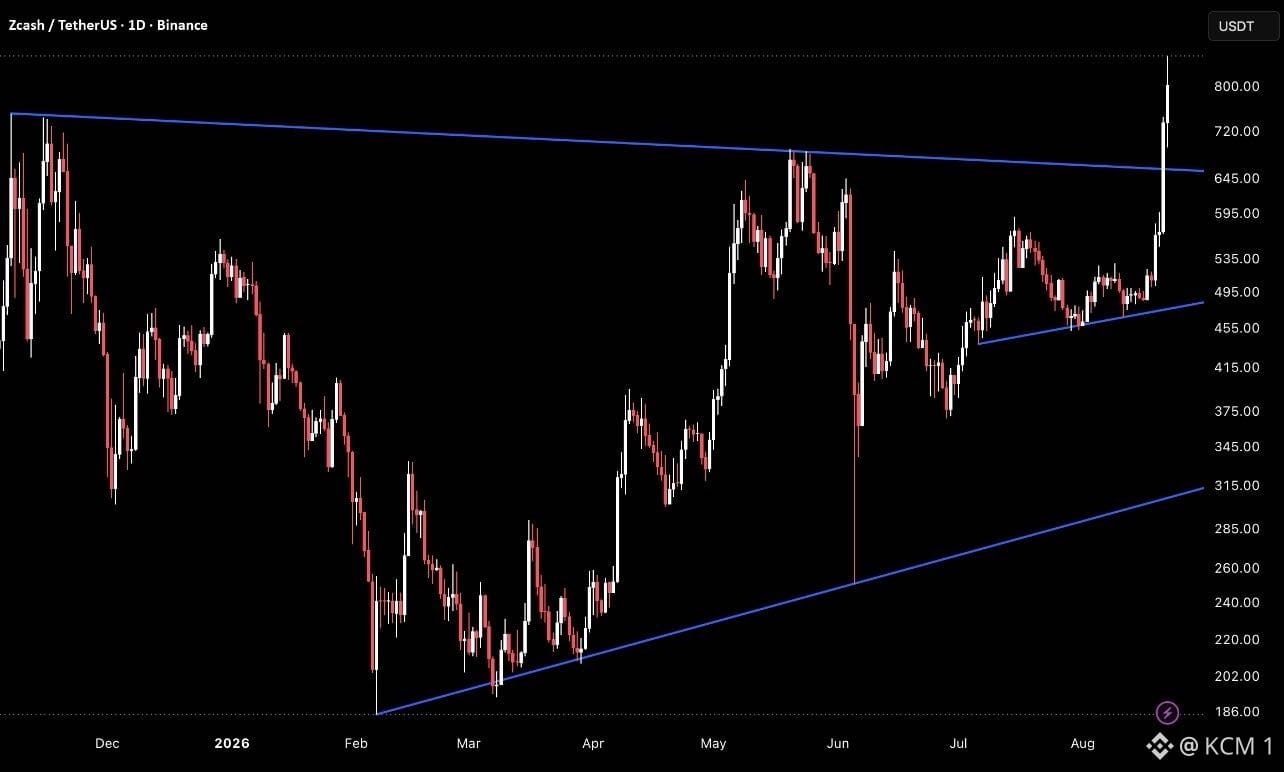
Todo el mundo está observando este explosivo pico vertical en $ZEC, pero se está perdiendo la ruptura de la estructura macro de varios años que impulsa la subida.
Después de años de acumularse dentro de un enorme patrón de cuña expansiva, el precio ha atravesado violentamente la resistencia diagonal superior de largo plazo. El avance por encima de niveles importantes de oferta alrededor de $645 demuestra una presión compradora intensa que elimina años de resistencia acumulada en la parte superior.
Aunque el movimiento vertical está sobreextendido en marcos temporales más bajos, mantener por encima de la resistencia macro rota cerca de $645 convierte el antiguo techo en un soporte estructural. Asegurar esta zona sienta las bases para una continuación a largo plazo hacia objetivos de expansión más altos.
No entre en pánico con las velas verticales: observa cómo el precio construye estructura de mercado por encima de los niveles de ruptura macro.
#ZEC #Zcash #CryptoAnalysis #TechnicalAnalysis
Todo el mundo está observando este explosivo pico vertical en $ZEC, pero se está perdiendo la ruptura de la estructura macro de varios años que impulsa la subida.
Después de años de acumularse dentro de un enorme patrón de cuña expansiva, el precio ha atravesado violentamente la resistencia diagonal superior de largo plazo. El avance por encima de niveles importantes de oferta alrededor de $645 demuestra una presión compradora intensa que elimina años de resistencia acumulada en la parte superior.
Aunque el movimiento vertical está sobreextendido en marcos temporales más bajos, mantener por encima de la resistencia macro rota cerca de $645 convierte el antiguo techo en un soporte estructural. Asegurar esta zona sienta las bases para una continuación a largo plazo hacia objetivos de expansión más altos.
No entre en pánico con las velas verticales: observa cómo el precio construye estructura de mercado por encima de los niveles de ruptura macro.
#ZEC #Zcash #CryptoAnalysis #TechnicalAnalysis
Después de años de acumularse dentro de un enorme patrón de cuña expansiva, el precio ha atravesado violentamente la resistencia diagonal superior de largo plazo. El avance por encima de niveles importantes de oferta alrededor de $645 demuestra una presión compradora intensa que elimina años de resistencia acumulada en la parte superior.
Aunque el movimiento vertical está sobreextendido en marcos temporales más bajos, mantener por encima de la resistencia macro rota cerca de $645 convierte el antiguo techo en un soporte estructural. Asegurar esta zona sienta las bases para una continuación a largo plazo hacia objetivos de expansión más altos.
No entre en pánico con las velas verticales: observa cómo el precio construye estructura de mercado por encima de los niveles de ruptura macro.
#ZEC #Zcash #CryptoAnalysis #TechnicalAnalysis
72
·
--
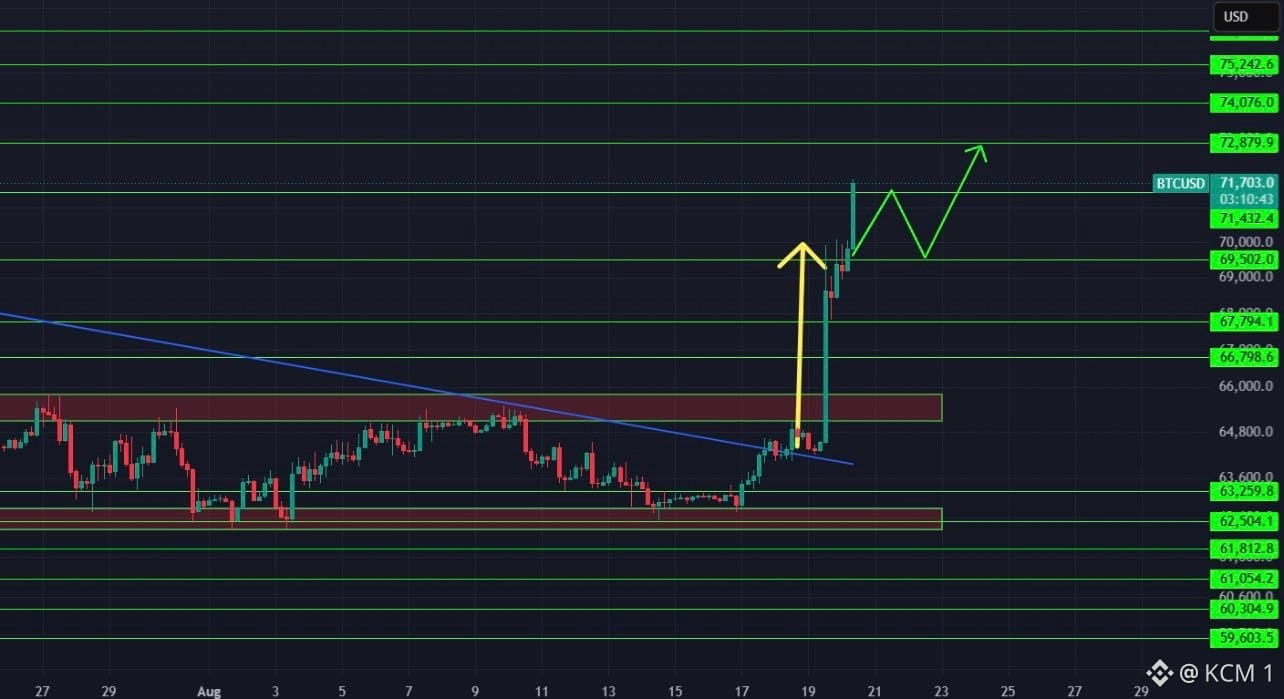
Todo el mundo está siguiendo esta enorme expansión en $BTC, pero se está perdiendo la fase de acumulación macro que impulsó la ruptura.
Después de consolidarse dentro de un rango horizontal estrecho y de superar la resistencia diagonal alrededor de $64,800, el precio explotó al alza hacia $71,700. El movimiento impulsivo superó con facilidad las principales bandas de oferta por encima, cambiando la estructura del mercado de forma decisiva de regreso a un régimen alcista fuerte.
Un retesteo temporal hacia abajo para convertir la resistencia anterior en soporte cerca de $69,500 consolidaría un mínimo más alto saludable. Mantener este nivel deja el camino despejado para un empuje de continuación principal hacia $72,800 y $75,200.
Los rangos de acumulación construyen la energía que está en la base de la ruptura: la tendencia solo está ejecutando su plan.
#BTC #Bitcoin #CryptoAnalysis #TechnicalAnalysis
Todo el mundo está siguiendo esta enorme expansión en $BTC, pero se está perdiendo la fase de acumulación macro que impulsó la ruptura.
Después de consolidarse dentro de un rango horizontal estrecho y de superar la resistencia diagonal alrededor de $64,800, el precio explotó al alza hacia $71,700. El movimiento impulsivo superó con facilidad las principales bandas de oferta por encima, cambiando la estructura del mercado de forma decisiva de regreso a un régimen alcista fuerte.
Un retesteo temporal hacia abajo para convertir la resistencia anterior en soporte cerca de $69,500 consolidaría un mínimo más alto saludable. Mantener este nivel deja el camino despejado para un empuje de continuación principal hacia $72,800 y $75,200.
Los rangos de acumulación construyen la energía que está en la base de la ruptura: la tendencia solo está ejecutando su plan.
#BTC #Bitcoin #CryptoAnalysis #TechnicalAnalysis
Después de consolidarse dentro de un rango horizontal estrecho y de superar la resistencia diagonal alrededor de $64,800, el precio explotó al alza hacia $71,700. El movimiento impulsivo superó con facilidad las principales bandas de oferta por encima, cambiando la estructura del mercado de forma decisiva de regreso a un régimen alcista fuerte.
Un retesteo temporal hacia abajo para convertir la resistencia anterior en soporte cerca de $69,500 consolidaría un mínimo más alto saludable. Mantener este nivel deja el camino despejado para un empuje de continuación principal hacia $72,800 y $75,200.
Los rangos de acumulación construyen la energía que está en la base de la ruptura: la tendencia solo está ejecutando su plan.
#BTC #Bitcoin #CryptoAnalysis #TechnicalAnalysis
68
·
--
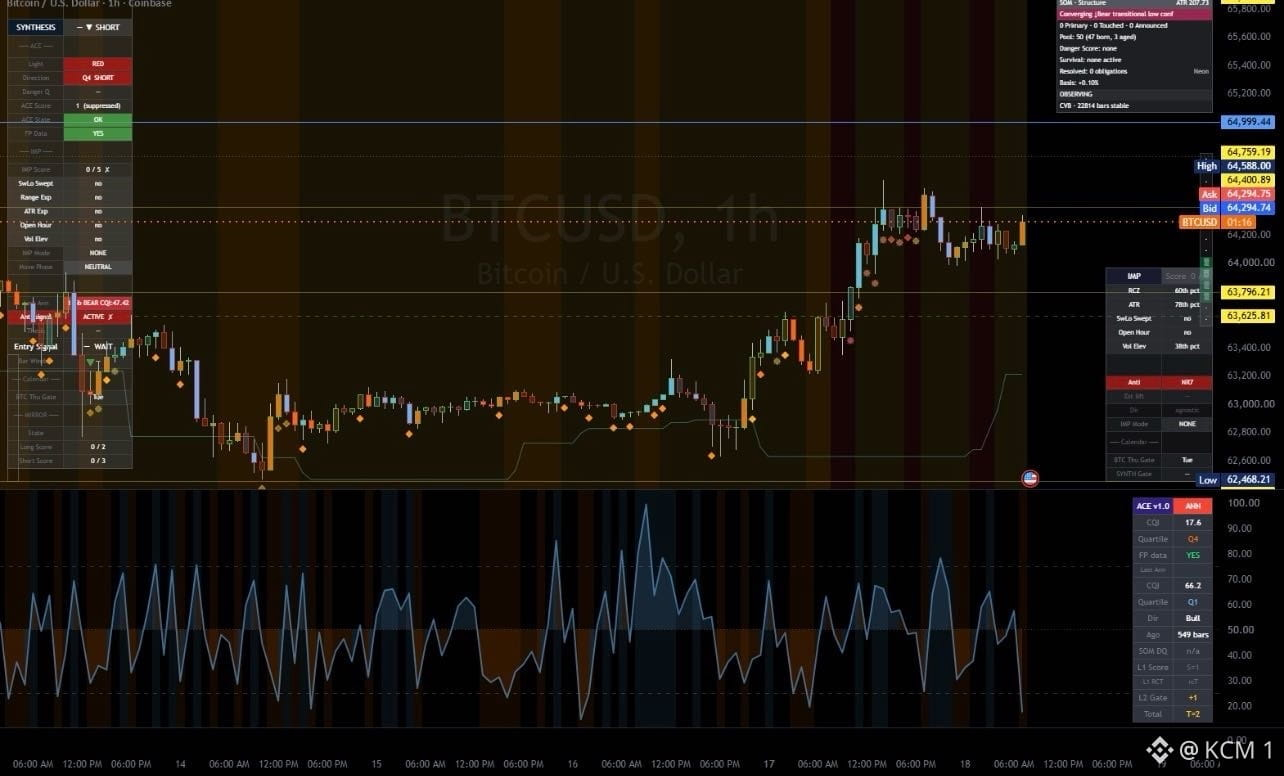
Todo el mundo está mirando esta ajustada consolidación de $BTC cerca de $64,300, pero se está pasando por alto la compresión del impulso que se está formando bajo los máximos locales.
Después de expandirse al alza desde la base de $62,468, el precio se está moviendo en un rango estrecho justo por debajo de la resistencia cercana a $64,750. El oscilador en la parte inferior está pasando por ciclos de cambios bruscos de volatilidad, señalando un emparejamiento agresivo de órdenes mientras compradores y vendedores pelean por la dirección.
Una ruptura fuerte por encima de $64,759 desbloquea el impulso hacia objetivos psicológicos clave como $65,000. Sin embargo, no lograr superar la resistencia mantiene el precio acotado dentro de los niveles de soporte locales alrededor de $63,796.
Una consolidación estrecha cerca de los máximos locales hace que la energía del mercado se acumule justo antes de la fase de expansión.
#BTC #Bitcoin #CryptoAnalysis #TechnicalAnalysis
Todo el mundo está mirando esta ajustada consolidación de $BTC cerca de $64,300, pero se está pasando por alto la compresión del impulso que se está formando bajo los máximos locales.
Después de expandirse al alza desde la base de $62,468, el precio se está moviendo en un rango estrecho justo por debajo de la resistencia cercana a $64,750. El oscilador en la parte inferior está pasando por ciclos de cambios bruscos de volatilidad, señalando un emparejamiento agresivo de órdenes mientras compradores y vendedores pelean por la dirección.
Una ruptura fuerte por encima de $64,759 desbloquea el impulso hacia objetivos psicológicos clave como $65,000. Sin embargo, no lograr superar la resistencia mantiene el precio acotado dentro de los niveles de soporte locales alrededor de $63,796.
Una consolidación estrecha cerca de los máximos locales hace que la energía del mercado se acumule justo antes de la fase de expansión.
#BTC #Bitcoin #CryptoAnalysis #TechnicalAnalysis
Después de expandirse al alza desde la base de $62,468, el precio se está moviendo en un rango estrecho justo por debajo de la resistencia cercana a $64,750. El oscilador en la parte inferior está pasando por ciclos de cambios bruscos de volatilidad, señalando un emparejamiento agresivo de órdenes mientras compradores y vendedores pelean por la dirección.
Una ruptura fuerte por encima de $64,759 desbloquea el impulso hacia objetivos psicológicos clave como $65,000. Sin embargo, no lograr superar la resistencia mantiene el precio acotado dentro de los niveles de soporte locales alrededor de $63,796.
Una consolidación estrecha cerca de los máximos locales hace que la energía del mercado se acumule justo antes de la fase de expansión.
#BTC #Bitcoin #CryptoAnalysis #TechnicalAnalysis
72
·
--
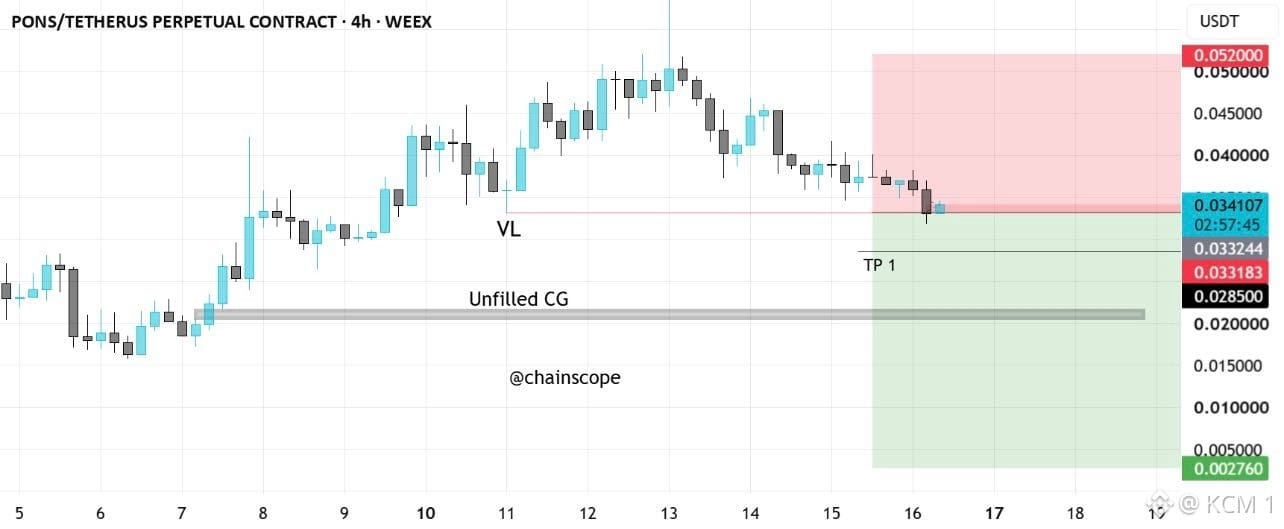
La parte interesante no es la caída. Es que $PONS sigue cotizando cerca de una zona clave de rechazo mientras el gráfico continúa mostrando máximos más bajos.
El precio está alrededor de $0.0341, con el área de resistencia marcada extendiéndose hacia $0.052. Más abajo, el gap sin llenar cerca de $0.0285 destaca como una zona importante a la que el precio podría volver.
El gráfico básicamente está diciendo que el mercado tiene asuntos pendientes más abajo que arriba.
A veces la pista más grande está en dónde aún espera la liquidez.
#PONS #Crypto #Altcoins
La parte interesante no es la caída. Es que $PONS sigue cotizando cerca de una zona clave de rechazo mientras el gráfico continúa mostrando máximos más bajos.
El precio está alrededor de $0.0341, con el área de resistencia marcada extendiéndose hacia $0.052. Más abajo, el gap sin llenar cerca de $0.0285 destaca como una zona importante a la que el precio podría volver.
El gráfico básicamente está diciendo que el mercado tiene asuntos pendientes más abajo que arriba.
A veces la pista más grande está en dónde aún espera la liquidez.
#PONS #Crypto #Altcoins
El precio está alrededor de $0.0341, con el área de resistencia marcada extendiéndose hacia $0.052. Más abajo, el gap sin llenar cerca de $0.0285 destaca como una zona importante a la que el precio podría volver.
El gráfico básicamente está diciendo que el mercado tiene asuntos pendientes más abajo que arriba.
A veces la pista más grande está en dónde aún espera la liquidez.
#PONS #Crypto #Altcoins
75
·
--
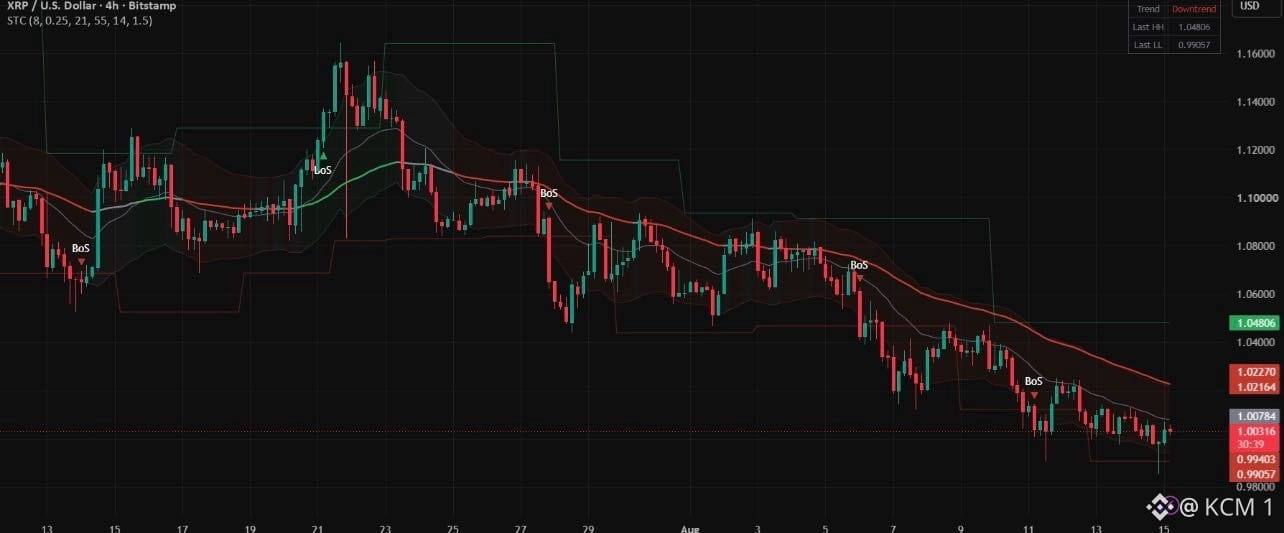
Todo el mundo está mirando esta sangría lenta en $XRP , pero se está perdiendo la posible barrida de liquidez que se está acumulando cerca de un soporte psicológico clave.
Después de romper la estructura del mercado a la baja (BoS) múltiples veces en el gráfico de 4 horas, el precio está bajando gradualmente dentro de un canal bajista estrecho cerca de la marca de $1.00. Los máximos y mínimos cada vez más bajos continuos muestran que los osos mantienen el control total de la tendencia inmediata.
Una ruptura por debajo de $0.9905 podría barrer las órdenes de venta restantes antes de que se materialice cualquier rebote de alivio. Sin embargo, hasta que el precio rompa por encima de la resistencia de la línea de tendencia dinámica cerca de $1.02 , la estructura favorece la continuación de la presión bajista.
No adivines el fondo: espera a que la estructura confirme una reversión real.
#XRP #Ripple #CryptoAnalysis #TechnicalAnalysis
Todo el mundo está mirando esta sangría lenta en $XRP , pero se está perdiendo la posible barrida de liquidez que se está acumulando cerca de un soporte psicológico clave.
Después de romper la estructura del mercado a la baja (BoS) múltiples veces en el gráfico de 4 horas, el precio está bajando gradualmente dentro de un canal bajista estrecho cerca de la marca de $1.00. Los máximos y mínimos cada vez más bajos continuos muestran que los osos mantienen el control total de la tendencia inmediata.
Una ruptura por debajo de $0.9905 podría barrer las órdenes de venta restantes antes de que se materialice cualquier rebote de alivio. Sin embargo, hasta que el precio rompa por encima de la resistencia de la línea de tendencia dinámica cerca de $1.02 , la estructura favorece la continuación de la presión bajista.
No adivines el fondo: espera a que la estructura confirme una reversión real.
#XRP #Ripple #CryptoAnalysis #TechnicalAnalysis
Después de romper la estructura del mercado a la baja (BoS) múltiples veces en el gráfico de 4 horas, el precio está bajando gradualmente dentro de un canal bajista estrecho cerca de la marca de $1.00. Los máximos y mínimos cada vez más bajos continuos muestran que los osos mantienen el control total de la tendencia inmediata.
Una ruptura por debajo de $0.9905 podría barrer las órdenes de venta restantes antes de que se materialice cualquier rebote de alivio. Sin embargo, hasta que el precio rompa por encima de la resistencia de la línea de tendencia dinámica cerca de $1.02 , la estructura favorece la continuación de la presión bajista.
No adivines el fondo: espera a que la estructura confirme una reversión real.
#XRP #Ripple #CryptoAnalysis #TechnicalAnalysis
85
Inicia sesión para explorar más contenidos
Únete a usuarios de criptomonedas de todo el mundo en Binance Square
⚡️ Obtén la información más reciente y útil sobre criptomonedas.
💬 Confía en el mayor exchange de criptomonedas del mundo.
👍 Descubre opiniones reales de creadores verificados.
Correo electrónico/número de teléfono
Temas en tendencia
FedRateWatch
302,823 visualizaciones
1,861 participa(n) en el debate
Comparte y gana recompensas de tráfico en nuestra campaña de hashtag en tendencia
✨Tema: FOMC septiembre, ¿cuál será el próximo movimiento de la Fed?
👉Cómo unirte:
Publica una publicación breve o un artículo con el hashtag #FedRateWatch
Crea contenido basado en los siguientes enfoques:
- El CPI subyacente de agosto aumentó 0.3% mes a mes, y las probabilidades de una subida de 25 pb esta semana ahora están cerca del 90%. ¿Anticipas una subida de tasas esta semana? ¿Es algo puntual o el inicio de un ciclo de subidas más largo?
- Si la subida ocurre, ¿cómo se desarrolla para BTC, acciones tecnológicas y oro? ¿Alcista o bajista?
- ¿Cómo planeas operar a continuación? Comparte tu operación/tenencias de BTC, acciones u oro con nuestro widget para compartir operaciones.
⏰Periodo de la campaña:
- 2026-09-15 11:00 - 2026-09-17 3:00 UTC
🎁Recompensa:
- Las publicaciones que cumplan con las pautas anteriores y tengan más de 100 palabras serán revisadas y podrían recibir un impulso aleatorio de tráfico de 500 a 3,000 visitas. Recibirás una notificación de tu secretario/a de feed si tu publicación es seleccionada.
- Obtén la oportunidad de que tu artículo aparezca destacado en Binance Square Official
¿Necesitas ideas para tu publicación? Visita la página del tema #FedRateWatch o la Square Guide on How to Post for Better Reach.
Binance Square Official
·318 «Me gusta»
·577.4k visualizaciones
BitcoinSlidesTo$76000
5,181 visualizaciones
66 participa(n) en el debate
BitcoinReboundsTo$79K
52,436 visualizaciones
368 participa(n) en el debate