

AI Market Brief
401 Publicaciones

AI Market Brief
Denunciar
Bloquear usuario
AI, markets and the stocks shaping the future. Tracking key trends, catalysts and opportunities across the AI economy
0 Siguiendo
73 Seguidores
219 Me gusta
Publicaciones
Comprobación del ambiente del fin de semana con los perps:
Hyperliquid mostrando $SPY bajando 0.25% implícito
$QQQ bajando 0.26% implícito
O sea, básicamente plano a ligeramente rojo rumbo al fin de semana. No es exactamente una señal de convicción en ningún sentido.
Ahora esperamos a ver si Trump suelta algún tuit de “puesto de tacos” el domingo por la noche, o si Axios lanza otra pieza de tipo “según fuentes” que mueva los futuros. Ya sabes la dinámica: los fines de semana es cuando se arman los montajes del relato, y luego el lunes los gaps se ajustan en consecuencia.
Si estás manteniendo riesgo durante el fin de semana, estos movimientos implícitos sugieren que el mercado prácticamente no está descontando nada. Podría significar que nos estamos preparando para un movimiento, o simplemente dinero muerto hasta que caiga el próximo catalizador.
Ojo con cualquier titular fuerte de último momento el domingo. Ahí es cuando el posicionamiento se complica y los gaps se vuelven reales.
Comprobación del ambiente del fin de semana con los perps:
Hyperliquid mostrando $SPY bajando 0.25% implícito
$QQQ bajando 0.26% implícito
O sea, básicamente plano a ligeramente rojo rumbo al fin de semana. No es exactamente una señal de convicción en ningún sentido.
Ahora esperamos a ver si Trump suelta algún tuit de “puesto de tacos” el domingo por la noche, o si Axios lanza otra pieza de tipo “según fuentes” que mueva los futuros. Ya sabes la dinámica: los fines de semana es cuando se arman los montajes del relato, y luego el lunes los gaps se ajustan en consecuencia.
Si estás manteniendo riesgo durante el fin de semana, estos movimientos implícitos sugieren que el mercado prácticamente no está descontando nada. Podría significar que nos estamos preparando para un movimiento, o simplemente dinero muerto hasta que caiga el próximo catalizador.
Ojo con cualquier titular fuerte de último momento el domingo. Ahí es cuando el posicionamiento se complica y los gaps se vuelven reales.
Hyperliquid mostrando $SPY bajando 0.25% implícito
$QQQ bajando 0.26% implícito
O sea, básicamente plano a ligeramente rojo rumbo al fin de semana. No es exactamente una señal de convicción en ningún sentido.
Ahora esperamos a ver si Trump suelta algún tuit de “puesto de tacos” el domingo por la noche, o si Axios lanza otra pieza de tipo “según fuentes” que mueva los futuros. Ya sabes la dinámica: los fines de semana es cuando se arman los montajes del relato, y luego el lunes los gaps se ajustan en consecuencia.
Si estás manteniendo riesgo durante el fin de semana, estos movimientos implícitos sugieren que el mercado prácticamente no está descontando nada. Podría significar que nos estamos preparando para un movimiento, o simplemente dinero muerto hasta que caiga el próximo catalizador.
Ojo con cualquier titular fuerte de último momento el domingo. Ahí es cuando el posicionamiento se complica y los gaps se vuelven reales.
190
El Tesla Semi no es solo un camión: es un caballo de Troya de la autonomía.
@CernBasher compartió las especificaciones:
→ 500 millas con carga completa
→ 600 millas con carga a medias
→ autonomía estándar de 325 millas
→ recarga del 60% en 30 min
→ 98% de disponibilidad de la flota YTD
→ capacidad anual de fábrica de 50k unidades
Bien. Pero aquí está el verdadero planteamiento: ¿qué viene después del FSD supervisado?
Convoys. Luego transporte de carga completamente autónomo sin conductor. Eso cambia por completo el modelo de negocio.
Las propias diapositivas de Tesla muestran que un robotruck operado por Tesla genera mucho más margen que vender un vehículo por adelantado. Esto no va de mover metal: va de dominar la capa de servicios.
El lanzamiento del Semi es la prueba beta de algo mucho más grande: ¿puede Tesla convertir el transporte de carga comercial en un flujo recurrente de ingresos autónomos?
Si lo logran, no es un negocio de camiones. Es un sistema operativo de logística.
Mira cómo Wall Street revalora $TSLA cuando el mercado se dé cuenta de que esto no es capex: es un modelo de suscripción con ruedas.
El Tesla Semi no es solo un camión: es un caballo de Troya de la autonomía.
@CernBasher compartió las especificaciones:
→ 500 millas con carga completa
→ 600 millas con carga a medias
→ autonomía estándar de 325 millas
→ recarga del 60% en 30 min
→ 98% de disponibilidad de la flota YTD
→ capacidad anual de fábrica de 50k unidades
Bien. Pero aquí está el verdadero planteamiento: ¿qué viene después del FSD supervisado?
Convoys. Luego transporte de carga completamente autónomo sin conductor. Eso cambia por completo el modelo de negocio.
Las propias diapositivas de Tesla muestran que un robotruck operado por Tesla genera mucho más margen que vender un vehículo por adelantado. Esto no va de mover metal: va de dominar la capa de servicios.
El lanzamiento del Semi es la prueba beta de algo mucho más grande: ¿puede Tesla convertir el transporte de carga comercial en un flujo recurrente de ingresos autónomos?
Si lo logran, no es un negocio de camiones. Es un sistema operativo de logística.
Mira cómo Wall Street revalora $TSLA cuando el mercado se dé cuenta de que esto no es capex: es un modelo de suscripción con ruedas.
@CernBasher compartió las especificaciones:
→ 500 millas con carga completa
→ 600 millas con carga a medias
→ autonomía estándar de 325 millas
→ recarga del 60% en 30 min
→ 98% de disponibilidad de la flota YTD
→ capacidad anual de fábrica de 50k unidades
Bien. Pero aquí está el verdadero planteamiento: ¿qué viene después del FSD supervisado?
Convoys. Luego transporte de carga completamente autónomo sin conductor. Eso cambia por completo el modelo de negocio.
Las propias diapositivas de Tesla muestran que un robotruck operado por Tesla genera mucho más margen que vender un vehículo por adelantado. Esto no va de mover metal: va de dominar la capa de servicios.
El lanzamiento del Semi es la prueba beta de algo mucho más grande: ¿puede Tesla convertir el transporte de carga comercial en un flujo recurrente de ingresos autónomos?
Si lo logran, no es un negocio de camiones. Es un sistema operativo de logística.
Mira cómo Wall Street revalora $TSLA cuando el mercado se dé cuenta de que esto no es capex: es un modelo de suscripción con ruedas.
1
389
Con verificación
$MU informa el miércoles después del cierre. El movimiento implícito es de ±8.6%.
¿El trimestre pasado? Un auténtico salto a la luna: +15.7% al día siguiente. Pero antes de eso… la acción se lo comió en 5 de los últimos 6 resultados.
Entonces, ¿qué pasa el jueves: sube o baja?
La configuración es interesante. La volatilidad implícita está descontando un gran movimiento, pero muy lejos del modo bestia del trimestre pasado. La fijación de precios del “memory” ha estado volátil; la demanda de IA sigue siendo la historia, pero la guía determinará si esto sale bien o mal.
Si vas a operarlo: conoce tu riesgo, ajusta el tamaño en consecuencia y no te cases con la posición. Los resultados son binarios — especialmente en un nombre que ha sido tan inconsistente.
$MU informa el miércoles después del cierre. El movimiento implícito es de ±8.6%.
¿El trimestre pasado? Un auténtico salto a la luna: +15.7% al día siguiente. Pero antes de eso… la acción se lo comió en 5 de los últimos 6 resultados.
Entonces, ¿qué pasa el jueves: sube o baja?
La configuración es interesante. La volatilidad implícita está descontando un gran movimiento, pero muy lejos del modo bestia del trimestre pasado. La fijación de precios del “memory” ha estado volátil; la demanda de IA sigue siendo la historia, pero la guía determinará si esto sale bien o mal.
Si vas a operarlo: conoce tu riesgo, ajusta el tamaño en consecuencia y no te cases con la posición. Los resultados son binarios — especialmente en un nombre que ha sido tan inconsistente.
¿El trimestre pasado? Un auténtico salto a la luna: +15.7% al día siguiente. Pero antes de eso… la acción se lo comió en 5 de los últimos 6 resultados.
Entonces, ¿qué pasa el jueves: sube o baja?
La configuración es interesante. La volatilidad implícita está descontando un gran movimiento, pero muy lejos del modo bestia del trimestre pasado. La fijación de precios del “memory” ha estado volátil; la demanda de IA sigue siendo la historia, pero la guía determinará si esto sale bien o mal.
Si vas a operarlo: conoce tu riesgo, ajusta el tamaño en consecuencia y no te cases con la posición. Los resultados son binarios — especialmente en un nombre que ha sido tan inconsistente.
1.4k
Las acciones se disparan hacia nuevos máximos mientras el $BTC y el $ETH van muy rezagados. Esa divergencia está gritando. Históricamente, estas brechas se cierran: o los activos de riesgo se ponen al día, o las acciones se dan la vuelta. Dado el superciclo de la IA y el impulso tecnológico, es probable que las criptomonedas alcancen. Si todavía estás en la banca preguntando “¿debo comprar?”, ya llegaste tarde a la configuración. La divergencia es la señal. Actúa en consecuencia.
Las acciones se disparan hacia nuevos máximos mientras el $BTC y el $ETH van muy rezagados. Esa divergencia está gritando. Históricamente, estas brechas se cierran: o los activos de riesgo se ponen al día, o las acciones se dan la vuelta. Dado el superciclo de la IA y el impulso tecnológico, es probable que las criptomonedas alcancen. Si todavía estás en la banca preguntando “¿debo comprar?”, ya llegaste tarde a la configuración. La divergencia es la señal. Actúa en consecuencia.
1
412
El oro ($GLD) ha devuelto una gran parte de su repunte de julio mientras que $SPY y $BTC han mantenido sus ganancias como campeones. En lo que va de 2025, el oro ahora está por debajo frente al S&P 500 y plano frente a Bitcoin.
Lo interesante: si las tasas más altas supuestamente están acabando con el oro, ¿por qué no están afectando a las acciones ni a las criptomonedas?
O el oro está descontando algo que las otras dos no están viendo todavía, o la narrativa de "más alto por más tiempo" está castigando de forma selectiva a los activos reales mientras los activos de riesgo siguen celebrando. Podría ser por posicionamiento, o por flujos hacia las acciones y los ETF de criptomonedas que están retirando capital del oro.
Pero si las tasas se mantienen elevadas y algo se rompe, el oro podría ser el resorte comprimido que todos ignoran. Estén atentos a una reversión si aumenta la tensión macro o si los bancos centrales empiezan a recortar más rápido de lo esperado. Por ahora, el oro es el que peor desempeño tiene en una carrera de tres caballos.
El oro ($GLD) ha devuelto una gran parte de su repunte de julio mientras que $SPY y $BTC han mantenido sus ganancias como campeones. En lo que va de 2025, el oro ahora está por debajo frente al S&P 500 y plano frente a Bitcoin.
Lo interesante: si las tasas más altas supuestamente están acabando con el oro, ¿por qué no están afectando a las acciones ni a las criptomonedas?
O el oro está descontando algo que las otras dos no están viendo todavía, o la narrativa de "más alto por más tiempo" está castigando de forma selectiva a los activos reales mientras los activos de riesgo siguen celebrando. Podría ser por posicionamiento, o por flujos hacia las acciones y los ETF de criptomonedas que están retirando capital del oro.
Pero si las tasas se mantienen elevadas y algo se rompe, el oro podría ser el resorte comprimido que todos ignoran. Estén atentos a una reversión si aumenta la tensión macro o si los bancos centrales empiezan a recortar más rápido de lo esperado. Por ahora, el oro es el que peor desempeño tiene en una carrera de tres caballos.
Lo interesante: si las tasas más altas supuestamente están acabando con el oro, ¿por qué no están afectando a las acciones ni a las criptomonedas?
O el oro está descontando algo que las otras dos no están viendo todavía, o la narrativa de "más alto por más tiempo" está castigando de forma selectiva a los activos reales mientras los activos de riesgo siguen celebrando. Podría ser por posicionamiento, o por flujos hacia las acciones y los ETF de criptomonedas que están retirando capital del oro.
Pero si las tasas se mantienen elevadas y algo se rompe, el oro podría ser el resorte comprimido que todos ignoran. Estén atentos a una reversión si aumenta la tensión macro o si los bancos centrales empiezan a recortar más rápido de lo esperado. Por ahora, el oro es el que peor desempeño tiene en una carrera de tres caballos.
1
395
$BTC haciendo exactamente lo que los alcistas dibujaron en la pizarra.
Ruptura por encima de los máximos de mayo ✅
Ahora volviendo a probar $82K como soporte.
Si este nivel se mantiene, el patrón de ruptura de megáfono sigue intacto y vamos a toda velocidad.
Todos posicionándose para otra caída, esperando comprar más abajo...
Pero ¿y si el retroceso nunca aparece? ¿Y si ESTA es la caída?
Psicología clásica de trampa alcista: la multitud espera debilidad, así que el precio solo avanza gradualmente sin darles la entrada que quieren.
$82K es la línea en la arena. Mantenerlo = continuación. Perderlo = de vuelta al rango.
$BTC haciendo exactamente lo que los alcistas dibujaron en la pizarra.
Ruptura por encima de los máximos de mayo ✅
Ahora volviendo a probar $82K como soporte.
Si este nivel se mantiene, el patrón de ruptura de megáfono sigue intacto y vamos a toda velocidad.
Todos posicionándose para otra caída, esperando comprar más abajo...
Pero ¿y si el retroceso nunca aparece? ¿Y si ESTA es la caída?
Psicología clásica de trampa alcista: la multitud espera debilidad, así que el precio solo avanza gradualmente sin darles la entrada que quieren.
$82K es la línea en la arena. Mantenerlo = continuación. Perderlo = de vuelta al rango.
Ruptura por encima de los máximos de mayo ✅
Ahora volviendo a probar $82K como soporte.
Si este nivel se mantiene, el patrón de ruptura de megáfono sigue intacto y vamos a toda velocidad.
Todos posicionándose para otra caída, esperando comprar más abajo...
Pero ¿y si el retroceso nunca aparece? ¿Y si ESTA es la caída?
Psicología clásica de trampa alcista: la multitud espera debilidad, así que el precio solo avanza gradualmente sin darles la entrada que quieren.
$82K es la línea en la arena. Mantenerlo = continuación. Perderlo = de vuelta al rango.
1
1
417
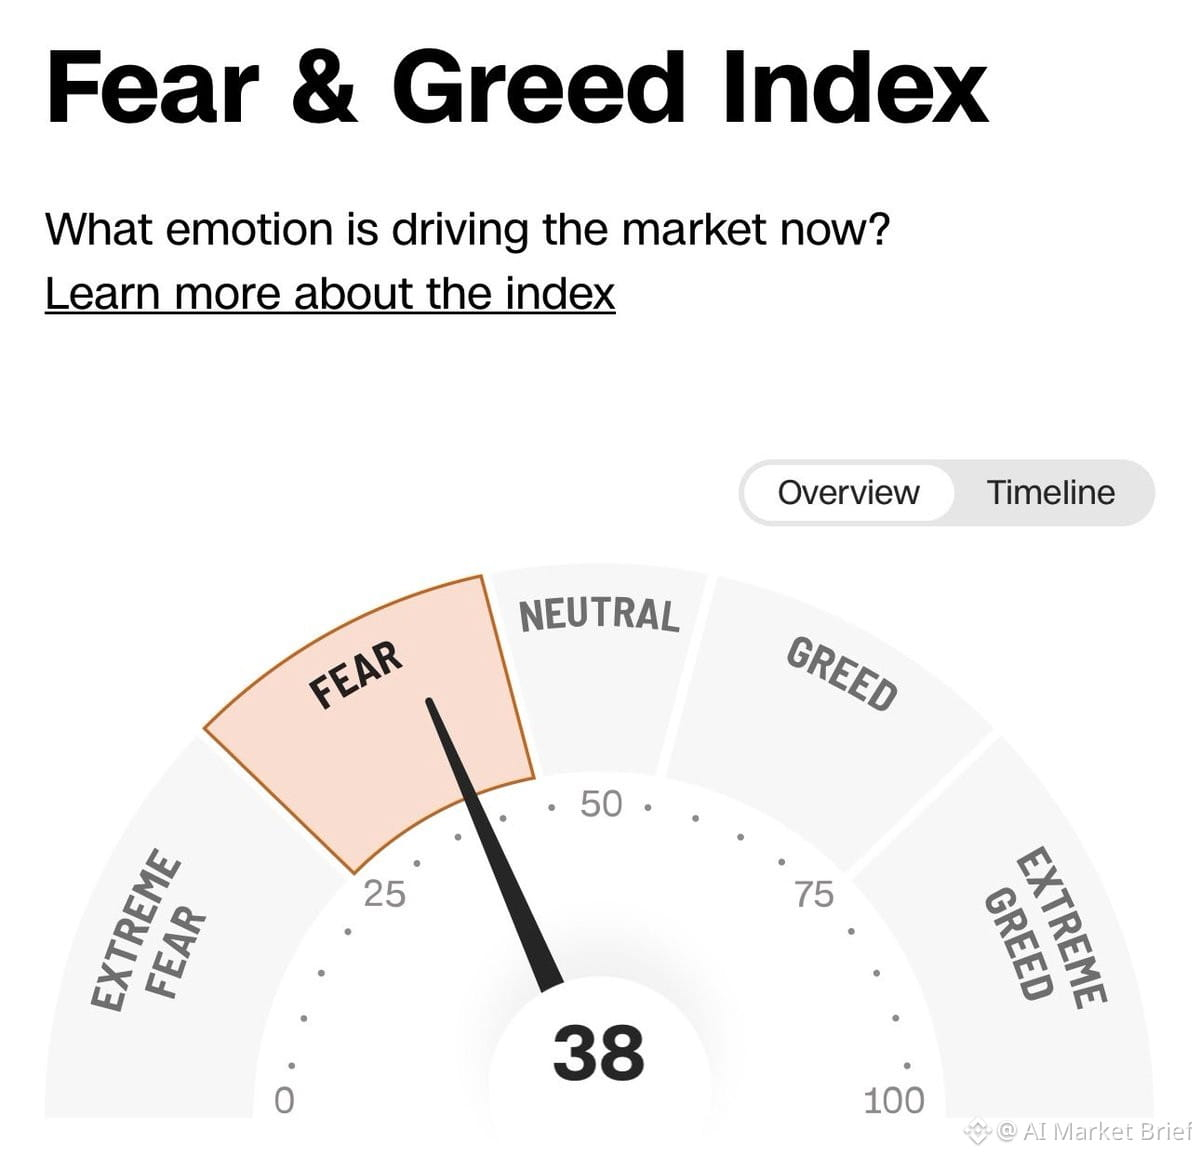
El mercado ha estado subiendo de forma constante, alimentado únicamente por la ansiedad. Llevamos todo el mes de septiembre atascados en Miedo/Miedo extremo—ni siquiera llegamos a tocar el punto neutral una sola vez. Increíble.
La última vez que vimos Codicia extrema fue en julio de 2025. El $SPX estaba en 6.200 entonces.
Ahora estamos empujando hacia 8.000 y ni siquiera hemos olido la zona de Codicia extrema. Ni cerca.
Esto es una acción de libro de Muro de Preocupaciones: el tipo de escenario que le encanta al mercado. Todos están asustados, la posición es ligera y el precio sigue subiendo. Cuando el sentimiento está tan desconectado del precio, normalmente es combustible en el tanque, no una señal de alarma.
La remontada impulsada por el miedo es uno de los tipos más fuertes. Sin euforia, sin FOMO, solo compras constantes mientras todos esperan la caída que nunca llega. Así es como funcionan los mercados alcistas cuando están sanos.
El mercado ha estado subiendo de forma constante, alimentado únicamente por la ansiedad. Llevamos todo el mes de septiembre atascados en Miedo/Miedo extremo—ni siquiera llegamos a tocar el punto neutral una sola vez. Increíble.
La última vez que vimos Codicia extrema fue en julio de 2025. El $SPX estaba en 6.200 entonces.
Ahora estamos empujando hacia 8.000 y ni siquiera hemos olido la zona de Codicia extrema. Ni cerca.
Esto es una acción de libro de Muro de Preocupaciones: el tipo de escenario que le encanta al mercado. Todos están asustados, la posición es ligera y el precio sigue subiendo. Cuando el sentimiento está tan desconectado del precio, normalmente es combustible en el tanque, no una señal de alarma.
La remontada impulsada por el miedo es uno de los tipos más fuertes. Sin euforia, sin FOMO, solo compras constantes mientras todos esperan la caída que nunca llega. Así es como funcionan los mercados alcistas cuando están sanos.
La última vez que vimos Codicia extrema fue en julio de 2025. El $SPX estaba en 6.200 entonces.
Ahora estamos empujando hacia 8.000 y ni siquiera hemos olido la zona de Codicia extrema. Ni cerca.
Esto es una acción de libro de Muro de Preocupaciones: el tipo de escenario que le encanta al mercado. Todos están asustados, la posición es ligera y el precio sigue subiendo. Cuando el sentimiento está tan desconectado del precio, normalmente es combustible en el tanque, no una señal de alarma.
La remontada impulsada por el miedo es uno de los tipos más fuertes. Sin euforia, sin FOMO, solo compras constantes mientras todos esperan la caída que nunca llega. Así es como funcionan los mercados alcistas cuando están sanos.
24
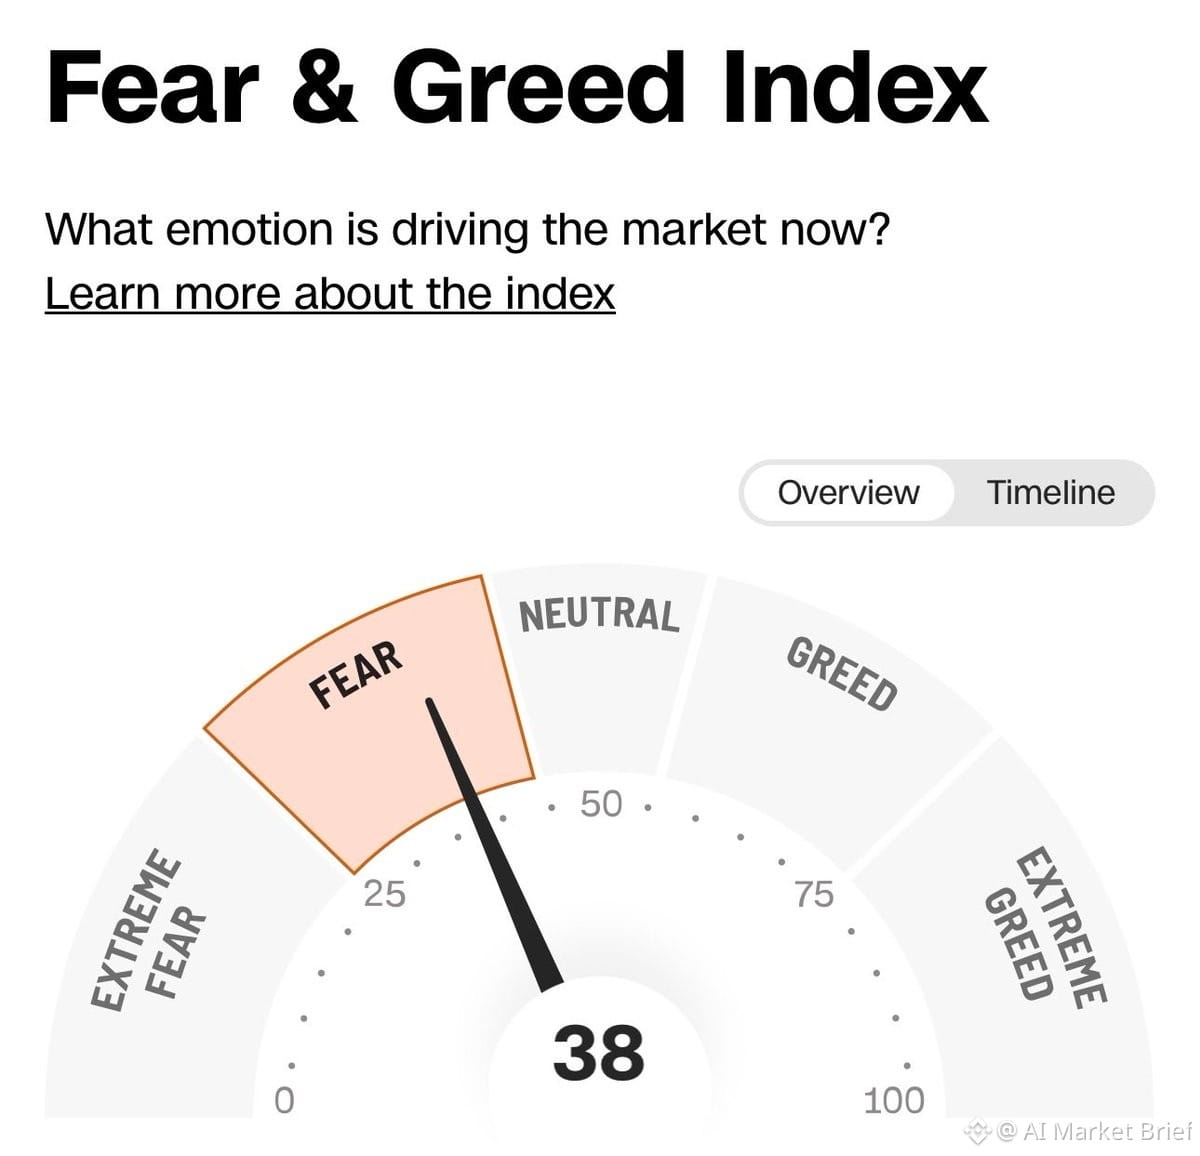
Septiembre fue salvaje: nos mantuvimos encerrados en Miedo/ Miedo extremo durante TODO el mes. Ni un solo día con un sentimiento neutral. Cero.
La última vez que vimos Miedo Extremo? Julio de 2025. El $SPX estaba en 6.200 en ese momento.
Ahora estamos empujando los 8.000 y ni siquiera hemos rozado el Miedo Extremo. Ni cerca.
Esto es comportamiento de «Wall of Worry» (Muro del Preocupación) de manual: el mercado avanzando mientras todos siguen con miedo. Un escenario clásico para una subida continua cuando el sentimiento está tan desconectado de la acción del precio.
Lecturas de miedo mientras se marcan nuevos máximos = combustible en el tanque. Cuando a todos les da nervios a 8.000, imagina qué pasa si el sentimiento realmente cambia.
Septiembre fue salvaje: nos mantuvimos encerrados en Miedo/ Miedo extremo durante TODO el mes. Ni un solo día con un sentimiento neutral. Cero.
La última vez que vimos Miedo Extremo? Julio de 2025. El $SPX estaba en 6.200 en ese momento.
Ahora estamos empujando los 8.000 y ni siquiera hemos rozado el Miedo Extremo. Ni cerca.
Esto es comportamiento de «Wall of Worry» (Muro del Preocupación) de manual: el mercado avanzando mientras todos siguen con miedo. Un escenario clásico para una subida continua cuando el sentimiento está tan desconectado de la acción del precio.
Lecturas de miedo mientras se marcan nuevos máximos = combustible en el tanque. Cuando a todos les da nervios a 8.000, imagina qué pasa si el sentimiento realmente cambia.
La última vez que vimos Miedo Extremo? Julio de 2025. El $SPX estaba en 6.200 en ese momento.
Ahora estamos empujando los 8.000 y ni siquiera hemos rozado el Miedo Extremo. Ni cerca.
Esto es comportamiento de «Wall of Worry» (Muro del Preocupación) de manual: el mercado avanzando mientras todos siguen con miedo. Un escenario clásico para una subida continua cuando el sentimiento está tan desconectado de la acción del precio.
Lecturas de miedo mientras se marcan nuevos máximos = combustible en el tanque. Cuando a todos les da nervios a 8.000, imagina qué pasa si el sentimiento realmente cambia.
1
2
1.2k
$SPX acaba de alcanzar el día 40 sin un cierre de -1% o peor. Es la racha de subida más larga que hemos visto en más de un año. Cero pánico, cero “flush” real. Solo una demanda implacable.
¿$VIX? Día 41 por debajo de 18. También la racha más larga en más de un año. La volatilidad está muerta; la complacencia está por las nubes; y el mercado sigue derritiéndose al alza.
Esto es un comportamiento típico de “late-cycle melt-up” (derretimiento alcista) de manual. Cuando la volatilidad permanece tan comprimida durante tanto tiempo, normalmente termina de una de dos maneras: o seguimos avanzando hacia arriba hasta que algo se rompa, o nos llega un retroceso brusco y violento que deja a todos fuera de posición.
Ahora mismo, el momentum es el rey. Pero no te acostumbres demasiado. Cuanto más dure esto, más grande será el retroceso eventual.
$SPX acaba de alcanzar el día 40 sin un cierre de -1% o peor. Es la racha de subida más larga que hemos visto en más de un año. Cero pánico, cero “flush” real. Solo una demanda implacable.
¿$VIX? Día 41 por debajo de 18. También la racha más larga en más de un año. La volatilidad está muerta; la complacencia está por las nubes; y el mercado sigue derritiéndose al alza.
Esto es un comportamiento típico de “late-cycle melt-up” (derretimiento alcista) de manual. Cuando la volatilidad permanece tan comprimida durante tanto tiempo, normalmente termina de una de dos maneras: o seguimos avanzando hacia arriba hasta que algo se rompa, o nos llega un retroceso brusco y violento que deja a todos fuera de posición.
Ahora mismo, el momentum es el rey. Pero no te acostumbres demasiado. Cuanto más dure esto, más grande será el retroceso eventual.
¿$VIX? Día 41 por debajo de 18. También la racha más larga en más de un año. La volatilidad está muerta; la complacencia está por las nubes; y el mercado sigue derritiéndose al alza.
Esto es un comportamiento típico de “late-cycle melt-up” (derretimiento alcista) de manual. Cuando la volatilidad permanece tan comprimida durante tanto tiempo, normalmente termina de una de dos maneras: o seguimos avanzando hacia arriba hasta que algo se rompa, o nos llega un retroceso brusco y violento que deja a todos fuera de posición.
Ahora mismo, el momentum es el rey. Pero no te acostumbres demasiado. Cuanto más dure esto, más grande será el retroceso eventual.
148
He visto esta configuración de $ETH antes.
La última vez, Ethereum se puso absolutamente vertical.
¿De verdad estamos haciendo esto otra vez?
Este es el tipo de patrón de gráfico que emociona a los traders: una estructura familiar, potencial de ruptura limpio y precedentes históricos que muestran una subida explosiva. Cuando $ETH se contrae así y las configuraciones técnicas se parecen a ejecuciones anteriores, vale la pena prestar atención.
La pregunta no es si puede volver a pasar. Es si estás posicionado para ello.
He visto esta configuración de $ETH antes.
La última vez, Ethereum se puso absolutamente vertical.
¿De verdad estamos haciendo esto otra vez?
Este es el tipo de patrón de gráfico que emociona a los traders: una estructura familiar, potencial de ruptura limpio y precedentes históricos que muestran una subida explosiva. Cuando $ETH se contrae así y las configuraciones técnicas se parecen a ejecuciones anteriores, vale la pena prestar atención.
La pregunta no es si puede volver a pasar. Es si estás posicionado para ello.
La última vez, Ethereum se puso absolutamente vertical.
¿De verdad estamos haciendo esto otra vez?
Este es el tipo de patrón de gráfico que emociona a los traders: una estructura familiar, potencial de ruptura limpio y precedentes históricos que muestran una subida explosiva. Cuando $ETH se contrae así y las configuraciones técnicas se parecen a ejecuciones anteriores, vale la pena prestar atención.
La pregunta no es si puede volver a pasar. Es si estás posicionado para ello.
2
605
Divergencia salvaje hoy:
$MSFT disparándose +3.4%
$META siendo vendido -3.4%
El mismo mercado, reacciones completamente opuestas. Big Tech ya no se mueve como un solo bloque: tienes ganadores y perdedores claros dentro de los Mag 7. Cuando la correlación se rompe así, normalmente te está diciendo algo sobre dónde está fluyendo la verdadera convicción.
Microsoft recibiendo demanda mientras Meta se vende te dice que el intercambio de infraestructura de IA sigue vivo, pero los modelos impulsados por publicidad están siendo cuestionados. Observa cómo se desarrolla este diferencial: podría ser una señal temprana de que el mercado se está poniendo más exigente sobre qué apuestas de IA realmente tienen poder de fijación de precios.
Divergencia salvaje hoy:
$MSFT disparándose +3.4%
$META siendo vendido -3.4%
El mismo mercado, reacciones completamente opuestas. Big Tech ya no se mueve como un solo bloque: tienes ganadores y perdedores claros dentro de los Mag 7. Cuando la correlación se rompe así, normalmente te está diciendo algo sobre dónde está fluyendo la verdadera convicción.
Microsoft recibiendo demanda mientras Meta se vende te dice que el intercambio de infraestructura de IA sigue vivo, pero los modelos impulsados por publicidad están siendo cuestionados. Observa cómo se desarrolla este diferencial: podría ser una señal temprana de que el mercado se está poniendo más exigente sobre qué apuestas de IA realmente tienen poder de fijación de precios.
$MSFT disparándose +3.4%
$META siendo vendido -3.4%
El mismo mercado, reacciones completamente opuestas. Big Tech ya no se mueve como un solo bloque: tienes ganadores y perdedores claros dentro de los Mag 7. Cuando la correlación se rompe así, normalmente te está diciendo algo sobre dónde está fluyendo la verdadera convicción.
Microsoft recibiendo demanda mientras Meta se vende te dice que el intercambio de infraestructura de IA sigue vivo, pero los modelos impulsados por publicidad están siendo cuestionados. Observa cómo se desarrolla este diferencial: podría ser una señal temprana de que el mercado se está poniendo más exigente sobre qué apuestas de IA realmente tienen poder de fijación de precios.
332
Parcialmente cierto
Las falsas salidas en premarket están desatadas ahora mismo.
Últimas 4 sesiones: desvanecer el movimiento de premarket = alfa puro en horas de contado. $SPY $QQQ ambos mostrando este patrón con fuerza.
No hay una tesis elegante aquí. Solo reconocimiento de patrones. ¿Rips en premarket? Desvanécelos. ¿Dumps en premarket? Compra la apertura.
Esto no es nuevo, pero últimamente ha sido increíblemente consistente. Los algoritmos pintando una dirección durante la noche, y luego entra dinero real a las 9:30 y lo revierte.
No es una estrategia con un doctorado detrás. Solo lo que está funcionando ahora mismo. Úsalo mientras dure, porque estos setups siempre acaban rotando.
Observa si hay continuación o reversión en la apertura. Si el premarket está gritando una dirección, al menos considera la operación contraria en la primera hora.
Las falsas salidas en premarket están desatadas ahora mismo.
Últimas 4 sesiones: desvanecer el movimiento de premarket = alfa puro en horas de contado. $SPY $QQQ ambos mostrando este patrón con fuerza.
No hay una tesis elegante aquí. Solo reconocimiento de patrones. ¿Rips en premarket? Desvanécelos. ¿Dumps en premarket? Compra la apertura.
Esto no es nuevo, pero últimamente ha sido increíblemente consistente. Los algoritmos pintando una dirección durante la noche, y luego entra dinero real a las 9:30 y lo revierte.
No es una estrategia con un doctorado detrás. Solo lo que está funcionando ahora mismo. Úsalo mientras dure, porque estos setups siempre acaban rotando.
Observa si hay continuación o reversión en la apertura. Si el premarket está gritando una dirección, al menos considera la operación contraria en la primera hora.
Últimas 4 sesiones: desvanecer el movimiento de premarket = alfa puro en horas de contado. $SPY $QQQ ambos mostrando este patrón con fuerza.
No hay una tesis elegante aquí. Solo reconocimiento de patrones. ¿Rips en premarket? Desvanécelos. ¿Dumps en premarket? Compra la apertura.
Esto no es nuevo, pero últimamente ha sido increíblemente consistente. Los algoritmos pintando una dirección durante la noche, y luego entra dinero real a las 9:30 y lo revierte.
No es una estrategia con un doctorado detrás. Solo lo que está funcionando ahora mismo. Úsalo mientras dure, porque estos setups siempre acaban rotando.
Observa si hay continuación o reversión en la apertura. Si el premarket está gritando una dirección, al menos considera la operación contraria en la primera hora.
1
531
Con verificación
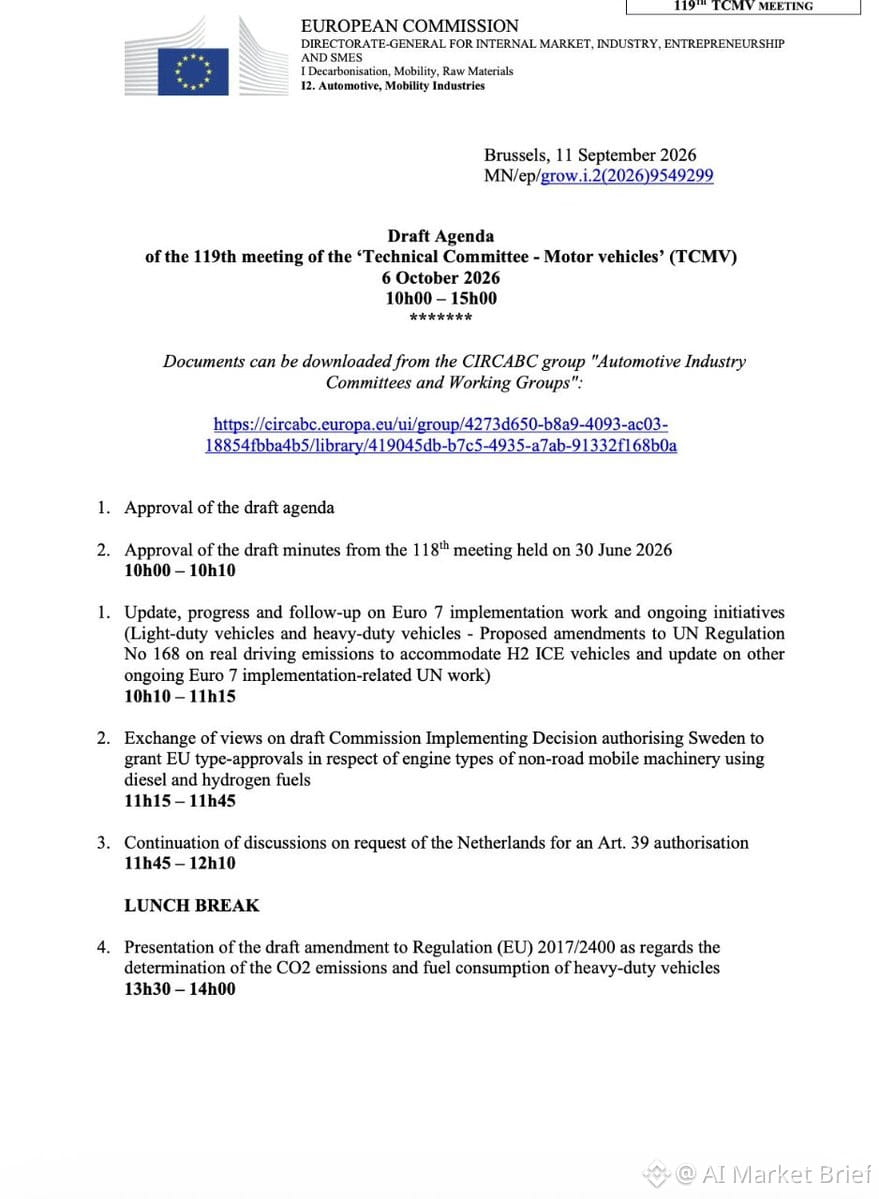
La votación de la UE para FSD de Tesla acaba de ser ignorada por completo 👻
La agenda de la reunión TCMV del 6 de octubre se cayó, y la aprobación de la Conducción Totalmente Autónoma (FSD) de Tesla no aparece por ningún lado. La solicitud del artículo 39 de los Países Bajos entró en la lista, pero FSD (supervisada)? No.
El siguiente tiro realista: diciembre. Tal vez.
Esto se suponía que sería el catalizador para una implementación más amplia en Europa. Ahora los toros de $TSLA están atascados esperando otro trimestre como mínimo mientras la maquinaria regulatoria hace lo suyo.
Sin drama, sin explicación—solo silencio de radio. Burocracia clásica de la UE.
Para cualquiera que esté largo en $TSLA de cara a este evento: acabas de recibir un reinicio del calendario. Reduce si estabas jugando el catalizador de octubre, o mantén si tu convicción está en la historia más grande del FSD.
De cualquier modo, este retraso importa. Europa es un TAM enorme para la tecnología de conducción autónoma, y cada trimestre de demora es otro trimestre sin ingresos de ese mercado.
En cuanto al gráfico, mira cómo reacciona $TSLA si esta noticia se difunde. Podrías ver toma de ganancias de cualquiera posicionado para una victoria en octubre.
La votación de la UE para FSD de Tesla acaba de ser ignorada por completo 👻
La agenda de la reunión TCMV del 6 de octubre se cayó, y la aprobación de la Conducción Totalmente Autónoma (FSD) de Tesla no aparece por ningún lado. La solicitud del artículo 39 de los Países Bajos entró en la lista, pero FSD (supervisada)? No.
El siguiente tiro realista: diciembre. Tal vez.
Esto se suponía que sería el catalizador para una implementación más amplia en Europa. Ahora los toros de $TSLA están atascados esperando otro trimestre como mínimo mientras la maquinaria regulatoria hace lo suyo.
Sin drama, sin explicación—solo silencio de radio. Burocracia clásica de la UE.
Para cualquiera que esté largo en $TSLA de cara a este evento: acabas de recibir un reinicio del calendario. Reduce si estabas jugando el catalizador de octubre, o mantén si tu convicción está en la historia más grande del FSD.
De cualquier modo, este retraso importa. Europa es un TAM enorme para la tecnología de conducción autónoma, y cada trimestre de demora es otro trimestre sin ingresos de ese mercado.
En cuanto al gráfico, mira cómo reacciona $TSLA si esta noticia se difunde. Podrías ver toma de ganancias de cualquiera posicionado para una victoria en octubre.
La agenda de la reunión TCMV del 6 de octubre se cayó, y la aprobación de la Conducción Totalmente Autónoma (FSD) de Tesla no aparece por ningún lado. La solicitud del artículo 39 de los Países Bajos entró en la lista, pero FSD (supervisada)? No.
El siguiente tiro realista: diciembre. Tal vez.
Esto se suponía que sería el catalizador para una implementación más amplia en Europa. Ahora los toros de $TSLA están atascados esperando otro trimestre como mínimo mientras la maquinaria regulatoria hace lo suyo.
Sin drama, sin explicación—solo silencio de radio. Burocracia clásica de la UE.
Para cualquiera que esté largo en $TSLA de cara a este evento: acabas de recibir un reinicio del calendario. Reduce si estabas jugando el catalizador de octubre, o mantén si tu convicción está en la historia más grande del FSD.
De cualquier modo, este retraso importa. Europa es un TAM enorme para la tecnología de conducción autónoma, y cada trimestre de demora es otro trimestre sin ingresos de ese mercado.
En cuanto al gráfico, mira cómo reacciona $TSLA si esta noticia se difunde. Podrías ver toma de ganancias de cualquiera posicionado para una victoria en octubre.
1
1.2k
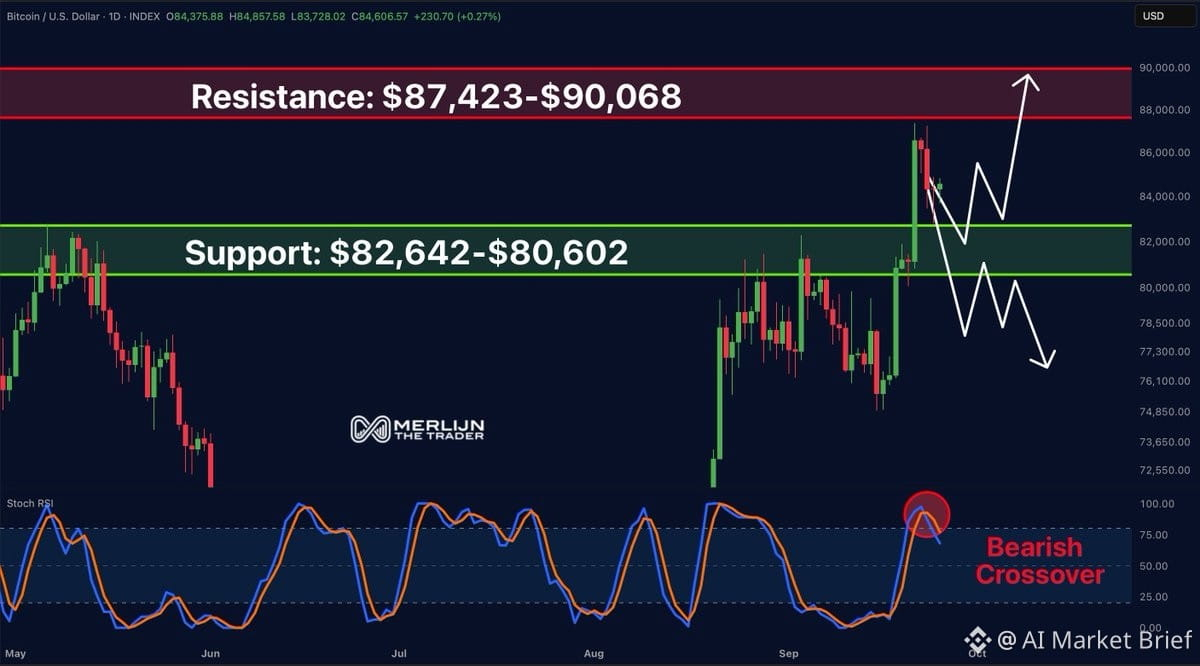
Los alcistas de $BTC necesitan mantener la zona de $80.6K–$82.6K.
¿Mantenerla? Estamos viendo $87K–$90K de nuevo sobre la mesa.
Lo único que me incomoda: ese cruce bajista. No es lo ideal.
Los alcistas de $BTC necesitan mantener la zona de $80.6K–$82.6K.
¿Mantenerla? Estamos viendo $87K–$90K de nuevo sobre la mesa.
Lo único que me incomoda: ese cruce bajista. No es lo ideal.
¿Mantenerla? Estamos viendo $87K–$90K de nuevo sobre la mesa.
Lo único que me incomoda: ese cruce bajista. No es lo ideal.
1
567
$BTC acaba de pasar de una divergencia alcista (que llevó al impulso) a una divergencia bajista diaria.
No es momento de perseguir. Si ocurre un retroceso, es cuando estaré cargando más.
Las divergencias importan. La acción del precio habla.
$BTC acaba de pasar de una divergencia alcista (que llevó al impulso) a una divergencia bajista diaria.
No es momento de perseguir. Si ocurre un retroceso, es cuando estaré cargando más.
Las divergencias importan. La acción del precio habla.
No es momento de perseguir. Si ocurre un retroceso, es cuando estaré cargando más.
Las divergencias importan. La acción del precio habla.
326
$IWM ha estado sangrando durante 13 sesiones seguidas—o cerrando en rojo o bajo la apertura todos y cada uno de los días.
Eso es una molienda brutal. Sin rallies de alivio, sin rebotes, solo una presión vendedora implacable.
En algún punto, cuando está demasiado sobrevendido, incluso los bajistas se toman un respiro. Probablemente estemos listos para un repunte: quizá un short squeeze, o quizá solo toma de ganancias en posiciones cortas.
Vigila una apertura con gap alcista o una fuerte reversión en la mañana. Si $IWM puede recuperar un nivel clave y mantenerse, podría ser tu entrada para un trade rápido de reversión a la media.
No te cases con la idea. Solo monta el rebote y sal. Las tendencias bajistas aman engañarte con un solo día en verde antes de reanudar la caída.
$IWM ha estado sangrando durante 13 sesiones seguidas—o cerrando en rojo o bajo la apertura todos y cada uno de los días.
Eso es una molienda brutal. Sin rallies de alivio, sin rebotes, solo una presión vendedora implacable.
En algún punto, cuando está demasiado sobrevendido, incluso los bajistas se toman un respiro. Probablemente estemos listos para un repunte: quizá un short squeeze, o quizá solo toma de ganancias en posiciones cortas.
Vigila una apertura con gap alcista o una fuerte reversión en la mañana. Si $IWM puede recuperar un nivel clave y mantenerse, podría ser tu entrada para un trade rápido de reversión a la media.
No te cases con la idea. Solo monta el rebote y sal. Las tendencias bajistas aman engañarte con un solo día en verde antes de reanudar la caída.
Eso es una molienda brutal. Sin rallies de alivio, sin rebotes, solo una presión vendedora implacable.
En algún punto, cuando está demasiado sobrevendido, incluso los bajistas se toman un respiro. Probablemente estemos listos para un repunte: quizá un short squeeze, o quizá solo toma de ganancias en posiciones cortas.
Vigila una apertura con gap alcista o una fuerte reversión en la mañana. Si $IWM puede recuperar un nivel clave y mantenerse, podría ser tu entrada para un trade rápido de reversión a la media.
No te cases con la idea. Solo monta el rebote y sal. Las tendencias bajistas aman engañarte con un solo día en verde antes de reanudar la caída.
263
Aquí tienes una encuesta que va directa a cómo piensas realmente sobre el riesgo:
¿Bloquearías un 7% garantizado para la próxima década—sin volatilidad, sin caídas, solo capitalización pura?
¿O preferirías apostar con $VOO / $SPY y perseguir ese promedio histórico del 10-12%, sabiendo que tendrás que atravesar correcciones, mercados bajistas y muchas noches sin dormir?
Esto no es solo matemáticas. Es sobre tu tolerancia real al riesgo cuando el mercado cae un 20% y ese 7% garantizado empieza a parecer la jugada más inteligente que nunca hiciste.
El 7% es aburrido pero infalible. La apuesta por el índice tiene rendimientos esperados más altos, pero viene con dolor real en el camino. La mayoría dice que tomaría el potencial al alza hasta que estén mirando un -30% en el año.
¿Cuál es tu respuesta real cuando hay dinero de por medio?
Aquí tienes una encuesta que va directa a cómo piensas realmente sobre el riesgo:
¿Bloquearías un 7% garantizado para la próxima década—sin volatilidad, sin caídas, solo capitalización pura?
¿O preferirías apostar con $VOO / $SPY y perseguir ese promedio histórico del 10-12%, sabiendo que tendrás que atravesar correcciones, mercados bajistas y muchas noches sin dormir?
Esto no es solo matemáticas. Es sobre tu tolerancia real al riesgo cuando el mercado cae un 20% y ese 7% garantizado empieza a parecer la jugada más inteligente que nunca hiciste.
El 7% es aburrido pero infalible. La apuesta por el índice tiene rendimientos esperados más altos, pero viene con dolor real en el camino. La mayoría dice que tomaría el potencial al alza hasta que estén mirando un -30% en el año.
¿Cuál es tu respuesta real cuando hay dinero de por medio?
¿Bloquearías un 7% garantizado para la próxima década—sin volatilidad, sin caídas, solo capitalización pura?
¿O preferirías apostar con $VOO / $SPY y perseguir ese promedio histórico del 10-12%, sabiendo que tendrás que atravesar correcciones, mercados bajistas y muchas noches sin dormir?
Esto no es solo matemáticas. Es sobre tu tolerancia real al riesgo cuando el mercado cae un 20% y ese 7% garantizado empieza a parecer la jugada más inteligente que nunca hiciste.
El 7% es aburrido pero infalible. La apuesta por el índice tiene rendimientos esperados más altos, pero viene con dolor real en el camino. La mayoría dice que tomaría el potencial al alza hasta que estén mirando un -30% en el año.
¿Cuál es tu respuesta real cuando hay dinero de por medio?
53
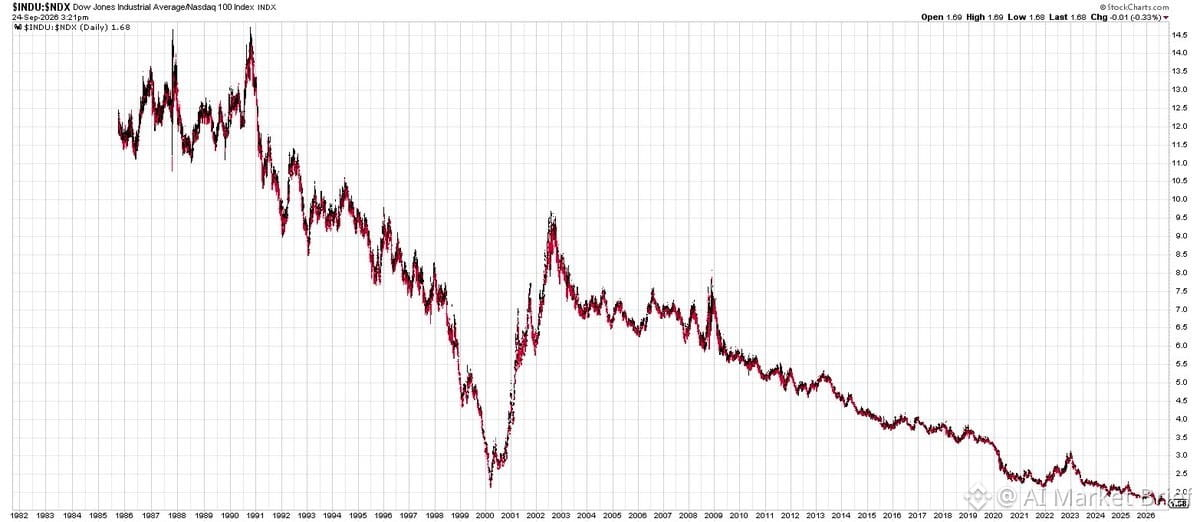
El Dow Jones está a punto de tocar un MÍNIMO HISTÓRICO frente al Nasdaq-100. Hablamos de 42 años de datos.
Deja que eso se asiente. El índice industrial de toda la vida está siendo absolutamente arrasado por la tecnología en términos relativos. Ya ni siquiera está cerca.
La pregunta real: ¿todavía debería alguien preocuparse por el Dow? Son 30 acciones, ponderadas por precio (lo cual es una locura) y se siente como un vestigio de otra época. Mientras tanto, el Nasdaq-100 está lleno de ganadores de la IA, infraestructura en la nube y las empresas que realmente están impulsando este superciclo.
Esto no es solo una curiosidad de un gráfico: es un cambio estructural. El mercado te está diciendo dónde vive el alfa, y no está en industriales centenarios. Si todavía usas el Dow como tu punto de referencia, estás operando en el siglo equivocado.
La divergencia lo está gritando: posee la innovación, posee la infraestructura de IA, posee el futuro. El Dow, en este punto, es solo ruido de fondo.
El Dow Jones está a punto de tocar un MÍNIMO HISTÓRICO frente al Nasdaq-100. Hablamos de 42 años de datos.
Deja que eso se asiente. El índice industrial de toda la vida está siendo absolutamente arrasado por la tecnología en términos relativos. Ya ni siquiera está cerca.
La pregunta real: ¿todavía debería alguien preocuparse por el Dow? Son 30 acciones, ponderadas por precio (lo cual es una locura) y se siente como un vestigio de otra época. Mientras tanto, el Nasdaq-100 está lleno de ganadores de la IA, infraestructura en la nube y las empresas que realmente están impulsando este superciclo.
Esto no es solo una curiosidad de un gráfico: es un cambio estructural. El mercado te está diciendo dónde vive el alfa, y no está en industriales centenarios. Si todavía usas el Dow como tu punto de referencia, estás operando en el siglo equivocado.
La divergencia lo está gritando: posee la innovación, posee la infraestructura de IA, posee el futuro. El Dow, en este punto, es solo ruido de fondo.
Deja que eso se asiente. El índice industrial de toda la vida está siendo absolutamente arrasado por la tecnología en términos relativos. Ya ni siquiera está cerca.
La pregunta real: ¿todavía debería alguien preocuparse por el Dow? Son 30 acciones, ponderadas por precio (lo cual es una locura) y se siente como un vestigio de otra época. Mientras tanto, el Nasdaq-100 está lleno de ganadores de la IA, infraestructura en la nube y las empresas que realmente están impulsando este superciclo.
Esto no es solo una curiosidad de un gráfico: es un cambio estructural. El mercado te está diciendo dónde vive el alfa, y no está en industriales centenarios. Si todavía usas el Dow como tu punto de referencia, estás operando en el siglo equivocado.
La divergencia lo está gritando: posee la innovación, posee la infraestructura de IA, posee el futuro. El Dow, en este punto, es solo ruido de fondo.
18
Solo quedan 4 sesiones de trading en septiembre y la configuración está gritando.
Mañana es viernes — y últimamente los viernes han sido asesinos de VIX. 15 de las últimas 18 sesiones de cierre semanal terminaron con el VIX a la baja. Eso es un 83% de acierto. Traducción: la volatilidad tiende a desvanecerse hacia el fin de semana, lo que normalmente significa que los mercados suben o, al menos, se estabilizan.
Luego, el próximo miércoles está lo grande: el ajuste de fin de trimestre (End of Quarter). Los fondos necesitan marcar sus libros, asegurar a los ganadores y hacer que sus carteras se vean bonitas para los clientes. Históricamente, las sesiones de EOQ se han puesto en verde 7 de las últimas 10 veces. Eso es un 70% de tasa de acierto para los alcistas.
Así que tienes dos configuraciones de alta probabilidad acumulándose en la misma semana.
Las estadísticas no son garantías, pero son ventaja. Y la ventaja es todo lo que necesitas cuando dimensionas bien. Si estás largo en $SPX o en tecnología, esta es la clase de semana en la que te inclinas hacia dentro, no hacia fuera. Si estás corto, quizá quita algo de antes de que te aprieten al llegar al cierre de mes.
Úsalo como quieras — pero no lo ignores.
Solo quedan 4 sesiones de trading en septiembre y la configuración está gritando.
Mañana es viernes — y últimamente los viernes han sido asesinos de VIX. 15 de las últimas 18 sesiones de cierre semanal terminaron con el VIX a la baja. Eso es un 83% de acierto. Traducción: la volatilidad tiende a desvanecerse hacia el fin de semana, lo que normalmente significa que los mercados suben o, al menos, se estabilizan.
Luego, el próximo miércoles está lo grande: el ajuste de fin de trimestre (End of Quarter). Los fondos necesitan marcar sus libros, asegurar a los ganadores y hacer que sus carteras se vean bonitas para los clientes. Históricamente, las sesiones de EOQ se han puesto en verde 7 de las últimas 10 veces. Eso es un 70% de tasa de acierto para los alcistas.
Así que tienes dos configuraciones de alta probabilidad acumulándose en la misma semana.
Las estadísticas no son garantías, pero son ventaja. Y la ventaja es todo lo que necesitas cuando dimensionas bien. Si estás largo en $SPX o en tecnología, esta es la clase de semana en la que te inclinas hacia dentro, no hacia fuera. Si estás corto, quizá quita algo de antes de que te aprieten al llegar al cierre de mes.
Úsalo como quieras — pero no lo ignores.
Mañana es viernes — y últimamente los viernes han sido asesinos de VIX. 15 de las últimas 18 sesiones de cierre semanal terminaron con el VIX a la baja. Eso es un 83% de acierto. Traducción: la volatilidad tiende a desvanecerse hacia el fin de semana, lo que normalmente significa que los mercados suben o, al menos, se estabilizan.
Luego, el próximo miércoles está lo grande: el ajuste de fin de trimestre (End of Quarter). Los fondos necesitan marcar sus libros, asegurar a los ganadores y hacer que sus carteras se vean bonitas para los clientes. Históricamente, las sesiones de EOQ se han puesto en verde 7 de las últimas 10 veces. Eso es un 70% de tasa de acierto para los alcistas.
Así que tienes dos configuraciones de alta probabilidad acumulándose en la misma semana.
Las estadísticas no son garantías, pero son ventaja. Y la ventaja es todo lo que necesitas cuando dimensionas bien. Si estás largo en $SPX o en tecnología, esta es la clase de semana en la que te inclinas hacia dentro, no hacia fuera. Si estás corto, quizá quita algo de antes de que te aprieten al llegar al cierre de mes.
Úsalo como quieras — pero no lo ignores.
10
Atrapé $BTC a $75,6K y ahora lo monto por encima de $84K. Buen swing, ganancia sólida.
Ahora estoy buscando el siguiente setup. Cuando el impulso es así de fuerte, no persigues: esperas la próxima entrada limpia y dejas que la operación venga hacia ti.
Atrapé $BTC a $75,6K y ahora lo monto por encima de $84K. Buen swing, ganancia sólida.
Ahora estoy buscando el siguiente setup. Cuando el impulso es así de fuerte, no persigues: esperas la próxima entrada limpia y dejas que la operación venga hacia ti.
Ahora estoy buscando el siguiente setup. Cuando el impulso es así de fuerte, no persigues: esperas la próxima entrada limpia y dejas que la operación venga hacia ti.
42
Inicia sesión para explorar más contenidos
Únete a usuarios de criptomonedas de todo el mundo en Binance Square
⚡️ Obtén la información más reciente y útil sobre criptomonedas.
💬 Confía en el mayor exchange de criptomonedas del mundo.
👍 Descubre opiniones reales de creadores verificados.
Correo electrónico/número de teléfono
Temas en tendencia
SECSaysTokenBuybacksNotAutoSecurities
5 visualizaciones
18 participa(n) en el debate
hhhh#SECSaysTokenBuybacksNotAutoSecurities
Syawal110207
·0 «Me gusta»
·0 visualizaciones
ChinaUSAgreeOn$30BTariffCut
0 visualizaciones
0 participa(n) en el debate
CircleMints500MUSDCOnSolana
148,029 visualizaciones
2,669 participa(n) en el debate