

AlienOvichO 1
179 Publicaciones

AlienOvichO 1
Denunciar
Bloquear usuario
Helping traders decode market waves at Elliott Wave Forecast.
All insights are educational and reflect my personal take on price action.
0 Siguiendo
6 Seguidores
26 Me gusta
Publicaciones
$FARTCOIN – Encontrar Compradores y Buscar Más Potencial
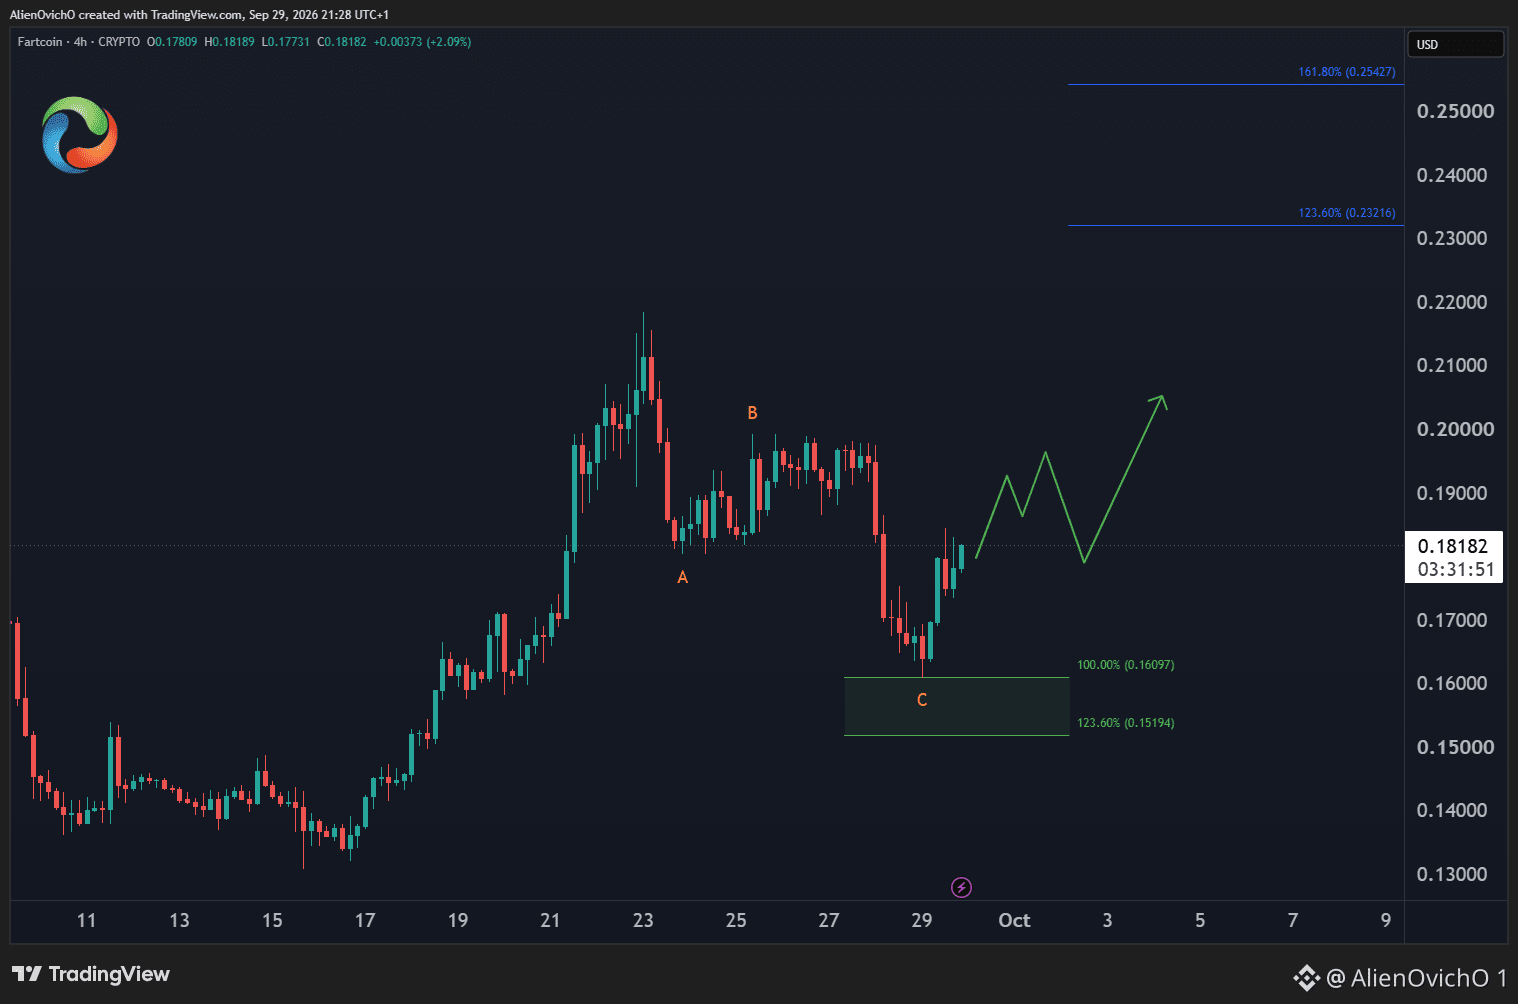
El precio completó un retroceso correctivo clásico de 3 ondas en forma de Zigzag, entrando en la zona de compra en $0.16 – $0.16, y luego reaccionó más al alza desde ahí.
Mientras el precio se mantenga por encima del último mínimo reciente, estará buscando otro impulso hacia arriba.
Los alcistas pueden apuntar al objetivo en $0.23 – $0.25 antes de que tenga lugar el próximo retroceso.
¿La subida continuará durante el resto de la semana, o solo es un rebote a corto plazo?
#Crypto #Trading #ElliottWave
$FARTCOIN – Encontrar Compradores y Buscar Más Potencial
El precio completó un retroceso correctivo clásico de 3 ondas en forma de Zigzag, entrando en la zona de compra en $0.16 – $0.16, y luego reaccionó más al alza desde ahí.
Mientras el precio se mantenga por encima del último mínimo reciente, estará buscando otro impulso hacia arriba.
Los alcistas pueden apuntar al objetivo en $0.23 – $0.25 antes de que tenga lugar el próximo retroceso.
¿La subida continuará durante el resto de la semana, o solo es un rebote a corto plazo?
#Crypto #Trading #ElliottWave
El precio completó un retroceso correctivo clásico de 3 ondas en forma de Zigzag, entrando en la zona de compra en $0.16 – $0.16, y luego reaccionó más al alza desde ahí.
Mientras el precio se mantenga por encima del último mínimo reciente, estará buscando otro impulso hacia arriba.
Los alcistas pueden apuntar al objetivo en $0.23 – $0.25 antes de que tenga lugar el próximo retroceso.
¿La subida continuará durante el resto de la semana, o solo es un rebote a corto plazo?
#Crypto #Trading #ElliottWave
88
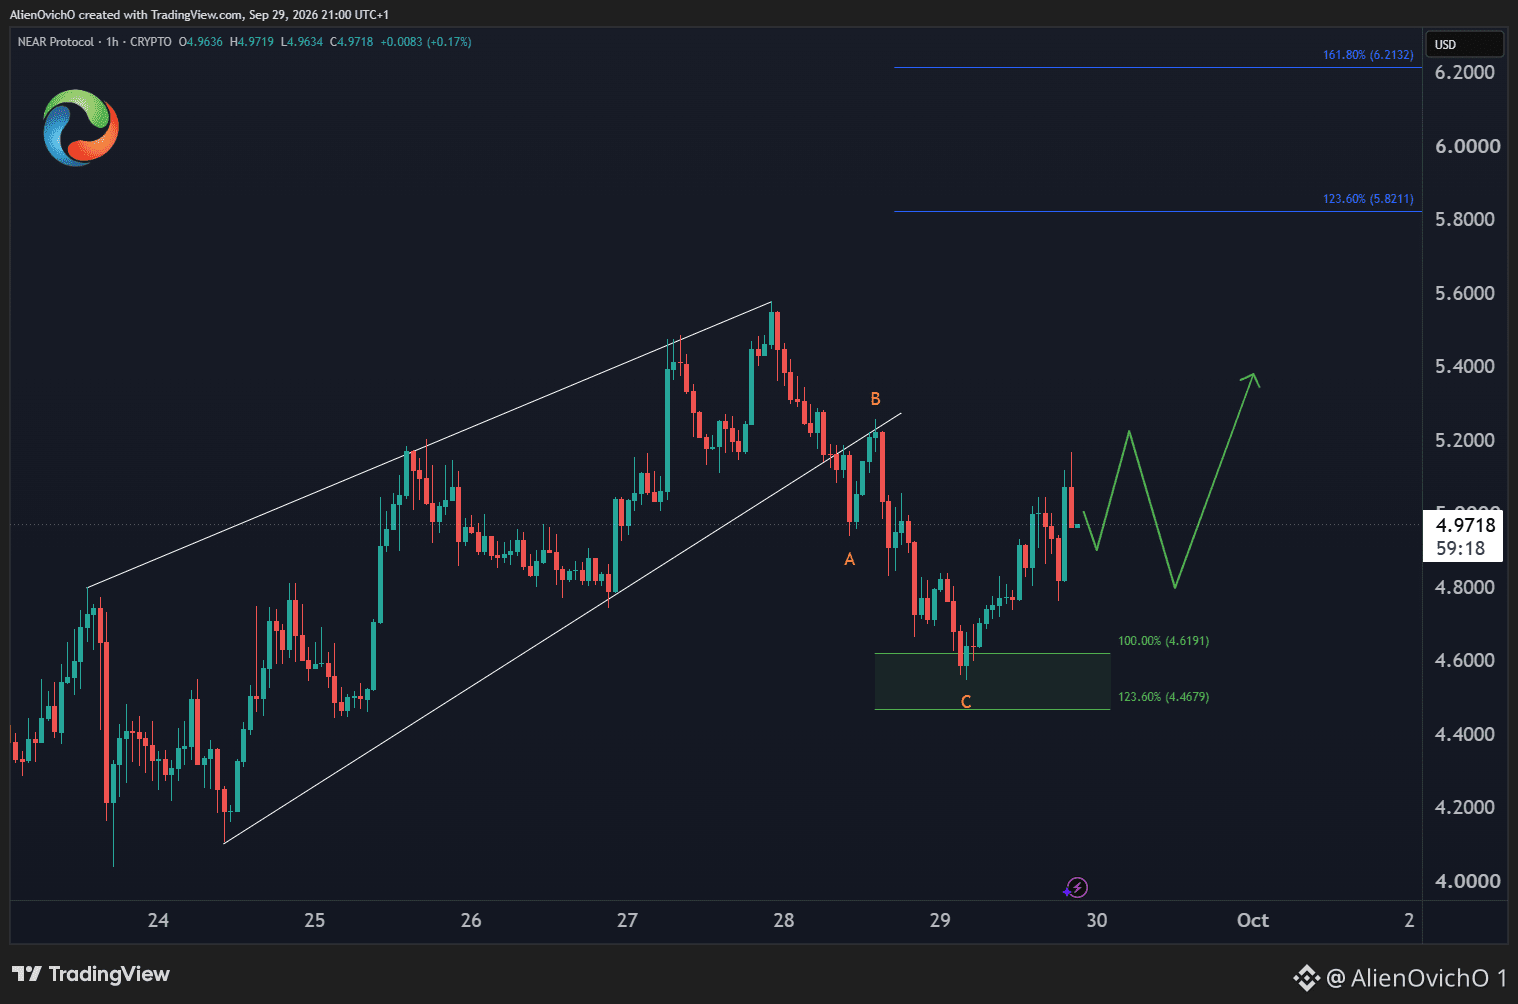
$NEAR – Completó un retroceso de 3 Ondas hacia el Área de Compra en $4.60 – $4.40
El precio está reaccionando más alto desde ahí.
Mientras el precio se mantenga por encima del mínimo de hoy en $4.50, puede buscar un impulso hacia nuevos máximos.
Un movimiento al alza apuntará al área objetivo en $5.80 – $6.20 antes de que ocurra otro retroceso.
Si se rompe el mínimo de hoy, una doble corrección podría llevar el precio más abajo hacia $4.10.
¿Los compradores mantendrán los mínimos esta semana o hay una corrección mayor en el horizonte?
#Crypto #Trading #ElliottWave
$NEAR – Completó un retroceso de 3 Ondas hacia el Área de Compra en $4.60 – $4.40
El precio está reaccionando más alto desde ahí.
Mientras el precio se mantenga por encima del mínimo de hoy en $4.50, puede buscar un impulso hacia nuevos máximos.
Un movimiento al alza apuntará al área objetivo en $5.80 – $6.20 antes de que ocurra otro retroceso.
Si se rompe el mínimo de hoy, una doble corrección podría llevar el precio más abajo hacia $4.10.
¿Los compradores mantendrán los mínimos esta semana o hay una corrección mayor en el horizonte?
#Crypto #Trading #ElliottWave
El precio está reaccionando más alto desde ahí.
Mientras el precio se mantenga por encima del mínimo de hoy en $4.50, puede buscar un impulso hacia nuevos máximos.
Un movimiento al alza apuntará al área objetivo en $5.80 – $6.20 antes de que ocurra otro retroceso.
Si se rompe el mínimo de hoy, una doble corrección podría llevar el precio más abajo hacia $4.10.
¿Los compradores mantendrán los mínimos esta semana o hay una corrección mayor en el horizonte?
#Crypto #Trading #ElliottWave
86
Ver traducción
📉 #Hyperliquid $HYPE – Potential Bullish Setup for Next Week
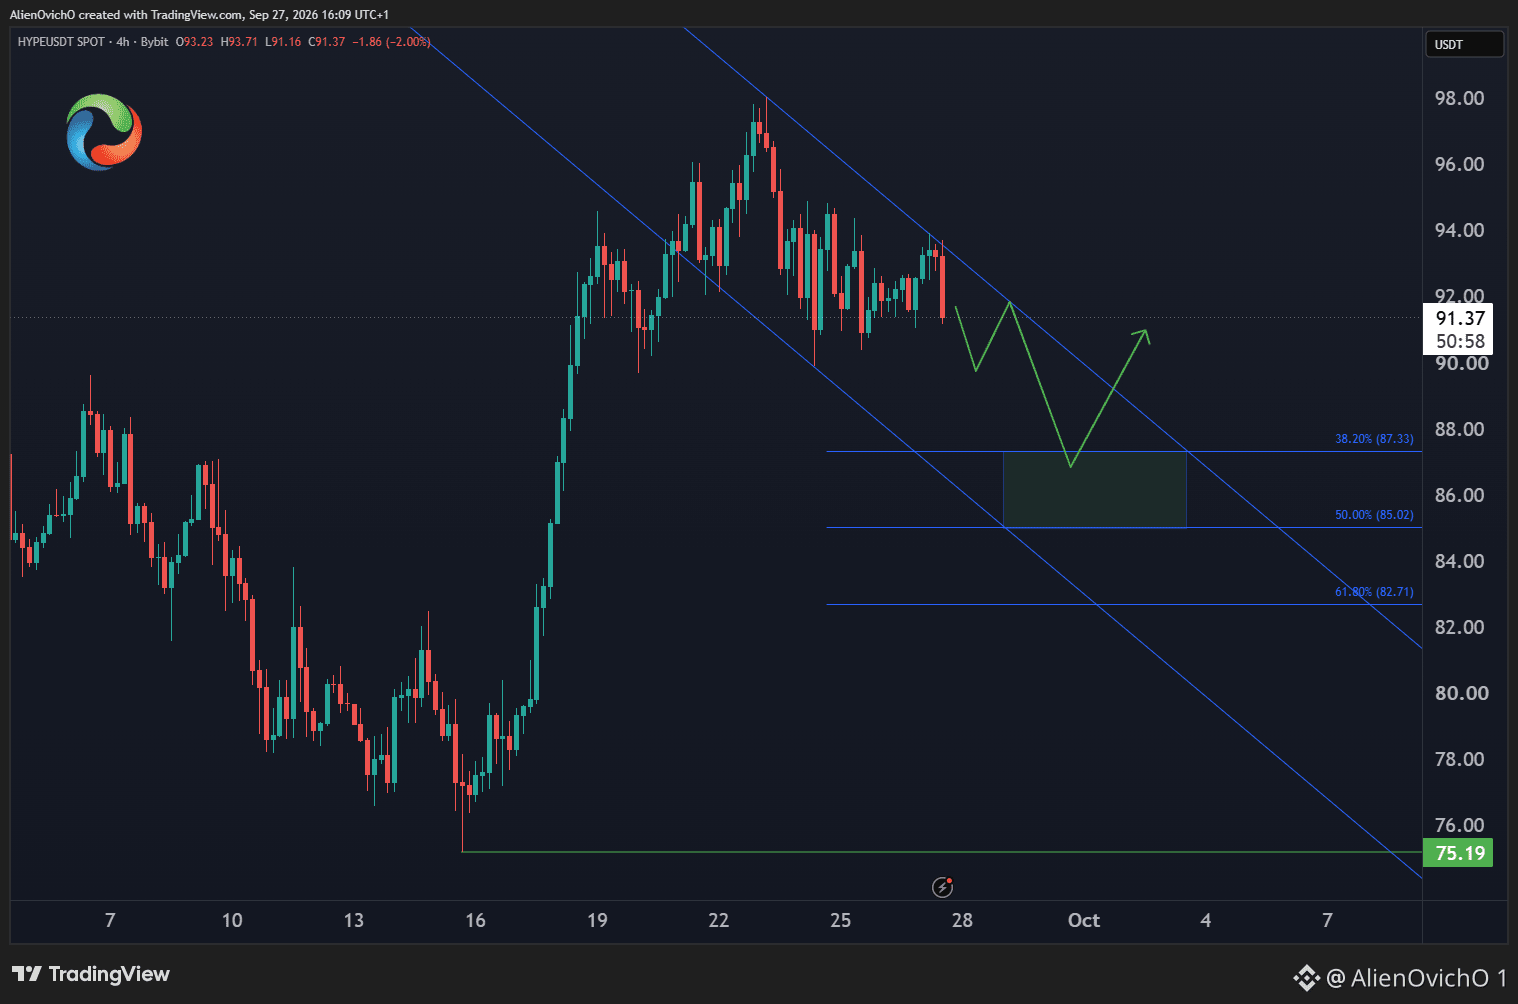
Price traded into new all-time highs last week, then ended the cycle from the September 15 low and started a corrective pullback.
The correction is expected to remain supported above $75.19, and buyers are likely to step in within the support area.
The decline within a channel could reach the 38.2% – 50% Fibonacci retracement area at $87 – $85, followed by a reaction higher from there.
Will bulls defend the previous low and manage to create a new higher-low base to resume the rally?
#Crypto #Trading #ElliottWave
📉 #Hyperliquid $HYPE – Potential Bullish Setup for Next Week
Price traded into new all-time highs last week, then ended the cycle from the September 15 low and started a corrective pullback.
The correction is expected to remain supported above $75.19, and buyers are likely to step in within the support area.
The decline within a channel could reach the 38.2% – 50% Fibonacci retracement area at $87 – $85, followed by a reaction higher from there.
Will bulls defend the previous low and manage to create a new higher-low base to resume the rally?
#Crypto #Trading #ElliottWave
Price traded into new all-time highs last week, then ended the cycle from the September 15 low and started a corrective pullback.
The correction is expected to remain supported above $75.19, and buyers are likely to step in within the support area.
The decline within a channel could reach the 38.2% – 50% Fibonacci retracement area at $87 – $85, followed by a reaction higher from there.
Will bulls defend the previous low and manage to create a new higher-low base to resume the rally?
#Crypto #Trading #ElliottWave
77
#Júpiter $JUP – Configuración alcista a corto plazo clásica que conduce a una ruptura hacia nuevos máximos
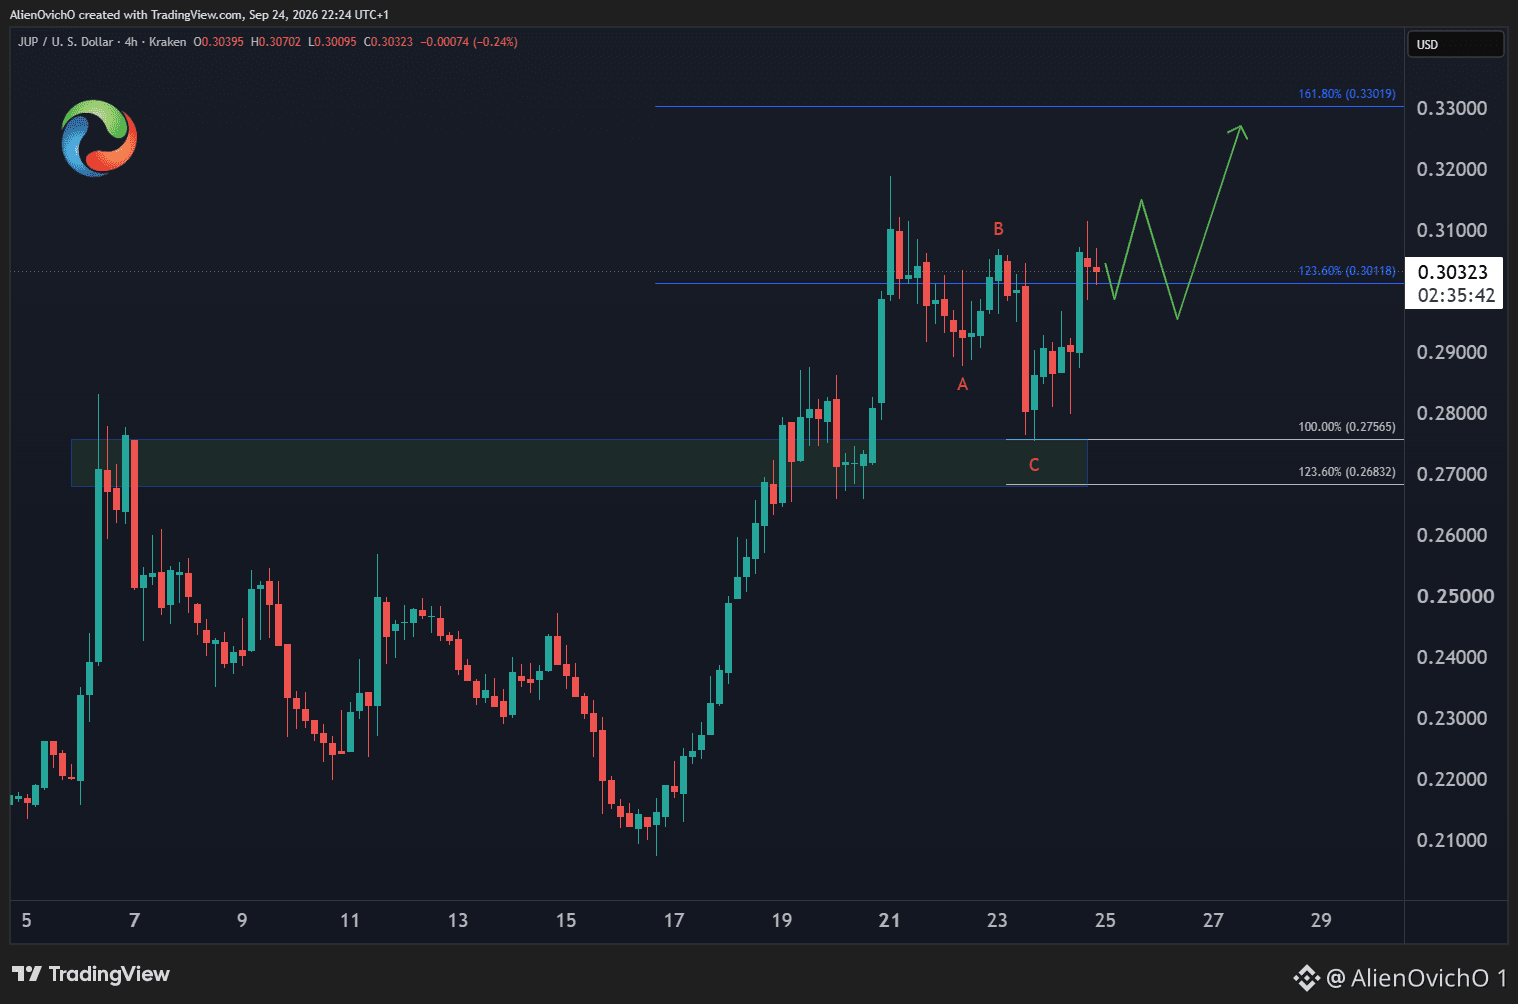
El precio completó un retroceso de 3 ondas (ABC) dentro de la zona de compra de $0.27 – $0.26, que coincide con los máximos previos de principios de septiembre que luego se convirtieron en soporte después de la ruptura.
Mientras se mantenga por encima de $0.27, se espera un mayor movimiento al alza hacia el área objetivo en $0.33.
Esa zona podría generar otro retroceso, que podría convertirse en una corrección más profunda a menos que los alcistas mantengan los niveles y empujen más arriba de nuevo el próximo mes.
#Crypto #Trading #ElliottWave
#Júpiter $JUP – Configuración alcista a corto plazo clásica que conduce a una ruptura hacia nuevos máximos
El precio completó un retroceso de 3 ondas (ABC) dentro de la zona de compra de $0.27 – $0.26, que coincide con los máximos previos de principios de septiembre que luego se convirtieron en soporte después de la ruptura.
Mientras se mantenga por encima de $0.27, se espera un mayor movimiento al alza hacia el área objetivo en $0.33.
Esa zona podría generar otro retroceso, que podría convertirse en una corrección más profunda a menos que los alcistas mantengan los niveles y empujen más arriba de nuevo el próximo mes.
#Crypto #Trading #ElliottWave
El precio completó un retroceso de 3 ondas (ABC) dentro de la zona de compra de $0.27 – $0.26, que coincide con los máximos previos de principios de septiembre que luego se convirtieron en soporte después de la ruptura.
Mientras se mantenga por encima de $0.27, se espera un mayor movimiento al alza hacia el área objetivo en $0.33.
Esa zona podría generar otro retroceso, que podría convertirse en una corrección más profunda a menos que los alcistas mantengan los niveles y empujen más arriba de nuevo el próximo mes.
#Crypto #Trading #ElliottWave
82
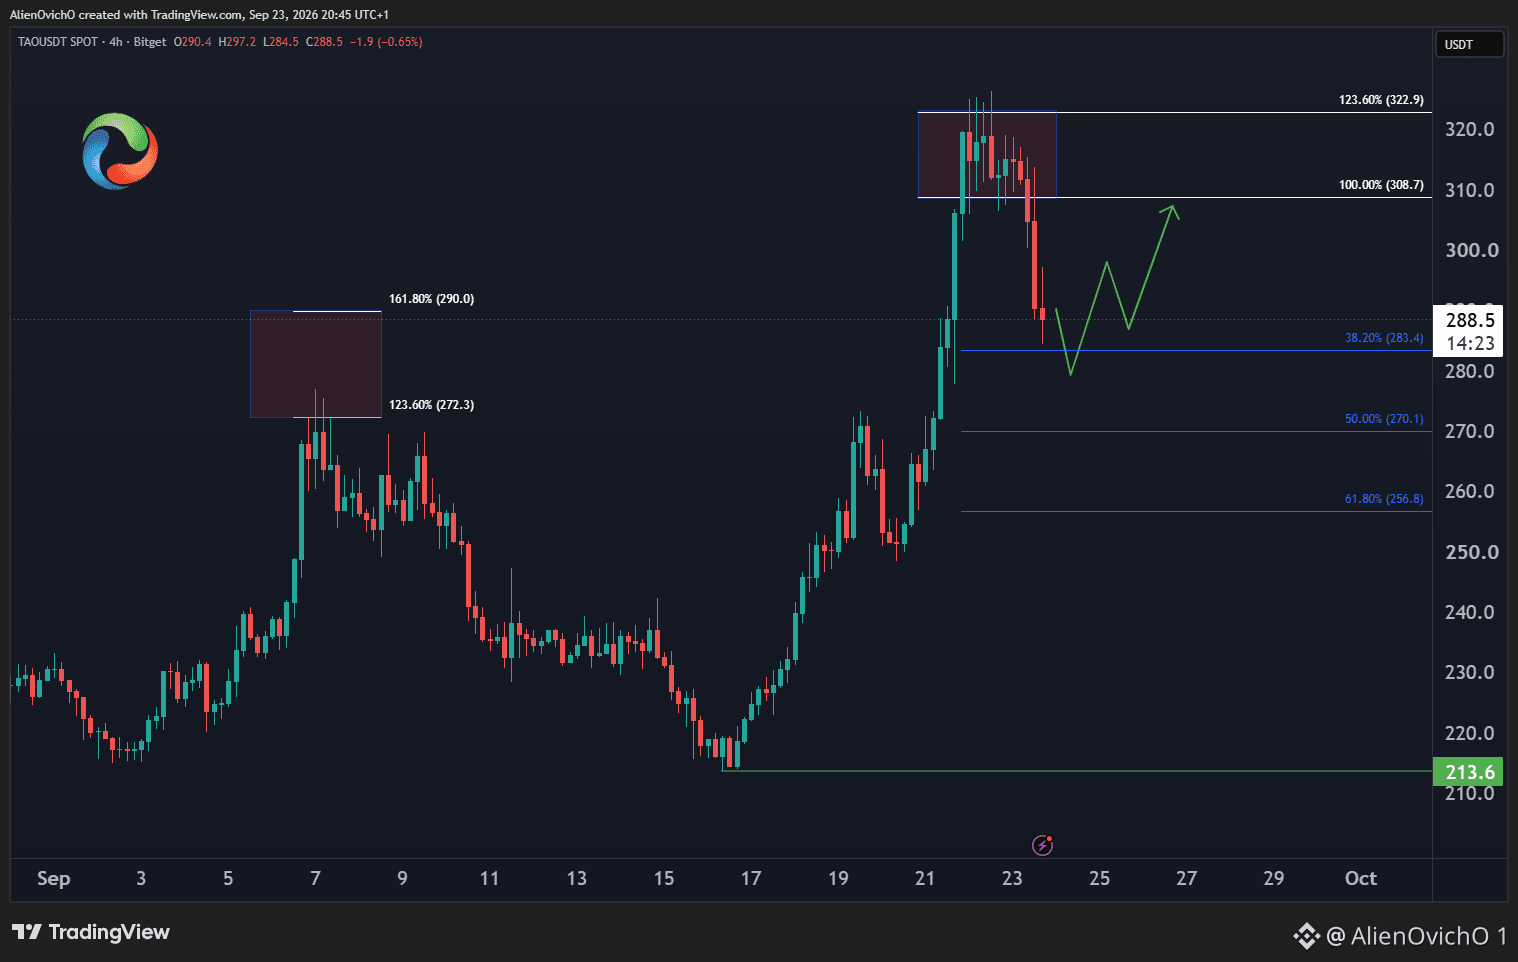
#Bittensor $TAO No Está Listo para Romper por Encima del Máximo de 2026 en $377
El precio alcanzó la zona objetivo de $308 – $322, desde donde fue rechazado y comenzó un retroceso para corregir la reciente subida.
La corrección está llegando al área del retroceso de Fibonacci del 38% en $283, desde donde se producirá una reacción al alza en los próximos días.
Si el rebote falla por debajo del máximo reciente, abrirá la puerta a otra corrección más abajo hacia $270 – $256.
#Crypto #Trading #ElliottWave
#Bittensor $TAO No Está Listo para Romper por Encima del Máximo de 2026 en $377
El precio alcanzó la zona objetivo de $308 – $322, desde donde fue rechazado y comenzó un retroceso para corregir la reciente subida.
La corrección está llegando al área del retroceso de Fibonacci del 38% en $283, desde donde se producirá una reacción al alza en los próximos días.
Si el rebote falla por debajo del máximo reciente, abrirá la puerta a otra corrección más abajo hacia $270 – $256.
#Crypto #Trading #ElliottWave
El precio alcanzó la zona objetivo de $308 – $322, desde donde fue rechazado y comenzó un retroceso para corregir la reciente subida.
La corrección está llegando al área del retroceso de Fibonacci del 38% en $283, desde donde se producirá una reacción al alza en los próximos días.
Si el rebote falla por debajo del máximo reciente, abrirá la puerta a otra corrección más abajo hacia $270 – $256.
#Crypto #Trading #ElliottWave
65
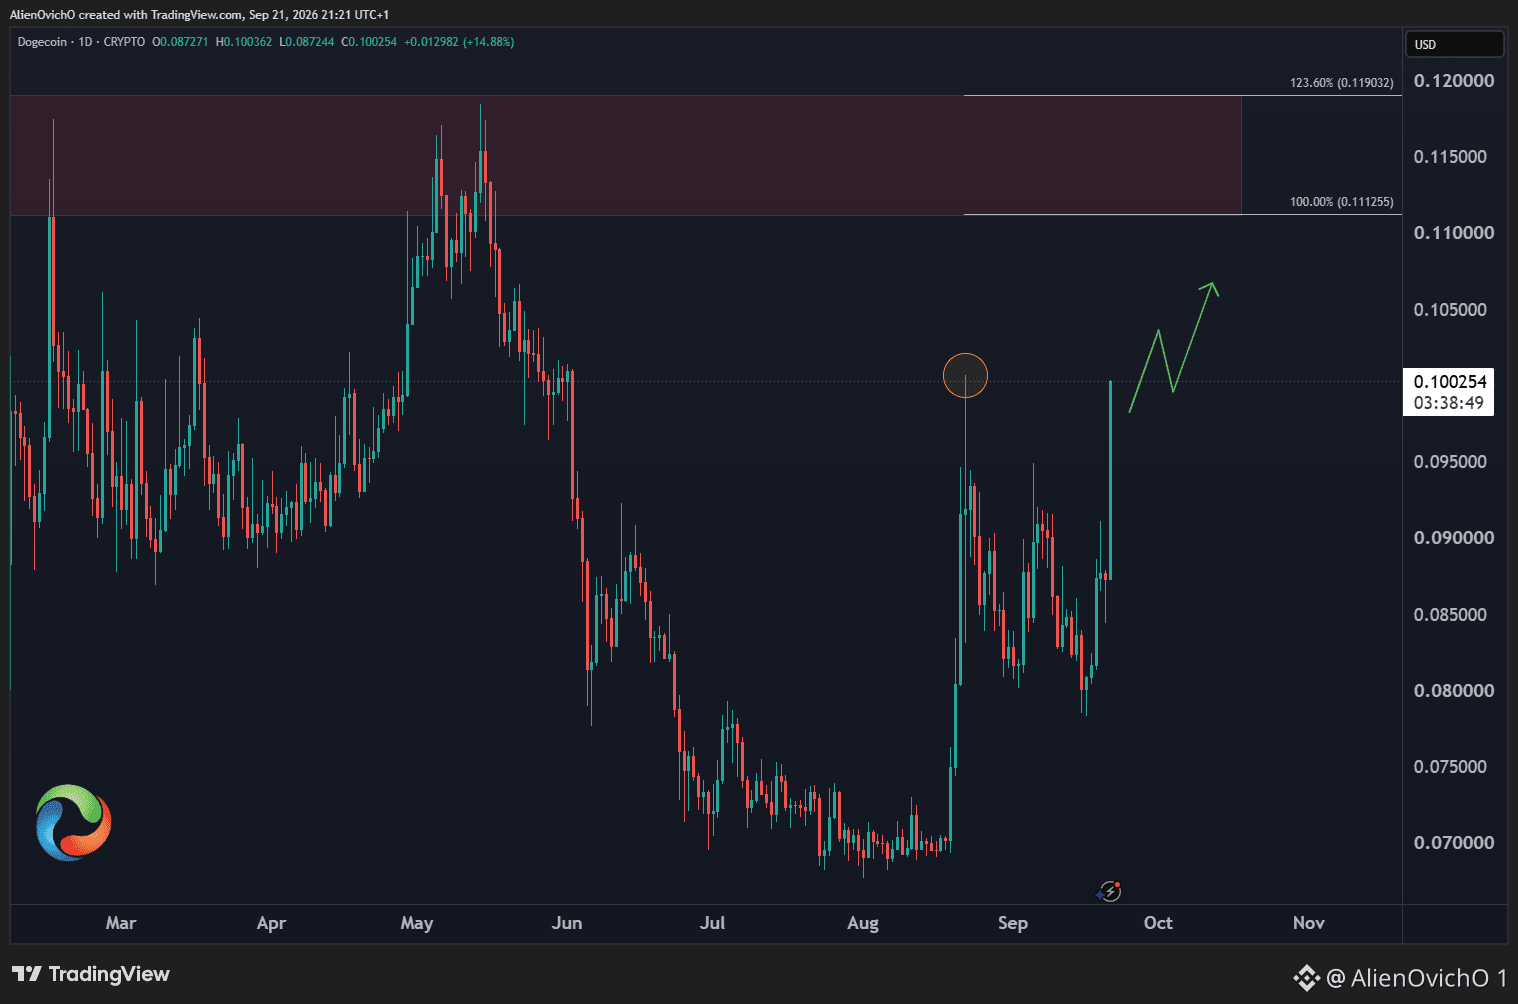
📈 #Dogecoin $DOGE – Extensión al alza en curso
El precio está rompiendo por encima del máximo de agosto y abriendo más potencial alcista dentro del ciclo diario actual.
El impulso alcista buscará un retesteo de los máximos de principios de 2026 alrededor de $0.119.
Las correcciones a corto plazo seguirán teniendo soporte por encima del reciente mínimo de septiembre, ya que los alcistas seguirán empujando el precio más arriba.
¿El rally de $DOGE desencadenará otra temporada de #memecoin ?
#Cripto #Trading #ElliottWave
📈 #Dogecoin $DOGE – Extensión al alza en curso
El precio está rompiendo por encima del máximo de agosto y abriendo más potencial alcista dentro del ciclo diario actual.
El impulso alcista buscará un retesteo de los máximos de principios de 2026 alrededor de $0.119.
Las correcciones a corto plazo seguirán teniendo soporte por encima del reciente mínimo de septiembre, ya que los alcistas seguirán empujando el precio más arriba.
¿El rally de $DOGE desencadenará otra temporada de #memecoin ?
#Cripto #Trading #ElliottWave
El precio está rompiendo por encima del máximo de agosto y abriendo más potencial alcista dentro del ciclo diario actual.
El impulso alcista buscará un retesteo de los máximos de principios de 2026 alrededor de $0.119.
Las correcciones a corto plazo seguirán teniendo soporte por encima del reciente mínimo de septiembre, ya que los alcistas seguirán empujando el precio más arriba.
¿El rally de $DOGE desencadenará otra temporada de #memecoin ?
#Cripto #Trading #ElliottWave
72
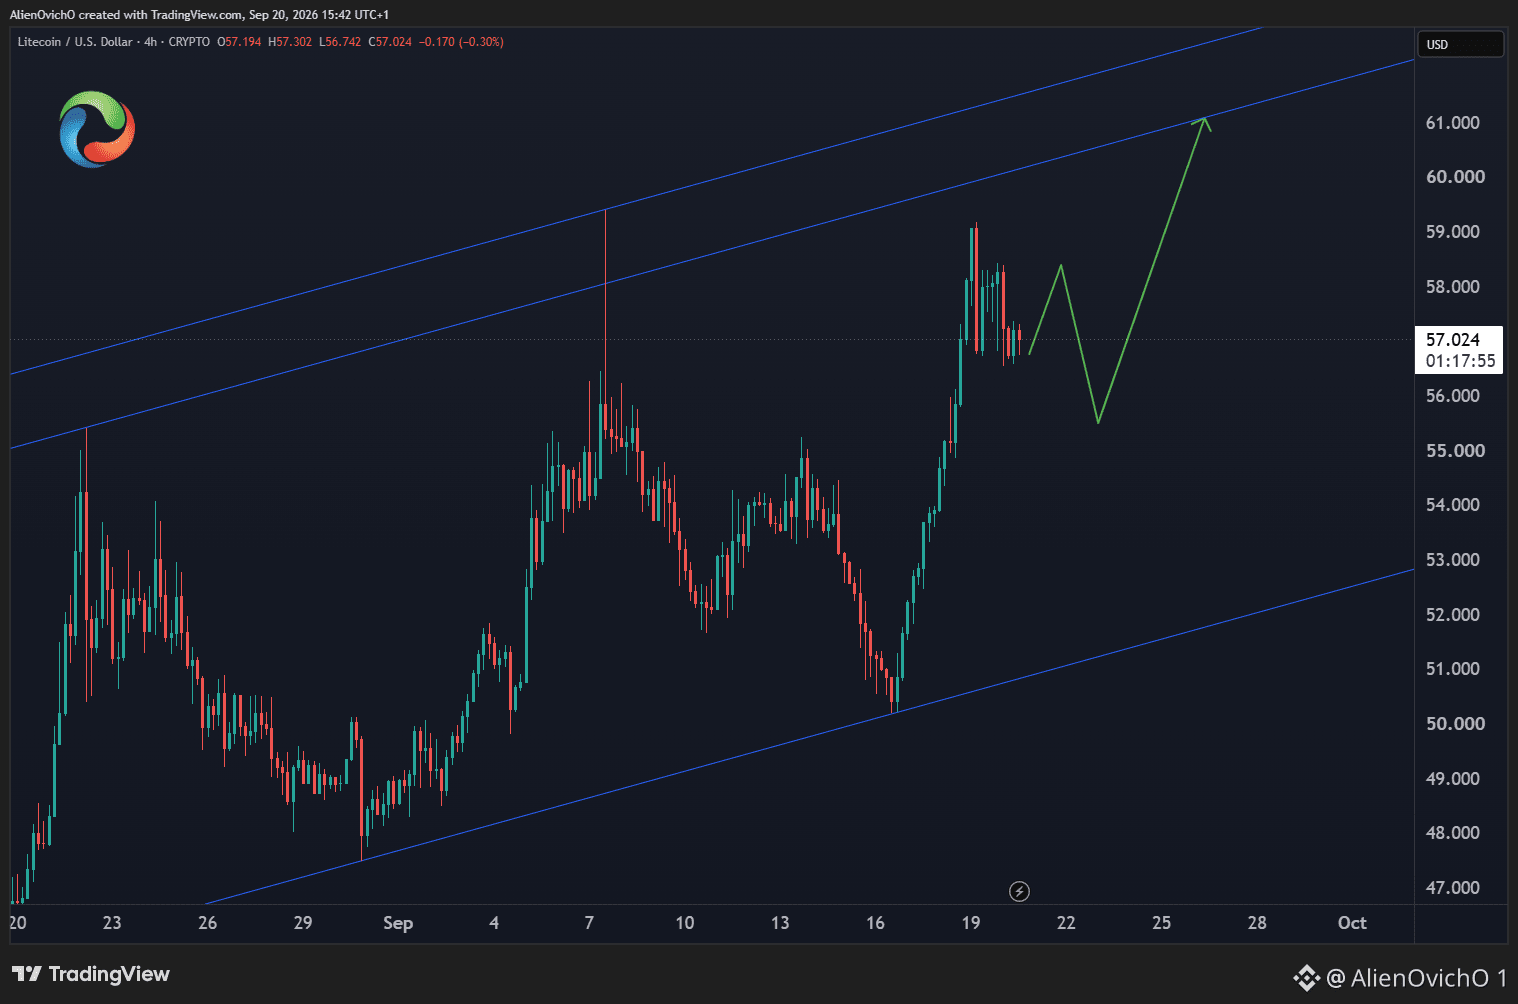
📈 #Litecoin $LTC – Buscando más potencial al alza
El precio se mantiene respaldado dentro de un canal alcista y buscará romper por encima del máximo de septiembre.
Actualmente, podría ocurrir un retroceso a corto plazo la próxima semana antes de reanudar la subida.
Un objetivo de alza para el próximo movimiento lo llevaría más alto hacia $61 – $62.
¿Qué tan profundo será el retroceso antes de repuntar hacia nuevos máximos?
#Crypto #Trading #ElliottWave
📈 #Litecoin $LTC – Buscando más potencial al alza
El precio se mantiene respaldado dentro de un canal alcista y buscará romper por encima del máximo de septiembre.
Actualmente, podría ocurrir un retroceso a corto plazo la próxima semana antes de reanudar la subida.
Un objetivo de alza para el próximo movimiento lo llevaría más alto hacia $61 – $62.
¿Qué tan profundo será el retroceso antes de repuntar hacia nuevos máximos?
#Crypto #Trading #ElliottWave
El precio se mantiene respaldado dentro de un canal alcista y buscará romper por encima del máximo de septiembre.
Actualmente, podría ocurrir un retroceso a corto plazo la próxima semana antes de reanudar la subida.
Un objetivo de alza para el próximo movimiento lo llevaría más alto hacia $61 – $62.
¿Qué tan profundo será el retroceso antes de repuntar hacia nuevos máximos?
#Crypto #Trading #ElliottWave
90
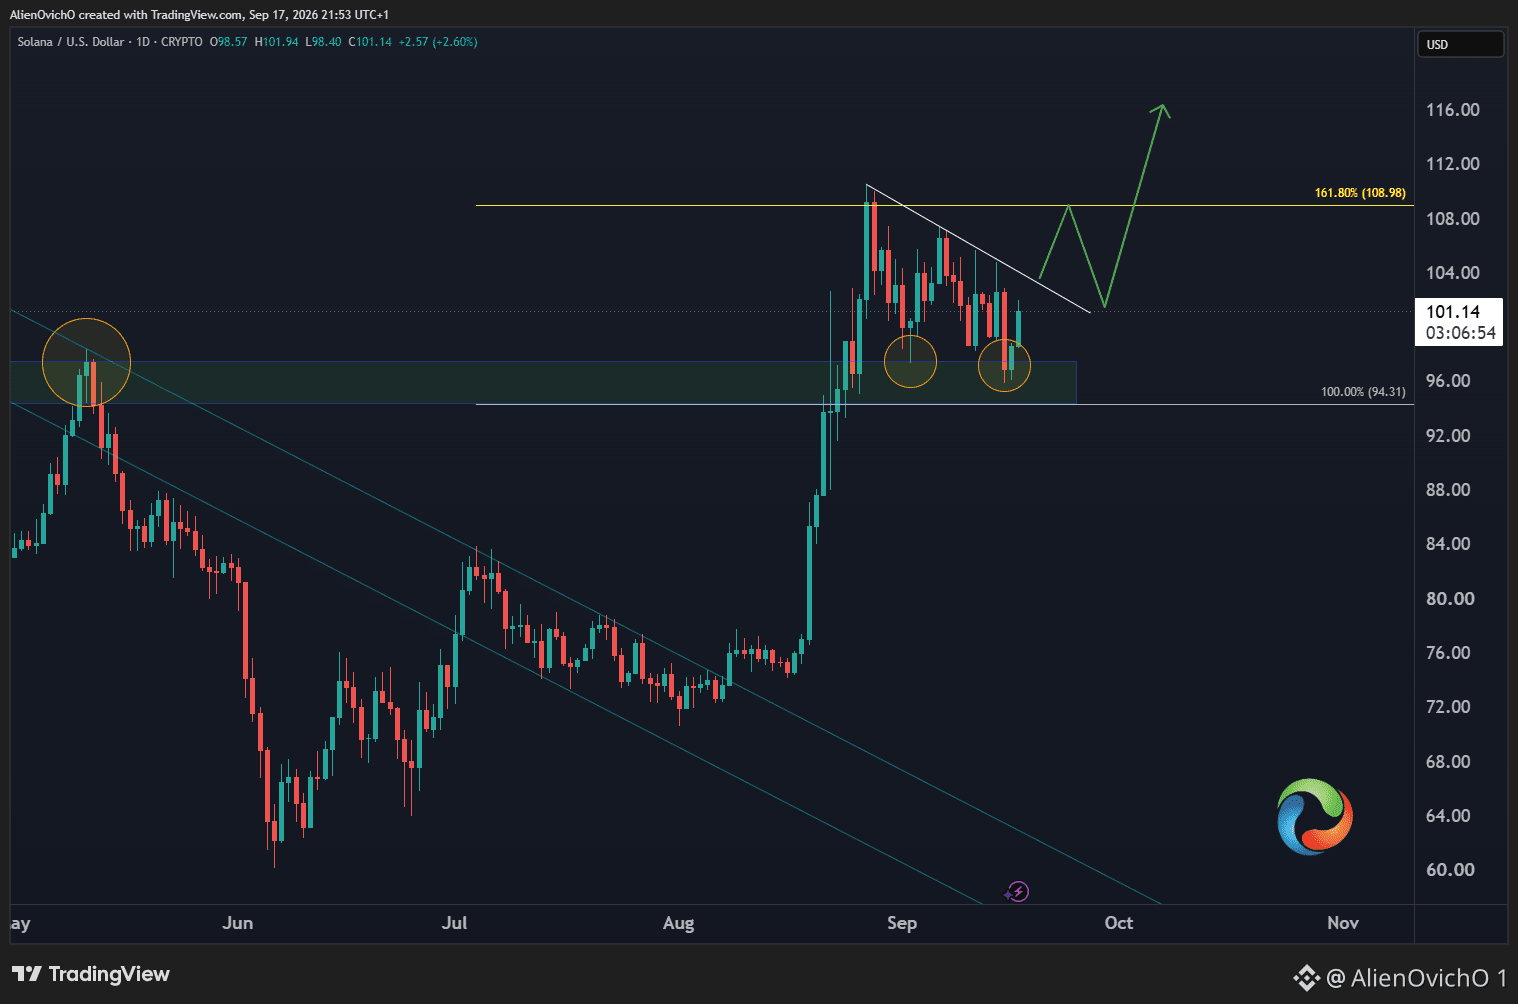
📊 #Solana $SOL – Todavía Manteniendo el Soporte
El precio aún está encontrando compradores dentro de la zona de soporte de $97 – $94 (picos de marzo y mayo) y está buscando una reacción más alta.
La acción de precio entrecortada a corto plazo todavía no está sugiriendo una ruptura; el precio necesita superar la línea de tendencia descendente para abrir el camino alcista.
Una vez que retome la tendencia alcista rompiendo por encima de $109, se abrirá la puerta para una extensión mayor hacia $120.
¿El soporte se mantendrá y los alcistas lograrán romper más alto la próxima semana?
#Crypto #Trading #ElliottWave
📊 #Solana $SOL – Todavía Manteniendo el Soporte
El precio aún está encontrando compradores dentro de la zona de soporte de $97 – $94 (picos de marzo y mayo) y está buscando una reacción más alta.
La acción de precio entrecortada a corto plazo todavía no está sugiriendo una ruptura; el precio necesita superar la línea de tendencia descendente para abrir el camino alcista.
Una vez que retome la tendencia alcista rompiendo por encima de $109, se abrirá la puerta para una extensión mayor hacia $120.
¿El soporte se mantendrá y los alcistas lograrán romper más alto la próxima semana?
#Crypto #Trading #ElliottWave
El precio aún está encontrando compradores dentro de la zona de soporte de $97 – $94 (picos de marzo y mayo) y está buscando una reacción más alta.
La acción de precio entrecortada a corto plazo todavía no está sugiriendo una ruptura; el precio necesita superar la línea de tendencia descendente para abrir el camino alcista.
Una vez que retome la tendencia alcista rompiendo por encima de $109, se abrirá la puerta para una extensión mayor hacia $120.
¿El soporte se mantendrá y los alcistas lograrán romper más alto la próxima semana?
#Crypto #Trading #ElliottWave
51
$BNB Buscando más potencial alcista
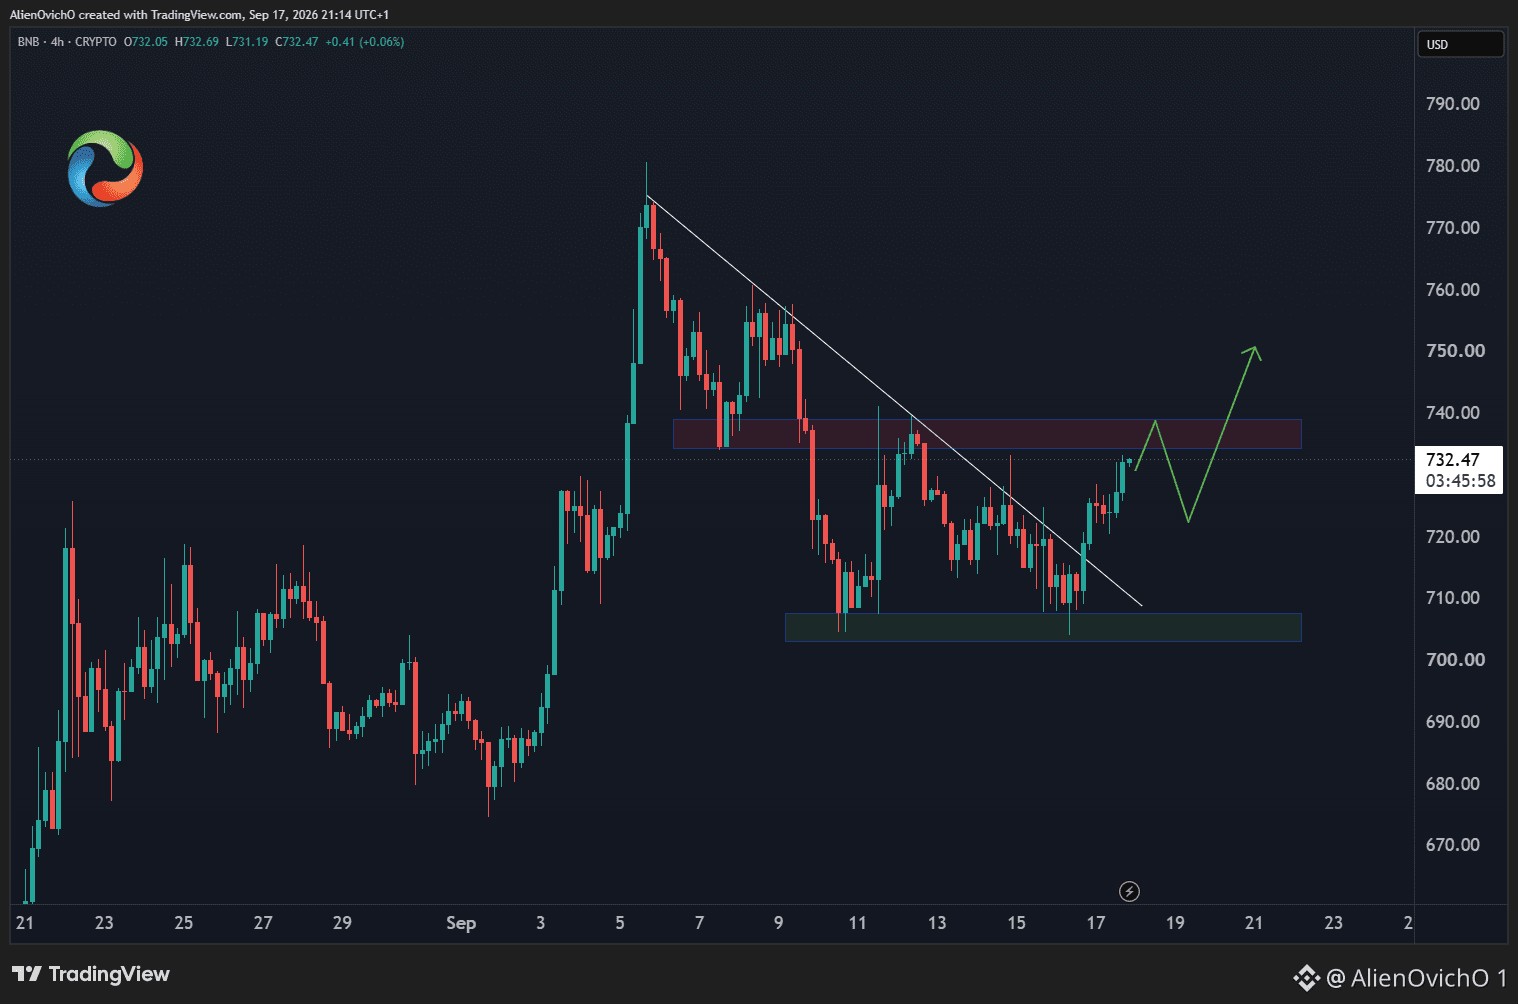
El precio estableció una base alrededor de la zona de soporte en $705 y reaccionó al alza desde ahí.
Actualmente está probando la resistencia a corto plazo alrededor de $735, y una ruptura por encima abrirá una extensión adicional al alza.
Si logra romper por encima del máximo de septiembre, el camino quedará despejado hacia $800.
¿Pueden los alcistas retomar el control y romper nuevos máximos antes de que termine el mes?
#Crypto #Trading #ElliottWave
$BNB Buscando más potencial alcista
El precio estableció una base alrededor de la zona de soporte en $705 y reaccionó al alza desde ahí.
Actualmente está probando la resistencia a corto plazo alrededor de $735, y una ruptura por encima abrirá una extensión adicional al alza.
Si logra romper por encima del máximo de septiembre, el camino quedará despejado hacia $800.
¿Pueden los alcistas retomar el control y romper nuevos máximos antes de que termine el mes?
#Crypto #Trading #ElliottWave
El precio estableció una base alrededor de la zona de soporte en $705 y reaccionó al alza desde ahí.
Actualmente está probando la resistencia a corto plazo alrededor de $735, y una ruptura por encima abrirá una extensión adicional al alza.
Si logra romper por encima del máximo de septiembre, el camino quedará despejado hacia $800.
¿Pueden los alcistas retomar el control y romper nuevos máximos antes de que termine el mes?
#Crypto #Trading #ElliottWave
73
🎯 #Zcash $ZEC Entra en la zona objetivo
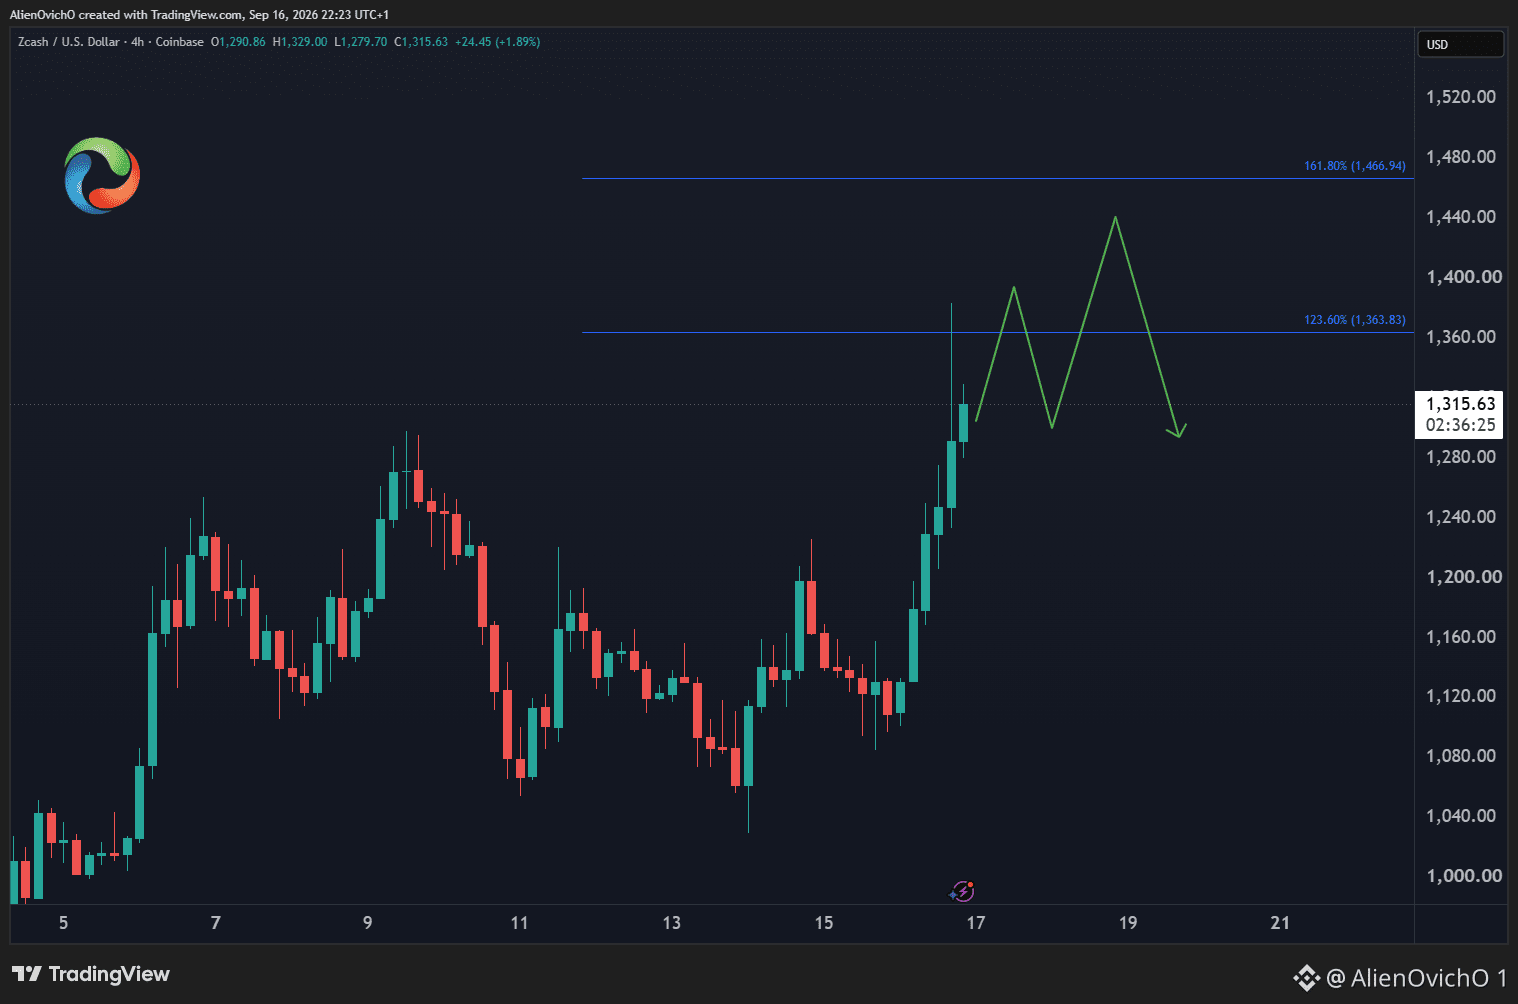
El precio terminó la corrección a corto plazo y reanudó la tendencia alcista, rompiendo hacia nuevos máximos históricos.
Actualmente muestra 3 ondas hacia nuevos máximos, con más alza aún esperada.
El precio está entrando en la zona objetivo en $1,363–$1,466 y se espera que complete un avance de 5 ondas antes de que ocurra el próximo retroceso.
¿Hasta qué nivel llegará ZEC antes del próximo retroceso?
#ElliottWave #Trading #Crypto
🎯 #Zcash $ZEC Entra en la zona objetivo
El precio terminó la corrección a corto plazo y reanudó la tendencia alcista, rompiendo hacia nuevos máximos históricos.
Actualmente muestra 3 ondas hacia nuevos máximos, con más alza aún esperada.
El precio está entrando en la zona objetivo en $1,363–$1,466 y se espera que complete un avance de 5 ondas antes de que ocurra el próximo retroceso.
¿Hasta qué nivel llegará ZEC antes del próximo retroceso?
#ElliottWave #Trading #Crypto
El precio terminó la corrección a corto plazo y reanudó la tendencia alcista, rompiendo hacia nuevos máximos históricos.
Actualmente muestra 3 ondas hacia nuevos máximos, con más alza aún esperada.
El precio está entrando en la zona objetivo en $1,363–$1,466 y se espera que complete un avance de 5 ondas antes de que ocurra el próximo retroceso.
¿Hasta qué nivel llegará ZEC antes del próximo retroceso?
#ElliottWave #Trading #Crypto
64
📊 $VIRTUAL – Buscando un rebote
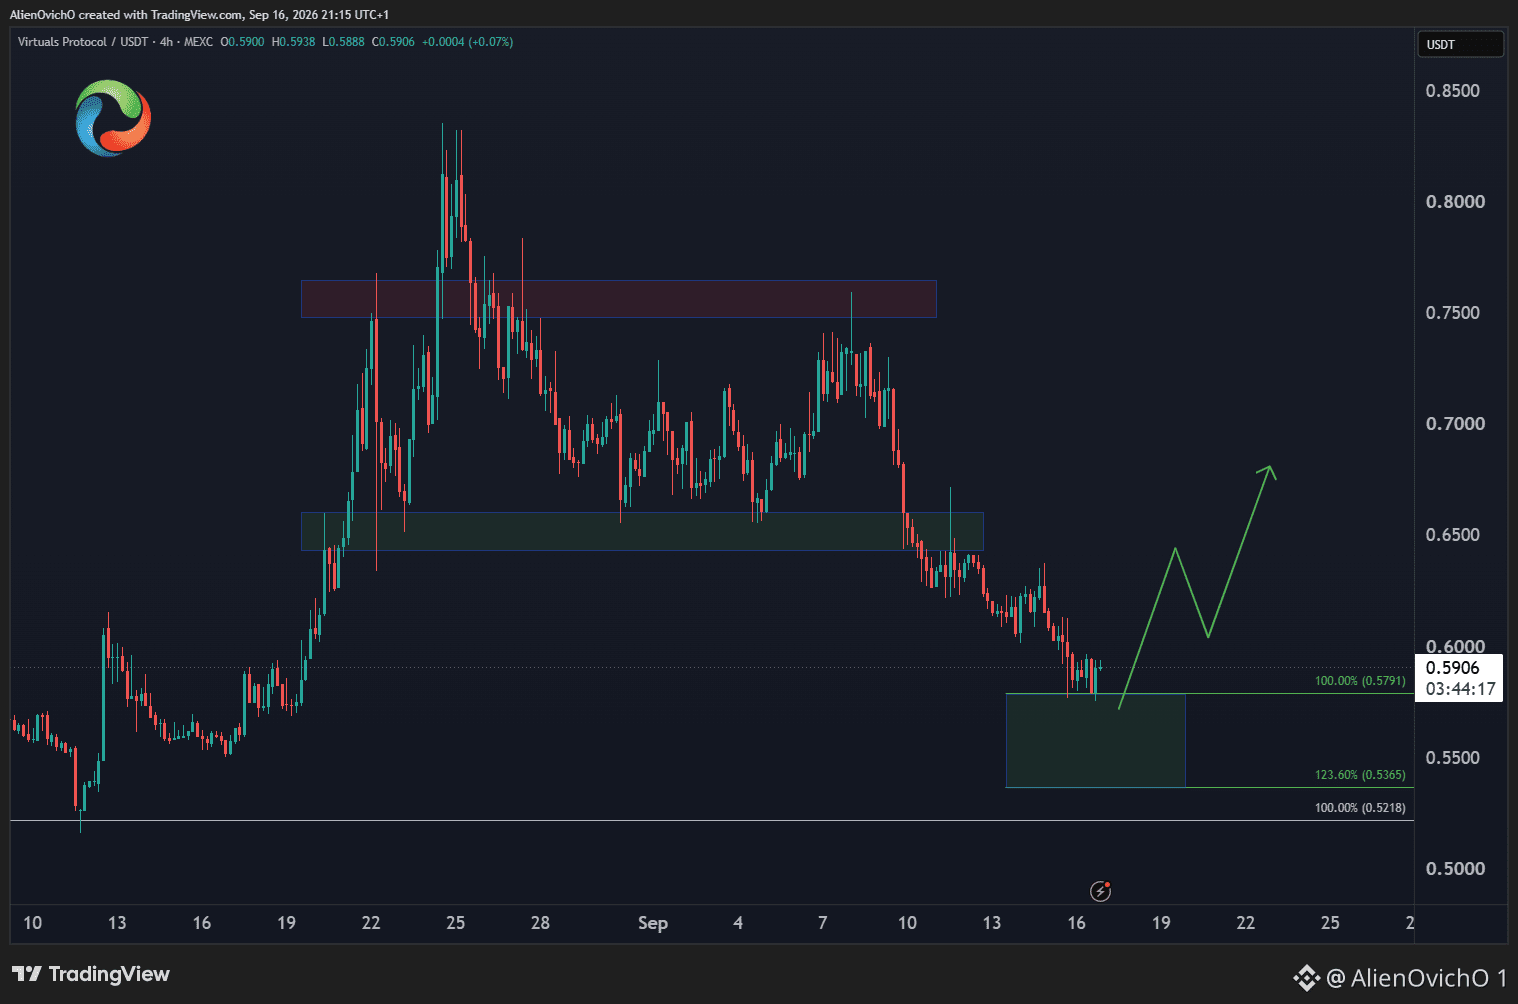
La semana pasada, el precio fue rechazado por el área de resistencia en $0.75 y se volvió a la baja, rompiendo el soporte previo en una doble corrección.
La estructura actual desde el máximo está mostrando una caída en 3 impulsos más amplia, que ha alcanzado el área objetivo de $0.58 – $0.53.
Se espera que los compradores entren dentro de este rango a corto plazo, buscando que ocurra una reacción al alza al menos dentro de un rebote de 3 ondas.
¿Los toros sostendrán el mínimo de agosto y comenzarán un nuevo ciclo al alza?
#Crypto #Trading #ElliottWave
📊 $VIRTUAL – Buscando un rebote
La semana pasada, el precio fue rechazado por el área de resistencia en $0.75 y se volvió a la baja, rompiendo el soporte previo en una doble corrección.
La estructura actual desde el máximo está mostrando una caída en 3 impulsos más amplia, que ha alcanzado el área objetivo de $0.58 – $0.53.
Se espera que los compradores entren dentro de este rango a corto plazo, buscando que ocurra una reacción al alza al menos dentro de un rebote de 3 ondas.
¿Los toros sostendrán el mínimo de agosto y comenzarán un nuevo ciclo al alza?
#Crypto #Trading #ElliottWave
La semana pasada, el precio fue rechazado por el área de resistencia en $0.75 y se volvió a la baja, rompiendo el soporte previo en una doble corrección.
La estructura actual desde el máximo está mostrando una caída en 3 impulsos más amplia, que ha alcanzado el área objetivo de $0.58 – $0.53.
Se espera que los compradores entren dentro de este rango a corto plazo, buscando que ocurra una reacción al alza al menos dentro de un rebote de 3 ondas.
¿Los toros sostendrán el mínimo de agosto y comenzarán un nuevo ciclo al alza?
#Crypto #Trading #ElliottWave
86
🚨 #Polkadot $DOT Rebotando alrededor de la esquina
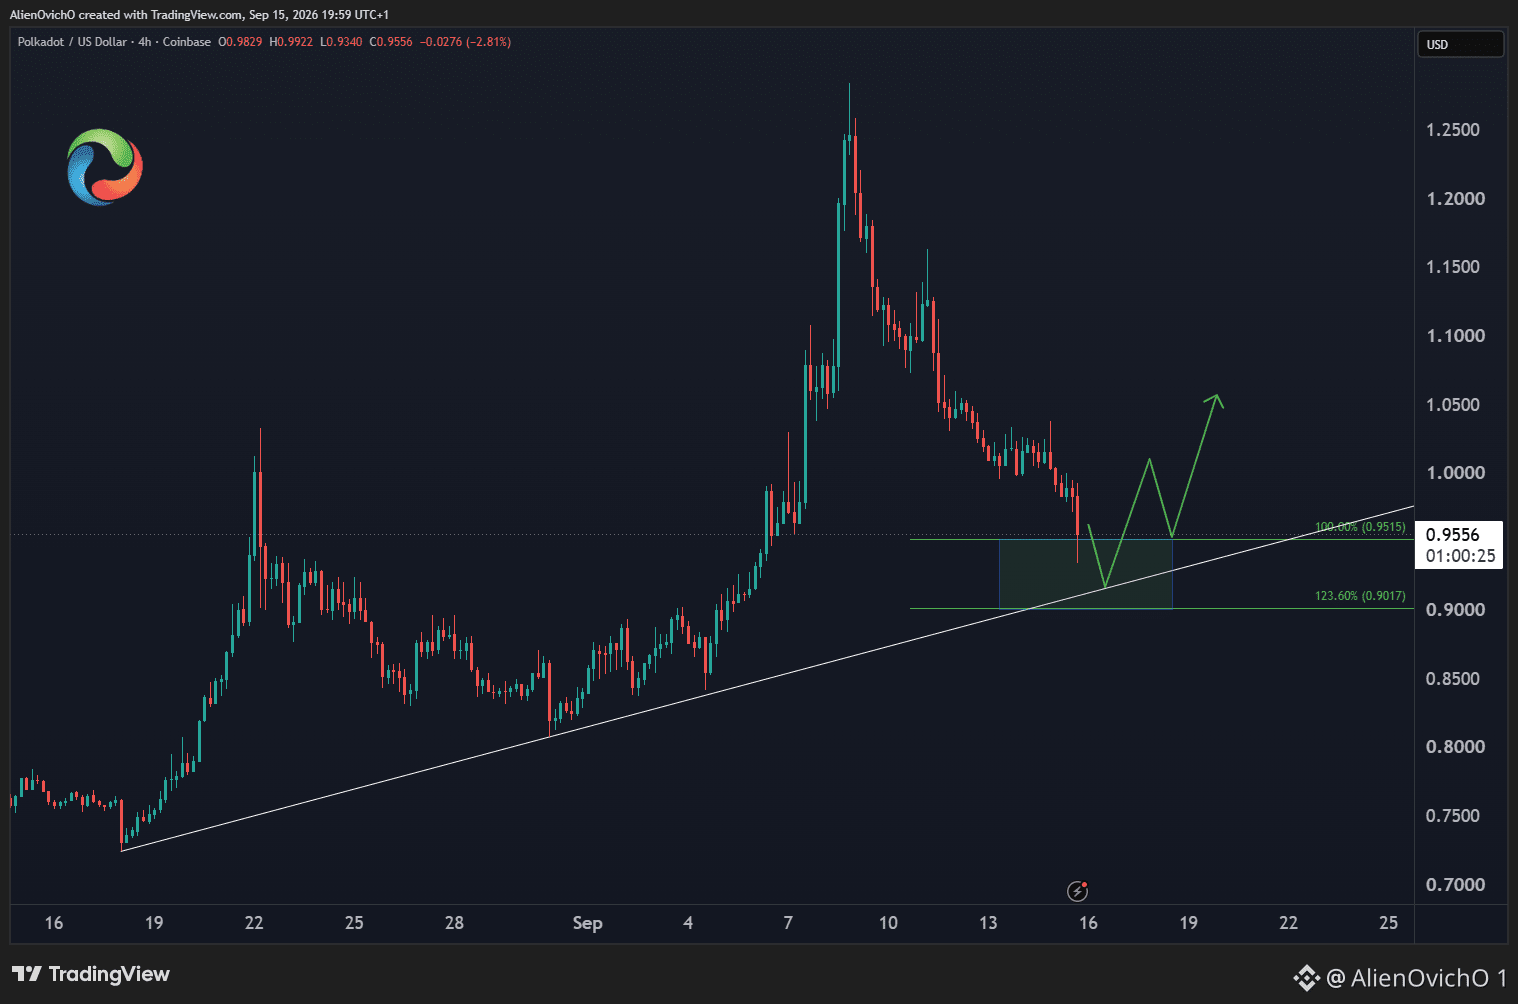
La caída desde el máximo de septiembre se está acercando a la línea de tendencia desde el mínimo de agosto, lo que debería brindar soporte a corto plazo.
También está dentro de un área de igual piernas en $0.95 – $0.90, llegando en 3 impulsos desde el pico.
Se espera que esta zona cree al menos un rebote de 3 ondas dentro de los ciclos a corto plazo.
¿El rebote fallará y se producirá una corrección más profunda para el resto del mes?
#Crypto #Trading #ElliottWave
🚨 #Polkadot $DOT Rebotando alrededor de la esquina
La caída desde el máximo de septiembre se está acercando a la línea de tendencia desde el mínimo de agosto, lo que debería brindar soporte a corto plazo.
También está dentro de un área de igual piernas en $0.95 – $0.90, llegando en 3 impulsos desde el pico.
Se espera que esta zona cree al menos un rebote de 3 ondas dentro de los ciclos a corto plazo.
¿El rebote fallará y se producirá una corrección más profunda para el resto del mes?
#Crypto #Trading #ElliottWave
La caída desde el máximo de septiembre se está acercando a la línea de tendencia desde el mínimo de agosto, lo que debería brindar soporte a corto plazo.
También está dentro de un área de igual piernas en $0.95 – $0.90, llegando en 3 impulsos desde el pico.
Se espera que esta zona cree al menos un rebote de 3 ondas dentro de los ciclos a corto plazo.
¿El rebote fallará y se producirá una corrección más profunda para el resto del mes?
#Crypto #Trading #ElliottWave
62
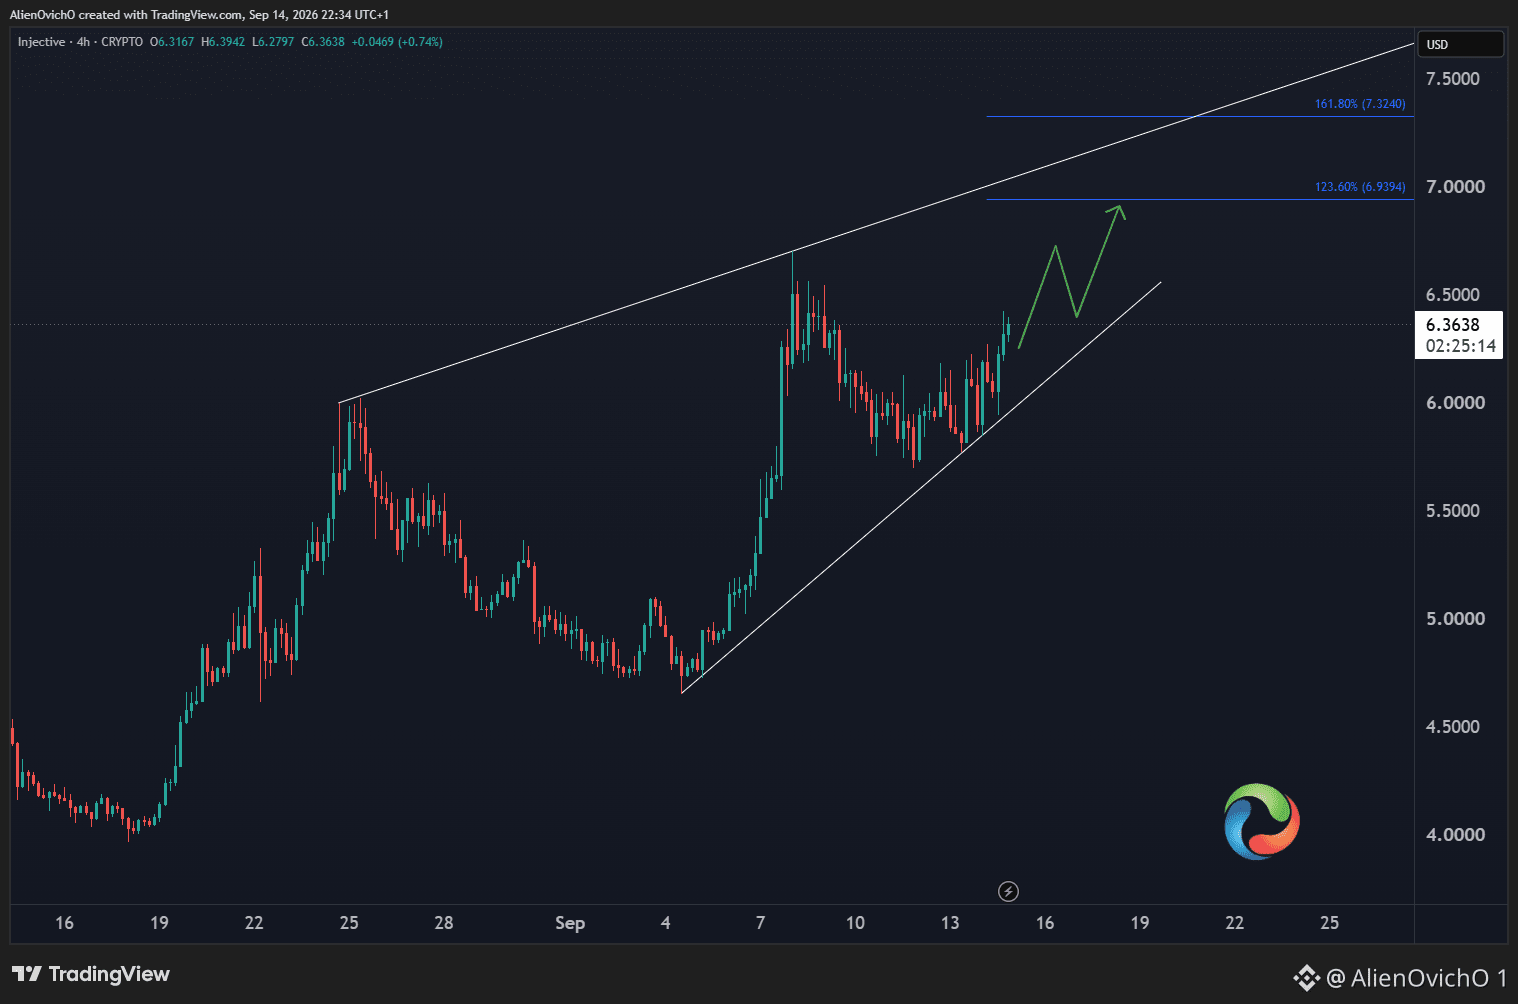
📈 #Injective $INJ Buscando nuevos máximos
El rally desde el mínimo de agosto sigue en marcha, mostrando 3 ondas al alza, con el retroceso de la 4.ª onda completado y aún posible una 5.ª onda más alta.
Actualmente, mientras el precio se mantenga por encima de $5.70, se espera otro movimiento alcista.
El impulso alcista podría alcanzar la zona objetivo de $6.93 – $7.32 antes de que tenga lugar otro retroceso.
¿Podrán los alcistas romper por encima del máximo de junio, cerca de $7.30, y crear un nuevo máximo diario más alto?
#Crypto #Trading #ElliottWave
📈 #Injective $INJ Buscando nuevos máximos
El rally desde el mínimo de agosto sigue en marcha, mostrando 3 ondas al alza, con el retroceso de la 4.ª onda completado y aún posible una 5.ª onda más alta.
Actualmente, mientras el precio se mantenga por encima de $5.70, se espera otro movimiento alcista.
El impulso alcista podría alcanzar la zona objetivo de $6.93 – $7.32 antes de que tenga lugar otro retroceso.
¿Podrán los alcistas romper por encima del máximo de junio, cerca de $7.30, y crear un nuevo máximo diario más alto?
#Crypto #Trading #ElliottWave
El rally desde el mínimo de agosto sigue en marcha, mostrando 3 ondas al alza, con el retroceso de la 4.ª onda completado y aún posible una 5.ª onda más alta.
Actualmente, mientras el precio se mantenga por encima de $5.70, se espera otro movimiento alcista.
El impulso alcista podría alcanzar la zona objetivo de $6.93 – $7.32 antes de que tenga lugar otro retroceso.
¿Podrán los alcistas romper por encima del máximo de junio, cerca de $7.30, y crear un nuevo máximo diario más alto?
#Crypto #Trading #ElliottWave
55
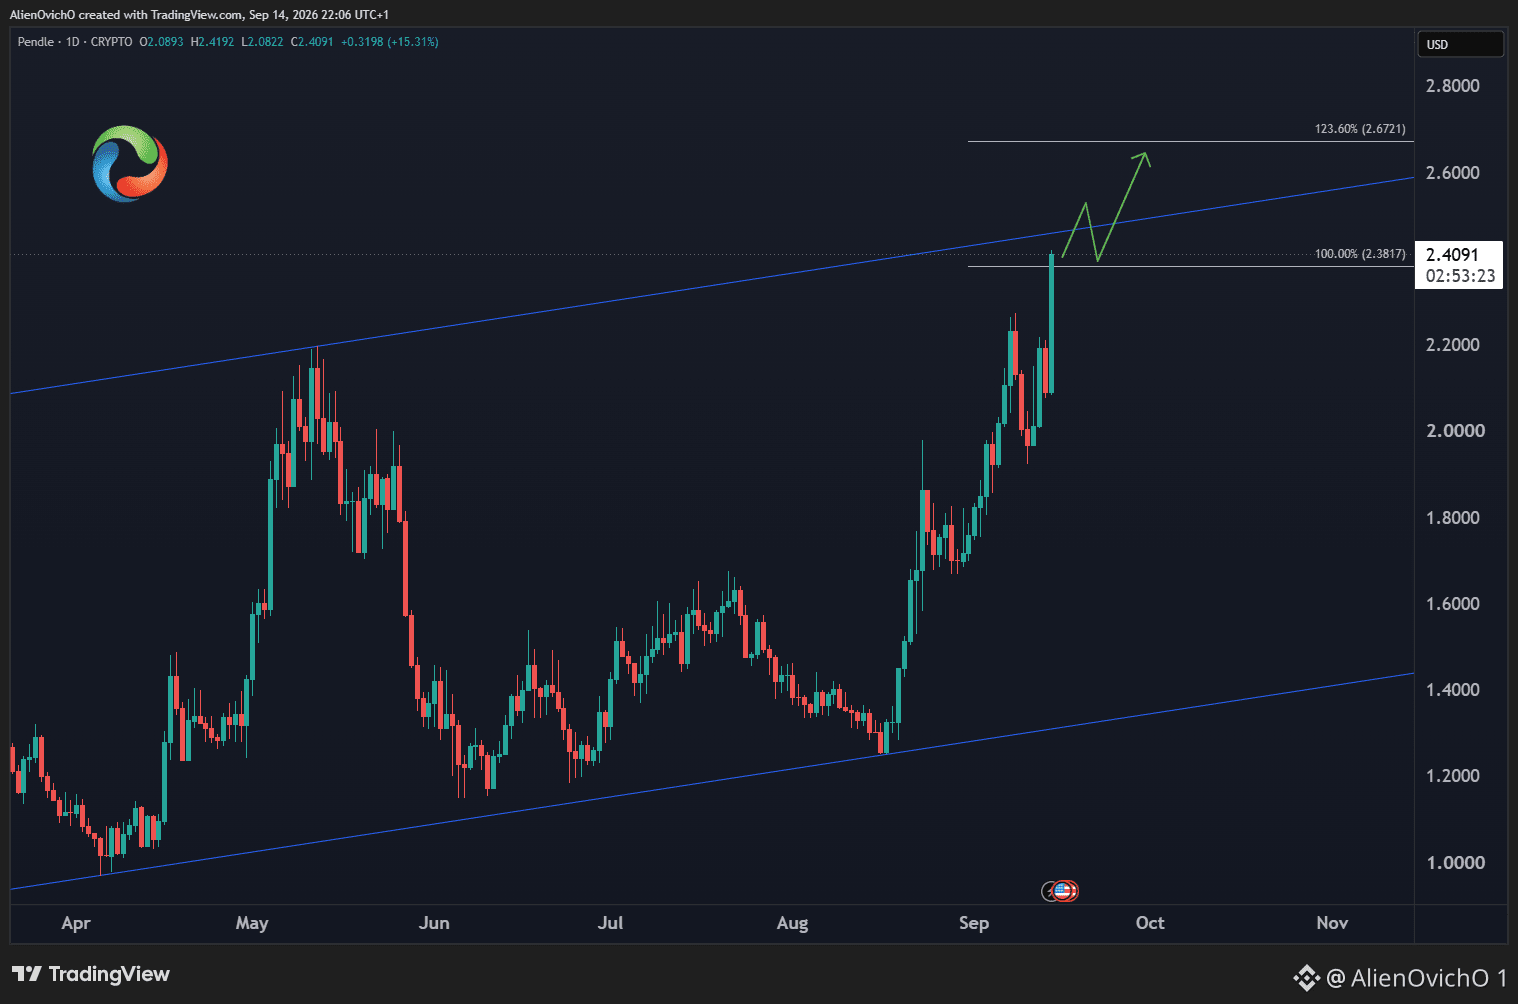
📢 $PENDLE Extendiendo Alturas en el Ciclo Diario
La acción del precio sigue empujando hacia arriba, mostrando fortaleza dentro de la estructura alcista más amplia.
Todavía mantiene el canal alcista desde el mínimo de abril y ahora amenaza con romper su límite superior.
⚡ El rally ha llegado a la zona de piernas iguales en $2.38–$2.67. Es posible que una toma de beneficios aquí genere volatilidad en las próximas semanas.
A pesar de los altibajos a corto plazo, la estructura general sigue siendo constructiva para un mayor potencial alcista mientras el precio se mantenga por encima de $2.
💡 ¿Se convertirá $PENDLE en una moneda líder en este nuevo ciclo? Los traders están observando de cerca.
#ElliottWave #Trading #Crypto
📢 $PENDLE Extendiendo Alturas en el Ciclo Diario
La acción del precio sigue empujando hacia arriba, mostrando fortaleza dentro de la estructura alcista más amplia.
Todavía mantiene el canal alcista desde el mínimo de abril y ahora amenaza con romper su límite superior.
⚡ El rally ha llegado a la zona de piernas iguales en $2.38–$2.67. Es posible que una toma de beneficios aquí genere volatilidad en las próximas semanas.
A pesar de los altibajos a corto plazo, la estructura general sigue siendo constructiva para un mayor potencial alcista mientras el precio se mantenga por encima de $2.
💡 ¿Se convertirá $PENDLE en una moneda líder en este nuevo ciclo? Los traders están observando de cerca.
#ElliottWave #Trading #Crypto
La acción del precio sigue empujando hacia arriba, mostrando fortaleza dentro de la estructura alcista más amplia.
Todavía mantiene el canal alcista desde el mínimo de abril y ahora amenaza con romper su límite superior.
⚡ El rally ha llegado a la zona de piernas iguales en $2.38–$2.67. Es posible que una toma de beneficios aquí genere volatilidad en las próximas semanas.
A pesar de los altibajos a corto plazo, la estructura general sigue siendo constructiva para un mayor potencial alcista mientras el precio se mantenga por encima de $2.
💡 ¿Se convertirá $PENDLE en una moneda líder en este nuevo ciclo? Los traders están observando de cerca.
#ElliottWave #Trading #Crypto
51
📈 #Zcash $ZEC Alcance alcista a corto plazo
El precio terminó la corrección a corto plazo y vuelve a girar al alza para reanudar la tendencia alcista.
Podría extenderse hacia nuevos máximos y buscar nuevos objetivos en $1,355 – $1,449 antes de que ocurra la siguiente corrección.
Mientras la corrección a corto plazo se mantenga respaldada por encima de $1,055, los alcistas siguen teniendo el control.
¿Los alcistas lo llevarán por encima de $1,500 antes de que termine el mes, o primero ocurrirá una corrección mayor?
#Crypto #Trading #ElliottWave
📈 #Zcash $ZEC Alcance alcista a corto plazo
El precio terminó la corrección a corto plazo y vuelve a girar al alza para reanudar la tendencia alcista.
Podría extenderse hacia nuevos máximos y buscar nuevos objetivos en $1,355 – $1,449 antes de que ocurra la siguiente corrección.
Mientras la corrección a corto plazo se mantenga respaldada por encima de $1,055, los alcistas siguen teniendo el control.
¿Los alcistas lo llevarán por encima de $1,500 antes de que termine el mes, o primero ocurrirá una corrección mayor?
#Crypto #Trading #ElliottWave
El precio terminó la corrección a corto plazo y vuelve a girar al alza para reanudar la tendencia alcista.
Podría extenderse hacia nuevos máximos y buscar nuevos objetivos en $1,355 – $1,449 antes de que ocurra la siguiente corrección.
Mientras la corrección a corto plazo se mantenga respaldada por encima de $1,055, los alcistas siguen teniendo el control.
¿Los alcistas lo llevarán por encima de $1,500 antes de que termine el mes, o primero ocurrirá una corrección mayor?
#Crypto #Trading #ElliottWave

45
📈 #Cardano $ADA Rebote a corto plazo
Mientras el precio se mantenga respaldado por encima del reciente mínimo de agosto en $0.189, los alcistas seguirán empujando hacia arriba.
A corto plazo, el precio podría volver a probar el área de resistencia reciente alrededor de $0.225 antes de que ocurra el siguiente retroceso.
Una vez que logre romper por encima del máximo de septiembre, se abrirá otra etapa al alza.
La próxima extensión alcista apuntará al área de igual-legs en $0.24 – $0.25.
#Crypto #Trading #ElliottWave
📈 #Cardano $ADA Rebote a corto plazo
Mientras el precio se mantenga respaldado por encima del reciente mínimo de agosto en $0.189, los alcistas seguirán empujando hacia arriba.
A corto plazo, el precio podría volver a probar el área de resistencia reciente alrededor de $0.225 antes de que ocurra el siguiente retroceso.
Una vez que logre romper por encima del máximo de septiembre, se abrirá otra etapa al alza.
La próxima extensión alcista apuntará al área de igual-legs en $0.24 – $0.25.
#Crypto #Trading #ElliottWave
Mientras el precio se mantenga respaldado por encima del reciente mínimo de agosto en $0.189, los alcistas seguirán empujando hacia arriba.
A corto plazo, el precio podría volver a probar el área de resistencia reciente alrededor de $0.225 antes de que ocurra el siguiente retroceso.
Una vez que logre romper por encima del máximo de septiembre, se abrirá otra etapa al alza.
La próxima extensión alcista apuntará al área de igual-legs en $0.24 – $0.25.
#Crypto #Trading #ElliottWave

53
$NEAR – Buscando otro objetivo al alza
El rally desde el mínimo de agosto sigue en curso mientras el precio entra en la zona objetivo.
En el corto plazo, aún podría buscar otro impulso hacia arriba hacia la Proporción Áurea en $2.70 antes de que ocurra una corrección.
Se espera que la acción general del precio se mantenga respaldada durante cualquier retroceso, ya que el ciclo diario apunta a una ruptura por encima del máximo de junio.
¿Lograrán los toros romper por encima de $3 en las próximas semanas?
#Crypto #Trading #ElliottWave
$NEAR – Buscando otro objetivo al alza
El rally desde el mínimo de agosto sigue en curso mientras el precio entra en la zona objetivo.
En el corto plazo, aún podría buscar otro impulso hacia arriba hacia la Proporción Áurea en $2.70 antes de que ocurra una corrección.
Se espera que la acción general del precio se mantenga respaldada durante cualquier retroceso, ya que el ciclo diario apunta a una ruptura por encima del máximo de junio.
¿Lograrán los toros romper por encima de $3 en las próximas semanas?
#Crypto #Trading #ElliottWave
El rally desde el mínimo de agosto sigue en curso mientras el precio entra en la zona objetivo.
En el corto plazo, aún podría buscar otro impulso hacia arriba hacia la Proporción Áurea en $2.70 antes de que ocurra una corrección.
Se espera que la acción general del precio se mantenga respaldada durante cualquier retroceso, ya que el ciclo diario apunta a una ruptura por encima del máximo de junio.
¿Lograrán los toros romper por encima de $3 en las próximas semanas?
#Crypto #Trading #ElliottWave

65
📈 $SUI Rebote cerca de la esquina
El rally de finales de agosto terminó cuando el precio rompió la línea de tendencia y comenzó un retroceso correctivo.
Actualmente muestra 3 swings a la baja desde el pico y ha entrado en la zona extrema en $0.78–$0.75, donde es probable que ocurra una reacción al alza.
Los alcistas buscan reanudar el rally hacia nuevos máximos desde aquí, pero al menos primero debería verse un rebote de 3 ondas.
¿Los alcistas volverán a tomar el control, o se desarrollará una doble corrección antes de fin de mes?
#ElliottWave #Trading #Crypto
📈 $SUI Rebote cerca de la esquina
El rally de finales de agosto terminó cuando el precio rompió la línea de tendencia y comenzó un retroceso correctivo.
Actualmente muestra 3 swings a la baja desde el pico y ha entrado en la zona extrema en $0.78–$0.75, donde es probable que ocurra una reacción al alza.
Los alcistas buscan reanudar el rally hacia nuevos máximos desde aquí, pero al menos primero debería verse un rebote de 3 ondas.
¿Los alcistas volverán a tomar el control, o se desarrollará una doble corrección antes de fin de mes?
#ElliottWave #Trading #Crypto
El rally de finales de agosto terminó cuando el precio rompió la línea de tendencia y comenzó un retroceso correctivo.
Actualmente muestra 3 swings a la baja desde el pico y ha entrado en la zona extrema en $0.78–$0.75, donde es probable que ocurra una reacción al alza.
Los alcistas buscan reanudar el rally hacia nuevos máximos desde aquí, pero al menos primero debería verse un rebote de 3 ondas.
¿Los alcistas volverán a tomar el control, o se desarrollará una doble corrección antes de fin de mes?
#ElliottWave #Trading #Crypto

120
🚨 #ETHBTC ¡Buscando Romper la Tendencia Bajista!!
La relación vuelve a estar probando la tendencia bajista semanal, lo que podría llevar a una ruptura fuerte con #Ethereum superando a #Bitcoin.
Una vez que ocurra el movimiento al alza, el precio inicialmente apuntará al máximo de 2025 alrededor de 0.04.
El área de “piernas iguales” desde los mínimos aún podría llevar la relación más arriba hacia 0.051 – 0.057 el próximo año.
¿$ETH superará a $BTC durante el resto de este nuevo mercado alcista, o solo es un señuelo?
#Crypto #Trading #ElliottWave
🚨 #ETHBTC ¡Buscando Romper la Tendencia Bajista!!
La relación vuelve a estar probando la tendencia bajista semanal, lo que podría llevar a una ruptura fuerte con #Ethereum superando a #Bitcoin.
Una vez que ocurra el movimiento al alza, el precio inicialmente apuntará al máximo de 2025 alrededor de 0.04.
El área de “piernas iguales” desde los mínimos aún podría llevar la relación más arriba hacia 0.051 – 0.057 el próximo año.
¿$ETH superará a $BTC durante el resto de este nuevo mercado alcista, o solo es un señuelo?
#Crypto #Trading #ElliottWave
La relación vuelve a estar probando la tendencia bajista semanal, lo que podría llevar a una ruptura fuerte con #Ethereum superando a #Bitcoin.
Una vez que ocurra el movimiento al alza, el precio inicialmente apuntará al máximo de 2025 alrededor de 0.04.
El área de “piernas iguales” desde los mínimos aún podría llevar la relación más arriba hacia 0.051 – 0.057 el próximo año.
¿$ETH superará a $BTC durante el resto de este nuevo mercado alcista, o solo es un señuelo?
#Crypto #Trading #ElliottWave

43
#Binance Coin $BNB – Extendiendo el camino alcista
El precio logró superar el máximo de mayo, creando una secuencia de máximos más altos y sugiriendo más recorrido al alza.
Actualmente, se espera que las correcciones a corto plazo sigan teniendo soporte por encima de $720 para que los alcistas se mantengan bajo control.
Una vez que el precio mantenga el área de soporte, se producirá otro impulso hacia arriba hasta $800.
¿Qué tan alto puede llegar $BNB este mes antes de que ocurra la próxima corrección diaria?
#Crypto #Trading #ElliottWave
#Binance Coin $BNB – Extendiendo el camino alcista
El precio logró superar el máximo de mayo, creando una secuencia de máximos más altos y sugiriendo más recorrido al alza.
Actualmente, se espera que las correcciones a corto plazo sigan teniendo soporte por encima de $720 para que los alcistas se mantengan bajo control.
Una vez que el precio mantenga el área de soporte, se producirá otro impulso hacia arriba hasta $800.
¿Qué tan alto puede llegar $BNB este mes antes de que ocurra la próxima corrección diaria?
#Crypto #Trading #ElliottWave
El precio logró superar el máximo de mayo, creando una secuencia de máximos más altos y sugiriendo más recorrido al alza.
Actualmente, se espera que las correcciones a corto plazo sigan teniendo soporte por encima de $720 para que los alcistas se mantengan bajo control.
Una vez que el precio mantenga el área de soporte, se producirá otro impulso hacia arriba hasta $800.
¿Qué tan alto puede llegar $BNB este mes antes de que ocurra la próxima corrección diaria?
#Crypto #Trading #ElliottWave

75
Inicia sesión para explorar más contenidos
Únete a usuarios de criptomonedas de todo el mundo en Binance Square
⚡️ Obtén la información más reciente y útil sobre criptomonedas.
💬 Confía en el mayor exchange de criptomonedas del mundo.
👍 Descubre opiniones reales de creadores verificados.
Correo electrónico/número de teléfono
Temas en tendencia
BitcoinClears$85200
6 visualizaciones
23 participa(n) en el debate
#BitcoinClears$85200 Bitcoin rompe una resistencia clave: BTC supera $85,200 en medio de un fuerte impulso del mercado 📊
Bitcoin ha superado oficialmente el umbral de $85,200, marcando un importante hito técnico. A continuación, desglosamos qué significa este movimiento para el mercado cripto en general.
📰 Noticias principales
• Bitcoin (BTC) ha logrado superar el nivel de resistencia de $85,200, acompañado de un volumen de operaciones notable.
• Esta acción del precio se produce después de un período de consolidación del mercado, lo que señala una reanudación de la presión compradora y un interés sostenido por parte de los participantes.
🌍 Impacto en el mercado
• 🏛️Dominancia de mercado Un movimiento decisivo de Bitcoin a menudo refuerza su dominancia en el mercado, lo que podría influir temporalmente en la liquidez de las altcoins mientras el capital rota dentro del ecosistema.
• 📈Sentimiento y Técnicos Superar importantes niveles psicológicos y técnicos de resistencia normalmente cambia el sentimiento del mercado hacia una perspectiva más constructiva, abriendo la puerta a un mayor descubrimiento de precios si el volumen se mantiene constante.
• 📊Actividad de derivados Los traders deberían anticipar una actividad más intensa en los mercados de futuros y opciones, ya que los participantes recalibran sus estrategias de gestión del riesgo y cobertura alrededor de este nuevo nivel de precios.
💬 Únete a la conversación
¿Cuál es tu perspectiva sobre el próximo gran nivel técnico de Bitcoin, o esperas un período de consolidación en estas alturas? ¡Comparte tu análisis en los comentarios a continuación! 👇
#Bitcoin #BTC #CryptoMarket #MarketAnalysis #BinanceSquare
Esto es solo con fines educativos. No es asesoramiento financiero (NFA). Haz siempre tu propia investigación (DYOR).
$ARK $MOVR $GLMR
珍妮丝 kgf
·1 «Me gusta»
·14 visualizaciones
AltcoinSeasonIndexHoldsAbove60For5Days
1,182 visualizaciones
209 participa(n) en el debate
BitcoinSlipsBelow$84000
1,002 visualizaciones
60 participa(n) en el debate